

Evaluation of the effects of otolith sampling strategies and ageing error on estimation of the age composition and growth curve for Pacific bluefin tuna Thunnus orientalis
Yi-Jay Chang A B D , Jhen Hsu A , Jen-Chieh Shiao A B and Shui-Kai Chang C
A Institute of Oceanography, National Taiwan University, Number 1, Section 4, Roosevelt Road, Taipei 10617, Taiwan.
B Institute of Fisheries Science, National Taiwan University, Number 1, Section 4, Roosevelt Road, Taipei 10617, Taiwan.
C Institute of Marine Affairs, National Sun Yat-sen University, 70 Lienhai Road, Kaohsiung 80424, Taiwan.
D Corresponding author. Email: yjchang@ntu.edu.tw
Marine and Freshwater Research 70(12) 1838-1849 https://doi.org/10.1071/MF18241
Submitted: 4 July 2018 Accepted: 13 April 2019 Published: 8 July 2019
Journal Compilation © CSIRO 2019 Open Access CC BY-NC-ND
Abstract
The age composition of the catch and the growth curve of a stock are fundamentally important in fish stock assessment, but these estimates are subject to various sources of uncertainty. Using the Pacific bluefin tuna (Thunnus orientalis) fisheries in the waters off Taiwan as an example, we developed a Monte Carlo simulation model to evaluate the effects of four otolith sampling methods (random otolith sampling, ROS; fixed otolith sampling, FOS; proportional otolith sampling, POS; and reweighting otolith sampling, REW), and ageing error (bias and imprecision) on estimations of age composition and growth curves. The results indicated that FOS has the lowest sampling accuracy, POS performs the best and that ROS is a more efficient method with lower estimation error. For an imprecise reader, the centre (median) of multiple age reads is a useful method to obtain accurate and precise estimates. Ageing bias had greater effects on the estimation of age composition and growth parameters than ageing imprecision or the selection of otolith sampling methods. In most cases, 500 otoliths should be an adequate sample size and could be the guideline for the biological sampling program of the T. orientalis Catch Documentation Scheme.
Additional keywords: age–length key, sampling methods.
Introduction
Catch-at-age composition and the growth curve (e.g. von Bertalanffy growth function (VBGF); von Bertalanffy 1938) have fundamental roles in fish stock assessment. Conventional stock assessment models used to assess the status of fish stocks rely on the collection of accurate age composition data and growth parameters (Francis 2016). Age and growth studies are also important in describing the basic biology and ecology of fishes (Summerfelt and Hall 1987). Fish age is most commonly estimated from counts of increments in sectioned otoliths (Campana 2001), but the preparation of otoliths for age estimation can be time consuming and costly, and interpretation of otolith increments requires appropriate skills and experience (Committee of Age Reading Experts 2000). Consequently, an age–length key (ALK; Ricker 1975), consisting of the proportions at age for each length class from a subsample of fish whose individual lengths have been measured and ages have been estimated directly, usually by examination of annual rings on otoliths or other calcified bony structures, is needed. The ALK is then used to calibrate age–length population structure or to assign ages to unaged fish in the total length sample to convert catch-at-size into catch-at-age (i.e. age composition) data.
Two otolith sampling approaches, namely random sampling and length-stratified sampling, have been used to estimate the age composition of catches. For the former approach, otolith samples are randomly sampled from the catch and used to construct the age composition (i.e. random otolith sampling, ROS; Kimura 1977). For length-stratified sampling, fish are first divided into different length groups with small length intervals (e.g. 5 or 10 cm). Then, either a fixed number of otolith samples (i.e. fixed-otolith sampling, FOS) or various numbers of otolith samples proportional to length frequency (i.e. proportional-otolith sampling, POS) are collected randomly from within each length interval. A length-stratified sampling approach ensures that a wide range of fish sizes is represented in a small age sample.
Past studies have found that the FOS may be more cost-effective and efficient than ROS (Mackett 1963; Sen 1986). Kimura (1977) showed that POS is superior to FOS for estimating age composition. Studies have suggested that FOS produces biased estimates of mean length-at-age, tending to overestimate the asymptotic length for long-lived fish, whereas ROS produces unbiased estimates (Goodyear 1995; Chih 2009a; Coggins et al. 2013). Chih (2009a) proposed a reweighting sampling method (REW) in addition to the ROS, FOS and POS methods. The REW is similar to FOS and POS in that otolith samples are randomly selected from predetermined length intervals, but the REW has larger sampling intervals and reweights the estimated age–frequency distribution with the length–frequency distribution. Chih (2009a) suggested that the REW provided slightly better precision than estimates derived from ROS and FOS, with more flexibility in sampling design.
Most previous studies have evaluated the performance of otolith sampling methods to represent the actual age composition of the stock or catch and the growth parameter estimates. Although many such analyses assume that fish ages are measured without error, this assumption is rarely met (Richards et al. 1992). Errors in interpreting and counting growth increments can be related to the initial otolith preparation for reading (Neilson 1992). Otoliths can also exhibit irregular or indiscernible rings that result in some increments being uncounted or counted multiple times. Ageing precision also appears to differ between inexperienced and more experienced readers (Wakefield et al. 2017). Ageing error in stock assessment models can lead to errors in modelling results (Kimura 1990). Reeves (2003) found that total allowable catch of the eastern Baltic cod derived from the International Council for the Exploration of the Sea (ICES)-defined harvest control rule was too optimistic in the presence of the age reading error. However, Richards et al. (1992) presented a way to account for ageing error from multiple age reads when developing age compositions. Coggins et al. (2013) developed a stochastic simulation with ageing error to evaluate the sample size requirement for using an ALK to estimate growth parameters and the instantaneous rate of total mortality (Z). However, none of these studies has accounted for ageing error when evaluating the effects of otolith sampling methods on the precision of age composition and growth curves.
The Pacific bluefin tuna (PBF) Thunnus orientalis, one of the most valuable fish in the world, is exploited by many countries (Collette and Nauen 1983). The current stock biomass is estimated to be near the lowest historical level (International Scientific Committee for Tuna and Tuna-like Species in the North Pacific Ocean 2016). Taiwanese offshore longline fisheries target sexually mature adults in the spawning grounds of the north-western Pacific Ocean during late April–early July (Chen et al. 2006). The PBF catch has declined from 3000 tonnes (Mg) in 1999 to ~200–500 Mg in recent years (Chang et al. 2017), which caused the Overseas Fisheries Development Council of the Republic of China to implement a PBF Catch Documentation Scheme in 2010 that has monitored the PBF catch ever since (Shiao et al. 2017). The data collected for the PBF Catch Documentation Scheme include the ship’s name, the location and date of fishing and the size, sex and storage conditions (frozen or refrigerated) for each PBF caught. Otoliths were also collected from some of the catches based on the random sampling method to estimate the growth rate and construct the age composition of the catch (Shiao et al. 2017). Ages of PBF have been estimated by counting the number of opaque zones in otolith thin sections (Shimose et al. 2009; Shiao et al. 2017). However, the current otolith sampling method and sample size for the total number of fish collected are not derived from any consideration of sampling design or life history process. Furthermore, the opaque zones formed when the fish are younger than 10 years of age are indistinct and difficult to interpret (see Fig. 1). Therefore, age determination of PBF is subject to the uncertainty of ageing error.

|
In this study, a simulation model was developed based on the length-at-age matrix of PBF caught in the waters off Taiwan using data from the Catch Documentation Scheme. The first objective of the study was to evaluate the efficiency of the four otolith sampling methods (i.e. ROS, FOS, POS and REW) when samples were selected directly from a simulated catch. The accuracy and precision of age composition and VBGF parameters for PBF samples obtained with these four sampling methods were evaluated. The second objective of the study was to examine the efficiency of the four sampling methods when ageing error from multiple age reads uncertainty was included. Furthermore, the first read and the median age of multiple reads were compared. A third objective of the study was to evaluate the effect of sample size on estimations of age composition and VBGF parameters using various otolith sampling methods and with ageing error uncertainty. The overall purpose of this research was to provide guidelines for the otolith sampling strategy and minimum PBF otolith sample sizes to be used by the Catch Documentation Scheme.
Materials and methods
Input data of the simulation model
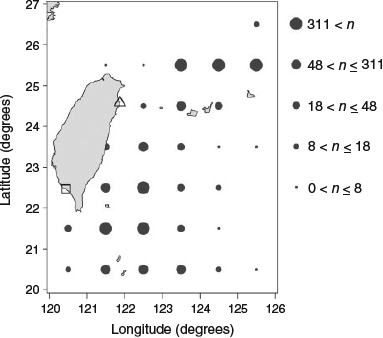
The simulation model used in this study was based on PBF catch data collected by the Catch Documentation Scheme of the Overseas Fisheries Development Council of the Republic of China during 2011–15. The data included year, fishing location (longitude and latitude), fork length (FL; cm) and sex (determined by gonad examination after dissection). Sampling was conducted at two primary landing sites (Tungkang in south-western Taiwan and Nanfangao in north-eastern Taiwan), although some fish were also landed at Xingang in eastern Taiwan (Fig. 2). Almost all the landings since 2011 have been measured in keeping with the Catch Documentation Scheme. In recent years, the maximum number of PBF otoliths has been sampled randomly; the otolith samples comprised 18–24% of total landings during 2011–14, increasing to 39% in 2015. In total, 1719 PBF were sampled for otoliths with 168, 166, 239, 319 and 827 otoliths collected in 2011, 2012, 2013, 2014 and 2015 respectively.
|
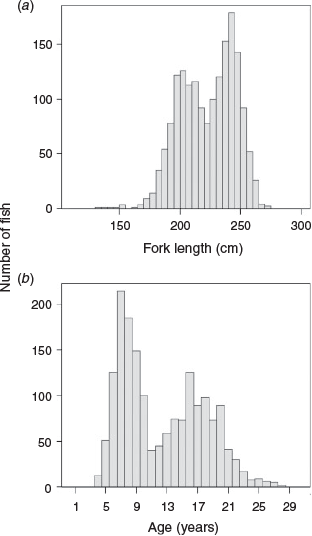
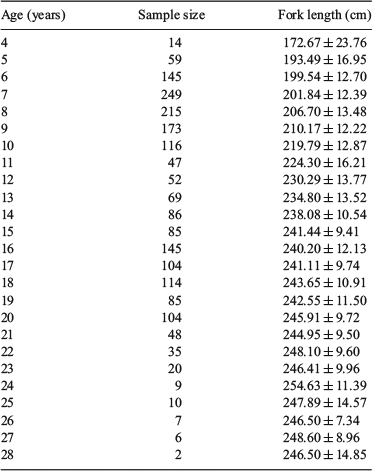
The size composition of the PBF sampled for otoliths is shown in Fig. 3a. The FL of the 1719 PBF sampled for otoliths ranged from 134 to 275 cm. Ageing PBF samples based on otolith readings followed Shimose and Ishihara (2015) and Shiao et al. (2017), which were supported by the bomb radiocarbon dating reported by Ishihara et al. (2017). Ages ranged from 4 to 28 years and formed three major age groups (6–10, 12–15 and 16–20 years; Fig. 3b). Rather than subsampling directly from the original otolith samples, we assumed the ‘observed’ length-at-age a for the ith individual in the sample (La,i) was normally distributed with mean length μa and standard deviation σa (i.e. La,i ~ N(µa,σa2)). The number of simulated individuals was based on the averaged total catch number during 2011–15 (~2000 fish) and the age proportion of the original otolith samples. The mean length, standard deviation and number of individuals for each age of the simulation model are given in Table 1. The purpose of this model was to provide a dataset with PBF age–length relationships similar to those of the Taiwanese offshore longline fisheries to allow comparisons of age compositions from otolith samples collected by various sampling methods. In addition, the catch-at-age data covered a wide range (4–28 years), which allowed comparisons of the growth parameters and growth curves of the PBF population under various simulation scenarios.
|
|
Otolith sampling methods
Otolith data were generated by simulating an age-structured catch from which to sample. For ROS, otolith samples are randomly sampled from the catch and used to construct the ALK. For FOS, fish are first divided into 10 length groups (by 10-cm intervals): <180, 180–260 and >260 cm FL. A fixed number of otolith samples is then collected randomly from within each length interval to estimate the ALK. For POS, the ALK is estimated by sampling fish in proportion to the length frequency of the catch in each length bin. In this study, various total sample sizes (i.e. n = 100, 200, 300, 400, 500 and 1000) were randomly resampled without replacement from the simulated dataset. For the REW, samples were resampled randomly within each of five sampling intervals separated by the 20th percentile (200 cm), 40th percentile (220 cm), 60th percentile (235 cm) and 80th percentile (245 cm) of the original simulated data. Equal numbers of otolith samples were randomly selected from each sampling interval. For example, if the total otolith sample size was 100, then 20 otolith samples were selected from each of the five length intervals. Length–age frequency tables constructed from these otolith samples were then weighted by the length–frequency distribution of the original data (Chih 2009a). Note that the reweighting length interval is different from the sampling length interval. For each otolith sampling method, the proportion of age j in the catch (Pj) was estimated as follows (Ogle 2015):
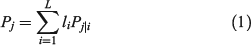
where li is equal to the proportion of fish in the ith length interval in the catch and Pj|i is conditional probability that a fish in the ith length interval is age j in the otolith sample (i.e. ALK).
Ageing error
The simulation used multiple reader types to generate a suite of ageing error distributions to be compared objectively (Table 2). If ai is the observed age, bi is the true age, c is the constant bias of the inaccurate reader, σi is the standard deviation of the age-reading error (σi = bi × CVi′, where CVi′ is a randomly sampled CV from the observed CVs) for each individual i, a relationship between the jth observed age reading and true age for individual i of the five reader types (i.e. Readers-I to -V) was described as follows (Coggins and Quinn 1998; Cope and Punt 2007): Reader-I is a perfect reader without ageing error (aij = bi); Reader-II is accurate (no bias), but slightly imprecise (low variability) (aij ~ N(bi,σi)); Reader-III is inaccurate and slightly imprecise (aij ~ N(bi + c,σi)); Reader-IV is accurate but moderately imprecise (aij ~ N(bi,2σi)); and Reader-V is inaccurate and extra imprecise (aij ~ N(bi + c,3σi)).

|
The opaque zones formed when PBF are younger than 10 years of age are indistinct and difficult to interpret (Shimose et al. 2009; Shiao et al. 2017), so we used a positive constant bias of 2 years for the inaccurate readers (greater potential for counting false annuli; Ishihara et al. 2017; J. Hsu, unpubl. data). Ageing imprecision was calibrated by having an experienced reader read the otoliths twice from a computerised image without reference to fish size information, using 827 otoliths in 2015. The CVs of ageing errors ranged from 0 to 85% (see Fig. S1, available as Supplementary material to this paper) and were randomly sampled for individual i for the imprecise readers (Readers-II to -V).
When multiple reads are available for individuals, two approaches are typically used to obtain the one age read per individual: (1) the first age reader is established; and (2) the median of multiple reads is used to decrease the influence of outliers (Cope and Punt 2007). In the present study, the first read and the median age of multiple reads (three age reads) were compared for each of the sampling methods.
VBGF estimation
Growth data from the various otolith sampling methods and reader types were fit using the VBGF with maximum likelihood method:
where Li is the length-at-age for the ith individual, L∞ is the asymptotic length, K is the Brody growth coefficient, t0 is the hypothetical length-at-age 0, which was fixed at –3.2 years based on the estimate of original otolith data, ai is the observed age for the ith individual and error ϵi is assumed to be independent and normally distributed with mean of 0 and variance of σL2.
Error measurement
The accuracy and precision of estimated age–frequency distributions and growth were evaluated by simulation analyses using 216 combination scenarios generated from four otolith sampling methods (ROS, FOS, POS and REW), six sample sizes of otoliths (n = 100, 200, 300, 400, 500 and 1000), five reader types of ageing error and two summary approaches (the first and median) of multiple age reads. The sums of squares of the differences (SSD = sum of squares of differences × 1000) in proportion at age between the estimated and ‘true’ age composition were used to measure the accuracy of the estimated age composition (Chih 2009a). Proportional error, calculated as (estimated – true) ÷ true, was used to measure the accuracy and precision of the VBGF parameters K and L∞ (Cope and Punt 2007). We conducted 100 Monte Carlo replications for each scenario. Growth parameters were also compared with the original growth curve using a likelihood ratio test (Kimura 1980) for each of the 100 simulation runs of the above combination scenarios (Chih 2009b). More specifically, the probability of correct conclusions (PCC) was examined. Higher values indicate that there was a higher probability that the parameters from the two growth curves were not significantly different. The simulation model was built using the R program (R Foundation for Statistical Computing, Vienna, Austria, see http://www.r-project.org/).
Determination of minimum sample sizes
For each scenario, the elbow method, which looks at the mean of the SSDs of the age–frequency distributions and the mean of the summed percentage deviations of the predicted mean lengths for all ages as a function of otolith samples, was used for the determination of minimum sample size (Chih 2009a, 2009b). A minimum sample size was suggested, above which increasing the sample size does little to improve estimation.
Results
Estimation error of the age–frequency distribution
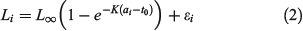
The mean estimates of SSDs derived from the age–frequency distributions from Reader-I (no ageing error) differed among the four sampling methods. POS performed slightly better than the other methods using a sample size of 100, but FOS had the highest SSDs (i.e. highest estimation error) for all sample sizes examined (Fig. 4). For the purpose of a simple comparison, we compared results using sample sizes of 100 and 500; detailed results are provided in Table S1. The mean and s.d. of the SSDs decreased when the sample size increased from 100 to 500 for all sampling methods. The four sampling methods performed similarly with a sample size of 500.
|
Mean and s.d. values of the SSDs based on the first age read under the extra imprecision in ageing scenario (Reader-IV) were higher than those of Readers-I and -II (medium ageing imprecision; Fig. 4a, b). However, the estimation errors based on the median read from Reader-IV were smaller than those based on the first read and similar to those of Reader-I (Fig. 4b). Thus, the centre (i.e. median) of multiple age reads is a useful method to obtain accurate and precise estimates of age composition from an imprecise reader, assuming there is no bias.
Under the ageing bias scenario (Reader-III; Fig. 4c), the mean and s.d. values of the SSDs were greater than those from the reader with no ageing error (Reader-I) or with ageing imprecision (Readers-II and -IV). For both Readers-III and -V (ageing bias with extra imprecision), the means of the SSDs based on the first read were less than those based on the median read. Furthermore, the mean of SSDs based on the first read from Reader-V (Fig. 4d) was less than that from Reader-III (Fig. 4c). This implied that the result for a biased reader would be substantially degraded, and improvement of the estimation by increasing sample size would be limited. Extra imprecision and the first read could countervail a little of the estimation errors for the biased reader, but the improvement was limited.
Estimation error of growth parameters
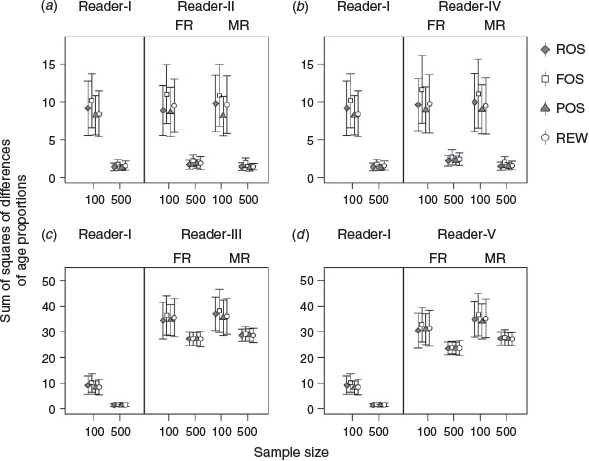
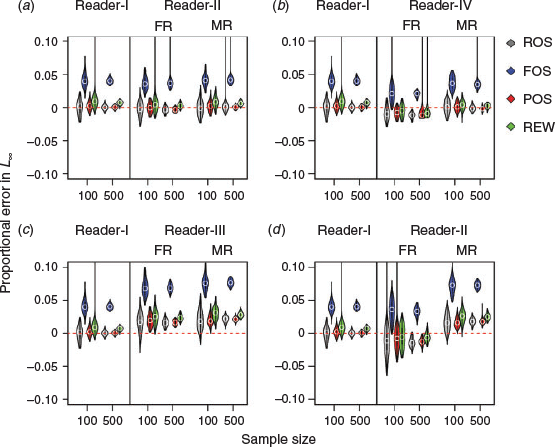
Violin plots of L∞ and K constructed under the four sampling methods without ageing error for sample sizes of 100 and 500 are shown in Fig. 5 and 6. Detailed results from each sample size are provided in Tables S2 and S3. For both parameters, the performance of accuracy (no error in median estimation) of the various sample sizes (100 v. 500) was consistent among ROS, POS and REW, but not in FOS. The probability of making correct conclusions (PCC) with FOS otolith samples from the 100 runs was zero (i.e. that the two samples from the same dataset were statistically different; P < 0.01) for all sample sizes examined (Fig. 7). Increasing sample size from 100 to 500 showed improvements in precision (less spread of the violin plot) for all methods. An inverse correlation between L∞ and K was apparent (e.g. positive proportional error in L∞ meant negative proportional error in K). Furthermore, the range of error distribution of K was greater than that of L∞.
|
|
|
There were only small differences in the accuracy and precision of L∞ and K between Readers-I and -II for each method examined (Fig. 5a, 6a). Increasing the sample size from 100 to 500 led to an overall increase in estimation precision. However, similar likelihood ratio test results were obtained for both Readers-I and -II (Fig. 7a). L∞ and K became slightly inaccurate (overestimating L∞ and underestimating K) and imprecise for the first reads of ROS, POS and REW samples from the extra imprecise reader (Reader-IV; Fig. 5b, 6b).
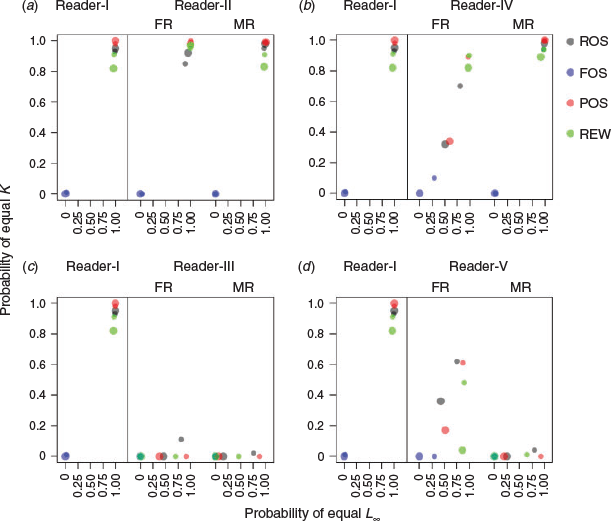
A clear pattern of degradation in performance by various sampling methods was found in Fig. 7b. POS generally performed better than other sampling methods (higher PCC value) for all sample sizes examined. The median read overall performed better than the first read for the extra imprecision scenarios (Reader-IV), and both accuracy and precision were similar to those of Reader-I. The PCC was >75% for both L∞ and K for the median read (Fig. 7b). It was noted that the performance median read of ROS and POS samples for a sample size of 100 was clearly better than the first read of ROS and POS samples with a sample size of 500. A similar result was obtained from the likelihood ratio test (PCC > 87.5% v. < 60%; Fig. 7b).
The estimates of L∞ and K were less accurate (underestimating L∞ and overestimating K) for the ageing bias scenario (Reader-III) for both the first and median reads and all sampling methods (most biased in FOS; Fig. 5c, 6c). This was apparent when estimating K; in addition, the PCCs were generally <10% for each sampling method (Fig. 7c). When the sample sizes increased, none of sampling methods became accurate, but precision did improve. The PCCs of K were <10% for both first and median reads and with all sampling methods. The PCCs of L∞ of the ROS and POS samples (>75%) were higher than those of the FOS and REW samples (Fig. 7c).
Under the scenario of ageing bias with extra imprecision (Reader-V), the estimates of growth parameters, especially K, became less biased and with lower precision than Reader-III for the first reads of all sampling methods (Fig. 5d, 6d). The PCCs for K increased from <25% for Reader-III (Fig. 7c) to >50% for Reader-V when the sample size was 100 (Fig. 7d). A similar pattern of biased estimates but greatly improved precision was observed when the sample size increased from 100 to 500 (Fig. 5d, 6d), which leads to the degradation of PCCs for K (Fig. 7d). However, PCCs of L∞ were similar between Readers-III and -V when the sample size was 100 because L∞ is generally less biased than K.
The results of the median read became greatly biased but improved in precision compared with the first read for all sampling methods in the Reader-V scenario (Fig. 5d, 6d). The PCCs of K and L∞ based on the median reads were smaller than the first reads (especially for K; Fig. 7d). The results from Readers-III and -V implied that, for the biased reader, estimation of K was overall substantially degraded, but the first read with extra imprecision and low sample size (e.g. 100 individuals) could balance out some of the estimation errors, which led to higher PCCs of K (>50%; Fig. 7d). However, it should be noted that the PCCs of K were generally <65%.
Minimum sample size
The relationships between the mean SSD of the age proportions, the mean sum of percentage deviations of predicted lengths and sample size can be used as criteria for determining the minimum sample size. We present the result from Reader-I, noting that trends were similar for all readers. Detailed results from each sample size are provided in Tables S1 and S4. For both the mean SSD of the age proportions and the mean sum of the percentage deviations of predicted lengths, there is little improvement in estimation error using otolith sample sizes >500 (Fig. 8).

|
Discussion
An important feature of the length–frequency distribution of the sample of PBF otoliths was that it approximated the length–frequency distribution of the catch data from the Catch Documentation Scheme. This allowed sampling from the simulated catch composition to compare the performance of different sampling methods in the field. For Reader-I, FOS had the lowest sampling accuracy for all sampling methods regardless of the age composition or growth parameters. FOS requires a fixed number of otolith samples from all length intervals and would therefore be expected to estimate the ages of young and old fish more accurately than the ROS method because greater proportions of young and old fishes would be used to derive the ALK. However, PBF exhibits high variability in length-at-age throughout all ages, and grows moderately faster before age-8 and approaches an asymptotic size after age-15 (Shimose et al. 2009; Shiao et al. 2017). In this case, FOS tended to sample a large number of fish aged 5–7 years for the <180-cm-FL length bin and few very old fish (>19 years) for the length bins of 240–250, 250–260 and >260 cm FL. It should be noted that the ALK derived from the FOS samples was used to assign ages to unaged fish based on the length–frequency distribution of the catch, and this explains why the performance of FOS for estimating age composition is still satisfied when sample size is high, but the estimation of growth parameters is biased for all sample sizes examined.
The POS method is based entirely on the length–frequency distribution of the catch (i.e. the sampled length–frequency distribution is close to the original catch composition), so it is not surprising that it had the greatest accuracy and precision in estimating age composition and growth parameters among the four methods. The REW provides a reasonable alternative for improving the efficiency of the FOS and POS methods by sampling predetermined numbers of otolith samples from larger length intervals (four intervals were used in the present study). This means that sampling intervals and sampling targets can be set based on the variability in length-at-age distributions of the species of interest. In the REW, the age composition derived from otolith samples is reweighted according to the length–frequency distribution of the catch, which resulted in accuracy and precision comparable to that seen for the POS method. However, the growth parameter K estimated from the REW was slightly biased because fish aged 5–6 years in the <200-cm-FL length bin (first interval) were up-weighted due to their higher proportion (in terms of numbers) compared with fish aged <5 years.
The results from Readers-I and -II suggest that ageing imprecision had the least effect on the estimation of age composition and growth parameters for all sampling methods and sample sizes examined. However, extra imprecision in ageing (Reader-IV) with the first age read could lead to estimation errors for both age composition and growth parameters for all sampling methods. The reason for this is that large numbers of fish aged 6–9 and 16–20 years would be aged either older or younger than the original ages under the first age read. Consequently, the length-at-age matrix would change. It should be noted that estimation error resulting from the extra imprecision could be reduced by using the median of multiple age reads.
As expected, substantial estimation errors were found in the age composition and growth parameters for the ageing bias scenario (Reader-III); this was true for all sampling methods, between the first and median reads, and for all sample sizes. The reason for this was that this scenario was associated with the greatest changes in the length-at-age matrices among all methods. However, the bias of estimation in growth parameters could be slightly reduced in the presence of extra imprecision in ageing (Reader-V) with the first age read and small sample size (n = 100) because larger numbers of fish aged 6–9 and 16–20 year have been aged extra imprecisely, which could countervail some of the ageing biases and result in a partially correct length-at-age matrix for a limited improvement (<65%).
In addition, further reducing the sample size to <100 for Reader-V with the first read would not be good for bias, and the resulting length-at-age matrix will be greatly inconsistent with the original matrix. Consequently, there is a higher chance of getting questionable growth curves or growth curves without statistical convergence. It should be noted that age compositions were still biased for Reader-III with the median age read. As noted for Reader-IV, the estimation error resulting from the extra imprecision ageing could be reduced by using the median of multiple age reads, which explained the results of growth parameters for Reader-V with the median of age reads (offset the variation of growth curves), which were similar to the results of either the first read or median read from Reader-III.
Chih (2009a) suggested that the REW consistently produced more precise age–frequency distributions than the ROS and FOS methods. However, the REW did not perform better than the other methods in the estimation of either age composition or growth parameters in this study. The reason for this is that the REW allows random sampling within a larger length interval, and the sample size for each age is determined by the proportion at age within each sampling interval. Given the high variability of length-at-age data and the moderate steepness of the PBF growth curve, the REW did not necessarily sample enough old and young fish to represent the original length-at-age matrix better than the POS. The performance of the REW could be improved by changing the current length intervals and sampling targets based on the variability in the age-at-length distribution and age–frequency distribution of PBF. Although of the four sampling methods POS performed the best, it has the disadvantage of an inflexible sampling design. This could be an important consideration because, for example, an observer may not be able to obtain the predetermined number of otoliths for each length interval due to cluster sampling for fish collected during the same trip. Selection of an efficient sampling method should depend on two factors: (1) the variability in age–frequency distributions; and (2) the variability in age at length for different length intervals of a given species (Chih 2009a). For species that have a high variability in their age–frequency distribution (longer life span), such as PBF, we recommend the ROS method because it was a more efficient method than either the POS (inflexibility) or the REW (results could be biased due to the wrong length intervals and sampling targets).
Two-stage cluster sampling is a common practice in the field: fishing trips are sampled first, followed by sampling of individual fish (Chih 2009a). It is commonly observed that fish in the same catch (e.g. from a single longline set) tend to be closer to each other in length or age than fish from different catches. Therefore, the effective sample sizes of fish collected by cluster sampling can be much smaller than actual sample sizes because of the possibility of intracorrelation (Pennington et al. 2002; Aanes and Pennington 2003; Francis 2011). The variability in individual trips is reflected in the otolith samples when ROS is used. Because within-trip variability can fluctuate greatly among fishing trips (Sen 1986; Chih 2007), we suggest that ROS otolith sample sizes for individual trips need to be large enough to reflect all possible ranges of within-trip variability.
The formation of fish ageing structures (e.g. otoliths) and the subsequent interpretation of the growth record are not always consistent, leading to observation error (ageing imprecision, bias or both) in the assignment of age (Evans and Hoenig 1998; Campana 2001). Methods have been developed for the construction of age reading error matrices that account for both ageing bias and ageing imprecision (Richards et al. 1992; Punt et al. 2008). Furthermore, methods to explicitly incorporate ageing error into the estimation of VBGF parameters using a random effect or Bayesian hierarchical modelling framework have also been developed and evaluated (Cope and Punt 2007; Dortel et al. 2013; Hatch and Jiao 2016). These studies suggested that the ageing error model performs better than the standard VBGF model and that ageing fewer individuals multiple times was preferable to ageing more individuals only once. The focus of this study is to highlight the relative trends caused by sampling methods and ageing error rather than to predict absolute error. The findings of this study suggest that ageing bias has a greater effect on the estimation of age composition and growth parameters of PBF than ageing imprecision or the otolith sampling method used. Ageing imprecision and bias for PBF are caused by the opaque zones close to the core (ca. up to 10 years), which are difficult to identify (Shimose and Ishihara 2015) because the early growth zones are broad and diffuse and exhibit little contrast between the wide opaque and thin translucent zones (Hsu 2017). Although early growth (up to ~2 years) of PBF modal analysis of length–frequency distribution and otolith microincrement analysis could provide useful criteria to identify the first and second annual opaque zones, the opaque zones between the first and second inflexion points are still difficult to identify (Shimose and Ishihara 2015). However, we suggest the ageing error of the above opaque zones could be improved when a greater sample size was examined, with the first nine zones appearing easier to interpret based on the incremental widths (slightly narrower as age increases) referring to both the sulcus and antisulcus sides. In addition, measurements of distances from the core to the counted opaque zones of fish whose age has been validated by bomb radiocarbon dating (Ishihara et al. 2017) could provide guidance for age determination, which, in turn, improves the ageing error.
The otolith mass is known to be closely related to age in many fish species (including southern bluefin tuna Thunnus maccoyii; Gunn et al. 2008), and has been evaluated for utility in age prediction and proposed as an economical and objective method of age determination (Boehlert 1985; Worthington et al. 1995). However, it has been shown that various factors (e.g. location and annual effects) can affect fish otolith mass and should be incorporated in the age–otolith mass predictor (Lepak et al. 2012). For a fixed total cost, the ability to age larger samples using otolith mass may provide a more precise estimate of the true age composition of a population than a smaller sample with a more reliable ageing method (annuli in sectioned otoliths). However, there is large variability between the otolith mass and estimated ages of PBF >10 years of age (Ishihara et al. 2017). Therefore, we suggest that the relationship between otolith mass and fish age be further evaluated for PBF in future studies.
Results from this study provide general guidelines concerning the minimum sample sizes for constructing PBF age composition and growth curves for a desired error to be achieved. For example, for Reader-I (without ageing error), if it is desired that 20 of the 25 age groups have a maximum deviation of 0.01 in the proportion-at-age estimate, then the calculated SSD index should be <2 (i.e. 0.01 × 0.01 × 20 × 1000) and a sample size of 500 may be adequate (50th percentile SSD = 1.38, 1.74, 1.30 and 1.55 for ROS, FOS, POS and REW respectively). Similarly, if the goal is to keep the mean errors of predicted mean lengths for all ages within 5%, the otolith sample sizes should be >500 if the ROS and POS methods are used (as noted, these two methods generally perform better). In addition, increasing the sample size has much less of an effect on improving the estimation error of both age composition and predicted mean lengths when otolith sample size was >500. Based on these findings, we recommend using 500 otolith samples as an adequate sample size; this could be set as the guideline for the biological sampling program of the PBF Catch Documentation Scheme. A sample size of 500 fish was also recommended by Coggins et al. (2013) for the best possible accuracy and precision to estimate the growth and mortality parameters for long-lived fish species.
Conclusion
In summary, the major findings of this study are that: (1) POS performs the best among the four sampling methods tested, but ROS is efficient with a low estimation error; (2) for the imprecise reader, the centre of multiple age reads is recommended to obtain accurate and precise estimates; (3) ageing bias has a greater effect on the estimation of age composition and growth parameters than ageing imprecision or the otolith sampling methods; and (4) 500 otolith samples is an adequate sample size and could be the guideline for the PBF Catch Documentation Scheme.
Conflicts of interest
The authors declare that they have no conflicts of interest.
Declaration of funding
This study was financially supported, in part, by the Ministry of Science and Technology through research grants to Yi-Jay Chang (105-2119-M-002–058-MY2 and 107-2611-M-002-009).
Acknowledgements
The authors are thank Yi-Shan Zheng, Min-Yu Huang and the scientific observers for data and otolith collections, the Overseas Fisheries Development Council of the Republic of China for providing the fishery data and William Walsh for suggestions on the article.
References
Aanes, S., and Pennington, M. (2003). On estimating the age composition of the commercial catch of Northeast Arctic cod from a sample of clusters. ICES Journal of Marine Science 60, 297–303.| On estimating the age composition of the commercial catch of Northeast Arctic cod from a sample of clusters.Crossref | GoogleScholarGoogle Scholar |
Boehlert, G. W. (1985). Using objective criteria and multiple regression models for age determination in fishes. Fishery Bulletin 83, 103–117.
Campana, S. E. (2001). Accuracy, precision and quality control in age determination, including a review of the use and abuse of age validation methods. Journal of Fish Biology 59, 197–242.
| Accuracy, precision and quality control in age determination, including a review of the use and abuse of age validation methods.Crossref | GoogleScholarGoogle Scholar |
Chang, S. K., Liu, H. L., Fukuda, H., and Maunder, M. N. (2017). Data reconstruction can improve abundance index estimation: an example using Taiwanese longline data for Pacific bluefin tuna. PLoS One 12, e0185784.
| Data reconstruction can improve abundance index estimation: an example using Taiwanese longline data for Pacific bluefin tuna.Crossref | GoogleScholarGoogle Scholar | 28968434PubMed |
Chen, K. S., Crone, P., and Hsu, C. C. (2006). Reproductive biology of female Pacific bluefin tuna Thunnus orientalis from south-western North Pacific Ocean. Fisheries Science 72, 985–994.
| Reproductive biology of female Pacific bluefin tuna Thunnus orientalis from south-western North Pacific Ocean.Crossref | GoogleScholarGoogle Scholar |
Chih, C. P. (2007). A bootstrap approach for determination of sample sizes for sampling fish from commercial reef fisheries. SFD-2007-027, Southeast Fisheries Science Center, Miami, FL, USA.
Chih, C. P. (2009a). The effects of otolith sampling methods on the precision of growth curves. North American Journal of Fisheries Management 29, 1519–1528.
| The effects of otolith sampling methods on the precision of growth curves.Crossref | GoogleScholarGoogle Scholar |
Chih, C. P. (2009b). Evaluation of the sampling efficiency of three otolith sampling methods for commercial king mackerel fisheries. Transactions of the American Fisheries Society 138, 990–999.
| Evaluation of the sampling efficiency of three otolith sampling methods for commercial king mackerel fisheries.Crossref | GoogleScholarGoogle Scholar |
Coggins, L. G., and Quinn, T. J. (1998). A simulation study of the effects of ageing error and sample size on sustained yield estimates. In ‘Fishery Stock Assessment Models’. (Eds F. Funk, T. J. Quinn, J. Heifetz, J. N. Ianelli, J. E. Powers, J. F. Schweigert, P. J. Sullivan, and C-I. Chang.) Alaska Sea Grant College Program Report number AK-SG-98-01, pp. 955–975. (University of Alaska—Fairbanks: Fairbanks, AK, USA.)
Coggins, L. G., Gwinn, D. C., and Allen, M. S. (2013). Evaluation of age–length key sample sizes required to estimate fish total mortality and growth. Transactions of the American Fisheries Society 142, 832–840.
| Evaluation of age–length key sample sizes required to estimate fish total mortality and growth.Crossref | GoogleScholarGoogle Scholar |
Collette, B. B., and Nauen, C. E. (1983). ‘FAO Species Catalogue. Volume 2. Scombrids of the World. An Annotated and Illustrated Catalogue of Tunas, Mackerels, Bonitos and Related Species Known to Date.’ (Food and Agriculture Organization of the United Nations: Rome, Italy.)
Committee of Age Reading Experts (2000). ‘Manual on Generalized Age Determination Procedures for Groundfish.’ (Pacific States Marine Fisheries Commission: Portland, OR, USA.)
Cope, J. M., and Punt, A. E. (2007). Admitting ageing error when fitting growth curves: an example using the von Bertalanffy growth function with random effects. Canadian Journal of Fisheries and Aquatic Sciences 64, 205–218.
| Admitting ageing error when fitting growth curves: an example using the von Bertalanffy growth function with random effects.Crossref | GoogleScholarGoogle Scholar |
Dortel, E., Felix, M. G., Etienne, R., Julien, M., Jean, P. H., Eric, M., Jean, M. M., Nicolas, B., and Emmanuel, C. (2013). Accounting for age uncertainty in growth modeling, the case study of yellowfin tuna (Thunnus albacares) of the Indian Ocean. PLoS One 8, e60886.
| Accounting for age uncertainty in growth modeling, the case study of yellowfin tuna (Thunnus albacares) of the Indian Ocean.Crossref | GoogleScholarGoogle Scholar | 23637773PubMed |
Evans, G. T., and Hoenig, J. M. (1998). Testing and viewing symmetry in contingency tables, with application to readers of fish ages. Biometrics 54, 620–629.
| Testing and viewing symmetry in contingency tables, with application to readers of fish ages.Crossref | GoogleScholarGoogle Scholar |
Francis, R. C. (2011). Data weighting in statistical fisheries stock assessment models. Canadian Journal of Fisheries and Aquatic Sciences 68, 1124–1138.
| Data weighting in statistical fisheries stock assessment models.Crossref | GoogleScholarGoogle Scholar |
Francis, R. C. (2016). Growth in age-structured stock assessment models. Fisheries Research 180, 77–86.
| Growth in age-structured stock assessment models.Crossref | GoogleScholarGoogle Scholar |
Goodyear, C. P. (1995). Mean size at age: an evaluation of sampling strategies with simulated red grouper data. Transactions of the American Fisheries Society 124, 746–755.
| Mean size at age: an evaluation of sampling strategies with simulated red grouper data.Crossref | GoogleScholarGoogle Scholar |
Gunn, J. S., Clear, N. P., Carter, T. I., Rees, A. J., Stanley, C. A., Farley, J. H., and Kalish, J. M. (2008). Age and growth in southern bluefin tuna, Thunnus maccoyii (Castelnau): direct estimation from otoliths, scales and vertebrae. Fisheries Research 92, 207–220.
| Age and growth in southern bluefin tuna, Thunnus maccoyii (Castelnau): direct estimation from otoliths, scales and vertebrae.Crossref | GoogleScholarGoogle Scholar |
Hatch, J., and Jiao, Y. (2016). A comparison between traditional and measurement-error growth models for weakfish Cynoscion regalis. PeerJ 4, e2431.
| A comparison between traditional and measurement-error growth models for weakfish Cynoscion regalis.Crossref | GoogleScholarGoogle Scholar | 27688963PubMed |
Hsu, J. (2017). Demography and otolith sampling approach of Pacific Bluefin tuna (Thunnus orientalis) in the water off Taiwan. M.Sc. Thesis, Institute of Fishery Science, National Taiwan University, Taipei, Taiwan.
International Scientific Committee for Tuna and Tuna-like Species in the North Pacific Ocean (2016). Report of the Pacific Bluefin Tuna Working Group Workshop, International Scientific Committee for Tuna and Tuna-like Species in the North Pacific Ocean, 29 February–11 March 2016, La Jolla, CA, USA. Available at http://isc.fra.go.jp/pdf/ISC16/ISC16_Annex_06_Report_of_the_PBFWG(Feb2016).pdf [Verified 15 May 2019].
Ishihara, T., Abe, O., Shimose, T., Takeuchi, Y., and Aires-da-Silva, A. (2017). Use of post-bomb radiocarbon dating to validate estimated ages of Pacific bluefin tuna, Thunnus orientalis, of the North Pacific Ocean. Fisheries Research 189, 35–41.
| Use of post-bomb radiocarbon dating to validate estimated ages of Pacific bluefin tuna, Thunnus orientalis, of the North Pacific Ocean.Crossref | GoogleScholarGoogle Scholar |
Kimura, D. K. (1977). Statistical assessment of the age–length key. Journal of the Fisheries Research Board of Canada 34, 317–324.
| Statistical assessment of the age–length key.Crossref | GoogleScholarGoogle Scholar |
Kimura, D. K. (1980). Likelihood methods for the von Bertalanffy growth curve. Fishery Bulletin 77, 765–776.
Kimura, D. K. (1990). Approaches to age-structured separable sequential population analysis. Canadian Journal of Fisheries and Aquatic Sciences 47, 2364–2374.
| Approaches to age-structured separable sequential population analysis.Crossref | GoogleScholarGoogle Scholar |
Lepak, J. M., Cathcart, C. N., and Hooten, M. B. (2012). Otolith mass as a predictor of age in kokanee salmon (Oncorhynchus nerka) from four Colorado reservoirs. Canadian Journal of Fisheries and Aquatic Sciences 69, 1569–1575.
| Otolith mass as a predictor of age in kokanee salmon (Oncorhynchus nerka) from four Colorado reservoirs.Crossref | GoogleScholarGoogle Scholar |
Mackett, D. J. (1963). A method of sampling the Pacific albacore (Thunnus germo) catch for relative age composition. FAO Fisheries Report 3, 1355–1361.
Neilson, J. D. (1992). Sources of error in otolith microstructure examination. Otolith microstructure examination and analysis. Canadian Special Publication of Fisheries and Aquatic Sciences 117, 115–125.
Ogle, D. H. (2015). Age–length keys. In ‘Introductory Fisheries Analyses with R’. pp. 87–103. (CRC Press: Boca Raton, FL, USA.)
Pennington, M., Burmeister, L. M., and Hjellvik, V. (2002). Assessing the precision of frequency distributions estimated from trawl survey samples. Fishery Bulletin 100, 74–81.
Punt, A. E., Smith, D. C., KrusicGolub, K., and Robertson, S. (2008). Quantifying age-reading error for use in fisheries stock assessments, with application to species in Australia’s southern and eastern scalefish and shark fishery. Canadian Journal of Fisheries and Aquatic Sciences 65, 1991–2005.
| Quantifying age-reading error for use in fisheries stock assessments, with application to species in Australia’s southern and eastern scalefish and shark fishery.Crossref | GoogleScholarGoogle Scholar |
Reeves, S. A. (2003). A simulation study of the implications of age-reading errors for stock assessment and management advice. ICES Journal of Marine Science 60, 314–328.
| A simulation study of the implications of age-reading errors for stock assessment and management advice.Crossref | GoogleScholarGoogle Scholar |
Richards, L. J., Schnute, J. T., Kronlund, A. R., and Beamish, R. J. (1992). Statistical models for the analysis of ageing errors. Canadian Journal of Fisheries and Aquatic Sciences 49, 1801–1815.
| Statistical models for the analysis of ageing errors.Crossref | GoogleScholarGoogle Scholar |
Ricker, W. E. (1975). Computation and interpretation of biological statistics of fish populations. Bulletin 191, Fisheries Research Board of Canada, Ottawa, ON, Canada.
Sen, A. R. (1986). Methodological problems in sampling commercial rockfish landings. Fishery Bulletin 84, 409–421.
Shiao, J. C., Lu, H. B., Hsu, J., Wang, H. Y., Chang, S. K., Huang, M. Y., and Ishihara, T. (2017). Changes in size, age, and sex ratio composition of Pacific bluefin tuna (Thunnus orientalis) on the northwestern Pacific Ocean spawning grounds. ICES Journal of Marine Science 74, 204–214.
| Changes in size, age, and sex ratio composition of Pacific bluefin tuna (Thunnus orientalis) on the northwestern Pacific Ocean spawning grounds.Crossref | GoogleScholarGoogle Scholar |
Shimose, T., and Ishihara, T. (2015). A manual for age determination of Pacific bluefin tuna Thunnus orientalis. Bulletin of Fisheries Research Agency 40, 1–11.
Shimose, T., Tanabe, T., Chen, K. S., and Hsu, C. C. (2009). Age determination and growth of Pacific bluefin tuna, Thunnus orientalis, off Japan and Taiwan. Fisheries Research 100, 134–139.
| Age determination and growth of Pacific bluefin tuna, Thunnus orientalis, off Japan and Taiwan.Crossref | GoogleScholarGoogle Scholar |
Summerfelt, R. C., and Hall, G. E. (Eds) (1987). ‘Age and Growth of Fish.’ (Iowa State University Press: Ames, IA, USA.)
von Bertalanffy, L. (1938). A quantitative theory of organic growth (inquiries on growth laws. II). Human Biology 10, 181–213.
Wakefield, C. B., O’Malley, J. M., Williams, A. J., Taylor, B. M., Nichols, R. S., Halafihi, T., Humphreys, R. L., Kaltavara, J., Nicol, S. J., and Newman, S. J. (2017). Ageing bias and precision for deep-water snappers: evaluating nascent otolith preparation methods using novel multivariate comparisons among readers and growth parameter estimates. ICES Journal of Marine Science 74, 193–203.
| Ageing bias and precision for deep-water snappers: evaluating nascent otolith preparation methods using novel multivariate comparisons among readers and growth parameter estimates.Crossref | GoogleScholarGoogle Scholar |
Worthington, D. G., Fowler, A. J., and Doherty, P. J. (1995). Determining the most efficient method of age determination for estimating the age structure of a fish population. Canadian Journal of Fisheries and Aquatic Sciences 52, 2320–2326.
| Determining the most efficient method of age determination for estimating the age structure of a fish population.Crossref | GoogleScholarGoogle Scholar |