

How to measure the economic health cost of wildfires – A systematic review of the literature for northern America
Ruth Dittrich A B and Stuart McCallum AA University of Portland, Pamplin School of Business, 5000 N Willamette Boulevard, Portland, OR 97203, USA.
B Corresponding author. Email: dittrich@up.edu
International Journal of Wildland Fire 29(11) 961-973 https://doi.org/10.1071/WF19091
Submitted: 18 June 2019 Accepted: 2 August 2020 Published: 1 October 2020
Journal Compilation © IAWF 2020 Open Access CC BY-NC-ND
Abstract
There has been an increasing interest in the economic health cost from smoke exposure from wildfires in the past 20 years, particularly in the north-western USA that is reflected in an emergent literature. In this review, we provide an overview and discussion of studies since 2006 on the health impacts of wildfire smoke and of approaches for the estimation of the associated economic cost. We focus on the choice of key variables such as cost estimators for determining the economic impact of mortality and morbidity effects. In addition, we provide an in-depth discussion and guidance on the functioning, advantages and challenges of BenMAP-CE, freely available software of the US Environmental Protection Agency (EPA) that has been used in a growing number of studies to assess cost from wildfire smoke. We highlight what generates differences in outcomes between relevant studies and make suggestions for increasing the comparability between studies. All studies, however, demonstrate highly significant health cost from smoke exposure, in the millions or billions of US dollars, often driven by increases in mortality. The results indicate the need to take health cost into account for a comprehensive analysis of wildfire impacts.
Additional keywords: BenMAP-CE
Introduction
Total area burned through wildfires in the United States has increased since the mid-1980s, with the north-west USA as one of the most affected regions (Spracklen et al. 2009; Liu et al. 2016; McClure and Jaffe 2018). Although there is some evidence to suggest this increase is due to a more normal fire mitigation regime in areas where fires had previously been supressed (Doerr and Santin 2016), there exists a growing consensus that climate change has led and will lead to an increased incidence of wildfires (Fried et al. 2008; Spracklen et al. 2009; Flannigan et al. 2013; Liu et al. 2016). Abatzoglou and Williams (2016) found anthropogenic climate change to have contributed to increased fuel aridity and a doubling in the cumulative forest fire area since 1984, the main drivers of this being earlier spring snow melt and increasing spring and summer temperatures (Spracklen et al. 2009). Another driver of wildfires is the increased wildland-urban interface, the zone between unoccupied land and human population, where homes are built near or among lands prone to wildfires (Radeloff et al. 2018). Liu et al. (2016) estimate ‘more than 82 million individuals will experience on average a 31% to 57% increase in frequency and intensity’ of wildfire in the USA. This increase is to be greatest in the Pacific Northwest, with a 78% increase in annual mean area burned by 2050 (Spracklen et al. 2009). Linked to this, Cascio (2018) found that the size of the population at risk from smoke is going up: an increase in wildfire prevalence has led to an increase in exposure to harmful pollutants emitted by wildfires like particulate matter (PM), and ground-level ozone (O3). As such, interest in the cost to health of these wildfires is growing.
At present, there exists significant literature surrounding wildfires’ ecological impact (Reid et al. 2016); yet literature surrounding the valuation of indirect health costs associated with wildfires is still relatively new. Direct health costs from wildfire relate to damage such as death resulting from burn injuries whereas the indirect costs are the result of secondary impacts. Many general cost studies on wildfires vastly underestimate the true cost of those fires as they do not incorporate smoke-induced health costs. The literature suggests that these indirect costs may be much greater than assumed in the past and growing. It is estimated that between 2010 and 2015, wildfire smoke costs grew on average by 217% each year in the western USA (Jones and Berrens 2017).
Kochi et al. (2010) carried out a literature review on the economic costs of health impacts in 2010. At that time, they identified a need to better understand both the major and minor impacts of wildfire smoke on adverse health outcomes including more knowledge on aversion behaviours. In the 10 years since then, several new studies on the cost of health impacts from wildfires have emerged, particularly in the USA. This could in part be due to the increasing severity of wildfires, especially in the USA, but also due to the availability of BenMAP-Commuity Edition (BenMAP-CE) or the ‘Environmental Benefits Mapping and Analysis Program’: open-source software provided by the US Environmental Protection Agency (EPA) that makes the evaluation of changes in air quality and the application of cost–benefit analysis in the wildfire context more accessible and has been used by several studies.
In the present literature review, we will examine the latest studies on the economic costs of adverse health-related impacts from wildfires. Although there is some literature on the health effects from prescribed fire smoke (Nguyen et al. 2020), we are not aware of economic valuation studies for prescribed fires.
We focus mostly on northern America, as the bulk of recent literature focuses on this geographic region but also include studies from other regions where relevant. We believe this to be a valuable exercise to inform future research and policy. Oftentimes, health impacts from smoke are still not considered when estimating the total cost from a wildfire as it is time-consuming. Synthesising the literature related to health costs allows us to better contextualise other costs from wildfires and to inform discussions on what drives costs from wildfires. As such, a better understanding of total wildfire costs can provide an indication where to focus mitigation spending for wildfire impacts.
We provide readers with practical guidance on how BenMAP-CE functions and where its challenges lie that makes the standardisation across BenMAP-CE studies difficult. We also discuss options on how to make those studies potentially more uniform for future research. The first part of the paper includes all studies that have been identified as relevant to the topic, whereas the second part focuses on studies that used BenMAP-CE.
This remainder of this paper is structured as follows: The pollutants from wildfires that affect human health section reviews the literature in the field, including the epidemiological effects of wildfire smoke, describing first the pollutants, and then health impacts of these pollutants. The Economic cost of health impacts and BenMAP-CE sections discuss literature that values health impact incidences to derive economic cost with a focus on BenMAP-CE. The final two sections provide a discussion and conclusion respectively.
Methodology
The literature search was conducted using search engines (Google Scholar and ResearchGate) and databases (CSIRO Publishing and Elsevier) in order to identify peer-reviewed articles as well as grey literature that tackle the subject. Through the citations and references of these papers, further evidence was found to contribute to this literature review. Search terms centred around wildfire/forest fire, prescribed fires/controlled burns, particulate matter (PM2.5 and PM10), ground-level ozone (O3) and health impacts/effects. Through the search, a focus was placed on literature from 2006 onwards as well as a concentration on North America. However, literature that added value was also utilised as supporting evidence even if not under these criteria. A filtering process – through titles, then abstracts and finally full papers – was then used to identify the relevant studies. We identified 47 studies as relevant, of which 12 estimated the economic cost of health impacts and of those, five used BenMAP-CE.
The pollutants from wildfires that affect human health
Wildfires generate smoke plumes that are the primary cause of indirect health costs. Smoke plumes are defined as ‘gases, smoke and debris that rise slowly from the fire while being carried along the ground because the buoyant forces are exceeded by those of the ambient surface wind’ (National Wildfire Coordinating Group 2018). These plumes dramatically alter air quality in the affected area and can increase both the levels of ozone (O3) and PM to dangerous levels (Larsen et al. 2018). Other combustion products produced by wildfires include: polycyclic aromatic hydrocarbons (PAHs), carbon monoxide (CO), nitrogen oxides (NOx), volatile organic compounds (VOCs) and sulfur dioxide (SO2) (Hänninen et al. 2009).
There is consensus that wildfire smoke has a significant impact on both acute and long-term health endpoints in the exposed populations (US Forest Service 2018). In general, the health literature shows associations between smoke exposure and an increased risk of mortality (death) (Morgan et al. 2010; Johnston et al. 2012; Kochi et al. 2012; Shaposhnikov et al. 2014; Reid et al. 2016). Specifically, Johnston et al. (2012) found the estimated global mortality attributable to wildfire to be an average of 339 000 deaths annually across the world (the most affected regions being sub-Saharan Africa and south-east Asia). In addition, there is also evidence of the increased risk of morbidity (Kochi et al. 2010).
The evidence on health impacts from prescribed fires is very limited but literature on PM2.5 concentrations suggests they may be less severe than from wildfires. Generally, even though the burnt areas from wildfires and prescribed fires are similar in the USA per year, the measured PM2.5 concentrations are much lower for the latter (Jaffe et al. 2020). This is due to fuel types and fire management practice that avoids burning canopy or duff fuels in prescribed fires.
Particulate matter (PM)
Particulate matter is the catch-all term for ‘solid particles and liquid droplets found in the air’ and includes both PM10 (diameters 10 µm and smaller) and PM2.5 (2.5 µm and smaller) (EPA 2018a). Fine PM consists of soot, organic carbon compounds and inorganic ash (Hänninen et al. 2009). Owing to its size, PM infiltrates deep into the lungs, with some even entering the bloodstream. Decreases in the levels of PM2.5 have been seen nationwide in ambient air as anthropogenic emissions (emitted by combustion engines) have been reduced. Fann et al. (2018a) found the estimated fraction of deaths in the USA due to PM2.5 from all sources to be 6.1% in 2005 (150 000 deaths), which fell to 4.6% (121 000 deaths) by 2014 as PM2.5 concentrations declined. Yet areas with a high wildfire prevalence have seen increases in levels of PM2.5 (particularly the western and north-western USA) attributable to the impact of wildfire (Liu et al. 2016; McClure and Jaffe 2018). In addition, Wegesser et al. (2009) demonstrated that PM2.5 produced by wildfire is of a greater toxicity than that found in ambient air, highlighting the need for health analysis of PM2.5 caused by wildfires.
The effects of PM2.5 are both acute and long term, with Adetona et al. (2016) describing PM2.5 as the most harmful pollutant from wildfire to public health.
Multiple reviews of the literature find a strong association between exposure to wildland fire smoke and respiratory morbidity and mortality (Youssouf et al. 2014; Liu et al. 2015; Reid et al. 2016; Cascio 2018). This includes aggravated asthma, chronic obstructive pulmonary disease (COPD), bronchitis, decreased lung functioning and pneumonia. Regarding the exacerbations of asthma, studies including Henderson et al. (2011) and Morgan et al. (2010) found an association with increased respiratory mortality in a study of bushfire smoke in Australia (concentrating on the urban area of Sydney), a finding supported by a longer-term Australian study (Johnston et al. 2011). Meanwhile, an analysis of cities across Europe also found increases in respiratory mortality to be associated with increases in levels of PM10 (Faustini et al. 2015).
Wildfire smoke exposure has also been shown to lead to higher rates of respiratory hospital admissions as a result of smoke exposure (Delfino et al. 2009; Lee et al. 2009; Morgan et al. 2010; Henderson et al. 2011; Rappold et al. 2011; Martin et al. 2013) and an increase in the rates of physician visits (Yao et al. 2016).
The research on PM2.5 exposure and cardiovascular morbidity shows mixed results. Haikerwal et al. (2015) is one of few studies to show an association between PM2.5 and cardiovascular outcomes. In that study, PM2.5 exposure was linked to an increased risk of out-of-hospital cardiac arrests and ischaemic heart disease (IHD) during the 2006–07 wildfires in Victoria, Australia. Reid et al. (2016) conclude that ‘too many studies and too many inconsistencies in findings exist to determine whether wildfire smoke exposure is associated with specific cardiovascular outcomes’.
Tropospheric ozone (O3)
Another key pollutant from wildfires is tropospheric ozone (O3). O3 – a secondary pollutant – is generated by the photoreaction of NOx (oxides of nitrogen) and VOCs, which are both produced by wildfires.
Studies by Jaffe and Widger (2012) and McClure and Jaffe (2018) have shown wildfire to contribute to an increase in the level above the ozone air quality standard. Unhealthy levels of ozone were shown to be 3.3 times more likely to occur on ‘smoke plume days’ in a study of a 2006–13 wildfire by Larsen et al. (2018), with the most heavily impacted areas being urban owing to the increased presence of non-methane organic compounds (NMOCs), which need to be present to produce O3. Having said that, measuring O3 production from wildfires is quite complicated as it is a secondary pollutant and as such, whereas particulate matter concentration tends to decrease away from the site of the fire, O3 mixing ratios have the potential to increase (Jaffe and Widger 2012). Studies showing increased O3 concentrations due to wildfires include Bossioli et al. (2012) and Kang et al. (2014).
Likely owing to the difficult measurement of O3 due to wildfires, information on its impact on health is much sparser relative to PM (Reid et al. 2016). Reisen et al. (2015) state that although O3 concentrations close to fires are unlikely to be high enough to cause concern, higher O3 concentrations can occur ‘where concentrations are already high owing to anthropogenic activities’, for example in urban areas.
If concentrations are sufficiently elevated, ozone can have serious health implications, particularly for vulnerable populations and it is also a greenhouse gas. O3 has been shown to irritate lungs and aggravate bronchitis and asthma, as well as leading to short-term mortality (occurring within less than 90 days) (Youssouf et al. 2014; Reisen et al. 2015).
In addition, VOCs themselves (which react with nitrogen oxide to form ozone) have been found to be associated with symptoms like skin and eye irritation, drowsiness, coughing and wheezing (Youssouf et al. 2014).
Population segmentation
The population segments most affected by wildfire smoke are the elderly, smokers and those with pre-existing conditions (Youssouf et al. 2014). Also, increases in exposure and health risks are greater for women than men, and greater for African Americans, and in counties with [relatively] lower levels of education (Liu et al. 2017). These studies raise significant questions about inequalities leading to vulnerabilities of populations particularly with regard to ability or knowledge to implement preventative measures.
Another health concern associated with wildfires is birth outcomes. One study found the 2003 southern Californian wildfires to be associated with a reduced average birthweight (Holstius et al. 2012). These findings were confirmed by Cândido da Silva et al. (2014) and Flannigan et al. (2013).
Economic cost of health impacts
Health impacts from wildfires carry costs from lives lost, medical treatment, working time lost and disutility – for example from pain. Our literature search brought up only a small number of directly relevant papers estimating this economic cost. For much of the literature, emphasis is placed on western USA wildfires (e.g. Douglass 2008; Kochi et al. 2012; Richardson et al. 2012; Jones et al. 2016; Jones and Berrens 2017). Many of the studies use the cost–benefit transfer software tool BenMAP-CE in some form or another (Douglass 2008; Jones et al. 2016; Jones and Berrens 2017; Fann et al. 2018b). To measure mortality (lives lost) cost from wildfires, studies used the Value of Statistical Life (VSL). To capture morbidity cost (disease), either Cost of Illness (COI) or Willingness to Pay (WTP) or both were applied. The concepts of VSL, WTP and COI in the context of wildfires are discussed in the next section.
Measuring the cost of premature mortality – the value of a statistical life (VSL)
Costs from mortality are far greater than from any other health endpoint owing to the large cost associated with one death measured by the VSL, which is a measure of per-unit cost of premature mortality. The VSL refers to society’s aggregated WTP to save one anonymous person’s life and is derived from an individual’s WTP for a specific mortality risk reduction. For example, individuals may be asked how much they are willing to pay to reduce their risk of dying of 1 in 10 000 (or 0.0001) from a specific pollutant. This implies that for every 10 000 individuals, we would expect one individual to die if no reduction in the pollution occurs. If the average WTP for this 1/10 000 mortality risk reduction is US$100 (all dollar values are in 2019 dollars unless stated otherwise to allow a better comparison), then the value of VSL can be calculated as individual’s average WTP for the risk reduction of x over x (US$100/0.0001 = US$1 million) (EPA 2018b). Kochi et al. (2010) states that VSL estimates in the literature are between US$2.3 and 16.4 million (2019 dollars); the EPA (2019a) provides a central estimate of US$9.38 million (2019 dollars), which is also used in BenMAP-CE and derived from 26 VSL studies. The discussion about appropriate VSL is ongoing. For example, Rittmaster et al. (2006) lowered the VSL estimate in a study on wildfire smoke in order to reflect the group to be most likely affected by air quality changes, namely the elderly. Elderly people have fewer remaining years of life than other age groups; they may therefore be willing to pay less to reduce the mortality risk. One could argue, however, they may be willing to pay more because the remaining years of life are a scarce good to them (Kochi et al. 2012).
All studies that estimate the cost from mortality rely on VSL and on values provided by the EPA (or the Canadian equivalent) for different regulatory analyses. Generally, costs from even a small increase in premature mortality are far greater than any other cost associated with wildfire health impacts, with the next largest impact being from working days lost (Rittmaster et al. 2006; Kochi et al. 2010; Jones and Berrens 2017). However, the wide range of VSL estimates also makes it harder to contextualise the magnitudes of mortality cost across studies.
Rittmaster et al. (2006) found a 1-day increase in PM during a 2001 fire in Chisholm, Alberta, Canada, had aggregated health impacts of CAN$18.5 million, most of which was from premature mortality. Similarly, Kochi et al. (2012) estimated the value of an additional 133 deaths due to cardiorespiratory illness from smoke exposure during 2003 southern Californian wildfires to be between US$207.28 million and US$2.08 billion. In a rare US east coast study, Rappold et al. (2014) examined a wildfire smoke episode in rural North Carolina. The purpose of this study was to look at the impact of potential interventions (like adequate forecasting), and they found the economic benefits of effective interventions to be US$58 million in total, again mainly owing to avoided premature mortality. Jones and Berrens (2017) investigated wildfires in the entire western US from 2005 to 2015 and found that although emergency room visits were dominating in terms of numbers, mortality accumulated the greatest health cost at US$1.9 billion (averaging $177 million year−1). In another similar longer-term study, Fann et al. (2018b) looked at the impact of wildfire episodes in the USA from 2008 to 2012. They found a significant increase in hospital admissions and premature deaths valued at between US$13 and 24 billion per year for short-term exposure (within 5 years) and US$90 and 154 billion per year for long-term exposure (over 5 years).
Measuring the cost from morbidity – deriving Willingness to Pay and Cost of Illness
Various approaches have been used to estimate the cost of morbidity impacts, which is challenging as the severity and duration of adverse health outcomes vary significantly (Kochi et al. 2010). Table 1 provides a summary of the COI and WTP estimates and their sources in the reviewed studies.

|
The COI approach only looks at direct costs from morbidity: it sums the resource and opportunity costs from being sick – the treatment cost and lost wages – without considering the disutility associated with pain, discomfort and lower quality of life (also known as reduced QALY). The cost of the preventative action taken to avoid becoming sick is also not taken into account (e.g. the cost of buying an air cleaner). Generally, this approach is used to value the cost of specific health outcomes involving medical care or some form of direct expense.
Therefore, most COI estimates are derived from actual treatment data for specific endpoints from hospital and emergency departments, as shown in Table 2. Those figures range from less than US$100 to close to US$70 000 depending on the endpoint. Some studies include opportunity cost (wages lost) as part of COI. Work days lost are a major factor in morbidity costs, accounting for 36–74% of health costs (Kochi et al. 2010). In addition, there are COI that represent the average cost of illness per exposed person per day that are non-endpoint specific, e.g. US$11.43 in Richardson et al. (2012), US$3.60 in Richardson et al. (2013). The latter study also includes a COI estimate that considers lost leisure time, arriving at a COI of US$20.10. Most of the BenMAP-CE studies apply the software’s in-built COI values (Rittmaster et al. 2006; Rappold et al. 2014; Jones et al. 2016; Parthum et al. 2017). The COI estimates that are per exposed person (often obtained by survey data) would include individuals who suffered from serious cardiovascular conditions (caused by smoke) and those who purchased a face mask for protection. The latter would not show up in the hospital or Emergency Department (ED) data, which makes it difficult to compare these COI estimates with endpoint-specific COI.

|
In contrast to COI, the WTP of an individual to avoid any negative impact from the fire includes all potential cost. This includes disutility from symptoms and cost of preventative action in addition to, as measured by COI, medical expenditures and lost wages (Richardson et al. 2012). WTP can be derived through revealed preferences (RP) or stated preferences (SP) methods. The former uses market transactions to estimate WTP, the latter usually surveys in which participants express their subjective WTP to prevent adverse endpoints.
The Defensive Behaviour Method (DBM) also known as the averting behaviour method (Grossman 1972) is an RP method, where the individual’s averting and mitigating behaviours (e.g. using a home air cleaner, staying indoors) to reduce symptoms days are taken into account. In the DBM, a utility maximisation model is used to determine where the marginal benefits of reduced time spent sick equals the marginal cost of reduced sick time. The underlying idea is that the individual will not spend more on defensive action than the benefit they receive from it. The marginal cost of reduced sick time is determined by dividing the average cost of the defensive action (e.g. cost of an air cleaner) by the incremental effect of the defensive action (e.g. the effect of an air cleaner to reduce symptoms by 1 day), which is derived statistically.
Richardson et al. (2013) used DBM and the contingent valuation method (CVM) to determine the WTP of reducing symptom days by 1 day for the 2009 California Station fire. For CVM, an SP method, individuals affected by wildfire smoke are explicitly asked about their WTP to reduce the symptom days their household experienced by x%. Jones et al. (2016) also applied DBM based on the approach by Richardson et al. (2012).
Another way to derive WTP is the life satisfaction approach or subjective wellbeing approach (SWB), which is increasingly applied in various contexts (National Research Council 2014). Jones (2017, 2018) took this approach.
This approach involves taking reported subjective estimates of life satisfaction and explaining them with socioeconomic variables including income level and the variable of interest, here environmental conditions (smoke), geographic location and health status. This approach requires fewer assumptions regarding the rationality of individuals (Levinson 2012) compared with DBM and CVM, and instead considers surveys of SWB as empirical approximations for individual utility (Jones 2018). To isolate the effect of wildfire smoke on SWB, it is necessary to identify locations where smoke plumes coincide with the survey date (or occurred shortly before the survey date). To calculate WTP to avoid a smoke-induced health effect, the marginal rate of substitution (MRS) between income and health status induced by a 1-day increase in smoke exposure is determined. This equals the amount of income compensation required to exactly offset a utility decrement from experiencing 1 additional day of wildfire smoke-induced health effects (Jones 2018).
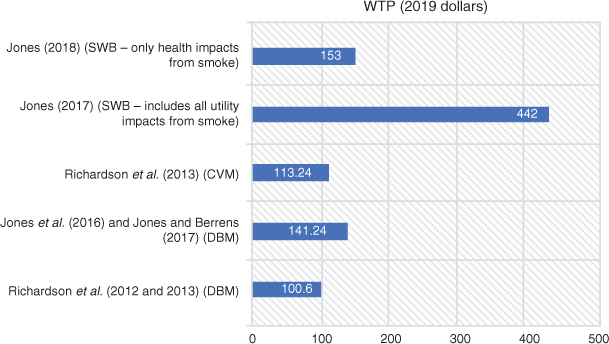
Jones (2017) and Jones (2018) both use the US Behavioural Risk Factor Surveillance System data (2006–10); however, the latter study tries to isolate the negative impacts on SWB from wildfire smoke due to health-related impacts only (WTP of $153). Jones’ (2017) WTP estimate of $447 includes all negative impacts on SWB from wildfire smoke (health-related, lost amenity values, changes in ecosystem services, visibility). The differences in results suggest that health costs are a significant portion but only a part of the total cost individuals experience from wildfire smoke exposure.
Few studies so far have estimated the more comprehensive WTP for wildfire morbidity shown in Fig. 1: using DBM, Richardson et al. (2012, 2013) estimated US$100.6 and Jones et al. (2016) and Jones and Berrens (2017) estimated US$141.24 to reduce symptoms by 1 day.
|
Richardson et al. (2013) provide the only CVM WTP estimate, with US$113.24 and Jones (2017, 2018) determined WTP with the life satisfaction approach as US$442 and 153 respectively. None of these estimates are endpoint-specific. This is challenging given that, for instance, the disutility from cardiac arrest is likely different from an asthma attack. However, it is noteworthy that all of the measures are relatively close (apart from Jones 2017, as explained above), which can help to contextualise costs across fire and build an evidence base for benefit transfer. In a benefit transfer, estimated values from one or more studies are applied to an unstudied location.
Even though WTP clearly covers a much greater range of the costs, a COI approach is usually much simpler to implement because far fewer variables need to be determined and the data are more readily available. It is therefore not surprising that most studies looked at COI and very few studies applied WTP for a reduction in health damages; however, WTP values can be up to 30 times greater than the most frequently used COI estimates and five times larger than comprehensive COI estimates (Richardson et al. 2013).
A way to relate WTP and COI estimates are WTP : COI ratios as recommended and derived by Richardson et al. (2013), in other words, multiplying study-specific COI by the ratio to get an estimated WTP. This makes benefit transfer feasible without having to engage in implementing the previously discussed CVM, DBM or life satisfaction approach. However, the chosen WTP : COI ratio needs to be relevant for the particular location or wildfire episode.
Differences in results not only arise from the choice of costing approach but also from the presentation of results: estimates can be in totals or per person, with the former being affected by location (low- v. high-population areas), and whether the study analysed a single wildfire v. multiple fires, or events over multiple years. Table 2 provides an overview of the analysed fires, the considered endpoints, whether BenMAP-CE was used and aggregate results for the studies where applicable.
BenMAP-CE
BenMAP-CE is open-source Windows-based software created by the EPA. First developed in 2003 to analyse national-scale air quality policies, the proprietary version was replaced by an open-source tool in December 2013 named BenMAP-Community Edition. It allows the user to estimate economic benefits and cost to health due to air quality changes. Its main use has been in the assessment of urban air policy benefits. Studies include both local and regional analyses in the United States but also work elsewhere, mainly in China. The former include work by Fann et al. (2011) on air quality policy, health benefits and inequality; by Nowak et al. (2013) on the effect of tree removal on PM2.5 and associated health effects; and Kheirbek et al. (2013) on PM2.5 and ozone impacts in New York City, among many others.
Douglass (2008), in a study from the grey literature, was the first to employ BenMAP-CE to determine health costs of wildfires in Washington, Idaho and Oregon. Five of the 12 studies on the economic health cost from wildfires have used BenMAP-CE since 2008, a sign of its increasing importance for this type of analysis. Jones et al. (2016) link this to its potential to estimate economic impacts of various changes in air quality, whether positive or negative, which until this point ‘was not easy to do in a systematic and controlled way’.
In the case of wildfires, costs are looked at instead of benefits. As a first step, the user imports air quality data for a specific location and population. Then, to estimate the health impacts of the air quality changes, dose–response (DR) functions are used to estimate the incidence rate. In this context, a DR function describes the magnitude of the health impact as a result of a certain increase in the pollutant relative to a baseline incidence. The estimated change in incidences is then multiplied by a given dollar amount using a COI or WTP value. The output can be represented numerically, but BenMAP-CE can also be used as a geographic information system (GIS) to map the calculated data. The following sections discuss the key aspects of using BenMAP-CE for smoke impacts as a guide to readers who are interested in applying the software for this context.
Air pollution exposure estimates
Most USA studies use freely available air quality data from a variety of EPA monitoring sites, which are located across the country but tend to be concentrated in urban areas. Jones and Berrens (2017), Jones et al. (2016) and Moeltner et al. (2013) used the readily available AQS (Air Quality Systems) and IMPROVE (Interagency Monitoring of Protected Visual Environments) monitored data (www.epa.gov/outdoor-air-quality-data/interactive-map-air-quality-monitors, accessed 19 August 2020).
AQS is the catch-all term for the ambient air pollution data collected by the EPA, state and local agencies from thousands of monitors (EPA 2019b). In contrast to this, IMPROVE stations only collect air quality data in some of the USA’s protected areas. Therefore, the location of the study will determine the data source used. For example, when looking at urban areas, AQS will be of more use. All studies cited the ease of accessibility of the data available on the EPA’s website. Jones and Berrens (2017) in a large-scale study of the western US looked at 146 AQS sites and 101 IMPROVE sites. Jones et al. (2016) used data from seven monitoring stations located in Albuquerque’s metropolitan area from EPA AQS.
Some studies have used modelled data as opposed to monitoring data including Fann et al. (2018b) and Rappold et al. (2014) who used the Community Multiscale Air Quality model (a suite of programs from the EPA for conducting air quality monitoring simulations) and NOAA’s Smoke Forecasting System (SFS) respectively to estimate emissions with and without wildland fires, for prescribed fires as well as agricultural fires.
Smoke event periods and smoke event counterfactual
In a second step, the smoke event period and an accurate location need to be determined to ensure that the extent of the estimated health impacts is correct. Studies must be careful not to overestimate the geographic extent in BenMAP-CE, thereby including too many people and vice versa. This component can be made as complex or a simple as required by the study.
Wind direction can be taken into account (Moeltner et al. 2013), or the use of smoke dispersion models, but it is also possible to use a simpler approach such as a maximum distance, e.g. an 80-km radius from the monitoring station (Jones et al. 2016). One must also consider the influence of several wildfires occurring in one region at the same time, which may lead to an overestimation of the impact of one specific fire.
Studies vary significantly in their approach: Jones and Berrens (2017) used the NOAA/NESDIS hazard mapping system in combination with the location of monitoring sites to look for intersection, i.e. where the visual smoke from satellite pictures correlated with elevated levels of the pollutant from monitoring stations. Specifically, they defined a smoke event day as daily average PM2.5 levels of more than the 99th percentile of daily average readings per monitor site over the previous 5 years. The same protocol was followed by Jones et al. (2016). Both studies describe this methodology as a conservative estimate as they are potentially missing many subtle smoke impacts. Rappold et al. (2014) examined the 2008 Evans Road fire in eastern North Carolina where cumulative exposure to PM2.5 over the study period exceeded 50 μg m−3. Smoke exposure estimates were gained using the NOAA’s SFS, which uses the BlueSky smoke modelling framework to forecast the smoke event periods and the smoke event counterfactual. So far, there is no consistent method used across studies, with many studies weighing up the trade-off between better representation of the smoke event period and the complexity and difficulty of the method.
Dose–response functions
The choice of the DR function plays an important role as it creates the explicit link between the smoke and health outcomes incidences. BenMAP-CE’s library contains ~40 DR functions, which are specific to urban air quality only; however, the software does have the capability to import other functions.
Results vary significantly between wildfire- and non-wildfire- (i.e. urban air quality) specific DR functions. Differences stem from chemical differences in smoke, the public’s perceptions of health risks and associated averting behaviour (Liu et al. 2017). Also, urban air quality DR functions generally describe relationships for lower (PM) pollutant concentrations but long duration of exposure as opposed to wildfire-specific DR with high PM pollutant concentrations for a short period of exposure.
Wegesser et al. (2009) showed that wildfire ‘PM was much more toxic to the lung on equal weight basis than PM collected from ambient air’. Related to this, Jones et al. (2016) found wildfire-specific DR functions produced considerably higher morbidity costs than those that used in urban air studies: they compared different DR functions and found COI for their analysis to be US$74 000 using urban DR functions and US$111 000 using wildfire DR functions, nearly 70% more. Emergency room asthma costs were a staggering 2535% higher and hospital admission for all respiratory costs were also 44% higher than using respective urban air quality DR functions.
BenMAP-CE studies using urban DR functions internal to BenMAP-CE were Douglass (2008), Rappold et al. (2014) and Jones et al. (2016). Studies that used wildfire-specific functions were Jones and Berrens (2017) and for some functions Jones et al. (2016). Jones and Berrens (2017) used six wildfire-specific DR functions from the health literature covering emergency room (ER) asthma visits and respiratory visits (based on Reid et al. 2016), hospital admissions for pneumonia, hospital admissions for all respiratory illnesses, hospital admissions for asthma from Delfino et al. (2009) and mortality functions from Johnston et al. (2012). The wildfire-specific DR functions used in Jones et al. (2016) were also from Delfino et al. (2009) and Resnick et al. (2015), which are specific to the western US. In a variation, Rappold et al. (2014) used a state-wide tracking tool to record daily ED visits and therefore incidence rates in North Carolina.
As Jones et al. (2016) state, the choice of DR function, ‘is an unsettled methodological issue […] which is likely to be confronted by researchers estimating the costs of a wildfire event’. The lack of internal wildfire-specific DR functions in BenMAP-CE is a shortcoming of the software. It requires analysists who choose to use wildfire-specific functions to engage with the relevant and specialised health literature to identify the appropriate information and enter it into BenMAP-CE. To help this process, Reid et al. (2016) analysed 103 wildfire-specific DR functions for their suitability and bias in a review of recent literature. Their review represents a good resource for future researchers looking for wildfire-specific DR functions.
Economic values
In a next step, BenMAP-CE uses the Aggregate, Pool and Value (APV) configuration to specify the geographic level at which the results are calculated, how the incidence results are combined or pooled and which economic value to assign.
This involves BenMAP-CE applying VSL, WTP or COI values for estimated incidence levels for various endpoints based on the chosen DR functions. For VSL, even though BenMAP-CE offers the central VSL value of US$7.4 million (2006 dollars), this can be adjusted to account for inflation and changes in income (we expect VSL to increase with income). This leads to somewhat different VSL values even for studies that all use BenMAP-CE, as shown in Table 2.
For morbidity, although BenMAP-CE includes various estimates, certain endpoints only have inbuilt COI (based on actual treatment costs and wages lost) applicable to them. As with the health impact functions, however, it is possible to import the WTP or COI values. Studies in this area are therefore split between those that use internal and external values in BenMAP-CE. For example, to value premature deaths, Fann et al. (2018b) used the VSL estimate internal to BenMAP-CE from the EPA as well as for hospital admissions from respiratory symptoms, whereas Jones and Berrens (2017) used their own derived WTP value of US$141.24 to value morbidity impacts while the VSL from the EPA was used to value mortality. By using WTP or COI values external to BenMAP-CE, a more reliable final estimate can be made as these functions can be taken from literature that is more specific to the study’s context.
Discussion
The literature on adverse health effects from wildfires during the past 10 years has been shaped by changes in wildfire occurrences but also by the availability of new tools for analysis. This is particularly true for the western United States: the increasing incidence of wildfires in this part of the world, related among other things to climate change and a growing urban–wildland interface, has heightened interest in this type of research, which is reflected by the growing number of increasingly sophisticated publications in the field. The availability of BenMAP-CE has made the analysis more accessible for researchers from different disciplines. The software is easy to access and non-technical, with manuals and example applications available online.
Nevertheless, the diversity in estimates at all levels, the consideration of single or multiple wildfires with differing geographic extents and varying population density make direct comparison of studies difficult.
Although mortality usually only accounts for a small percentage of total number of incidences in studies, the high VSL makes this impact account for most of the costs in studies that assess mortality impacts. In our review, we found that all studies applied the concept of VSL to determine the cost of premature mortality and all of the studies used EPA (or the equivalent organisation outside the United States) estimates from different regulatory contexts. Despite this, the range of values is considerable, which makes comparison tricky. We suggest that all studies apply the current central EPA estimate of the VSL of US$9.38 (2019 dollars) and report lower and upper values that are study-appropriate (e.g. considering different age groups). This would at a minimum allow a comparison of the central VSL estimates for each study.
We found that the next largest health-related costs stem from working days lost and then respiratory morbidity endpoints relying on COI estimates. COI for morbidity are also highly diverse, in particular when comparing actual treatment cost and average cost per exposed person. Indeed, even treatment cost for similar endpoints may vary from hospital to hospital and certainly from country to country. The meta-analysis type approach taken in BenMAP-CE where a distribution based on several studies is derived may be well suited to accommodate geographic cost differences and increase comparability between studies.
Although there are so far only four studies that estimated (non-endpoint specific) WTP for avoiding health impacts from wildfire smoke, their results are encouraging as they all arrive at central estimates between US$100 and 150 employing three different approaches (DBM, CVM and SWB). In general, an increased use of WTP estimates for better decision-making would be advantageous and, as such, a more diverse range is needed across different demographic and socioeconomic groups as well as for specific endpoints in order to gain a greater understanding of the impacts of wildfire.
To increase validity of BenMAP-CE results for wildfires, the software should include wildfire WTP estimates. The literature so far provides four suitable WTP estimates that could be permanently included in BenMAP-CE (Richardson et al. 2012; Richardson et al. 2013; Jones 2018) and more could be added as the research advances.
In addition, it would be helpful if BenMAP-CE included more wildfire-specific features that still need to be entered or adjusted manually by the user. The calculation of economic health cost from wildfires (as opposed to urban air quality changes) requires identifying the relevant epidemiological literature for suitable DR functions and the appropriate economic literature for WTP or COI estimates. However, even with the appropriate DR functions, owing to the analysis being focused on relatively low but long-term pollutant exposure in the context of urban air quality, the output is calculated as changes over an entire year, which can bias results.
In addition, there exists no standardised methodology for estimating smoke event periods and areas and BenMAP-CE in its current form does not allow an easy estimation of a short-term smoke event period (from a few weeks to a few months, the usual duration of a fire).
By providing more wildfire-specific parameters in BenMAP-CE, the research of impact studies will become easier to carry out, more standardised and comparable in the future. This may allow us to better understand the overall trends in the economic costs of the adverse health impacts from wildfire smoke and make this field of research more accessible.
Assuming a sufficient number of studies on the economic health cost of wildfire smoke will be published in the next few years, a meta-analysis of those studies may be feasible (Van Houtven 2008). The resulting WTP values could be used for benefit transfer (Johnston et al. 2015), for wider application in the economic impact analysis of wildfires. Alternatively, more studies such as that of Richardson et al. (2013) that derive WTP : COI ratios may be applied for benefit transfers. Indeed, benefit transfer values may bridge the gap between complex original studies and the shortcomings of BenMAP-CE studies.
Conclusion
In this literature review, we have provided a systematic overview of studies on the economic health-related cost from wildfires since 2006. We showed that most studies have a common approach of estimating health cost by starting with determining air pollution from fires, estimating increased morbidity and mortality incidences due to the air pollution and finally attaching economic values to those additional incidences. However, comparisons between studies are limited by the many choices that need to be made in the analysis process and that lead to results that differ significantly between studies.
Although there is still great potential in deriving more consistent health cost from wildfires, it is clear, however, that health-related cost from wildfires are always substantial and often proportionally the highest among all types of costs from wildfires ahead of suppression cost: average yearly federal suppression cost between 2006 and 2018 amounted to US$1.78 billion (National Interagency Fire Center 2020). Fann et al. (2018a) found the yearly health cost of short-term exposure to wildfire smoke across the USA to be between US$13 and 24 billion and between US$90 and 154 billion per year for long-term exposure between 2008 and 2012. This certainly suggests that from a cost–benefit point of view, the cost of suppression spending is justified by the potential (further) damage avoided from wildfire smoke. However, the better alternative to accepting high suppression cost may be to think about interventions (masks, air cleaners) that may decrease the health costs from wildfire.
This is where research can also contribute. As far as we know, thus far, there are no economic assessments of health costs of prescribed fires, which would constitute an important component of the cost–benefit analysis of fire management regimes. In addition, tools like BenMAP-CE allow us to go beyond impacts by analysing the benefits (avoided damage), for example of increasing awareness among the public about the dangers of wildfire smoke and putting in place interventions to reduce smoke impacts. Studies like Rappold et al. (2014) and Parthum et al. (2017) have already begun to make headway here and we believe that future research should focus, in addition to improving impact estimates, on the economic benefits and costs of mitigating the effects of the high indirect costs from smoke as demonstrated by the studies analysed in the present literature review.
Conflicts of interest
The authors declare no conflicts of interest.
Acknowledgements
We acknowledge the funding support of the USDA Forest Service Pacific Northwest Research Station under agreement no. 18-CR-11261955–017 for this research.
References
Abatzoglou JT, Williams A (2016) Impact of anthropogenic climate change on wildfire across western US forests. Proceedings of the National Academy of Sciences of the United States of America 113, 11770–11775.| Impact of anthropogenic climate change on wildfire across western US forests.Crossref | GoogleScholarGoogle Scholar | 27791053PubMed |
Adetona O, Reinhardt T, Domitrovich J, Broyles G, Adetona AM, Kleinman MT, Kleinman RD, Roger DO, Naher LP (2016) Review of the health effects of wildland fire smoke on wildland firefighters and the public. Inhalation Toxicology 28, 95–139.
| Review of the health effects of wildland fire smoke on wildland firefighters and the public.Crossref | GoogleScholarGoogle Scholar | 26915822PubMed |
Alberini A, Krupnick A (2000) Cost-of-illness and willingness-to-pay estimates of the benefits of improved air quality: evidence from Taiwan. Land Economics 76, 37–53.
| Cost-of-illness and willingness-to-pay estimates of the benefits of improved air quality: evidence from Taiwan.Crossref | GoogleScholarGoogle Scholar |
Bossioli E, Tombrou M, Karali A, Dandou A, Paronis D, Sofiev M (2012) Ozone production from the interaction of wildfire and biogenic emissions: a case study in Russia during spring 2006. Atmospheric Chemistry and Physics 12, 7931–7953.
| Ozone production from the interaction of wildfire and biogenic emissions: a case study in Russia during spring 2006.Crossref | GoogleScholarGoogle Scholar |
Cândido da Silva AM, Moi GP, Mattos I, de Souza Haon S (2014) Low birthweight at term and the presence of fine particulate matter and carbon monoxide in the Brazilian Amazon: a population-based retrospective cohort study. BMC Pregnancy and Childbirth 14, 309
| Low birthweight at term and the presence of fine particulate matter and carbon monoxide in the Brazilian Amazon: a population-based retrospective cohort study.Crossref | GoogleScholarGoogle Scholar | 25193316PubMed |
Cascio WE (2018) Wildland fire smoke and human health. The Science of the Total Environment 624, 586–595.
| Wildland fire smoke and human health.Crossref | GoogleScholarGoogle Scholar | 29272827PubMed |
Delfino RJ, Brummel S, Wu J, Stern H, Ostro B, Lipsett M, Winter A, Street DH, Zhang L, Tjoa T, Gillen DL (2009) The relationship of respiratory and cardiovascular hospital admissions to the southern Californian wildfires of 2003. Occupational and Environmental Medicine 66, 189–197.
| The relationship of respiratory and cardiovascular hospital admissions to the southern Californian wildfires of 2003.Crossref | GoogleScholarGoogle Scholar | 19017694PubMed |
Doerr SH, Santin C (2016) Global trends in wildfire and its impacts: perception versus realities in a changing world. Philosophical Transactions of the Royal Society of London. Series B, Biological Sciences 371, 20150345
| Global trends in wildfire and its impacts: perception versus realities in a changing world.Crossref | GoogleScholarGoogle Scholar | 28080979PubMed |
Douglass R (2008) Quantification of the health impacts associated with fine particulate matter due to wildfires. Masters project thesis, Nicholas School of the Environment and Earth Sciences of Duke University. Available at http://wildfire-economics.org/Library/Douglass_2008.pdf [Verified September 2018].
EPA (2012) Regulatory impact assessment for the PM NAAQS RIA. Available at https://www3.epa.gov/ttnecas1/regdata/RIAs/PMRIACombinedFile_Bookmarked.pdf [Verified 20 August 2020]
EPA (2018a) Particulate matter (PM basics). Available at: https://www.epa.gov/pm-pollution/particulate-matter-pm-basics [Verified September 2018].
EPA (2018b) Environmental Benefits Mapping and Analysis Program – Community Edition (BenMAP-CE). Available at https://www.epa.gov/benmap [Verified October 2018].
EPA (2019a) Mortality risk valuation. Available at https://www.epa.gov/environmental-economics/mortality-risk-valuation [Verified 25 May 2019].
EPA (2019b) Interactive map of air quality monitors. Available at https://www.epa.gov/outdoor-air-quality-data/interactive-map-air-quality-monitors [Verified 27 May 2019].
Fann N, Roman HA, Fulcher CM, Gentile MA, Hubbell BJ, Wesson K, Levy JI (2011) Maximizing health benefits and minimizing inequality: incorporating local‐scale data in the design and evaluation of air quality policies. Risk Analysis 31, 908–922.
| Maximizing health benefits and minimizing inequality: incorporating local‐scale data in the design and evaluation of air quality policies.Crossref | GoogleScholarGoogle Scholar | 21615761PubMed |
Fann N, Alman B, Broome RA, Morgan GG, Johnston FH, Pouliot G, Rappold AG (2018a) The health impacts and economic value of wildland fire episodes in the US: 2008–2012. Science of the Total Environment 610–611, 802–809.
| The health impacts and economic value of wildland fire episodes in the US: 2008–2012.Crossref | GoogleScholarGoogle Scholar | 28826118PubMed |
Fann N, Coffman E, Timin B, Kelly JT (2018b) The estimated change in the level and distribution of PM2.5 attributable health impacts in the United States 2005–2014. Environmental Research 167, 506–514.
| The estimated change in the level and distribution of PM2.5 attributable health impacts in the United States 2005–2014.Crossref | GoogleScholarGoogle Scholar | 30142626PubMed |
Faustini A, Alessandrini ER, Pey J, Perez N, Samoli E, Querol X, Cadum E, Perrino C, Ostro B, Ranzi A, Sunyer J (2015) Short-term effects of particulate matter on mortality during forest fires in southern Europe: results of the MEDPARTICLES project. Occupational and Environmental Medicine 72, 323–329.
| Short-term effects of particulate matter on mortality during forest fires in southern Europe: results of the MEDPARTICLES project.Crossref | GoogleScholarGoogle Scholar | 25691696PubMed |
Flannigan M, Cantin AS, De Groot WJ, Wotton M, Newbery A, Gowman LM (2013) Global wildland fire severity in the 21st century. Forest Ecology and Management 294, 54–61.
| Global wildland fire severity in the 21st century.Crossref | GoogleScholarGoogle Scholar |
Fried JS, Gilless JK, Riley WJ, Moody TJ, De Blas CS, Hayhoe K, Moritz M, Stephens S, Torn M (2008) Predicting the effect of change on wildfire behavior and initial attack success. Climatic Change 87, 251–264.
| Predicting the effect of change on wildfire behavior and initial attack success.Crossref | GoogleScholarGoogle Scholar |
Grossman M (1972) On the concept of health capital and the demand for health. Journal of Political Economy 80, 223–255.
| On the concept of health capital and the demand for health.Crossref | GoogleScholarGoogle Scholar |
Haikerwal A, Akram M, Del Monaco A, Smith K, Sim MR, Meyer M, Tonkin AM, Abramson MJ, Dennekamp M (2015) Impact of fine particulate matter (PM2.5) exposure during wildfire on cardiovascular health outcomes. Journal of the American Heart Association 4, e001653
| Impact of fine particulate matter (PM2.5) exposure during wildfire on cardiovascular health outcomes.Crossref | GoogleScholarGoogle Scholar | 26178402PubMed |
Hänninen OO, Salonen RO, Koistinen K, Lanki T, Barregard L, Jantunen M (2009) Population exposure to fine particles and estimated excess mortality in Finland from an eastern European wildfire episode. Journal of Exposure Science & Environmental Epidemiology 19, 414–422.
| Population exposure to fine particles and estimated excess mortality in Finland from an eastern European wildfire episode.Crossref | GoogleScholarGoogle Scholar |
Henderson SB, Brauer M, MacNab YB, Kennedy SM (2011) Three measures of forest fire smoke exposure and their associations with respiratory and cardiovascular outcomes in a population-based cohort. Environmental Health Perspectives 119, 1266–1271.
| Three measures of forest fire smoke exposure and their associations with respiratory and cardiovascular outcomes in a population-based cohort.Crossref | GoogleScholarGoogle Scholar | 21659039PubMed |
Holstius D, Reid C, Jesdale B, Morello-Frosch R (2012) Birth weight following pregnancy during the 2003 southern California wildfires. Environmental Health Perspectives 120, 1340–1345.
| Birth weight following pregnancy during the 2003 southern California wildfires.Crossref | GoogleScholarGoogle Scholar | 22645279PubMed |
Jaffe DA, Widger NL (2012) Ozone production from wildfires: a critical review. Atmospheric Environment 51, 1–10.
| Ozone production from wildfires: a critical review.Crossref | GoogleScholarGoogle Scholar |
Jaffe DA, O’Neill SM, Larkin NK, Holder AL, Peterson DL, Halofsky JE, Rappold AG (2020) Wildfire and prescribed burning impacts on air quality in the United States. Journal of the Air & Waste Management Association 70, 583–615
Johnston F, Hanigan I, Henderson S, Morgan G, Bowman D (2011) Extreme air pollution from bushfires and dust storms and their association with mortality in Sydney, Australia 1994–2007. Environmental Research 111, 811–816.
| Extreme air pollution from bushfires and dust storms and their association with mortality in Sydney, Australia 1994–2007.Crossref | GoogleScholarGoogle Scholar | 21601845PubMed |
Johnston FH, Henderson SB, Chen Y, Randerson JT, Marlier M, DeFries RS, Kinney P, Bowman DM, Brauer M (2012) Estimated global mortality attributable to smoke from landscape fire. Environmental Health Perspectives 120, 695–701.
| Estimated global mortality attributable to smoke from landscape fire.Crossref | GoogleScholarGoogle Scholar | 22456494PubMed |
Johnston RJ, Rolfe J, Rosenberger RS, Brouwer R (Eds) (2015) ‘Benefit transfer of environmental and resource values.’ In ‘The economics of non-market goods and resources, Volume 14’. (Series Ed. IJ Bateman).’ (Springer: New York, NY, USA)
Jones BA (2017) Are we underestimating the economic costs of wildfire smoke? An investigation using the life satisfaction approach. Journal of Forest Economics 27, 80–90.
| Are we underestimating the economic costs of wildfire smoke? An investigation using the life satisfaction approach.Crossref | GoogleScholarGoogle Scholar |
Jones BA (2018) Willingness to pay estimates for wildfire smoke health impacts in the US using the life satisfaction approach. Journal of Environmental Economics and Policy 7, 403–419.
| Willingness to pay estimates for wildfire smoke health impacts in the US using the life satisfaction approach.Crossref | GoogleScholarGoogle Scholar |
Jones BA, Berrens RP (2017) Application of an original wildfire smoke health cost benefits transfer protocol to the western US, 2005–2015. Environmental Management 60, 809–822.
| Application of an original wildfire smoke health cost benefits transfer protocol to the western US, 2005–2015.Crossref | GoogleScholarGoogle Scholar | 28905098PubMed |
Jones BA, Thatcher JA, Chermak JM, Berrens RP (2016) Wildfire smoke health costs: a methods case study for a south-western US ‘mega-fire’. Journal of Environmental Economics and Policy 5, 181–199.
| Wildfire smoke health costs: a methods case study for a south-western US ‘mega-fire’.Crossref | GoogleScholarGoogle Scholar |
Kang C-M, Gold D, Koutrakis P (2014) Downwind O3 and PM2.5 speciation during the wildfires in 2002 and 2010. Atmospheric Environment 95, 511–519.
| Downwind O3 and PM2.5 speciation during the wildfires in 2002 and 2010.Crossref | GoogleScholarGoogle Scholar |
Kheirbek I, Wheeler K, Walters S, Kass D, Matte T (2013) PM2.5 and ozone health impacts and disparities in New York City: sensitivity to spatial and temporal resolution. Air Quality, Atmosphere & Health 6, 473–486.
| PM2.5 and ozone health impacts and disparities in New York City: sensitivity to spatial and temporal resolution.Crossref | GoogleScholarGoogle Scholar |
Kochi I, Donovan GH, Champ PA, Loomis JB (2010) The economic cost of adverse health effects from wildfire smoke exposure: a review. International Journal of Wildland Fire 19, 803–817.
| The economic cost of adverse health effects from wildfire smoke exposure: a review.Crossref | GoogleScholarGoogle Scholar |
Kochi I, Champ PA, Loomis JB, Donavan GH (2012) Valuing mortality impacts of smoke exposure from major southern California wildfires. Journal of Forest Economics 18, 61–75.
| Valuing mortality impacts of smoke exposure from major southern California wildfires.Crossref | GoogleScholarGoogle Scholar |
Kochi I, Champ PA, Loomis JB, Donovan GH (2016) Valuing morbidity effects of wildfire smoke exposure from the 2007 southern California wildfires. Journal of Forest Economics 25, 29–54.
| Valuing morbidity effects of wildfire smoke exposure from the 2007 southern California wildfires.Crossref | GoogleScholarGoogle Scholar |
Larsen AE, Reich BJ, Ruminiski M, Rappold AG (2018) Impacts of fire smoke plumes on regional air quality 2006–2013. Journal of Exposure Science & Environmental Epidemiology 28, 319–327.
| Impacts of fire smoke plumes on regional air quality 2006–2013.Crossref | GoogleScholarGoogle Scholar |
Lee TS, Falter K, Meyer P, Mott J, Gwynn C (2009) Risk factors associated with clinic visits during the 1999 forest fires near the Hoopa Valley Indian Reservation, California, USA. International Journal of Environmental Health Research 19, 315–327.
| Risk factors associated with clinic visits during the 1999 forest fires near the Hoopa Valley Indian Reservation, California, USA.Crossref | GoogleScholarGoogle Scholar | 19629821PubMed |
Levinson A (2012) Valuing public goods using happiness data: the case of air quality. Journal of Public Economics 96, 869–880.
| Valuing public goods using happiness data: the case of air quality.Crossref | GoogleScholarGoogle Scholar |
Liu JC, Pereira G, Uhl SA, Bravo MA, Bell ML (2015) A systematic review of the physical health impacts from non-occupational exposure to wildfire smoke. Environmental Research 136, 120–132.
| A systematic review of the physical health impacts from non-occupational exposure to wildfire smoke.Crossref | GoogleScholarGoogle Scholar | 25460628PubMed |
Liu JC, Mickley LJ, Sulprizio MP, Dominici F, Yue X, Ebisu K, Anderson GB, Khan RF, Bravo MA, Bell ML (2016) Particulate air pollution from wildfires in the western US under climate change. Climatic Change 138, 655–666.
| Particulate air pollution from wildfires in the western US under climate change.Crossref | GoogleScholarGoogle Scholar | 28642628PubMed |
Liu J, Wilson A, Mickley LJ, Ebisu K, Sulprizio MP, Wang Y, Peng RD, Yue X, Dominici F, Bell ML (2017) Who among the elderly is most vulnerable to exposure to and health risks of fine particulate matter from wildfire smoke. American Journal of Epidemiology 186, 730–735.
| Who among the elderly is most vulnerable to exposure to and health risks of fine particulate matter from wildfire smoke.Crossref | GoogleScholarGoogle Scholar | 28525551PubMed |
Martin KL, Hanigan IC, Morgan GG, Henderson SB, Johnston FH (2013) Air pollution from bushfires and their association with hospital admissions in Sydney, Newcastle and Wollongong, Australia 1994–2007. Australian and New Zealand Journal of Public Health 37, 238–243.
| Air pollution from bushfires and their association with hospital admissions in Sydney, Newcastle and Wollongong, Australia 1994–2007.Crossref | GoogleScholarGoogle Scholar | 23731106PubMed |
McClure CD, Jaffe DA (2018) US particulate matter air quality improves except in wildfire-prone areas. Proceedings of the National Academy of Sciences of the United States of America 115, 7901–7906.
| US particulate matter air quality improves except in wildfire-prone areas.Crossref | GoogleScholarGoogle Scholar | 30012611PubMed |
Moeltner K, Kim M, Zhu E, Yang W (2013) Wildfire smoke and health impacts: a closer look at fire attributes and their marginal effects. Environmental Economics and Management 66, 476–496.
| Wildfire smoke and health impacts: a closer look at fire attributes and their marginal effects.Crossref | GoogleScholarGoogle Scholar |
Morgan G, Sheppeard V, Khalaj B, Ayyar A, Lincoln D, Jalaludin B, Beard J, Corbett S, Lumley T (2010) Effects of bushfire smoke on daily mortality and hospital admissions in Sydney, Australia. Epidemiology 21, 47–55.
| Effects of bushfire smoke on daily mortality and hospital admissions in Sydney, Australia.Crossref | GoogleScholarGoogle Scholar | 19907335PubMed |
National Interagency Fire Center (2020) Federal firefighting costs (suppression only). Available at https://www.nifc.gov/fireInfo/fireInfo_documents/SuppCosts.pdf [Verified 19 August 2020]
National Research Council (2014) ‘Subjective well-being: measuring happiness, suffering, and other dimensions of experience.’ (National Academies Press: Washington, DC).
National Wildfire Coordinating Group (2018) Glossary of wildfire terminology. Available at https://www.nwcg.gov/publications [Verified 31 October 2018].
Nguyen HD, Trieu T, Cope M, Azzi M, Morgan G (2020) Modelling hazardous reduction burnings and bushfire emission in air quality model and their impacts on health in the greater metropolitan region of Sydney. Environmental Modeling and Assessment
| Modelling hazardous reduction burnings and bushfire emission in air quality model and their impacts on health in the greater metropolitan region of Sydney.Crossref | GoogleScholarGoogle Scholar |
Nowak DJ, Greenfield EJ, Hoehn RE, Lapoint E (2013) Carbon storage and sequestration by trees in urban and community areas of the United States. Environmental Pollution 178, 229–236.
| Carbon storage and sequestration by trees in urban and community areas of the United States.Crossref | GoogleScholarGoogle Scholar | 23583943PubMed |
Parthum B, Pindilli E, Hogan D (2017) Benefits of the fire mitigation ecosystem service in the Great Dismal Swamp National Wildfire Refuge, Virginia, USA. Journal of Environmental Management 203, 375–382.
| Benefits of the fire mitigation ecosystem service in the Great Dismal Swamp National Wildfire Refuge, Virginia, USA.Crossref | GoogleScholarGoogle Scholar | 28810209PubMed |
Radeloff VC, Helmers DP, Kramer HA, Mockrin MH, Alexandre PM, Van Butsic AB, Hawbaker TJ, Syphard SM, Stewart AD (2018) Rapid growth of the US wildland–urban interface raises the wildfire risk. Proceedings of the National Academy of Sciences of the United States of America 115, 3314–3319.
| Rapid growth of the US wildland–urban interface raises the wildfire risk.Crossref | GoogleScholarGoogle Scholar | 29531054PubMed |
Rappold A, Stone S, Cascio W, Neas LM, Kilaru VJ, Carraway MS, Szykman JJ, Ising A, Cleve WE, Meredith JT, Vaughan-Batten H, Deyneka L, Devlin RB (2011) Peat bog wildfire smoke exposure in rural North Carolina is associated with cardiopulmonary emergency department visits assessed through syndromic surveillance. Environmental Health Perspectives 119, 1415–1420.
| Peat bog wildfire smoke exposure in rural North Carolina is associated with cardiopulmonary emergency department visits assessed through syndromic surveillance.Crossref | GoogleScholarGoogle Scholar | 21705297PubMed |
Rappold AG, Fann NL, Crooks J, Huang J, Cascio WE, Devlin RB, Diaz-Sanchez D (2014) Forecast-based interventions can reduce the health and economic burden of wildfires. Environmental Science & Technology 48, 10571–10579.
| Forecast-based interventions can reduce the health and economic burden of wildfires.Crossref | GoogleScholarGoogle Scholar |
Reid CE, Brauer M, Johnston FH, Jerrett M, Balmes JR, Elliott CT (2016) Critical review of health impacts of wildfire smoke exposure. Environmental Health Perspectives 124, 1334–1343.
| Critical review of health impacts of wildfire smoke exposure.Crossref | GoogleScholarGoogle Scholar | 27082891PubMed |
Reisen F, Duran SM, Flannigan M, Elliott C, Rideout K (2015) Wildfire smoke and public health risk. International Journal of Wildland Fire 24, 1029–1044.
| Wildfire smoke and public health risk.Crossref | GoogleScholarGoogle Scholar |
Resnick A, Woods B, Krapfl H, Toth B (2015) Health outcomes associated with smoke exposure in Albuquerque, New Mexico, during the 2011 Wallow fire. Journal of public health management and practice 21, S55–S61.
| Health outcomes associated with smoke exposure in Albuquerque, New Mexico, during the 2011 Wallow fire.Crossref | GoogleScholarGoogle Scholar | 25621447PubMed |
Richardson L, Loomis JB, Champ PA (2013) Valuing morbidity from wildfire smoke exposure: a comparison of revealed and stated preference techniques. Land Economics 89, 76–100.
| Valuing morbidity from wildfire smoke exposure: a comparison of revealed and stated preference techniques.Crossref | GoogleScholarGoogle Scholar |
Richardson LA, Champ PA, Loomis JB (2012) The hidden cost of wildfires: economic valuation of health effects of wildfire smoke exposure in southern California. Journal of Forest Economics 18, 14–35.
| The hidden cost of wildfires: economic valuation of health effects of wildfire smoke exposure in southern California.Crossref | GoogleScholarGoogle Scholar |
Rittmaster R, Adamowicz W, Amiro B, Pelletier R (2006) Economic analysis of health effects from forest fires. Canadian Journal of Forest Research 36, 868–877.
| Economic analysis of health effects from forest fires.Crossref | GoogleScholarGoogle Scholar |
Shaposhnikov D, Revich B, Bellander T, Bedada GB, Bottai M, Kharkova T, Kvasha E, Lezina E, Lind T, Semutnikova E, Pershagen G (2014) Mortality related to air pollution with the Moscow heat wave and wildfire of 2010. Epidemiology 25, 359–364.
| Mortality related to air pollution with the Moscow heat wave and wildfire of 2010.Crossref | GoogleScholarGoogle Scholar | 24598414PubMed |
Spracklen DV, Mickley LJ, Logan JA, Hudman RC, Yevich R, Flannigan MD, Westerling AL (2009) Impacts of climate change from 2000 to 2050 on wildfire activity and carbonaceous aerosol concentrations in the western United States. Journal of Geophysical Research, D, Atmospheres 114, D20301
| Impacts of climate change from 2000 to 2050 on wildfire activity and carbonaceous aerosol concentrations in the western United States.Crossref | GoogleScholarGoogle Scholar |
US Forest Service (2018) The Forest Service and wildland fire. Available at https://www.fs.fed.us/wildlandfire/ [Verified September 2018].
Van Houtven G (2008) Methods for meta-analysis of Willingness to Pay data. PharmacoEconomics 26, 901–910.
| Methods for meta-analysis of Willingness to Pay data.Crossref | GoogleScholarGoogle Scholar | 18850760PubMed |
Wegesser TC, Pinkerton KE, Last JA (2009) California wildfires of 2008: coarse and fine particulate matter toxicity. Environmental Health Perspectives 117, 893–897.
| California wildfires of 2008: coarse and fine particulate matter toxicity.Crossref | GoogleScholarGoogle Scholar | 19590679PubMed |
Yao J, Eyamie J, Henderson SB (2016) Evaluation of a spatially resolved forest fire smoke model for population-based epidemiologic exposure and assessment. Journal of Exposure Science & Environmental Epidemiology 26, 233–240.
| Evaluation of a spatially resolved forest fire smoke model for population-based epidemiologic exposure and assessment.Crossref | GoogleScholarGoogle Scholar |
Youssouf H, Liousse C, Roblou L, Assamoi EM, Salonen RO, Maesano C, Banerjee S, Annesi-Maesano I (2014) Non-Accidental Health Impacts of Wildfire Smoke. International Journal of Environmental Research and Public Health 11, 11772–11804.
| Non-Accidental Health Impacts of Wildfire Smoke.Crossref | GoogleScholarGoogle Scholar | 25405597PubMed |