

Quantifying surface severity of the 2014 and 2015 fires in the Great Slave Lake area of Canada
Nancy H. F. French A C , Jeremy Graham A , Ellen Whitman B and Laura L. Bourgeau-Chavez A
A Michigan Tech Research Institute, Michigan Technological University, Ann Arbor, MI 48105, USA.
B Natural Resources Canada, Canadian Forest Service, Edmonton, AB T6H 3S5, Canada.
C Corresponding author. Email: nhfrench@mtu.edu
International Journal of Wildland Fire 29(10) 892-906 https://doi.org/10.1071/WF20008
Submitted: 13 January 2020 Accepted: 10 July 2020 Published: 25 August 2020
Journal Compilation © IAWF 2020 Open Access CC BY-NC-ND
Abstract
The focus of this paper was the development of surface organic layer severity maps for the 2014 and 2015 fires in the Great Slave Lake area of the Northwest Territories and Alberta, Canada, using multiple linear regression models generated from pairing field data with Landsat 8 data. Field severity data were collected at 90 sites across the region, together with other site metrics, in order to develop a mapping approach for surface severity, an important metric for assessing carbon loss from fire. The approach utilised a combination of remote sensing indices to build a predictive model of severity that was applied within burn perimeters. Separate models were created for burns in the Shield and Plain ecoregions using spectral data from Landsat 8. The final Shield and Plain models resulted in estimates of surface severity with 0.74 variance explained (R2) for the Plain ecoregions and 0.67 for the Shield. The 2014 fires in the Plain ecoregion were more severe than the 2015 fires and fires in both years in the Shield ecoregion. In further analysis of the field data, an assessment of relationships between surface severity and other site-level severity metrics found mixed results.
Additional keywords: boreal ecosystems, duff, fire severity, peat, remote sensing.
Introduction
Boreal ecosystems of North America are fire-adapted and generally resilient to disturbance. The north-western boreal forest is composed of evergreen and deciduous forest with interspersed shrublands and herbaceous open site conditions, with varying hydrologic regimes (upland, lowland, marshland and peatland). At the regional-scale, peatlands across boreal Canada were assessed by Tarnocai et al. (2002) to cover 1.136 million km2 or 12% of the land area. These peatlands are estimated to hold 147 Gt of carbon in the deep (40+ cm) peat deposits, which is ~56% of the total organic carbon stored in Canadian soils (Tarnocai 2006). Upland forested ecosystems, in particular mixed conifer and spruce types, typically have a layer of carbon-rich soil overlaying the mineral soil. This surface organic material (SOM) ranges from a few centimetres to depths up to 40 cm (known as duff). Sites with more than 40 cm SOM are considered to be peatlands. These carbon pools are vulnerable to fire when environmental and site conditions allow the SOM (duff and peat) to dry out. Stand replacing fire is common in pine (Pinus banksiana), black spruce (Picea mariana) and mixed wood deciduous ecosystems; however, there is debate over the vulnerability and resilience of peat-dominated ecosystems to fire (Bourgeau-Chavez et al. 2020). Treed and open peat bogs, as well as fens, are known to burn, but the frequency of substantial peat loss and the typical level of consumption of the carbon-rich organic soils are not well established.
The 2014 and 2015 fire seasons in the Great Slave Lake area of the Northwest Territories (NWT) and Alberta (AB), Canada, generated some of the largest fires on record for the region, resulting in millions of hectares of burned area and encompassing a variety of ecosystem types within the Taiga and Boreal Plain and Taiga Shield ecological regions. The severity of these burns, especially to the organic soil layer, has several implications regarding direct carbon emissions and post-fire carbon sequestration potential vegetation recovery, as well as the influence on post-fire ecosystem structure and function. Although fire is not uncommon in this region, the level of consumption of surface organic soils because of the extreme drought conditions was substantially above normal, creating outcomes relevant to carbon cycling and ecosystem resiliency. The severity of the fires, as defined by SOM consumption, is a valuable metric for gauging the magnitude of the fires’ departure from normal, the effect of fire on carbon losses to the atmosphere and assessing ecosystem resiliency.
Fire severity is defined as the immediate effect of fire on the site (Jain 2004). Severity can be subjective and the definition differs depending on the application (e.g. vegetation removal, soil heating or loss of property), so it needs to be explicitly defined for each study (Lentile et al. 2006; French et al. 2008). For the purposes of this study, we focused on severity to the surface (comprised of SOM and often referred to as ‘belowground biomass’ or ‘belowground fuel’) as determined with field-observed metrics, including a spatial severity assessment and level of consumption. The carbon-rich SOM in uplands (duff) and peatlands (peat) serves as an important factor in subsurface thermodynamics and therefore permafrost presence and condition (Van Cleve et al. 1986). Consequently, SOM is critical in the carbon balance, permafrost status and site-level ecology of boreal ecosystems of Alaska and northern Canada (Viereck et al. 1986). Carbon-rich organic soil is common across boreal Canada and Alaska and represents a substantial proportion of the carbon held in this region (Tarnocai et al. 2002). Variability in fire severity is known to be a factor in carbon loss and is likely a factor defining site resiliency and vegetation regrowth following fire (Kasischke and Johnstone 2005).
Moderate resolution optical multispectral remote sensing in the visible, near-infrared (NIR: 0.7–1.3 µm) and mid-wave infrared region (MidIR: 1.3–3.0 µm) has served as a valuable tool for mapping and monitoring fire disturbance since the 1980s, including mapping within-burn variability as an indicator of fire severity (Kasischke et al. 1993; French et al. 2008). French et al. (2008) provide a thorough overview of severity mapping with multispectral remote sensing through the mid-2000s and review the value of the differenced normalised burn ratio (dNBR) for this purpose. Introduced by Key and Benson (2006), the dNBR uses the general form of a normalised spectral index, using bands that exploit the high reflectivity of live vegetation in the NIR and the low reflectivity of vegetation and high reflectivity of bare soil and char in the MidIR. The NBR is then computed as: (NIR – MidIR)/(NIR + MidIR). Differencing a post-fire NBR with a pre-fire NBR with undisturbed live vegetation where the fire occurred provides a clear indication of areas that have been disturbed in the fire. The dNBR, with a theoretical range of −2 to 2, has been used as a surrogate for mapping the severity of fire. By relating these remote sensing indices to site-defined severity from field data, thresholds can be created to classify severity. Similar indices have been suggested as improvements to dNBR that relativise dNBR by the pre-fire dNBR (e.g. relative dNBR (RdNBR) and relative burn ratio (RBR); Miller and Thode 2007; Parks et al. 2014); however, the general approach is consistent – to map the resulting index value to a severity rating, sometimes using field-informed thresholds.
In addition to general site severity, the differencing of pre- and post-fire Landsat images is operationally used to assess specific fire effects, including tree death (Miller and Quayle 2015) and soil burn severity (Parson et al. 2010). Soil burn severity is a metric used to assess soil stability due to the loss of surface vegetation and forest floor, which is important in mitigating surface runoff. Soil burn severity assessed from Landsat analysis is used as a tool to guide post-fire erosion control in the USA for the Burned Area Emergency Response program (Parson et al. 2010), which works quickly to assess and mitigate soil loss and erosion disaster by implementing erosion control treatments before the first damaging storms. The Landsat pre- and post-fire image product is a key resource to inform this assessment and mitigation service. Once made, it is adjusted with on-site soil assessments (including char depth, organic matter loss, altered colour and structure and reduced infiltration) to create a soil burn severity map.
For this study, Landsat-derived dNBR and related remote sensing indices were assessed for their value in extending field measurements of SOM consumption. This use of pre-and post-fire spectral index differencing for mapping surface severity has been met with caution for several reasons: (1) the indices’ strong relationships with canopy loss (Lentile et al. 2006; Hoy et al. 2008); (2) being based on the spectral sensitivity of the NIR and MidIR to vegetation and moisture variability (French et al. 2008; Veraverbeke et al. 2015); and (3) issues associated with application across different ecosystem types, hydrological conditions and vegetation densities (Soverel et al. 2010; Rogers et al. 2014). We present a fire severity mapping methodology that relates Landsat 8 Operational Land Imager (OLI)-derived indices to field-collected training data of SOM consumption within validated multiple linear regression models. Models were developed for the 2014 and 2015 fires in the Great Slave Lake region of Canada with specific attention to severity to the SOM (organic soil present in both uplands (duff) and peatlands (peat)) in order to understand the implications of these severe fires to ecosystem vulnerability and carbon balance. Additional assessment of the relationship between field-measured severity, SOM consumption, canopy severity and remote sensing-derived dNBR was also done in order to further consider the utility of remote sensing for severity mapping.
Methods
Study area
Sites burned in the 2014 and 2015 wildland fires in the south-eastern portion of the NWT and northern AB, Canada, were the subject of this study (Fig. 1). The study area included 142 fires covering 3 3075.5 km2 within the fire perimeters (Table 1) and is within the area mapped for the NASA Arctic Boreal Vulnerability Experiment (ABoVE) for studying fire in peatland ecosystems (Bourgeau-Chavez et al. 2019) and upland boreal forests (Whitman et al. 2018). The study area contains the Taiga and Boreal Plain ecoregions (grouped into Plain) and the Taiga Shield ecoregion (Shield) of Canada (Commission for Environmental Cooperation 1997). These ecoregions contain a mix of both upland and wetland ecosystems that are described by Whitman et al. (2018) and are representative of the Plain and Shield ecoregions.

|

|
Field data
Severity sampling for 2014 and 2015 burns was carried out in the year following fire as described in detail in Bourgeau-Chavez et al. (2017). Sites of at least 1 ha (nominally 100 × 100 m) were chosen from high-resolution pre-fire images to represent contiguous, homogeneous patches of a specific pre-fire ecosystem type. Sites were selected to capture a variety of ecosystems (uplands, bogs and fens) and fire season (month of burning) in the Plain and Shield ecoregions. Of the 90 sites sampled, 37 were in uplands and 53 in peatlands, which included 18 open and 35 treed wetland types (including bogs and fens). Sites with road access were chosen for safety and ease-of-access and site boundaries were drawn with care to be at least 150 m and maximum 1.5 km from a road, trail or waterbody to circumvent edge effects. Distances between site-centres within each fire are reported in Table 2 and averaged 168 km. Sites that were less than 1 km apart differed in ecosystem type. Given the irregular distribution of sampling points (some relatively clustered, others isolated and often large distances between clusters), Moran’s I was used to test for autocorrelation (threshold distance of 25 km). Results gave Moran’s I = 0.14, P = 0.07, showing that the effect of spatial autocorrelation in our dataset with the varied distances between samples was minimal.

|
Severity was sampled at six 10 × 10-m plots along two transects within each 1 ha site. Plots were situated at least 20 m from the edge of the ecosystem patch in order to avoid natural edge effects. The six severity estimates from the 10 × 10-m plots were averaged to generate one surface severity estimate to represent the site.
This study focused on the severity of burning in the SOM and peat in the ground layer, rather than aboveground ecosystem components, and used the burn severity index (BSI; initially described by Bourgeau-Chavez 1994), a field metric for quantifying fire severity of the organic surface layer adapted to peatland ecosystems from methods described by Dyrness and Norum (1983). The original metrics developed by Dyrness and Norum (1983) used a 5-point scale to assess the loss of SOM in upland black spruce forests that ranged from: 1 = heavily burned (consumption of SOM to the mineral soil), to 4 = scorched mosses and 5 = unburned surface. The BSI similarly uses a 5-point scale, but reverses the values to allow for computation of an index. As described in Loboda et al. (2013), BSI is calculated for each plot using a weighted summation of the field data as follows:
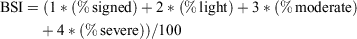
which yields a value between 0 and 4, increasing with the burn severity of SOM. In this way, the method takes into account the percent area of the surface in these five severity classes within each plot, resulting in an estimated severity rating (BSI) for each plot of a known spatial extent. The approach provides a consistent method for capturing the high spatial variability in SOM severity that was often found in these sites. In addition to the BSI, biophysical measurements were collected for each of the six plots in a site, including depth of burn using the adventitious root method and the canopy fire severity index as described by Kasischke et al. (2008).
The BSI method is similar to methods to determine the composite burn index (CBI; Cocke et al. 2005; Epting et al. 2005; Key and Benson 2006; Miller and Thode 2007; Hall et al. 2008; Parks et al. 2014), in that both are subjective metrics (Lentile et al. 2006) using an ocular assessment by a field team to define severity. However, the BSI includes an assessment of the spatial proportion of severity across a set area, in this case a set of 10 × 10-m plots that represent the 1-ha site area. The CBI was an averaged linear combination of 23 factors over five vegetation strata at each site, whereas the BSI is a 5-point severity scale determined as an aggregate assessment of the fire’s effect on the ground surface at the plot level. For the focus of this study the BSI protocol for quantifying surface severity offered two advantages over the CBI; first, the percent cover estimates are taken over defined areas as opposed to the point-based assessment used for CBI and second, very few of the 23 CBI factors are related to SOM. Furthermore, previous assessment has found that the metric is not optimal for assessing severity to the surface at sites with deep organic soils (Kasischke et al. 2008). The method simplifies the field collection effort and provides a rigorous way of determining an overall severity rating for the surface when spatial variability across a site is large.
Remote sensing
For severity model development, Landsat 8 OLI/TIRS scenes that cover the locations of the field sites were obtained from the US Geological Survey (https://earthexplorer.usgs.gov [accessed 17 January 2018]; Table 2). Only images with less than 40% cloud cover were selected and special care was given to avoid having clouds obscuring or shadowing the sites. Selection of Landsat scenes prioritised phenological matching of pre- and post-fire scenes. The date of the best post-fire scene, which in most instances was in the following calendar year, determined the selection of the pre-fire scene selection to match seasonal plant phenology. Anniversary date pre-fire scenes were selected, going back up to three years if necessary. All available unique combinations of pre- and post-fire scenes were included in the analysis and treated as replicates for modelling severity (Table 2). Image data were processed from digital numbers to top of atmosphere reflectance values following USGS Landsat 8 guidelines. Raster stacks were created from the processed data consisting of bands 2–7 (blue, green, red, NIR, MidIR1, MidIR2, 30-m resolution) and bands 10–11 (thermal infrared: TIR1 and TIR2, 100-m resolution resampled bilinearly to 30 m).
Using the GPS coordinates of the six plots, an approximate 1-ha bounding box for each field site was selected for pairing field data with remote sensing data. Mean reflectance values of each Landsat band were calculated for both pre- and post-fire images using pixels located within the field site polygons. Most field site polygons were 10 000 m2, yielding 10–11 pixels per site, though some polygons were smaller, the lowest having three pixels. In addition to the plot mean Landsat reflectance values, several spectral indices were developed for severity assessment and their pre- and post-fire differences were calculated using methods from the literature to be used for model testing and development (Table 3). In all, 58 spectral reflectance values and indices were tested. All remote sensing analysis was done using the Canada Albers Equal Area Conic projection.

|
Severity model development
Multiple linear regression (MLR) models were developed using remote sensing data to predict BSI obtained from field observations. Because of physiographic differences between the Plain and Shield (e.g. soil depth, topography, vegetation; Table 1), the BSI models were created independently for fires in the two ecoregions, as well as a generic model for the entire study area. In addition to the Landsat reflectance and thermal infrared data, the following fire and topographic variables for each site were used in model development and evaluation as predictor variables: burn date in Julian day (from Bourgeau-Chavez et al. 2017); latitude; longitude; slope; elevation; solar-radiation aspect index (Roberts and Cooper 1989); heat load index (McCune and Keon 2002) and 300-, 600-, 900- and 1200-m topographical elevation indices (Weiss 2001). Slope, aspect and heat load index were derived from the Canadian Digital Elevation Model (CDEM; Government of Canada 2011) using the R package spatialEco (Evans 2019).
Model variables were selected using a suite of feature selection algorithms and evaluated by adjusted-R2, Akaike information criterion and Bayesian information criterion, with the leaps and caret packages (Kuhn 2016; Lumley 2017) and also with consideration of the meaningfulness of predictor variables. Collinearity of predictor variables was tested using variance inflation factor analysis with a threshold of 10 to remove collinear variables from models. Model fits were tested using 3- (Shield model) and 10- (Plain and generic models) fold cross-validation with 100 repeats using the Caret package (Kuhn 2016).
Two additional validation approaches were used to assess the robustness of the selected models. The first was to validate the generic model on BSI field datasets collected from a separate study of two 2016 burns – the Horse River fire near Fort McMurray, AB, and the ZF028 fire in the NWT – in order to test the validity of the model on fires from a different year burning under very different conditions than fires in the main study. Using field data from the 2016 fires collected as described for the main sites (Horse River = 5 sites, ZF28 = 1 site, field BSI values ranging from 1.8 to 3.4), the model was validated using all valid pre-post scene combinations (Horse River = 2, ZF28 = 4). The second validation exercise was done with further model development using the original dataset parsed by ecoregion, year and ecosystem group (wetlands, uplands), using different combinations of time differenced or post-image only data (see Table S1 in Supplementary Material online for validation set-up). This approach tests the suitability of the IR bands within linear models to predict using datasets different from the model training data.
Data preparation for mapping severity
Applying the model geospatially to map fire severity for all fires in the study area required continuous Landsat image coverage of pre- and post-fire conditions, free of atmospheric interference (clouds, mist, smoke, shadows). A total of 45 pre-fire and 38 post-fire Landsat 8 scenes were used for this analysis (Table S2 in Supplementary Material online). Pre- and post-fire image data were selected for each fire individually to assure continuity and phenological matching of the landscape within the fire-disturbed areas. Images were then mosaicked for pre-fire and post-fire for each year and ecoregion. Criteria for scene selection and processing were the same as described above and scenes were clipped to the fire perimeters designated by the Canadian National Fire Database (Natural Resources Canada 2018). Most frequently the post-fire scenes were available in the following May or June; however, in some instances the best available image was in the same year. Using the band quality assurance layer all pixels not designated as cloud-free were expanded by five pixels and used to erase values in that scene. Gaps created as a result of the erasing process were filled using the next best scene, which in some instances required three scenes. A total of 83 Landsat scenes were used to make the pre- and post-fire mosaics upon which the models were applied.
Considerable land area in this region consists of water bodies and barren rock outcroppings are common within the Shield ecoregion. As the model is designed to be applied to areas known to have burned, it was considered best to mask water and barren areas for the Shield ecoregion and not include their areal extent in the burned area calculations. Using WorldView 2 images within the Shield region of our study area we collected the previously described Landsat reflectance values and indices for these outcroppings and examined which metrics were most distinguishable between bare rock outcrops and vegetated land. The rock mask was created where pixels met the following criteria: pre-fire SWIR1 > 1650, pre-fire SWIR2 > 1200, pre-fire NDVI < 0.45, and differenced tasseled cap wetness < 525 (Baig et al. 2014). These values were defined by visual examination of the resulting masks of each metric and subsequent adjustments. Water bodies were masked from the severity layer using the global surface water occurrence dataset (Pekel et al. 2016) modified to threshold only water bodies with an occurrence percentage of ³ 10%. Upon application of the model to the pre- and post-fire mosaics, severity values were classified using the following breaks: unchanged 0–0.5; singed > 0.5–1.5, light > 1.5–2.5; moderate > 2.5–3.5; severe > 3.5. To avoid subjectivity in setting thresholds, as mentioned in Hall et al. (2008), the breaks were set at midpoints between the weights applied to each BSI class.
Assessing surface severity relationships
With site-level severity, including the BSI, and concurrent measurements of depth of burn and canopy severity collected at all sites, relationships among these field-based severity measurements and dNBR could be tested. The relationships of the physical variables (burn depth, canopy severity and surface severity) were tested using Pearson’s correlation with both plot-level and site-level data. Not all plots had a measurable canopy, so those plots were left out of the analyses. Additionally, burn depth was not always collected at each plot, because of differences in field collection protocols of this variable at some sites, including the lack of black spruce trees where adventitious roots could be measured. The relationships of the canopy and surface severities to dNBR were tested with Pearson’s correlation at the site and plot levels. Additionally, simple linear, exponential and logarithmic models were fit to test the relationship between surface severity and remote sensing indices commonly used to predict severity (dNBR, RdNBR, RBR, dNBR2 and RdNBR2; Table 3).
Results
Model selection and validation
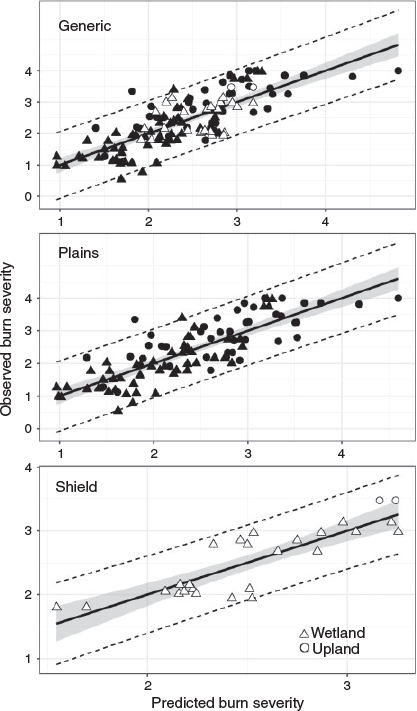
The final models (Fig. 2) were selected from several possibilities after evaluating errors, strength of fit and model simplicity (Table 4). Error rates for wetland and upland samples in the generic model were calculated using the mean of the absolute value of each residual for the two ecosystem groups. Average residuals of the wetland groups were smaller, 0.39, than that of the upland, 0.49. Of the 58 spectral metrics and indices tested, products of the NIR and MidIR bands were consistently found to be the strongest predictors of burn severity. Products of the NBR2 were generally found to be the best predictors, but this differed between ecoregions, with the best fitting model in the Shield using dNBR2 rather than the post-fire NBR2 in the Plain. All of the best-fit models included differenced NIR as an additional predictor variable. In comparison with the models using a single remote sensing index, the MLR models developed in this study performed significantly better (Table 4).
|

|
The validation effort that used data from the two 2016 fires yielded a total of 14 predicted values. The generic model accuracy of these predictions was: R2 = 0.54, RMSE = 0.45, MAE = 0.38. The second validation effort using the parsed-out dataset to generate models applied to each opposing dataset (Table S1; 2014 v. 2015; Shield v. Plain; wetlands v. uplands) generally showed that most combinations of NBR2 and NIR yielded acceptable results (R2 ranging from 0.45 to 0.79), with the exception of cross-ecoregion assessment using the models based on post-fire data (Table S1). Other than for cross-ecoregion modelling, there was some loss of accuracy using post-fire only Landsat 8 data; however, in the absence of pre-fire data, the accuracy may be considered sufficient for many applications.
Model and mapping adjustments
The inclusion of elevation parameters and thermal remote sensing offered modest model improvements (Table 4), but they were not able to be used for mapping due to issues that arose from image mosaicking. Initial models that were evaluated for Shield burn severity included post-fire normalised ratio of Landsat 8 TIR bands 10 and 11. However, discontinuities in the form of artificial linear features in predicted BSI values were apparent along the edges of scenes where they were joined. It was determined that TIR bands were sensitive to temporal differences from scene to scene due to non-burn related phenomena such as time of day or season and therefore should not be used as an estimation parameter for burn severity when multiple scenes were used. The topographic derivatives of aspect and heat load index were found to be significant predictors for burn severity in the Shield model, but offered only modest model improvements (R2 increased from 0.72 to 0.79 in initial testing with a subset of data). The 900-m topographic position index was significant in the Plain model, but again, only minor improvements were found. These metrics introduced relevant problems when mapped across the region of interest, because boundaries where CDEM data tiles were joined were producing linear artefacts in the predicted BSI products. Therefore, topographic parameters were not included in the final models, because the gains were minimal. Due to the discontinuity of the Landsat TIR and CDEM data, models were re-evaluated without TIR and elevation products and these data were discounted for this modelling effort.
In the initial severity maps, pixels immediately adjacent to the north edges of lakes were mis-classified as severe burn severity, with neighbouring pixels generally classified as unburned or singed. This was determined to be a combination of shadow artefacts and water-level differences between the pre- and post-fire scenes, leaving exposed soil and particularly so in the 2014 Plain map due to extremely low water levels that year. To mitigate these effects a 1-pixel buffer was created around all water pixels in the 2014 and 2015 Shield maps and the 2015 Plain map and a 3-pixel buffer for the 2014 Plain map. Within the buffered area the results of a multiple-iterated eight-neighbour half-threshold majority filter was applied, using two iterations for 2015 layers and 4 iterations for 2014 layers. The majority filter is a smoothing algorithm where the value of a centre pixel will be replaced by a new value when half of the neighbouring cells have the same value. Each successive iteration of the filter creates a more smoothed result. In all cases except the Plain 2015 this resulted in a slight expansion of lakes, while subtracting minimal area from the other classes. Despite the loss of some information around lake bodies, the expansion and filter step was regarded as necessary to remove potentially erroneous values while maintaining continuity around lakes.
Predicted surface burn severity
Of the 3 3075.5 km2 of area mapped for surface severity, 2 6876.1 km2 (81.3%) was classified as burnable when masking out water and barren landscape (Fig. 3). Light severity was found to be the most abundant of the five severity classes for both years and in 2015 in the Shield, with singed severity most common for the 2015 burns in the Plain ecoregion (Fig. 4, Table 5). A higher proportion of area was moderately or severely burned in 2014 than in 2015 within the Plain, but not in the Shield. In concert with this, a very small percentage of area within the 2014 Plain burn perimeters was unburned (4%) and more than 80% was categorised as light (52%), singed (18%) or unburned (16%) in the 2014 Shield. Distribution of severity values was more centred around the mean for sites in the Shield than in the Plain (Fig. 4). The distribution of severity was similar for both years in the Shield, whereas in the Plain 69% of the 2014 area was classified as light to severe, compared with 69% of the 2015 area classified as singed or unburned. The 2015 results showed less area burned for both regions than in 2014 and that severity was lower overall for burns in the Plain ecoregion, but similar to 2014 in the Shield.

|

|

|
Severity relationships
Surface severity measured in the field was weakly to moderately related to field-measured canopy severity (Table 6a; site level R2 = 0.40–0.68). This relationship was stronger in peatlands than uplands and in the Plain ecoregion compared with the Shield. At the site level, depth of burn was moderately related to SOM severity in the Shield but weakly in the Plain ecoregion, but the plot-level relationships were much weaker (Table 6a). There appeared to be no relationship between depth of burn and SOM severity in the uplands, but there were very limited samples for this analysis. At the plot level, the relationship between depth of burn and SOM severity weakened.

|
The relationship between both canopy and SOM severity (BSI) to Landsat-derived dNBR was similar (Table 6b), demonstrating a moderate relationship in the Plain but no relationship in the Shield. Canopy severity was strongly related to dNBR in uplands but less so in peatlands. Conversely, SOM severity exhibited a slightly stronger relationship to dNBR in peatlands compared with uplands. In an expanded analysis, no single remote sensing index demonstrated a significant relationship with surface severity in the Shield. In the Plain, all regressions were significant and R2 ranged from 0.4 to 0.5, with a linear fit of the RdNBR2 demonstrating the best fit.
Discussion
The carbon held in the organic soils of upland and peatland ecosystems of the boreal region is highly vulnerable to fire because of the active fire regime of the region. The severity of fire across the landscape is a major factor in the amount of carbon released into the atmosphere, which has important consequences for climate. To properly quantify the carbon budget of the region, knowing the effects of fire on upland and peatland organic soils is necessary (Kasischke et al. 2008; Bourgeau-Chavez et al. 2020). Severity mapping, together with ecosystem type mapping, allows a more complete understanding of the effect of fire at the landscape scale, providing important metrics for assessing the vulnerability of a landscape to fire (Grosse et al. 2011; Turetsky et al. 2015).
Modelling
The focus of this study was to develop MLR models using moderate resolution optical multispectral remote sensing (Landsat 8 OLI) and field-collected training data to create a reliable surface severity map for use in further analysis of the burn sites. The use of multiple pre- and post-fire image pairs for training provided more complete characterisation of spectral conditions, as discussed in Chen et al. (2020). The MLR approach used here differs from previous studies that have modelled severity using a single remote sensing index (e.g. dNBR, RdNBR, RBR) to define thresholds that matched field measurements (Miller and Thode 2007; French et al. 2008; Hall et al. 2008; Soverel et al. 2010; Parks et al. 2014; Whitman et al. 2018) or used a single remote sensing index plus additional geophysical metrics (e.g. DEM products; Rogers et al. 2014; Veraverbeke et al. 2015) to predict burn related parameters, such as carbon emissions. In Veraverbeke et al. (2015), who estimated belowground carbon consumption using multiple predictor variables (date of burn, elevation, tree cover) together with dNBR, there was only slight improvement in model accuracy with the inclusion of dNBR, suggesting that it is important to include non-remote sensing variables for mapping severity. In this study, however, ancillary variables, including latitude, longitude and day of burn, did not improve model performance. Additionally, inconsistencies in the mapped topographic metrics precluded the use of these products, though some value was seen; therefore, improvements in these results are possible once improved geospatial products are developed from elevation data.
The final surface severity models developed for the Plain and Shield ecoregions included the dNIR (with band 5) and a form of the NBR2 index, which use the two MidIR bands (bands 6 and 7) – post-fire NBR2 for the Plain and differenced NBR2 for the Shield (Table 4). Similarity of the Plain and generic models was expected, given the higher sample size of the Plain. Within north-west Canada, fires are more common in the Plain ecoregion than other ecoregions, including the Shield, therefore the weighting of the generic model towards this ecoregion is appropriate. However, should the models be applied to fires outside this study area, it is recommended to use an ecoregion-specific model to reduce error.
It was clear that the IR bands (Landsat 8 bands 5–7) provided the most information on variations within the fire perimeters that are related to severity, which is consistent with previous research (French et al. 2008). Changes to vegetation from combustion are accounted for with the dNIR parameter, included in both models, by highlighting the loss in greenness. The post-fire char has higher reflectance in the MidIR region than almost anything in the natural world besides mineral soil, especially compared with live moss and conifer vegetation, which was the most common surface material present in the pre-fire image (French 2002). Using both MidIR bands, as in the NBR2 index, maximises the utility of Landsat observations for soils, char and ash. The strength of the post-fire NBR2, as opposed to dNBR2, in the Plain as a predictor of surface severity offers an interesting perspective, considering past discussions regarding the necessity of information on pre-fire conditions when the goal is understanding the post-fire condition (Harden et al. 2000; Barrett et al. 2011). One rationale is that the denser canopy in the ecosystems of the Plain ecoregion could create confusion with the inclusion of pre-fire data, as the differenced index would be heavily skewed with the signal generated from the pre-fire canopy. In the post-fire image, the influence of the canopy can be expected to be weaker, due to canopy consumption, with more of the surface layer exposed. This premise hinges on the relationship between the canopy and surface consumption, a relationship that may vary by region, ecosystem and vegetation type, as well as fire characteristics; and this is currently not settled in the literature (Lentile et al. 2006; Hoy et al. 2008).
The models used multiple unique image pairs to generate additional training data (Table 2). Though higher model accuracies and lower errors would be expected using a single image pair to match with a field observation, this approach produced a robust model and more valid final severity map than with one pair of images. The extent of the mapping effort and size of the fires mapped required numerous scene combinations to cover the study area. Obtaining a perfect set of image pairs for phenological matching, or assessments prescribed by Key and Benson (2006) for initial or extended severity mapping, was not possible due to cloud contamination, Landsat 8 overpass frequency and burn dates. Because the final pre- and post-fire Landsat 8 mosaics could not be uniformly matched across the entire study area, using multiple unique image pairs for training was thought to better represent the severity predictions across the study area.
The errors of the MLR models in this study demonstrated relatively equal capability across the range of observed severity values (Fig. 2). Rogers et al. (2014) found that a logarithmic growth model for relating dNBR to consumption reached a plateau at higher consumption levels, leading to increasing error with increasing consumption. This is similar to the finding by Hall et al. (2008), who advised against using a second order polynomial model to relate dNBR to CBI due to a drop in predicted CBI at high dNBR values. Likewise, Miller and Thode (2007) found that dNBR and RdNBR exponential models predicting CBI exhibited increasing heteroscedasticity at higher CBI values, though it was much better controlled using RdNBR. Some of the difficulties in using remote sensing data in high-severity areas can be attributed to sensor saturation in the MidIR bands because of the high relative reflectance of char (Chuvieco et al. 2006; Soverel et al. 2010).
An advantage of the final surface severity models produced here is their high accuracy over a large range of fires without ancillary data inputs, such as weather variables and digital elevation model products, thereby creating usable data from one data source, Landsat 8. However, if available, the inclusion of ancillary geophysical data would create a more accurate model, indicating a need for better elevation models and finer spatial resolution weather data for this region.
Severity mapping
This study resulted in a set of models of SOM severity with high reliability, providing confidence that the maps will be useful for assessing the consequences of surface organic soil severity for this region. Validation assessments showed the models to be robust and that using post-fire only indices can provide valuable models results, a result that is encouraging if pre-fire imagery is unavailable. Previous studies of fire severity in Alaska and Western Canada have shown mixed results (Table 7). All of those studies focused on forested ecosystems, and primarily uplands, whereas we included a mix of open and treed uplands and peatland ecosystems, providing a valuable assessment for understanding the effects of fire on ecosystems with deep organic soils.

|
This study aimed to predict severity to the SOM as assessed in the field, rather than the multi-component field metric of CBI (Hall et al. 2008; Soverel et al. 2010). We also did not attempt to predict fuel consumption, as others have (Barrett et al. 2011; Rogers et al. 2014; Veraverbeke et al. 2015), with the concern that remote sensing-derived metrics are not sensitive to absolute organic soil reduction (French et al. 2008; Barrett et al. 2011). Some of those studies relied on the assumption that severity and consumption are correlated; the assessment in this study, however, showed that this is not always a reliable assumption, despite having been shown as valid in the other studies. Barrett et al. (2011) produced excellent results for prediction of organic soil loss for the forested sites in Alaska by using both remote sensing metrics and topographic parameters, pointing to the great value that topographic metrics can add for fuel consumption modelling. Of the studies compared in Table 7, only Veraverbeke et al. (2015) aimed to map severity/consumption across diverse landscapes; the rest of the studies focus on a single or few fire events. We attempted to map severity to the SOM over a broad area encompassing two ecoregions and across a range of upland and peatland ecosystems. This diversity presented challenges to methods where consistent geospatial data are needed and for this study, topographic data fell short. With improved topographic metrics that can be mapped consistently across a region, the approach taken for this study can be improved, as has been shown by Barrett et al. (2011).
The 2014 fires in the Plain were substantially more severe than the fires in the Shield or either ecoregion in 2015 (Table 5). Although we do not have results for more than two years, the results confirm that the severity of the 2014 fires was unusual; indeed, with just 4% of the burnable surface left unburned and the results skewed to higher severity in the 2014 Plain sites (Fig. 4), the results point to the 2014 fires as a remarkable event, with regard to surface severity. Severity has known effects on post-fire soil and vegetation conditions and therefore far-reaching ecological consequences. Topographic conditions, thinner soils and a more discontinuous landscape from lakes and exposed bedrock means less contiguous fuels to carry fire across the landscape of the Shield than the more open topography of the Plain (McKenzie et al. 2011), so the Shield is likely to experience smaller and less severe fires than the Plain ecoregion. Assessment of these results with topographical variables could help understand which factors are of most consequence in driving severity. These maps will be valuable in further assessment of fire and ecological effects and subsequently for improved carbon cycle assessments, climate effects and many other factors that are driven by fire severity in boreal systems.
Severity relationships
The results presented in Table 6a assessing the relationships between depth of burn, SOM severity and canopy severity are varied. These relationships are important to understand for proper interpretation of remote sensing-derived severity, particularly in boreal regions with carbon-rich SOM (duff and peat). Field-measured canopy and surface severity are weakly to moderately related, with the relationship stronger in the Plain ecoregion compared with the Shield, and most strongly correlated in wetlands (0.68 by site) compared with uplands (0.53 by site). Surface severity is therefore shown to be partially decoupled, though not fully, from canopy severity, indicating that the drivers of severity of canopy versus surface likely differ, a result that encourages additional exploration. An interesting analysis that is beyond the scope of this study would be to identify areas where Landsat metrics (i.e. RBR, RdNBR, etc.) suggest a moderate- or high-severity burn, but the models from this study suggest low severity or unchanged surface severity and vice versa. This type of additional study could provide an avenue to understand how satellite remote sensing might be leveraged for a complete picture of burn severity, because consumption of SOM has a very different ecological effect to that of tree death and aboveground vegetation loss, the phenomena that are most detectable from Landsat spectral indices.
Field measurements of burn depth and surface severity were found in this study to be mildly related and most strongly so in the Shield (0.54 by site), where organic soils tend to be younger and more shallow. When plotted, these results are compelling at the site level, providing some optimism that remote sensing could provide an indication of the level of surface consumption. Interestingly these two relationships (canopy/surface severity, surface severity/burn depth) are weaker at the plot level than at the broader site level, where plot data are averaged. Because field sites were selected to be homogeneous across the full site, perhaps the results suggest that these variables are less related at individual points at the site-level scale but are more linked at the landscape scale. However, to conclude from this study that Landsat can be used to indicate depth of burn is not valid; rather, the work provides evidence that remote sensing could play a part in a robust approach to mapping the level of surface fuel consumption in general.
For all Shield and Plain sites, the variation explained at the site level for each of the three relationships (canopy v. surface severity, dNBR v. canopy severity and dNBR v. surface severity) is similar (Table 6b; 0.53–0.57). However, the dNBR relationships were very poor and non-significant in the Shield for both canopy (−0.03) and surface severity (−0.22). In fact, all remote sensing metrics tested (dNBR, RdNBR, RBR, dNBR2) were poor predictors for canopy and surface severity in the Shield ecosystem when used alone, with negative correlations. Although they were all adequate in the Plain, for both ecoregions MLR techniques improved upon single-parameter models (Table 4).
The utility of dNBR and similar remote sensing indices for extending field measurements of SOM consumption has been met with caution (Lentile et al. 2006; French et al. 2008; Hoy et al. 2008; Soverel et al. 2010; Rogers et al. 2014; Veraverbeke et al. 2015), but this study found dNBR to have some value (Table 6b) and other indices performed with good results (unpubl. data); however, inclusion of multiple variables improved model predictions immensely (Table 4). Rogers et al. (2014) and Veraverbeke et al. (2015) demonstrated success at relating dNBR to field-measured surface layer consumption in boreal Alaska, showing that aboveground consumption was highly related to belowground consumption. Veraverbeke et al. (2015) found that dNBR, as an individual variable, was the top predictor of depth of burn in black spruce forests, together with pre-fire tree cover. Additionally, Barrett et al. (2011) found dNBR to be one of the top predictors of severity. In contrast, Hoy et al. (2008) did not find a strong correlation between surface organic consumption and dNBR in Alaska. French et al. (2008) concluded that satellite-based assessment of burn severity, including dNBR, in the boreal region ‘needs to be used judiciously’ because of the mixed results reported up to that point in time and the challenges of using Landsat in the region (see Verbyla et al. 2008); our study results support that conclusion.
Conclusions
In this study, the severity of the 2014 and 2015 fires in the Great Slave Lake region of the NWT and AB, Canada, was mapped using remote sensing, with specific attention to consumption of the SOM (organic soil present in both uplands (duff) and peatlands (peat)), using validated MLR models. The study results have improved on previous efforts to model severity to the SOM and therefore demonstrate a reliable method of assessing the 2014 and 2015 fires regarding surface severity, a factor of great importance when considering the vulnerability and resiliency of these sites to fire. Key findings from this study are as listed.
-
Fire severity in the region studied varied according to landscape (Plain v. Shield) and between years and represents a wide range of variability for the boreal and taiga ecoregions. The errors of the MLR models demonstrated relatively equal capability across the range of observed severity values. These results can be used to further explore the role of severity in fire effects and the post-fire environment.
-
The standard Landsat severity index, dNBR, was a poor remote sensing metric for SOM severity retrieval in the Shield, but was adequate in the Plain ecoregion. MLR models, which use more than one index, improved on single index approaches for mapping severity to the SOM. This study reinforced the finding that the products of the NIR and MidIR bands are consistently the strongest predictors of surface burn severity.
-
Geophysical variables of topography and thermal radiance-derived temperature were found to be relevant for modelling severity; however; topographic and thermal data products cannot yet be used for widespread mapping because of the discontinuities in existing datasets.
-
Assessment of the relationships between surface severity and other site-level severity metrics had mixed results:
surface severity was weakly to moderately related to canopy severity
depth of burn was moderately related to surface severity in the Shield but weakly in the Plain ecoregion
there was a weak relationship between depth of burn and surface severity in peatlands and there appeared to be no relationship between depth of burn and surface severity in uplands.
This promising application of MLR modelling to severity mapping will be improved in the future as better spatial datasets are developed; in particular, thermal IR and elevation products, weather metrics and the use of microwave-derived variables, such as passive microwave and synthetic aperture radar backscatter for modelling live fuel moisture and fire weather variables. Analysis of the severity results of this study, together with a classified ecosystem map, would provide a useful understanding of the differential vulnerability of various ecosystems to fire.
Conflicts of interest
The authors declare no conflicts of interest.
Acknowledgement
This research was funded through a grant to Michigan Technological University from the NASA Terrestrial Ecology ABoVE Program, grant no. NNX15AT83A.
References
Baig MHA, Zhang L, Shuai T, Tong Q (2014) Derivation of a tasselled cap transformation based on Landsat 8 at-satellite reflectance. Remote Sensing Letters 5, 423–431.Barrett K, McGuire AD, Hoy EE, Kasischke ES (2011) Potential shifts in dominant forest cover in interior Alaska driven by variations in fire severity. Ecological Applications 21, 2380–2396.
| Potential shifts in dominant forest cover in interior Alaska driven by variations in fire severity.Crossref | GoogleScholarGoogle Scholar | 22073630PubMed |
Bourgeau-Chavez LL (1994) ‘Using ERS-1 SAR imagery to monitor variations in burn severity in an Alaskan fire-disturbed boreal forest ecosystem.’ (MS, School of Natural Resources, University of Michigan, Ann Arbor, MI).
Bourgeau-Chavez, LL, Endres, S, Jenkins, L, Battaglia, M, Serocki, E, Billmire, M (2017) ABoVE: burn severity, fire progression, and field data, NWT, Canada, 2015–2016. ORNL Distributed Active Archive Center for Biogeochemical Dynamics. (Oak Ridge National Laboratory: Oak Ridge, TN, USA)
Bourgeau-Chavez, LL, Graham, JA, Endres, S, French, NHF, Battaglia, M, Hansen, D, Tanzer, D (2019) ABoVE: ecosystem map, Great Slave Lake Area, Northwest Territories, Canada, 1997–2011. ORNL Distributed Active Archive Center for Biogeochemical Dynamics. (Oak Ridge National Laboratory: Oak Ridge, TN, USA)
Bourgeau-Chavez LL, Grelik SL, Billimire MG, Jenkins L, Kasischke ES, Turetsky MR (2020) Assessing Boreal Peat Fire Severity and Vulnerability of Peatlands to Early Season Wildland Fire. Frontiers in Forests and Global Change 3, 20
| Assessing Boreal Peat Fire Severity and Vulnerability of Peatlands to Early Season Wildland Fire.Crossref | GoogleScholarGoogle Scholar |
Chen D, Loboda TV, Hall JV (2020) A systematic evaluation of influence of image selection process on remote sensing-based burn severity indices in North American boreal forest and tundra ecosystems. ISPRS Journal of Photogrammetry and Remote Sensing 159, 63–77.
| A systematic evaluation of influence of image selection process on remote sensing-based burn severity indices in North American boreal forest and tundra ecosystems.Crossref | GoogleScholarGoogle Scholar |
Chuvieco E, Riaño D, Danson FM, Martin P (2006) Use of a radiative transfer model to simulate the postfire spectral response to burn severity. Journal of Geophysical Research 111, G04S09
| Use of a radiative transfer model to simulate the postfire spectral response to burn severity.Crossref | GoogleScholarGoogle Scholar |
Cocke AE, Fulé PZ, Crouse JE (2005) Comparison of burn severity assessments using differenced normalized burn ratio and ground data. International Journal of Wildland Fire 14, 189–198.
| Comparison of burn severity assessments using differenced normalized burn ratio and ground data.Crossref | GoogleScholarGoogle Scholar |
Commission for Environmental Cooperation (1997) ‘Ecological regions of North America: towards a common perspective’. Secretariat of the Commission for Environmental Cooperation (CEC), Montreal. Available at http://www3.cec.org/islandora/en/item/1701-ecological-regions-north-america-toward-common-perspective-en.pdf [Verified 23 July 2020]
Dyrness CT, Norum RA (1983) The effects of experimental fires on black spruce forest floors in interior Alaska. Canadian Journal of Forest Research 13, 879–893.
| The effects of experimental fires on black spruce forest floors in interior Alaska.Crossref | GoogleScholarGoogle Scholar |
Epting J, Verbyla D, Sorbel B (2005) Evaluation of remotely sensed indices for assessing burn severity in interior Alaska using Landsat TM and ETM+. Remote Sensing of Environment 96, 328–339.
| Evaluation of remotely sensed indices for assessing burn severity in interior Alaska using Landsat TM and ETM+.Crossref | GoogleScholarGoogle Scholar |
Evans JS (2019) spatialEco. R-package version 1.2-0. Available at https://github.com/jeffreyevans/spatialEco [Verified December 2019].
French NHF (2002) ‘The impact of fire disturbance on carbon and energy exchange in the Alaskan boreal region: a geospatial analysis.’ PhD thesis, University of Michigan.
French NHF, Kasischke ES, Hall RJ, Murphy KA, Verbyla DL, Hoy EE, Allen JL (2008) Using Landsat data to assess fire and burn severity in the North American boreal forest region: an overview and summary of results. International Journal of Wildland Fire 17, 443–462.
| Using Landsat data to assess fire and burn severity in the North American boreal forest region: an overview and summary of results.Crossref | GoogleScholarGoogle Scholar |
Government of Canada (2011) Canadian Digital Elevation Model (CDEM). Available at https://open.canada.ca/data/en/dataset/7f245e4d-76c2-4caa-951a-45d1d2051333 [Verified October 2019].
Grosse G, Harden J, Turetsky M, McGuire AD, Camill P, Tarnocai C, Frolking S, Schuur EAG, Jorgenson T, Marchenko S, Romanovsky V, Wickland KP, French N, Waldrop M, Bourgeau-Chavez L, Striegl RG (2011) Vulnerability of high latitude soil organic carbon in North America to disturbance. Journal of Geophysical Research 116, G00K06
| Vulnerability of high latitude soil organic carbon in North America to disturbance.Crossref | GoogleScholarGoogle Scholar |
Hall RJ, Freeburn JT, de Groot WJ, Pritchard JM, Lynham TJ, Landry R (2008) Remote sensing of burn severity: experience from Western Canada boreal forests. International Journal of Wildland Fire 17, 476–489.
| Remote sensing of burn severity: experience from Western Canada boreal forests.Crossref | GoogleScholarGoogle Scholar |
Harden JW, Trumbore SE, Stocks BJ, Hirsch A, Gower ST, O’Neill KP, Kasischke ES (2000) The role of fire in the boreal carbon budget. Global Change Biology 6, 174–184.
| The role of fire in the boreal carbon budget.Crossref | GoogleScholarGoogle Scholar |
Hoy EE, French NHF, Turetsky MR, Trigg SN, Kasischke ES (2008) Evaluating the potential of Landsat TM/ETM+ for assessing fire severity in Alaskan black spruce forests. International Journal of Wildland Fire 17, 500–514.
| Evaluating the potential of Landsat TM/ETM+ for assessing fire severity in Alaskan black spruce forests.Crossref | GoogleScholarGoogle Scholar |
Jain TB (2004) Tongue-tied. Wildfire. June/July: pp. 22–26.
Kasischke ES, Johnstone JF (2005) Variation in post-fire organic layer thickness in a black spruce forest complex in Interior Alaska and its effects on soil temperature and moisture. Canadian Journal of Forest Research 35, 2164–2177.
| Variation in post-fire organic layer thickness in a black spruce forest complex in Interior Alaska and its effects on soil temperature and moisture.Crossref | GoogleScholarGoogle Scholar |
Kasischke ES, French NHF, Harrell P, Christensen NL, Ustin SL, Barry D (1993) Monitoring of wildfires in boreal forests using large area AVHRR NDVI composite image data. Remote Sensing of Environment 45, 61–71.
| Monitoring of wildfires in boreal forests using large area AVHRR NDVI composite image data.Crossref | GoogleScholarGoogle Scholar |
Kasischke ES, Turetsky MR, Ottmar RD, French NHF, Shetler G, Hoy E, Kane ES (2008) Evaluation of the composite burn index for assessing fire severity in black spruce forests. International Journal of Wildland Fire 17, 515–526.
| Evaluation of the composite burn index for assessing fire severity in black spruce forests.Crossref | GoogleScholarGoogle Scholar |
Key CH, Benson NC (2006) Landscape assessment (LA). In ‘FIREMON: Fire effects monitoring and inventory system’. (Eds DC Lutes, RE Keane, JF Caratti, CH Key, NC Benson, S Sutherland, LJ Gangi) USDA Forest Service, Rocky Mountain Research Station, General Technical Report RMRS-GTR-164-CD, pp. LA-1-55 164. (Fort Collins, CO, USA)
Kuhn M (2016) caret: classification and regression training. R package version 6.0-71. Available at https://CRAN.R-project.org/package=caret [Verified 23 July 2020]
Lentile LB, Holden ZA, Smith AMS, Falkowski MJ, Hudak AT, Morgan P, Lewis SA, Gessler PE, Benson NC (2006) Remote sensing techniques to assess active fire characteristics and post-fire effects. International Journal of Wildland Fire 15, 319–345.
| Remote sensing techniques to assess active fire characteristics and post-fire effects.Crossref | GoogleScholarGoogle Scholar |
Loboda TV, French NHF, Hight-Harf C, Jenkins LK, Miller ME (2013) Mapping fire extent and burn severity in Alaskan tussock tundra: an analysis of the spectral response of tundra vegetation to wildland fire. Remote Sensing of Environment 134, 194–209.
| Mapping fire extent and burn severity in Alaskan tussock tundra: an analysis of the spectral response of tundra vegetation to wildland fire.Crossref | GoogleScholarGoogle Scholar |
Lumley T (2017) leaps: regression subset selection. Available at https://CRAN.R-project.org/package=leaps [Verified October 2019].
McCune B, Keon D (2002) Equations for potential annual direct incident radiation and heat load. Journal of Vegetation Science 13, 603–606.
| Equations for potential annual direct incident radiation and heat load.Crossref | GoogleScholarGoogle Scholar |
McKenzie D, Miller C, Falk DA (Eds) (2011) ‘The landscape ecology of fire.’ (Springer: New York)
Miller JD, Quayle B (2015) Calibration and validation of immediate post-fire satellite-derived data to three severity metrics. Fire Ecology 11, 12–30.
| Calibration and validation of immediate post-fire satellite-derived data to three severity metrics.Crossref | GoogleScholarGoogle Scholar |
Miller JD, Thode AE (2007) Quantifying burn severity in a heterogeneous landscape with a relative version of the delta normalized burn ratio (dNBR). Remote Sensing of Environment 109, 66–80.
| Quantifying burn severity in a heterogeneous landscape with a relative version of the delta normalized burn ratio (dNBR).Crossref | GoogleScholarGoogle Scholar |
Natural Resources Canada (2018) Canadian National Fire Database. Available at https://cwfis.cfs.nrcan.gc.ca/ha/nfdb?type=nbac&year=9999 [Verified 23 July 2020]
Parks S, Dillon G, Miller C (2014) A new metric for quantifying burn severity: the relativized burn ratio. Remote Sensing 6, 1827–1844.
| A new metric for quantifying burn severity: the relativized burn ratio.Crossref | GoogleScholarGoogle Scholar |
Parson A, Robichaud PR, Lewis SA, Napper C, Clark JT (2010) Field guide for mapping post-fire soil burn severity. USDA Forest Service, Rocky Mountain Research Station, General Technical Report RMRS-GTR-243. (Fort Collins, CO, USA)
Pekel JF, Cottam A, Gorelick N, Belward AS (2016) High-resolution mapping of global surface water and its long-term changes. Nature 540, 418–422.
Reed BC, Brown JF, VanderZee D, Loveland TR, Merchant JW, Ohlen DO (1994) Measuring phenological variability from satellite imagery. Journal of Vegetation Science 5, 703–714.
Rikimaru A, Roy P, Miyatake S (2002) Tropical forest cover density mapping. Tropical Ecology 43, 39–47.
Roberts DW, Cooper SV (1989) Concepts and techniques of vegetation mapping. In ‘Land classifications based on vegetation: applications for resource management.’ USDA Forest Service General Technical Report GTR INT-257, pp. 90–96 (Ogden, UT, USA)
Rogers BM, Veraverbeke S, Azzari G, Czimczik CI, Holden SR, Mouteva GO, Sedano F, Treseder KK, Randerson JT (2014) Quantifying fire-wide carbon emissions in interior Alaska using field measurements and Landsat imagery. Journal of Geophysical Research. Biogeosciences 119, 1608–1629.
| Quantifying fire-wide carbon emissions in interior Alaska using field measurements and Landsat imagery.Crossref | GoogleScholarGoogle Scholar |
Soverel NO, Perrakis DDB, Coops NC (2010) Estimating burn severity from Landsat dNBR and RdNBR indices across western Canada. Remote Sensing of Environment 114, 1896–1909.
| Estimating burn severity from Landsat dNBR and RdNBR indices across western Canada.Crossref | GoogleScholarGoogle Scholar |
Tarnocai C (2006) The effect of climate change on carbon in Canadian peatlands. Global and Planetary Change 53, 222–232.
| The effect of climate change on carbon in Canadian peatlands.Crossref | GoogleScholarGoogle Scholar |
Tarnocai C, Kettles IM, Lacelle B (2002) Peatlands of Canada Database, Geological Survey of Canada Open File 4002. Natural Resources Canada computer file, Ottawa. Available at https://www.mcgill.ca/library/find/maps/peat [Accessed: 23 July 2020]
Turetsky MR, Benscoter B, Page S, Rein G, van der Werf GR, Watts A (2015) Global vulnerability of peatlands to fire and carbon loss. Nature Geoscience 8, 11–14.
| Global vulnerability of peatlands to fire and carbon loss.Crossref | GoogleScholarGoogle Scholar |
Van Cleve K, Chapin FS III, Flanagan PW, Viereck LA, Dyrness CT (Eds) (1986) ‘Forest Ecosystems in the Alaskan Taiga.’ (Springer-Verlag: New York)
Veraverbeke S, Rogers BM, Randerson JT (2015) Daily burned area and carbon emissions from boreal fires in Alaska. Biogeosciences 12, 3579–3601.
| Daily burned area and carbon emissions from boreal fires in Alaska.Crossref | GoogleScholarGoogle Scholar |
Verbyla D, Kasischke E, Hoy E (2008) Seasonal and topographic effects on estimating fire severity from Landsat TM/ETM+ data. International Journal of Wildland Fire 17, 527–534.
| Seasonal and topographic effects on estimating fire severity from Landsat TM/ETM+ data.Crossref | GoogleScholarGoogle Scholar |
Viereck LA, Van Cleve K, Dyrness CT (1986) Forest ecosystem distribution in the taiga environment. In ‘Forest ecosystems in the Alaskan taiga.’ (Eds K Van Cleve, FS Chapin III, PW Flanagan, LA Viereck, CT Dyrness) pp. 22–43. (Springer-Verlag: New York)
Weiss A (2001) Topographic position and landforms analysis. Poster presentation, ESRI user conference, San Diego, CA (Vol. 200). Available at http://www.jennessent.com/downloads/tpi-poster-tnc_18x22.pdf [Verified 23 July 2020]
Whitman E, Parisien M-A, Thompson D, Flannigan M (2018) Topoedaphic and forest controls on post-fire vegetation assemblies are modified by fire history and burn severity in the Northwestern Canadian boreal forest. Forests 9, 151
| Topoedaphic and forest controls on post-fire vegetation assemblies are modified by fire history and burn severity in the Northwestern Canadian boreal forest.Crossref | GoogleScholarGoogle Scholar |