

Effect of fuel spatial resolution on predictive wildfire models
Ritu Taneja A B D , James Hilton B , Luke Wallace C , Karin Reinke A and Simon Jones A
A Geospatial Science, RMIT University, Melbourne, Vic. 3001, Australia.
B CSIRO Data61, Private Bag 10, Clayton South, Vic. 3169, Australia.
C School of Geography, Planning and Spatial Sciences, University of Tasmania, Hobart, Tas. 7015, Australia.
D Corresponding author. Email: s3704716@student.rmit.edu.au
International Journal of Wildland Fire 30(10) 776-789 https://doi.org/10.1071/WF20192
Submitted: 3 January 2021 Accepted: 26 July 2021 Published: 26 August 2021
Journal Compilation © IAWF 2021 Open Access CC BY-NC-ND
Abstract
Computational models of wildfires are necessary for operational prediction and risk assessment. These models require accurate spatial fuel data and remote sensing techniques have ability to provide high spatial resolution raster data for landscapes. We modelled a series of fires to understand and quantify the impact of the spatial resolution of fuel data on the behaviour of fire predictive model. Airborne laser scanning data was used to derive canopy height models and percentage cover grids at spatial resolutions ranging from 2 m to 50 m for Mallee heath fire spread model. The shape, unburnt area within the fire extent and extent of fire areas were compared over time. These model outputs were strongly affected by the spatial resolution of input data when the length scale of the fuel data is smaller than connectivity length scale of the fuel. At higher spatial resolutions breaks in the fuel were well resolved often resulting in a significant reduction in the predicted size of the fire. Our findings provide information for practitioners for wildfire modelling where local features may be important, such as operational predictions incorporating fire and fuel breaks, and risk modelling of peri-urban edges or assessment of potential fuel reduction mitigations.
Keywords: wildfire modelling, vegetation structure, airborne laser scanning, fuel sampling, Spark, Spatial resolution.
Introduction
Accurately predicting the behaviour of wildland fires is exceedingly difficult due to the complex set of coupled processes that drive fire spread. These include weather, topography, fuel moisture and forest fuel structure (Alexander 2013). Recent advances in computational models have shown the potential to predict fire behaviour effectively (Gould et al. 2007; Cruz et al. 2013). These models are used to characterise fire behaviour under specific fuel and weather conditions and examine the potential effectiveness and ecological impacts of fuel treatment programs and predict fire spread during a fire event. Wildfire models are typically grouped into two categories: (1) physical models; and (2) empirical models (Sullivan 2009a, 2009b). Physical models are primarily developed with an aim of simulating the physical and chemical processes controlling fire propagation and other aspects of fire behaviour (Morvan 2011; Sullivan 2017a, 2017b). Physical models give a better understanding of how fuel treatments modify fire behaviour. However, the necessary knowledge for accurate process level modelling of combustion chemistry and outputs, heat release and heat transfer are still incomplete (Hanson et al. 2000; Finney et al. 2013). Despite the complexity of these models, the use of spatially heterogeneous fuel distributions has been overly simplistic. For example, Cassagne et al. (2011) considered only fine fuels and Mell et al. (2007) treated live fuel combustion in the same way as dead fuels only with higher moisture content. Furthermore, apart from a few examples of the evaluation of predicted rates of fire spread and behaviour against large-scale experimental fire observations published to date (e.g. Mell et al. 2007; Linn et al. 2012a; Dupuy et al. 2014; Pimont et al. 2014), the veracity of physical model results have not been rigorously tested (Alexander and Cruz 2013). Due to the limitations in knowledge and the dependence of the physical models on empiricism, use of physical model operationally is still questionable (Cruz et al. 2017; Jiang et al. 2021).
Empirical models are based on data from field experiments (Cheney et al. 1998; Gollner et al. 2015; Cruz et al. 2017). They are fast to evaluate, making them ideal for providing rapid large-area predictions for the path of a fire (Hilton et al. 2019). These models predict the behaviour of a fire using a set of associations between factors driving the fire (Sullivan 2009b). These include weather conditions such as wind and air temperature, as well as fuel and landscape conditions. Fuels have particular importance as they are the only element of the landscape that can be modified to influence the behaviour of future fires (Duff et al. 2017). As such, it is important to have detailed knowledge and understanding of relevant biomass characteristics, or fuel structure, as they affect fire propagation and behaviour (Bradstock et al. 2012; Blanchi et al. 2014). The structure of fuel includes properties such as the horizontal and vertical distribution, the percentage of live and dead fuel and the abundance of vegetative elements above the ground level including woody debris, branches, barks, foliage and stems (McElhinny et al. 2005; Ravindranath and Ostwald 2008).
Given the influence of local wind conditions and fuel heterogeneity, it is essential to explicitly account for the effects of fuel structure when exploring the interaction between forest structure and fire behaviour (Pimont et al. 2011; Linn et al. 2013; Hoffman et al. 2015; Parsons et al. 2017; Ziegler et al. 2017; Atchley et al. 2021). Thus, it is important to explicitly incorporate the effects of canopy structure to improve the behaviour of fire (Hilton et al. 2015). However, studies that systematically characterise the sensitivity of fire behaviour to the spatial resolution of fuel inputs are absent owing to poorly described fuel conditions and computational or experimental costs. Therefore, the response of fire behaviour to fuel arrangement remains poorly quantified, which limits estimates of fire outcomes (Duff et al. 2017).
Techniques employed to estimate forest structure and biomass include both direct and indirect methods of assessment. Direct methods involve destructive sampling of vegetation and are considered to be the most accurate form of assessment (Brown et al. 1989; Volkova et al. 2016). Samples are collected on site, then weighed, dried in an oven or microwaved to constant dry-weight and re-weighed. These dry weights are then used to estimate the volume of biomass in the plot (or given strata) (Hawley et al. 2018). Models have been developed to facilitate the extrapolation of this data over a wider area (Ohsowski et al. 2016). However, achieving a suitable number of samples can be labour and cost intensive and time-consuming (Loudermilk et al. 2009; Elshikha et al. 2016).
In contrast to destructive sampling techniques, indirect assessment using remote sensing can provide synoptic, spatially comprehensive characteristics of investigated forest stands in an efficient manner. Data captured over varying spatial, spectral and temporal scales has been used for the purpose of forest cover and health assessment (Coppin and Bauer 1996; Boyd and Danson 2005; Devaney et al. 2015; Pause et al. 2016; Lausch et al. 2017). Satellites are suitable for covering a large area for conducting multi-temporal analysis. However, satellite imagery is unable to measure detailed vertical measurements of forest structure often required for use in fire simulation models (Matese et al. 2015), although future technologies (NASA’s Global Ecosystem Dynamics Investigation; GEDI) may be able to progressively bridge this gap (Dubayah et al. 2017; 2020).
Airborne laser scanning (ALS) is an active remote sensing technique that utilises the reflections from emitted laser pulses from a known location and orientation to determine the 3D properties of the environment (Koma et al. 2021). Studies have shown that ALS can provide estimates of 3D forest canopy structure (Lim et al. 2003; Korhonen et al. 2011; Hancock et al. 2017). ALS-derived canopy height models have been used to describe canopy height distribution (Hopkinson et al. 2004, 2006; Rosette et al. 2008; Nie et al. 2018) to identify individual tree heights (Brandtberg 1999; Hyyppä and Inkinen 1999; Yao et al. 2013), and to estimate biomass (Cao et al. 2014) and leaf area index (LAI) (Luo et al. 2015). However, the reliability of estimates can be degraded in lower forest strata particularly in areas of high canopy cover due to occlusion (Chasmer et al. 2006; Vega et al. 2014; Fieber et al. 2015; Jarron et al. 2020). Furthermore, the resolution of the data has also been shown to play a role in the reliability of estimates from all canopy strata (Hayashi et al. 2014; Wilkes et al. 2015). For example, studies by Jakubowski et al. (2013) and Leitold et al. (2015) show that there is trade-off between LiDAR pulse density and forest measurement accuracy.
There have been many studies exploring the potential of LiDAR to measure fuel properties some of which are summarised in Table 1. In most cases, this has involved calculating parameters for fire behaviour models, including canopy height, canopy base height or canopy bulk density (González-Olabarria et al. 2012; Erdody and Moskal 2010). Due to the large amount of evidence highlighting the ability of ALS to derive fuel related metrics, their value in operational risk and modelling frameworks are likely to be high (Price and Gordon 2016; Parsons et al. 2017; Gale et al. 2021). However, the spatial resolution of the data obtained and used in fire behaviour models from ALS data can vary significantly (Table 1). Given the potential of ALS data and the ability to derive fuel maps at a range of spatial resolutions, a greater understanding of how resolution interacts with existing fuel models is required.

|
This study aimed to investigate the impact of varying spatial resolution of input fuel data on the performance of a predictive wildfire model using real world fuel data. To our knowledge, there is limited research or guidance to select a suitable spatial resolution of input fuel data for fire behavioural and predictive models. This study therefore fills an essential knowledge gap by providing information on the impact of spatial resolution input fuel data on model outputs. We model the spread of a series of hypothetical fires in the Australian Mallee vegetation type using an empirical Mallee heath fire spread model (Cruz et al. 2013), which gives the forward spread of the fire as a function of canopy cover and height. ALS data is used to provide these inputs at a range of spatial resolutions. In this study, we employ 'Spark', an open framework for wildfire prediction and analysis (Miller et al. 2015).
Method
Study area
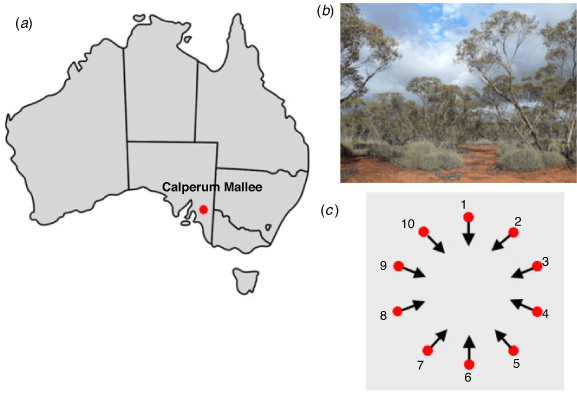
The study area for this experiment was the Calperum Mallee TERN Super Site located 25 km north of Renmark in South Australia (33°44′49′′S, 140°52′22′′E) (Fig. 1a). This site was chosen due to the availability of a published empirical fire spread model for the fuel type at the site (see Fire propagation model) and high-resolution remote sensing data (see Remote sensing data and pre-processing). The landscape is dominated by ancient sand hills that run approximately east–west, with undulation from swale to crest being up to 8 m in elevation (Meyer et al. 2015).
|
The vegetation in the area is dominated by multi-stem Eucalypt tree species (Eucalyptus dumosa, Eucalyptus incrassata, Eucalyptus oleosa and Eucalyptus socialis) (Fig. 1b). These trees are sparsely distributed (approximately 3 m apart) and grow between 3.5 and 7 m (Meyer et al. 2015). The site contains a sparse mid-storey consists of Eremophila, Hakea, Olearia, Senna and Melaleuca genera and a spaced understorey of spiny grass.
Fire propagation model
The vegetation in the area was modelled using an empirical Mallee fire spread model developed by Cruz et al. (2013). This model gives rate of spread of both the possible surface fire, Rs (m min−1) and crown fire, Rc (m min−1) as a function of the 10-m open wind speed, U10 (km h−1) and fuel parameters. The fuel parameters are the dead litter moisture content, MC (%), the canopy cover, Covo (%) and the canopy height, H (m). The rate of spread is given by:


where the moisture content used is given by Cruz et al. (2010):

where RH is the relative humidity (%), T is the air temperature (°C) and Δ is solar radiation variable.
Note Eqn 3 only holds during daytime hours (Δ = 1 and 0 otherwise). Rather than assuming the fire is a surface or crown fire the model uses a probability of crowning (Pc), and combines Eqn 1 and Eqn 2 into an overall rate of spread, S (m min−1) using this probability:

where

From Eqn 1, Rs –> ∞ as H –> 0. To circumvent this, we imposed the condition Rs = 0 at H = 0.
The Mallee heath model provides a 1D frontal rate of spread but must be modified for a 2D fire simulation. This is carried out by assuming the 2D shape is locally elliptical with a given length-to-breadth ratio (Alexander 1985). In lieu of measured data for this fuel type (Mallee), we have used fitted elliptical parameters for eucalypt forest (Cruz et al. 2013):

The fire spread model also requires the starting conditions of the fire (e.g. ignition points, lines or areas of existing fire). Typically, topography information is also required as the speed of a fire is dependent on the slope of the terrain. This effect was ignored for the simulations in this study as the focus was on the effect of spatial resolution on fuel data. The parameters in these models are based on regressions from the experimental data and as such represent an average rate of spread.
Remote sensing data and pre-processing
The ALS data used in this study was obtained from TERN AusCover (http://www.auscover.org.au/). Small footprint ALS data was acquired at a flying height of 600 m above ground level over 5 × 5 km study site in February 2012 with the aim of characterising the vegetation and landscape of the site. A Riegl LMS-Q560 laser scanner was used to capture data with a nominal pulse density of 10 pulses per m2 and with a maximum of seven returns per pulse.
Data was collected from a fixed wing aircraft using north-south orientated flight lines with a spacing of 125 m and a maximum scan angle of 45° field of view. The swath overlap between flight lines was 50%. The scanner has a beam divergence of 0.5 mrad resulting in a laser footprint of 30 cm on the ground.
Discrete returns were classified into either ground or non-ground using the python implementation of the Cloth Simulation Filter (CSF) (https://github.com/jianboqi/CSF). A complete description of the CSF algorithm and the various parameters can be found in Zhang et al. (2016). In brief, this filter identifies points that are most likely belonging to the ground through the simulation of a rigid cloth draped over the point set. The filter is parameterised using height differences, grid resolution, time step and rigidness parameters. In this case, values of 0.02, 0.5, 2 and 3 were applied for height difference, grid resolution, time step and rigidness, respectively.
Once the ground points were identified, linear interpolation was used to generate a 1 m resolution Digital Elevation Model (DEM). Subsequently, the above ground height (AGH) of all non-ground points was calculated by subtracting the value of the DEM elevation at each horizontal location. Points with an AGH of greater than 1.35 m were then classified as originating from the canopy. This height has been shown to efficiently separate the tree crowns from the under-storey and ground vegetation (McLane et al. 2009).
Fuel metric extraction
In order to quantify the impact of spatial resolution on the fire spread predictions, canopy height and cover were calculated for grids using different spatial resolutions. The cell resolution of grids was set to 2 m, 5 m, 7 m, 10 m, 30 m and 50 m. These resolutions were chosen based on the point density of the ALS data and the current data resolutions used in operational settings (Table 1).
At each resolution, canopy height was computed for each grid cell as the 95th percentile of the AGH for each point that fell within that cell. To calculate canopy cover, a grid-based technique following Korhonen et al. (2011) was used. First a binary 1 m resolution grid was created signifying the presence (1) or absence (0) of any return classified as being from the canopy. Binary opening and closing are then applied to remove any small gaps in the data. The canopy cover at each resolution was then calculated as the proportion of 1 m grid cells containing canopy vegetation (or 1 in the binary grid) against the total number of 1 m grid cells in each cell (i.e. there are 25 (1 m) cells within each 5 m grid cell for example). As each cell of the 2 m resolution grid only contains four (1 m) grids cells, a 0.5 m resolution binary grid was used in place of the 1 m resolution grid to allow for a more continuous canopy cover estimate.
Fire spread modelling environment and parameterisation
The area where the fire could be modelled was limited by the extent of the airborne ALS capture (5 × 5 km). To remove any bias in the fuel distribution pattern (e.g., horizontal striations), 10 ignition points were distributed evenly (at 36-degree intervals) around the edges of a 1.5 km radius circle centred within the data capture (Fig. 1c). At each ignition point, the wind direction was set such that the fire would pass through the centre of the study area. This allowed for a model duration of 1 h to sufficiently represent a medium-sized fire and to ensure each simulated fire extent (at each ignition point and data resolution) remained within the footprint of the ALS data. Furthermore, this also served to remove any directional bias in the results as the fires moved in different directions for each of the 10 simulations.
To determine the effect of varying the resolution of fuel properties, the weather conditions and topography information were held constant in each simulation. The Mallee model was developed to suit a range of weather conditions (wind speed, 3.6–31.5 km h−1; temperature, 15–39° C’; relative humidity, 7–80%) (Cruz et al. 2010). In this study, we chose to simulate moderate conditions within these ranges, wind speed was set to 30 km h−1, temperature to 25°C and relative humidity was set to 20%.
A separate Spark simulation was completed for each fuel resolution at each ignition point. The raster resolution of the model simulations was set to 1 m × 1 m. All input raster layers were re-sampled to this resolution and all output layers written at this resolution. Once the simulated fire reaches the cell’s centroid the cell is considered ignited (and burnt by the end of the simulation) and the current time is recorded as the arrival time of fire. After the simulation has been completed, an arrival time raster and a shapefile of arrival time isochrones is generated as output.
Model output and statistics used
For this study, all simulations were summarised by the total area burnt by fire and the ratio between the unburnt area within the fire perimeter and the total area of the fire perimeter. Area burnt is a commonly used metric when fire behaviour and effects are being examined. It has been used in addressing many ecological and Earth science challenges, including characterising wildfires and evaluating their impacts (Golding and Betts 2008; Luo and Weng 2011; Johnston et al. 2012; Kloster et al. 2012). However, area alone often ignores the existence of unburnt area within a fire perimeter (depending on the level of detail in the observational data); discriminating between burnt/unburnt area is an important component of the burn mosaic (Kolden et al. 2012, 2015; Krawchuk et al. 2016). The fire perimeter was defined by an alpha shape (alpha = 1.5) created around the centre point of all burnt cells. The area burnt was estimated as the summed area of the grid cells burnt at the end of the simulation.
To compare simulations obtained from the different spatial resolution input fuel data, a reference fire was also simulated on a constant landscape with fixed canopy cover and height input variables. The reference fire is an artificial benchmark in homogeneous fuel conditions to allow comparison between the fires. The constant cover and height for the uniform/continuous landscape were taken as the mean cover and height of the of 5 m resolution grids. The final shape of each simulation was compared to the burnt area of this reference fire using the Jaccard Similarity Index (J) (Glen 2016). Several studies have used J to compare actual fire events with simulated fires (Kalabokidis et al. 2013; Filippi et al. 2014) and describe burnt/unburnt area (Gandiwa 2011). This J index simply expresses the proportion of burnt cells common between two fire simulations and is given by:

where A is the number of grid cells burnt in landscapes using different input data resolutions and B is the number of grid cells burnt in the reference simulation.
Results
Canopy height and canopy cover representation
Figs 2 and 3 show the spatial distribution of canopy height and canopy cover for the study area at the different spatial resolutions. Several differences can be seen in how these fuel properties are represented at the six different resolutions. At higher spatial resolutions (2 m and 5 m), features such as roads and evidence of past fires are very apparent in both the height and cover grids (Figs 2d, e, 3d, e). Such features become less prominent at the 7 and 10 m spatial resolutions (Figs 2f, k, 3f, k); nevertheless, at these resolutions key landscape features relevant to fire behaviour (such as roads and evidence of past fires) remain distinguishable. At both 30 and 50 m resolutions, some of these features can still be made out but no longer have well defined edges resulting in smooth transitions between areas of low and high canopy height and cover (Figs 2l, m, 3l, m).

|

|
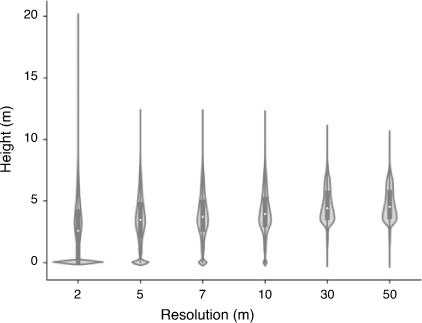
The violin plots (Figs 4, 5) show the distribution of the canopy height and cover on a vertical axis allowing for easy comparison between the canopy height and cover distribution for different resolutions. The distribution of canopy heights (Fig. 4) indicates that canopy height increases from a mean of 2.37 m for the 2 m spatial resolution grid to 4.45 m for the 50 m spatial resolution grid. This increase in mean height is driven by a lower number of cells recording no vegetation and thus a canopy height of 0 m (seen as a peak at 0 m in the violin plots at 2 m, 5 m, 7 m and to a lesser extent 10 m in Fig. 4). The standard deviation of heights ranges from 2.24 m for the 2 m spatial resolution grid to 1.68 m for the 50 m spatial resolution grid.
|
|
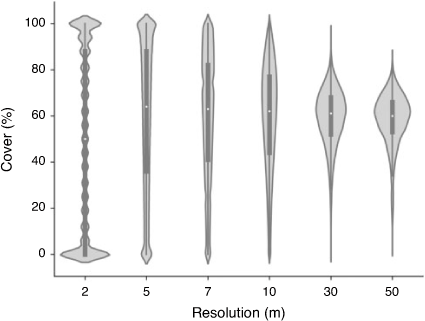
A similar trend to that observed from canopy height is seen for canopy cover where there are several cells containing no canopy points at high resolutions resulting in a cover of 0%, or cells completely covered resulting in 100% cover (Fig. 5). These features are not present at lower spatial resolutions. As spatial resolution decreases from 7 m, a narrowing of the distribution can be observed most notable at 30 m and 50 m. Variations in the mean cover between resolutions can also be observed in Fig 5. While the mean cover is lowest at 2 m resolution (44%), a trend showing a reduction in cover with decreasing resolution is observed between the other resolutions from 62% (5 m) to 55% (50 m).
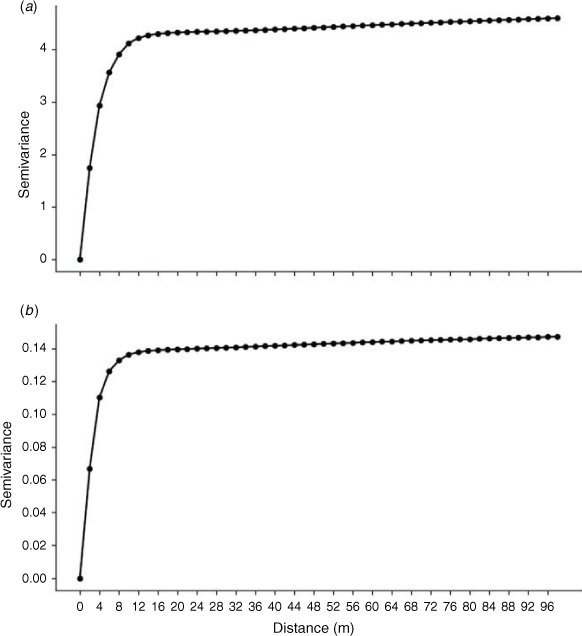
Fig. 6 shows semi-variogram for both canopy height and cover using 2 m spatial resolution input data. Both canopy height (Fig. 6a) and cover (Fig. 6b) are spatially correlated up to 10 m. The magnitude of spatial correlation decreases with separation distance and no spatial correlation exists after 10 m, the range of correlation. The nugget for both canopy cover and height at 2 m spatial resolution is zero, which shows that there is no spatial variation at distances smaller than the sampling interval.
|
Modelled fire patterns and unburnt area
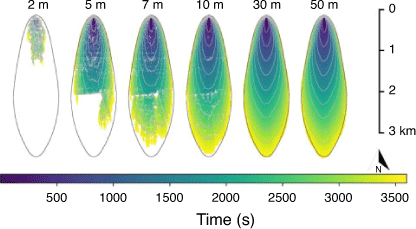
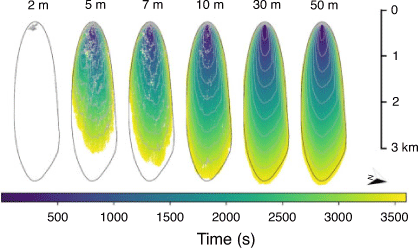
The model output is affected by the spatial resolution of input data. In general, simulations running on a single resolution for all ignition points reported similar fire patterns. This was observed for each of the resolution, and ignition point and wind direction combinations.
Fire spread from the model appears to be affected by how the breaks in canopy are represented at different resolutions (Figs 7, 8). In the 2 to 10 m resolution grids, connectivity is low, slowing down or extinguishing the fire spread. However, at low spatial resolution (30–50 m grids), fewer breaks and lower canopy heights are present, which helps the fire to propagate smoothly without interruption (Figs 7, 8). This is particularly evident with the presence of the east–west road in the study area (Fig. 7). For the 5 m resolution simulation, this road for most of its intercepted length prevents fire spread. This effect is greatest when wind is perpendicular to the linear feature (for an example, see Supplementary Fig. S1 available at the journal website).
|
|
From Table 2, it can be seen that J increases with decrease in spatial resolution, indicating that simulated fires become increasingly similar to the reference fire at low spatial resolution. The same value of J for simulation running with low spatial resolution input data (30 m and 50 m) indicates that modelled fire spread is independent of resolution once the cell size is 30 m or above. The area covered at these resolutions is slightly greater than the constant landscape. This is likely due to the representation of the fuel landscape having a slightly higher canopy height than the constant landscape at these resolutions.

|
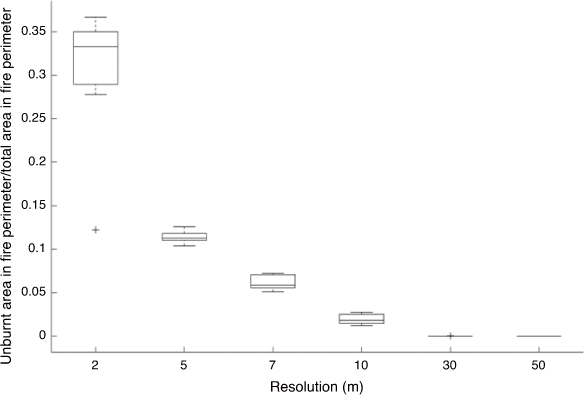
Fig. 9 illustrates the ratio of unburnt area to total area in fire perimeter for each spatial resolution (also reported in Table 2), aggregated for all of the ignition points. This ratio shows greater variation at 2 m and this variation decreases with decreased spatial resolution. The mean ratio value also decreases when fuel inputs with decreased spatial resolution are used. Input data with spatial resolutions of 30 m and 50 m show a complete burn area with no unburnt area within the fire perimeter and a ratio value of zero. In general, a decrease in spatial resolution of input data results in simplification of internal fragmentation of burnt area.
|
Modelled burnt area
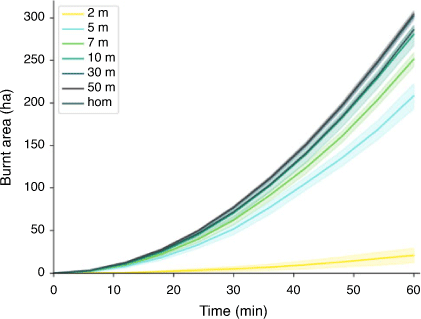
Fig. 10 shows the total area burnt by fire over a period of 60 min for each spatial resolution aggregated for all of the ignition points and the shading shows the 95% confidence interval. It shows that the total area burnt by fire increases with decrease in spatial resolution (ranging from 20.75 ha at 2 m resolution grid to 304.9 ha at 50 m resolution grid) (Table 2). This trend was observed for all but two ignition points (#2 and #6; Supplementary Figs S1, S5) where the 7 m burnt area prediction at 60 min was slightly greater (3 ha to 4 ha) than the 10 m spatial resolution dataset. Fig. 10 also shows that the variation in burnt area increases with time and decreases with decreases in spatial resolution.
|
Discussion
In this study, we used an empirical fire spread model to investigate the effect of spatial resolution of fuel data on the behaviour of fire. Earlier, fuels were characterised as homogeneous or using spatially averaged descriptors (i.e. canopy bulk density, canopy base height), often without considering the spatial variability (Hoffman et al. 2016). However, rapidly evolving remote sensing can now characterise 3D fuel structure at high resolution, including tree-scale spatial heterogeneity (Liao et al. 2018; Massetti et al. 2019; Narine et al. 2019) and 3D below-canopy fuel density (Hudak et al. 2020). Rather than simply assuming homogeneous landscape with fixed fuel data, high resolution input fuel data can be used to actively inform, and possibly, refine, fire behaviour models. Several studies have demonstrated the importance of incorporating high-resolution fuel fidelity and heterogeneity information within wildland fuel structure (Pimont et al. 2009; Atchley et al. 2021) to improve fire behaviour forecasts. Detailed high-resolution fuel maps used with a fire behaviour model have potential to inform fuel management planning and risk assessment frameworks for operational use.
Our results show an interaction between the spatial resolution of the data and the characteristics of important features within the landscape itself, which is consistent with the studies published earlier (Parsons et al. 2011; Atchley et al. 2021). Within the Mallee study area, gaps that were present in the canopy mainly consisted of linear features such as roads and fire breaks as well as lower canopy density in areas recently burnt. At higher resolutions these features were resolved in the data and affected the fire area. For example, the calculated cover at very high spatial resolutions (2 m and 5 m) was 0% over the roads (Fig. 3d, e), effectively stopping the fire. This effect can be clearly seen in Fig. 7, a road perpendicular to the head fire direction slowed the spread of the fire, eventually stopping the spread entirely at high resolutions. As the angle between the road and the wind direction becomes similar, the features effect on the fire spread reduces (Figs S1–S8). This effect is more pronounced at 5 m, where the fire is stopped by roads, than at 7 and 10 m where the fire propagates over the roads, particularly where they are narrower. Conversely, as the spatial resolution for input fuel data decreases, the fuel properties are aggregated (Fig. 3i, j) due to canopy features surrounding the road, resulting in a cover estimate that allows the simulator to propagate the fire over the feature (Figs S1–S8). Whilst these features changed the overall burn pattern, only a minor difference in burnt area was seen when comparing to other lower resolutions data (7–50 m) (Fig. 10). As such, at high spatial resolutions, the extent of fire spread can be modelled, while also indicating areas of slower fire progression due to breaks.
Computational time is important in an operational or risk modelling context where many simulations may have to be performed over sets of possible states. Although many of the fire behaviour models allow a fully 3D description of the forest, they are too computationally expensive for operational use (Atchley et al. 2021). And because of computational cost, the domain of application of fire models is typically limited to a particular range of scales (Gollner et al. 2015). Simulations performed using 30 m and 50 m spatial resolution input data produced similar burnt areas and no unburnt area within the total burnt area (Figs 7, 8). This suggests computational cost in running the Mallee heath model could effectively be reduced by using 50 m spatial resolution, with a lower overall number of computational grid cells for the model to calculate, for fuel related input data instead of 30 m. This gives practitioners in these areas an idea of the trade-off between speed and accuracy. Simulations at 30 m and 50 m may require an additional model to compensate for fuel breaks but they should produce comparable results, with coarser simulations taking a shorter time to compute. Similar results may be achieved for models that use canopy height and cover as inputs for predicting fire behaviour and make them more suitable for operationally use.
The area burnt with reference fire (where canopy height and cover was assumed to be constant) was found to be similar in simulations running with different spatial resolution for all ignition points. Additionally, the reference fire used in this study produced a similar fire boundary to the 30 m and 50 m resolution inputs. Whilst remote sensing data is often used to produce fuel maps at these resolutions (Table 1), minimal gain is found in using spatially varying data over this landscape and when simulating fire using this model.
The low spatial resolution input data missed fine breaks in the landscape and as mentioned earlier, allows the fire to propagate. However, as soon as there is no connectivity between the fuel the spread of the fire cannot be sustained and slows down or stops, creating unburnt area. This characteristic is evident in simulations using high spatial resolution input data (Figs 7, 8). Although we are primarily concerned with physical fuel breaks as a mechanism to stop fire spread, intense fires in this fuel type may generate firebrands with the resulting potential for the fire to jump these breaks. However, there is scarce information in the literature on spot fire creation in this fuel type and the rate-of-spread models do not explicitly take this into account. If a spotting model was included in the simulation, the areas burnt at higher resolution may be larger as firebrands could jump gaps, although it is impossible to apply this in the current study as no spot fire models exists for this fuel type.
It is also important to consider the highest resolution achievable from the data source being considered. In this study, the accuracy of the estimated cover and height is potentially degraded at 2 m resolution due to the inconsistent sampling of the ALS data across the study area. This is also likely to play a role in the resulting very small areas of the predicted fires, as cells with no returns were considered to have 0% canopy cover and a canopy height of 0 m. Local features and data artefacts at this resolution act as fire breaks effectively stopping the fire. We hypothesise that the ALS data being used at the edge of its limitations at this resolution, that canopy cover as used in the development of the model is not the same as the vertically projected canopy cover at such a fine scale. Further the fire spread model developed by Cruz et al. (2013) is based on field-scale experiments and does not consider fuel connectivity at very small (metre) scales, which could also account for the breakdown of the model at this very high spatial resolution.
These results have two implications for simulating fires in a forest with heterogeneous fuels using empirical modelling: (1) there can be significant differences associated with representing the canopy fuel as a homogeneous layer for ecosystems that naturally include gaps; and (2) The spatial resolution at which fuel metrics for models are developed also influenced modelled fire behaviour. In this context there are indicative bounds showing that spatial resolutions below 5 m cause the fire behaviour model to breakdown, and where spatial resolutions greater than 30 m model outputs such as fire extent and burnt area shows similar results to the homogeneous landscape. The sensitivity of fire behaviour models to fuel spatial resolutions highlighted in this study suggests the need to choose an appropriate resolution of input fuel data for increased fuel description detail. Substantial gains in understanding fire behaviour could be made through a stronger incorporation of the heterogeneity within wildland fuel structure at a higher spatial resolution into fuels research, particularly with respect to the underlying drivers of fire regimes in the context of vegetation response. Such developments could increase the application and accuracy of data-driven wildfire models (Coen and Schroeder 2013; Coen et al. 2013).
Whilst spatial resolution is the focus of this paper, it is also important to keep in mind the method used to extract the canopy height and cover metrics from ALS data. In this study, the 95th percentile height of the canopy points within each grid cell was used as the representation of canopy height. This approach meant the mean canopy height within the study area increased with decreasing resolution (Fig. 4). Alternative height (i.e. maximum height or 50th percentile height) and cover metrics (such as those based on LiDAR return distribution (Korhonen et al. 2011) derived from ALS data may interact differently with varying spatial resolution. For example, the grid-based method for the calculation of cover used in this study, requires each cell within the high-resolution grid to be observed by multiple LiDAR pulses to ensure any canopy present is sampled. Approaches such as the first cover index presented in Korhonen et al. (2011) do not require the calculation of this high-density grid and therefore may result in different model outputs at high resolutions. Results are presented in the context of this case study. We suggest future studies could test the relationship between spatial resolution of fuel metrics and fire behaviour in different environment.
Conclusion
Empirical fire models are routinely used in fire management operations to predict fire spread and risk. The operational use of these models often chooses the spatial resolution of the underlying data based on availability. This study assessed the impact of varying spatial resolution of input fuel data on the performance of an empirical fire behaviour model. By linking detailed, spatially explicit fuel maps with an empirical fire behaviour model, we provide an insight to inform scientists and managers about the impact of fuel data spatial resolution on area burnt and the dynamics of fire, time of arrival of fire at any particular location, and the extent of the unburnt area within the fire perimeter. Coarse resolution provides connectivity between fuel elements used in the model allowing the fire to propagate. The behaviour of the model in terms of burnt area and speed was similar over a threshold scale of 30 m. Below this threshold, however, the model was strongly affected by features such as gaps and patchy data in the fuel, leading to the predicted perimeter being slowed or stopped. At very high resolutions the connectivity of individual fuel elements was resolved in the data, causing the model to break down. This was most likely caused by the development of the empirical model being based on experimental data averaged over a plot of a given size, causing it to produce poor results when applied to fuel data with a spatial resolution well below the experimental plot size. This insight has significant potential to inform the operational use of these models as increasingly high spatial resolution datasets are becoming available at landscape scale.
Data availability statement
The ALS data, (Airborne LiDAR Survey, TERN AusCover – Calperum Mallee SuperSite, ‘Chowilla’, 20120131-20120201, ver. 1.0.0) that support the findings of this study was obtained by the AusCover facility (http://www.auscover.org.au) of the Terrestrial Ecosystem Research Network (TERN, http://www.tern.org.au). Available at ftp://qld.auscover.org.au/airborne_validation/lidar/chowilla/
Conflicts of interest
The authors declare no conflicts of interest.
Declaration of funding
This research did not receive any specific funding for this publication.
Acknowledgements
RT gratefully acknowledges the funding received towards her PhD from the RMIT University and CSIRO. Thanks also to Samuel Hillman for advice.
References
Alexander ME (1985) Estimating the length-to-breadth ratio of elliptical forest fire patterns. Pages 287-304 in Proceedings of the 8th Conference on Fire and Forest Meteorology, April 29-May 2, 1985, Detroit, MI.Alexander ME (2013) Fire management applications of wildland fire behaviour knowledge. In ‘Fire on Earth: An Introduction’. (Eds AC Scott, DMJS Bowman, WJ Bond, SJ Pyne, ME Alexander) pp. 373–391. (Wiley-Blackwell)
Alexander ME, Cruz MG (2013) Are the applications of wildland fire behavior models getting ahead of their evaluation again? Environmental Modelling & Software 41, 65–71.
| Are the applications of wildland fire behavior models getting ahead of their evaluation again?Crossref | GoogleScholarGoogle Scholar |
Atchley AL, Linn AR, Hoffman J, Hyman JD, Pimont F, Sieg C, Middleton RS (2021) Effects of fuel spatial distribution on wildland fire behaviour. International Journal of Wildland Fire 30, 179–189.
| Effects of fuel spatial distribution on wildland fire behaviour.Crossref | GoogleScholarGoogle Scholar |
Blanchi R, Leonard J, Haynes K, Opie K, James M, de Oliveira FD (2014) Environmental circumstances surrounding bushfire fatalities in Australia 1901–2011. Environmental Science & Policy 37, 192–203.
| Environmental circumstances surrounding bushfire fatalities in Australia 1901–2011.Crossref | GoogleScholarGoogle Scholar |
Botequim B, Fernandes PM, Borges JG, González-Ferreiro E, Guerra-Hernández J (2019) Improving silvicultural practices for Mediterranean forests through fire behaviour modelling using LiDAR-derived canopy fuel characteristics. International Journal of Wildland Fire 28, 823–839.
| Improving silvicultural practices for Mediterranean forests through fire behaviour modelling using LiDAR-derived canopy fuel characteristics.Crossref | GoogleScholarGoogle Scholar |
Boyd DS, Danson FM (2005) Satellite remote sensing of forest resources: three decades of research development. Progress in Physical Geography 29, 1–26.
| Satellite remote sensing of forest resources: three decades of research development.Crossref | GoogleScholarGoogle Scholar |
Bradstock RA, Cary GJ, Davies I, Lindenmayer DB, Price OF, Williams RJ (2012) Wildfires, fuel treatment and risk mitigation in Australian eucalypt forests: Insights from landscape-scale simulation. Journal of Environmental Management 105, 66–75.
| Wildfires, fuel treatment and risk mitigation in Australian eucalypt forests: Insights from landscape-scale simulation.Crossref | GoogleScholarGoogle Scholar | 22531752PubMed |
Brandtberg T (1999) Automatic individual tree-based analysis of high spatial resolution aerial images on naturally regenerated boreal forests. Canadian Journal of Remote Sensing 29, 1464–1478.
Brown S, Gillespie AJR, Lugo AE (1989) Biomass estimation methods for tropical forests with applications to forest inventory data. Forest Science 35, 881–902.
Cao L, Coops NC, Hermosilla T, Innes J, Dai J, She G (2014) Using small-footprint discrete and full-waveform airborne LiDAR metrics to estimate total biomass and biomass components in subtropical forests. Remote Sensing 6, 7110–7135.
| Using small-footprint discrete and full-waveform airborne LiDAR metrics to estimate total biomass and biomass components in subtropical forests.Crossref | GoogleScholarGoogle Scholar |
Cassagne N, Pimont F, Dupuy JL, Linn RR, Marell A, Oliveri C, Rigolot E (2011) Using a fire propagation model to assess the efficiency of prescribed burning in reducing the fire hazard. Ecological Modelling 222, 1502–1514.
| Using a fire propagation model to assess the efficiency of prescribed burning in reducing the fire hazard.Crossref | GoogleScholarGoogle Scholar |
Chasmer L, Hopkinson C, Treitz P (2006) Investigating laser pulse penetration through a conifer canopy by integrating airborne and terrestrial lidar Can. Yaogan Xuebao 32, 116–125.
Cheney NP, Gould JS, Catchpole WR (1998) Prediction of Fire Spread in Grasslands. International Journal of Wildland Fire 8, 1–13.
| Prediction of Fire Spread in Grasslands.Crossref | GoogleScholarGoogle Scholar |
Coen JL, Schroeder W (2013) Use of spatially refined satellite remote sensing fire detection data to initialize and evaluate coupled weather– wildfire growth model simulations. Geophysical Research Letters 40, 5536–5541.
| Use of spatially refined satellite remote sensing fire detection data to initialize and evaluate coupled weather– wildfire growth model simulations.Crossref | GoogleScholarGoogle Scholar |
Coen JL, Cameron M, Michalakes J, Patton EG, Riggan PJ, Yedinak KM (2013) WRF-Fire: coupled weather–wildland fire modeling with the weather research and forecasting model. Journal of Applied Meteorology and Climatology 52, 16–38.
| WRF-Fire: coupled weather–wildland fire modeling with the weather research and forecasting model.Crossref | GoogleScholarGoogle Scholar |
Coppin PR, Bauer ME (1996) Digital change detection in forest ecosystems with remote sensing imagery. Remote Sensing Reviews 13, 207–234.
| Digital change detection in forest ecosystems with remote sensing imagery.Crossref | GoogleScholarGoogle Scholar |
Cruz MG, Matthews S, Gould J, Ellis P, Henderson M, Knight I, Watters J (2010) Fire Dynamics in Mallee-heath: Fuel, Weather and Fire Behaviour Prediction in South Australian Semiarid Shrublands. Report A.10.01. Bush fire Cooperative Research Centre, Melbourne, Victoria.
Cruz MG, McCaw WL, Anderson WR, Gould JS (2013) Fire behavior modelling in semi-arid Mallee-heath shrublands of southern Australia. Environmental Modelling & Software 40, 21–34.
| Fire behavior modelling in semi-arid Mallee-heath shrublands of southern Australia.Crossref | GoogleScholarGoogle Scholar |
Cruz MG, Alexander ME, Sullivan AL (2017) Mantras of wildland fire behaviour modelling: facts or fallacies? International Journal of Wildland Fire 26, 973–981.
| Mantras of wildland fire behaviour modelling: facts or fallacies?Crossref | GoogleScholarGoogle Scholar |
Devaney J, Barrett B, Barrett F, Redmond J, O’Halloran J (2015) Forest cover estimation in Ireland using radar remote sensing: a comparative analysis of forest cover assessment methodologies. PLoS One 10, e0133583
| Forest cover estimation in Ireland using radar remote sensing: a comparative analysis of forest cover assessment methodologies.Crossref | GoogleScholarGoogle Scholar | 26262681PubMed |
Dubayah R, The GEDI Science Team (2017) The GEDI Strategy for Improved Mapping of Forest Biomass and Structure. AGU Fall Meeting. New Orleans, LA, USA. B11H-06
Dubayah R, Blair JB, Goetz S, Fatoyinbo L, Hansen M, Healey S, Hofton M, Hurtt G, Kellner J, Luthcke S, Armston J (2020) The Global Ecosystem Dynamics Investigation: High-resolution laser ranging of the Earth’s forests and topography. Science of Remote Sensing 1, 100002
| The Global Ecosystem Dynamics Investigation: High-resolution laser ranging of the Earth’s forests and topography.Crossref | GoogleScholarGoogle Scholar |
Duff TJ, Keane RE, Penman TD, Tolhurst KG (2017) Revisiting Wildland Fire Fuel Quantification Methods: The Challenge of Understanding a Dynamic, Biotic Entity. Forests 8, 351
| Revisiting Wildland Fire Fuel Quantification Methods: The Challenge of Understanding a Dynamic, Biotic Entity.Crossref | GoogleScholarGoogle Scholar |
Dupuy JL, Pimont F, Linn RR, Clements CB (2014) FIRETEC evaluation against the FireFlux experiment: preliminary results. In ‘Advances in Forest Fire Research’. (Ed. DX Viegas) pp. 261–274. (Coimbra University Press: Coimbra, Portugal)
Elshikha DM, Hunsaker DJ, Bronson KF, Sanchez PL (2016) Using RGB-based vegetation indices for monitoring guayule biomass, moisture content and rubber. In ‘2016 ASABE Annual International Meeting’. Paper Number: 162380922. (American Society of Agricultural and Biological Engineers)
Engelstad PS, Falkowski M, Wolter P, Poznanovic A, Johnson P (2019) Estimating canopy fuel attributes from low-density LiDAR. Fire (Basel, Switzerland) 2, 38
| Estimating canopy fuel attributes from low-density LiDAR.Crossref | GoogleScholarGoogle Scholar |
Erdody TL, Moskal LM (2010) Fusion of LiDAR and imagery for estimating forest canopy fuels. Remote Sensing of Environment 114, 725–737.
| Fusion of LiDAR and imagery for estimating forest canopy fuels.Crossref | GoogleScholarGoogle Scholar |
Fieber KD, Davenport IJ, Tanase MA, Ferryman JM, Gurney RJ, Becerra VM, Walker JP, Hacker JM (2015) Validation of Canopy Height Profile methodology for small-footprint full-waveform airborne LiDAR data in a discontinuous canopy environment. ISPRS Journal of Photogrammetry and Remote Sensing 104, 144–157.
| Validation of Canopy Height Profile methodology for small-footprint full-waveform airborne LiDAR data in a discontinuous canopy environment.Crossref | GoogleScholarGoogle Scholar |
Filippi JB, Mallet V, Nader B (2014) Representation and evaluation of wildfire propagation simulations. International Journal of Wildland Fire 23, 46–57.
| Representation and evaluation of wildfire propagation simulations.Crossref | GoogleScholarGoogle Scholar |
Finney MA, Cohen JD, McAllister SS, Jolly WM (2013) On the need for a theory of wildland fire spread. International Journal of Wildland Fire 22, 25–36.
| On the need for a theory of wildland fire spread.Crossref | GoogleScholarGoogle Scholar |
Gajardo J, García M, Riaño D (2014). Applications of airborne laser scanning in forest fuel assessment and fire prevention. In ‘Forestry Applications of Airborne Laser Scanning’ (Eds M Maltamo, E Næsset, J Vauhkonen) pp. 439–462. (Springer, Dordrecht)
Gale MG, Cary GJ, Van Dijk AI, Yebra M (2021) Forest fire fuel through the lens of remote sensing: Review of approaches, challenges and future directions in the remote sensing of biotic determinants of fire behavior. Remote Sensing of Environment 255, 112282
| Forest fire fuel through the lens of remote sensing: Review of approaches, challenges and future directions in the remote sensing of biotic determinants of fire behavior.Crossref | GoogleScholarGoogle Scholar |
Gandiwa E (2011) Effects of repeated burning on woody vegetation structure and composition in a semi-arid southern African savanna. International Journal of Environmental Sciences 2, 458–471.
Glen S (2016) Jaccard Index/Similarity Coefficient. Available at https://www.statisticshowto.com/jaccard-index/
Golding N, Betts R (2008) Fire risk in Amazonia due to climate change in the HadCM3 climate model: Potential interactions with deforestation. Global Biogeochemical Cycles 22, GB4007
| Fire risk in Amazonia due to climate change in the HadCM3 climate model: Potential interactions with deforestation.Crossref | GoogleScholarGoogle Scholar |
Gollner M, Trouve A, Altintas I, Block J, De Callafon R, Clements C, Cortes A, Ellicott E, Filippi JB, Finney M, Ide K, Jenkins MA, Jimenez D, Lautenberger C, Mandel J, Rochoux M, Simeoni A (2015) WIFIRE Workshop “Towards Data-Driven Operational Wildfire Spread Modeling” 12–13 January 2015, UCSD.
González-Olabarria JR, Rodríguez F, Fernández-Landa A, Mola-Yudego B (2012) Mapping fire risk in the Model Forest of Urbión (Spain) based on airborne LiDAR measurements. Forest Ecology and Management 282, 149–156.
| Mapping fire risk in the Model Forest of Urbión (Spain) based on airborne LiDAR measurements.Crossref | GoogleScholarGoogle Scholar |
Gould JS, McCaw WL, Cheney NP, Ellis PF, Knight IK, Sullivan AL (2007) ‘Project Vesta – Fire in Dry Eucalypt Forest: Fuel structure, fuel dynamics and fire behaviour’. (Ensis-CSIRO, Canberra ACT, and Department of Environment and Conservation, Perth WA)
Hancock S, Anderson K, Disney M, Gaston KJ (2017) Measurement of fine-spatial-resolution 3D vegetation structure with airborne waveform lidar: Calibration and validation with voxelised terrestrial lidar. Remote Sensing of Environment 188, 37–50.
| Measurement of fine-spatial-resolution 3D vegetation structure with airborne waveform lidar: Calibration and validation with voxelised terrestrial lidar.Crossref | GoogleScholarGoogle Scholar |
Hanson HP, Bradley MM, Bossert JE, Linn RR, Younker LW (2000) The potential and promise of physics-based wildfire simulation. Environmental Science & Policy 3, 161–172.
| The potential and promise of physics-based wildfire simulation.Crossref | GoogleScholarGoogle Scholar |
Hawley CM, Loudermilk EL, Rowell EM, Pokswinski S (2018) A novel approach to fuel biomass sampling for 3D fuel characterization. MethodsX 5, 1597–1604.
| A novel approach to fuel biomass sampling for 3D fuel characterization.Crossref | GoogleScholarGoogle Scholar | 30622922PubMed |
Hayashi R, Weiskittel A, Sader S (2014) Assessing the Feasibility of Low-Density LiDAR for Stand Inventory Attribute Predictions in Complex and Managed Forests of Northern Maine, USA. Forests 5, 363–383.
| Assessing the Feasibility of Low-Density LiDAR for Stand Inventory Attribute Predictions in Complex and Managed Forests of Northern Maine, USA.Crossref | GoogleScholarGoogle Scholar |
Hilton JE, Miller C, Sullivan AL, Rucinski (2015) Effects of spatial and temporal variation in environmental conditions on simulation of wildfire spread. Environmental Modelling & Software 67, 118–127.
| Effects of spatial and temporal variation in environmental conditions on simulation of wildfire spread.Crossref | GoogleScholarGoogle Scholar |
Hilton JE, Swedosh W, Hetherton L, Sullivan AL, Prakash M (2019) Spark user guide 1.1.2. CSIRO, Australia.
Hoffman CM, Linn R, Parsons R, Sieg C, Winterkamp J (2015) Modeling spatial and temporal dynamics of wind flow and potential fire behavior following a mountain pine beetle outbreak in a lodgepole pine forest. Agricultural and Forest Meteorology 204, 79–93.
| Modeling spatial and temporal dynamics of wind flow and potential fire behavior following a mountain pine beetle outbreak in a lodgepole pine forest.Crossref | GoogleScholarGoogle Scholar |
Hoffman C, Canfield J, Linn R, Mell W, Sieg C, Pimont F, Ziegler J (2016) Evaluating crown fire rate of spread predictions from physics-based models. Fire Technology 52, 221–237.
| Evaluating crown fire rate of spread predictions from physics-based models.Crossref | GoogleScholarGoogle Scholar |
Hopkinson C, Lim K, Chasmer LE, Treitz P, Creed IF, Gynan C (2004) Wetland grass to plantation forest – Estimating vegetation height from the standard deviation of lidar frequency distributions. The International Archives of the Photogrammetry, Remote Sensing and Spatial Information Sciences 36, 288–294.
Hopkinson C, Chasmer L, Lim K, Treitz P, Creed I (2006) Towards a universal lidar canopy height indicator. Canadian Journal of Remote Sensing 32, 139–152.
| Towards a universal lidar canopy height indicator.Crossref | GoogleScholarGoogle Scholar |
Hudak AT, Kato A, Bright BC, Loudermilk EL, Hawley C, Restaino JC, Ottmar RD, Prata GA, Cabo C, Prichard SJ, Rowell EM (2020) Towards spatially explicit quantification of pre-and postfire fuels and fuel consumption from traditional and point cloud measurements. Forest Science 66, 428–442.
| Towards spatially explicit quantification of pre-and postfire fuels and fuel consumption from traditional and point cloud measurements.Crossref | GoogleScholarGoogle Scholar |
Huesca M, Riaño D, Ustin SL (2019) Spectral mapping methods applied to LiDAR data: Application to fuel type mapping. International Journal of Applied Earth Observation and Geoinformation 74, 159–168.
| Spectral mapping methods applied to LiDAR data: Application to fuel type mapping.Crossref | GoogleScholarGoogle Scholar |
Hyyppä J, Inkinen M (1999) Detecting and estimating attributes for single tree using laser scanner. The Photogrammetric Journal of Finland 16, 27–42.
Jakubowski MK, Guo Q, Kelly M (2013) Trade-offs between lidar pulse density and forest measurement accuracy. Remote Sensing of Environment 130, 245–253.
| Trade-offs between lidar pulse density and forest measurement accuracy.Crossref | GoogleScholarGoogle Scholar |
Jarron LR, Coops NC, MacKenzie WH, Tompalski P, Dykstra P (2020) Detection of sub-canopy forest structure using airborne LiDAR. Remote Sensing of Environment 244, 111770
| Detection of sub-canopy forest structure using airborne LiDAR.Crossref | GoogleScholarGoogle Scholar |
Jiang W, Wang F, Fang L, Zheng X, Qiao X, Li Z, Meng Q (2021) Modelling of wildland-urban interface fire spread with the heterogeneous cellular automata model. Environmental Modelling & Software 135, 104895
| Modelling of wildland-urban interface fire spread with the heterogeneous cellular automata model.Crossref | GoogleScholarGoogle Scholar |
Johnston FH, Henderson SB, Chen Y, Randerson JT, Marlier M, DeFries RS, Kinney P, Bowman DMJS, Brauer M (2012) Estimated global mortality attributable to smoke from landscape fires. Environmental Health Perspectives 120, 695–701.
| Estimated global mortality attributable to smoke from landscape fires.Crossref | GoogleScholarGoogle Scholar | 22456494PubMed |
Kalabokidis K, Palaiologou P, Finney M (2013): Fire Behavior Simulation in Mediterranean Forests Using the Minimum Travel Time Algorithm. In ‘Fourth Fire Behavior and Fuels Conference Proceedings – At The Crossroads: Looking Toward the Future in a Changing Environment’, July 1–4, 2013, St. Petersburg, Russia. (International Association of Wildland Fire: Missoula, Montana, USA)
Kane VR, North MP, Lutz JA, Churchill DJ, Roberts SL, Smith DF, McGaughey RJ, Kane JT, Brooks ML (2014) Assessing fire effects on forest spatial structure using a fusion of Landsat and airborne LiDAR data in Yosemite National Park. Remote Sensing of Environment 151, 89–101.
| Assessing fire effects on forest spatial structure using a fusion of Landsat and airborne LiDAR data in Yosemite National Park.Crossref | GoogleScholarGoogle Scholar |
Kloster S, Mahowald NM, Randerson JT, Lawrence PJ (2012) The impacts of climate, land use, and demography on fires during the 21st century simulated by CLM‐CN. Biogeosciences 9, 509–525.
| The impacts of climate, land use, and demography on fires during the 21st century simulated by CLM‐CN.Crossref | GoogleScholarGoogle Scholar |
Kolden CA, Lutz JA, Key CH, Kane JT, Wagtendonk JWV (2012) Mapped versus actual burnt area within wildfire perimeters: Characterizing the unburnt. Forest Ecology and Management 286, 38–47.
| Mapped versus actual burnt area within wildfire perimeters: Characterizing the unburnt.Crossref | GoogleScholarGoogle Scholar |
Kolden CA, Abatzoglou JT, Lutz JA, Cansler CA, Kane JT, Wagtendonk JWV, Key CH (2015) Climate contributors to forest mosaics: ecological persistence following wildfire. Northwest Science 89, 219–238.
| Climate contributors to forest mosaics: ecological persistence following wildfire.Crossref | GoogleScholarGoogle Scholar |
Koma Z, Zlinszky A, Bekő L, Bura Pi, Seijmonsbergen AC, Kissling WD (2021) Quantifying 3D vegetation structure in wetlands using differently measured airborne laser scanning data. Ecological Indicators 127, 107752
| Quantifying 3D vegetation structure in wetlands using differently measured airborne laser scanning data.Crossref | GoogleScholarGoogle Scholar |
Korhonen L, Korpela I, Heiskanen J, Maltamo M (2011) Airborne discrete-return LIDAR data in the estimation of vertical canopy cover, angular canopy closure and leaf area index. Remote Sensing of Environment 115, 1065–1080.
| Airborne discrete-return LIDAR data in the estimation of vertical canopy cover, angular canopy closure and leaf area index.Crossref | GoogleScholarGoogle Scholar |
Kramer HA, Collins BM, Kelly M, Stephens SL (2014) Quantifying ladder fuels: A new approach using LiDAR. Forests 5, 1432–1453.
| Quantifying ladder fuels: A new approach using LiDAR.Crossref | GoogleScholarGoogle Scholar |
Krawchuk MA, Haire SL, Coop J, Parisien MA, Whitman E, Chong G, Miller C (2016) Topographic and fire weather controls of fire refugia in forested ecosystems of northwestern North America. Ecosphere 7, e01632
| Topographic and fire weather controls of fire refugia in forested ecosystems of northwestern North America.Crossref | GoogleScholarGoogle Scholar |
Lausch A, Erasmi S, Douglas JK, Magdon P, Heurich M (2017) Understanding Forest Health with Remote Sensing-Part II—A Review of Approaches and Data Models. Remote Sensing 9, 129
| Understanding Forest Health with Remote Sensing-Part II—A Review of Approaches and Data Models.Crossref | GoogleScholarGoogle Scholar |
Leitold V, Keller M, Morton DC, Cook BD, Shimabukuro YE (2015) Airborne lidar-based estimates of tropical forest structure in complex terrain: opportunities and trade-offs for REDD+. Carbon Balance and Management 10, 3
| Airborne lidar-based estimates of tropical forest structure in complex terrain: opportunities and trade-offs for REDD+.Crossref | GoogleScholarGoogle Scholar | 25685178PubMed |
Liao W, Van Coillie F, Gao L, Li L, Zhang B, Chanussot J (2018) Deep learning for fusion of APEX hyperspectral and full-waveform LiDAR remote sensing data for tree species mapping. IEEE Access : Practical Innovations, Open Solutions 6, 68716–68729.
| Deep learning for fusion of APEX hyperspectral and full-waveform LiDAR remote sensing data for tree species mapping.Crossref | GoogleScholarGoogle Scholar |
Lim K, Treitza P, Wulder M, St-Onge B, Flood M (2003) LiDAR remote sensing of forest structure. Progress in Physical Geography 27, 88–106.
| LiDAR remote sensing of forest structure.Crossref | GoogleScholarGoogle Scholar |
Linn RR, Anderson K, Winterkamp J, Brooks A, Wotton M, Dupuy J-L, Pimont F, Edminster C (2012a) Incorporating field wind data into FIRETEC simulations of the International Crown Fire Modeling Experiment (ICFME): preliminary lessons learned. Canadian Journal of Forest Research 42, 879–898.
| Incorporating field wind data into FIRETEC simulations of the International Crown Fire Modeling Experiment (ICFME): preliminary lessons learned.Crossref | GoogleScholarGoogle Scholar |
Linn RR, Sieg CH, Hoffman CM, Winterkamp JL, McMillin JD (2013) Modeling wind fields and fire propagation following bark beetle outbreaks in spatially heterogeneous pinyon–juniper woodland fuel complexes. Agricultural and Forest Meteorology 173, 139–153.
| Modeling wind fields and fire propagation following bark beetle outbreaks in spatially heterogeneous pinyon–juniper woodland fuel complexes.Crossref | GoogleScholarGoogle Scholar |
Loudermilk EL, Hiers JK, O’Brien JJ, Mitchell RJ, Singhania A, Fernandez JC, Cropper WP Loudermilk EL, Hiers JK, O’Brien JJ, Mitchell RJ, Singhania A, Fernandez JC, Cropper WP (2009) Ground-based LIDAR: A novel approach to quantify fine-scale fuelbed characteristics. International Journal of Wildland Fire 18, 676–685.
| Ground-based LIDAR: A novel approach to quantify fine-scale fuelbed characteristics.Crossref | GoogleScholarGoogle Scholar |
Luo YQ, Weng ES (2011) Dynamic disequilibrium of the terrestrial carbon cycle under global change. Trends in Ecology & Evolution 26, 96–104.
| Dynamic disequilibrium of the terrestrial carbon cycle under global change.Crossref | GoogleScholarGoogle Scholar |
Luo S, Wang C, Pan F, Xi X, Li G, Nie S, Xia S (2015) Estimation of wetland vegetation height and leaf area index using airborne laser scanning data. Ecological Indicators 48, 550–559.
| Estimation of wetland vegetation height and leaf area index using airborne laser scanning data.Crossref | GoogleScholarGoogle Scholar |
Massetti A, Rudiger C, Yebra M, Hilton J (2019) The Vegetation Structure Perpendicular Index (VSPI): a forest condition index for wildfire predictions. Remote Sensing of Environment 224, 167–181.
| The Vegetation Structure Perpendicular Index (VSPI): a forest condition index for wildfire predictions.Crossref | GoogleScholarGoogle Scholar |
Matese A, Toscano P, Filippo Di Gennaro S, Genesio L, Vaccari FP, Primicerio J, Belli C, Zaldei A, Bianconi R, Gioli B (2015) Intercomparison of UAV, aircraft and satellite remote sensing platforms for precision viticulture. Remote Sensing 7, 2971–2990.
| Intercomparison of UAV, aircraft and satellite remote sensing platforms for precision viticulture.Crossref | GoogleScholarGoogle Scholar |
McElhinny C, Gibbons P, Bracka C, Bauhus J (2005) Forest and woodland stand structural complexity: Its definition and measurement. Forest Ecology and Management 218, 1–24.
| Forest and woodland stand structural complexity: Its definition and measurement.Crossref | GoogleScholarGoogle Scholar |
McLane AJ, McDermid GJ, Wulder MA (2009) Processing discrete-return profiling lidar data to estimate canopy closure for large area forest mapping and management. Remote Sensing 35, 217–229.
Mell WE, Jenkins MA, Gould J, Cheney P (2007) A physics-based approach to modeling grassland fires. International Journal of Wildland Fire 16, 1–22.
| A physics-based approach to modeling grassland fires.Crossref | GoogleScholarGoogle Scholar |
Meyer W, Kondrlovà E, Koerber G (2015) Evaporation of perennial semi-arid woodland in south-eastern Australia is adapted for irregular but common dry periods. Hydrological Process 29, 3714–3726.
| Evaporation of perennial semi-arid woodland in south-eastern Australia is adapted for irregular but common dry periods.Crossref | GoogleScholarGoogle Scholar |
Miller C, Hilton J, Sullivan A, Prakash M (2015) SPARK – A Bushfire Spread Prediction Tool. In: ‘Environmental Software Systems. Infrastructures, Services and Applications’. ISESS 2015. IFIP Advances in Information and Communication Technology Vol. 448. (Eds R Denzer, RM Argent, G Schimak, J Hřebíček) pp. 262–271. (Springer, Cham)
Montealegre AL, Lamelas MT, Tanase MA, de la Riva J (2014) Forest Fire Severity Assessment Using ALS Data in a Mediterranean Environment. Remote Sensing 6, 4240–4265.
| Forest Fire Severity Assessment Using ALS Data in a Mediterranean Environment.Crossref | GoogleScholarGoogle Scholar |
Morvan D (2011) Physical phenomena and length scales governing the behavior of wildfires: a case for physical modelling. Fire Technology 47, 437–460.
| Physical phenomena and length scales governing the behavior of wildfires: a case for physical modelling.Crossref | GoogleScholarGoogle Scholar |
Narine LL, Popescu SC, Malambo L (2019) Synergy of ICESat-2 and Landsat for mapping forest aboveground biomass with deep learning. Remote Sensing 11, 1503
| Synergy of ICESat-2 and Landsat for mapping forest aboveground biomass with deep learning.Crossref | GoogleScholarGoogle Scholar |
Nie S, Wang C, Xi X, Luo S, Li S, Tia J (2018) Estimating the height of wetland vegetation using airborne discrete-return LiDAR data. Optik (Stuttgart) 154, 267–274.
| Estimating the height of wetland vegetation using airborne discrete-return LiDAR data.Crossref | GoogleScholarGoogle Scholar |
Ohsowski B, Dunfield KE, Klironomos JN, Hart MM (2016) Improving plant biomass estimation in the field using partial least squares regression and ridge regression. Botany 94, 501–508.
| Improving plant biomass estimation in the field using partial least squares regression and ridge regression.Crossref | GoogleScholarGoogle Scholar |
Parsons R, Mell WE, McCauley P (2011) Linking 3D spatial models of fuels and fire: Effects of spatial heterogeneity on fire behavior. Ecological Modelling 222, 679–691.
| Linking 3D spatial models of fuels and fire: Effects of spatial heterogeneity on fire behavior.Crossref | GoogleScholarGoogle Scholar |
Parsons R, Linn R, Pimont F, Hoffman C, Sauer J, Winterkamp J, Sieg C, Jolly W (2017) Numerical investigation of aggregated fuel spatial pattern impacts on fire behavior. Land (Basel) 6, 43
| Numerical investigation of aggregated fuel spatial pattern impacts on fire behavior.Crossref | GoogleScholarGoogle Scholar |
Pause M, Schweitzer C, Rosenhal M, Keuck V, Bumberger J, Dietrich P, Heurich M, Jung A, Lausch A (2016) In situ/remote sensing integration to assess forest health—A review. Remote Sensing 8, 471
| In situ/remote sensing integration to assess forest health—A review.Crossref | GoogleScholarGoogle Scholar |
Pimont F, Dupuy JL, Linn RR, Dupont S (2009) Validation of FIRETEC wind-flows over a canopy and a fuel-break. International Journal of Wildland Fire 18, 775–790.
| Validation of FIRETEC wind-flows over a canopy and a fuel-break.Crossref | GoogleScholarGoogle Scholar |
Pimont F, Dupuy J-L, Linn RR, Dupont S (2011) Impacts of tree canopy structure on wind flows and fire propagation simulated with FIRETEC. Annals of Forest Science 68, 523–530.
| Impacts of tree canopy structure on wind flows and fire propagation simulated with FIRETEC.Crossref | GoogleScholarGoogle Scholar |
Pimont F, Dupuy JL, Linn RR (2014) Fire effects on the physical environment in the WUI using FIRETEC. In ‘Advances in Forest Fire Research’. (Ed. DX Viegas) pp. 749–758. (Coimbra University Press: Coimbra, Portugal)
Price OF, Gordon CE (2016) The potential for LiDAR technology to map fire fuel hazard over large areas of Australian forest. Journal of Environmental Management 181, 663–673.
| The potential for LiDAR technology to map fire fuel hazard over large areas of Australian forest.Crossref | GoogleScholarGoogle Scholar | 27558828PubMed |
Ravindranath NH, Ostwald M (2008) Methods for estimating above-ground biomass. In ‘Carbon Inventory Methods: Handbook for Greenhouse Gas Inventory, Carbon Mitigation and Roundwood Production Projects.’ pp. 113–147. (Springer)
Rosette JAB, North PRJ, Suárez JC (2008) Vegetation height estimates for a mixed temperate forest using satellite laser altimetry. International Journal of Remote Sensing 29, 1475–1493.
| Vegetation height estimates for a mixed temperate forest using satellite laser altimetry.Crossref | GoogleScholarGoogle Scholar |
Sullivan AL (2009a) Wildland surface fire spread modelling, 1990-2007. 1: Physical and quasi-physical models. International Journal of Wildland Fire 18, 349–368.
| Wildland surface fire spread modelling, 1990-2007. 1: Physical and quasi-physical models.Crossref | GoogleScholarGoogle Scholar |
Sullivan AL (2009b) Wildland surface fire spread modelling, 1990-2007. 2: Empirical and quasi-empirical models. International Journal of Wildland Fire 18, 369–386.
| Wildland surface fire spread modelling, 1990-2007. 2: Empirical and quasi-empirical models.Crossref | GoogleScholarGoogle Scholar |
Sullivan AL (2017a) Inside the inferno: fundamental processes of wildland fire behaviour. Part 1. Combustion chemistry and energy release. Current Forestry Reports 3, 132–149.
| Inside the inferno: fundamental processes of wildland fire behaviour. Part 1. Combustion chemistry and energy release.Crossref | GoogleScholarGoogle Scholar |
Sullivan AL (2017b) Inside the inferno: fundamental processes of wildland fire behaviour. Part 2. Heat transfer and interactions. Current Forestry Reports 3, 150–171.
| Inside the inferno: fundamental processes of wildland fire behaviour. Part 2. Heat transfer and interactions.Crossref | GoogleScholarGoogle Scholar |
Vega C, Hamrouni A, El Mokhtari S, Morel J, Bock J, Renaud J-P, Bouvier M, Durrieu S (2014) P Trees: A point-based approach to forest tree extraction from lidar data. International Journal of Applied Earth Observation and Geoinformation 33, 98–108.
| P Trees: A point-based approach to forest tree extraction from lidar data.Crossref | GoogleScholarGoogle Scholar |
Volkova L, Sullivan AL, Roxburgh SH, Weston CJ (2016) Visual assessments of fuel loads are poorly related to destructively sampled fuel loads in eucalypt forests. International Journal of Wildland Fire 25, 1193–1201.
| Visual assessments of fuel loads are poorly related to destructively sampled fuel loads in eucalypt forests.Crossref | GoogleScholarGoogle Scholar |
Wilkes P, Jones SD, Suarez L, Haywood A, Woodgate W, Soto-Berelov M, Mellor A, Skidmore AK (2015) Understanding the effects of ALS pulse density for metric retrieval across diverse forest types. Photogrammatic Engineering & Remote Sensing 81, 625–635.
| Understanding the effects of ALS pulse density for metric retrieval across diverse forest types.Crossref | GoogleScholarGoogle Scholar |
Yao W, Krzystek P, Heurich M (2013) Enhanced detection of 3D individual trees in forested areas using airborne full waveform Lidar data by combining normalized cuts with spatial density clustering. ISPRS Annals of the Photogrammetry, Remote Sensing and Spatial Information Sciences II-5, 349–354.
| Enhanced detection of 3D individual trees in forested areas using airborne full waveform Lidar data by combining normalized cuts with spatial density clustering.Crossref | GoogleScholarGoogle Scholar |
Zhang W, Qi J, Wan P, Wang H, Xie D, Wang X, Yan G (2016) An Easy-to-Use Airborne LiDAR Data Filtering Method Based on Cloth Simulation. Remote Sensing 8, 501
| An Easy-to-Use Airborne LiDAR Data Filtering Method Based on Cloth Simulation.Crossref | GoogleScholarGoogle Scholar |
Ziegler JP, Hoffman C, Battaglia M, Mell W (2017) Spatially explicit measurements of forest structure and fire behavior following restoration treatments in dry forests. Forest Ecology and Management 386, 1–12.
| Spatially explicit measurements of forest structure and fire behavior following restoration treatments in dry forests.Crossref | GoogleScholarGoogle Scholar |