Field and full-scale laboratory testing of prototype wildland fire shelters
Joseph Roise A * , John Williams A , Roger Barker B and John Morton-Aslanis B
A North Carolina State University, Forestry and Environmental Resources, Raleigh, North Carolina, 27695, USA
B North Carolina State University, TPACC, College of Textiles, Raleigh, North Carolina, 27695, USA
International Journal of Wildland Fire 31(5) 518-528 https://doi.org/10.1071/WF21102
Submitted: 16 July 2021 Accepted: 23 March 2022 Published: 28 April 2022
© 2022 The Author(s) (or their employer(s)). Published by CSIRO Publishing on behalf of IAWF. This is an open access article distributed under the Creative Commons Attribution-NonCommercial-NoDerivatives 4.0 International License (CC BY-NC-ND)
Abstract
This paper describes a series of tests conducted to evaluate prototype fire shelters designed to provide enhanced thermal protective insulation in wildland fire burn-over events. Full-scale laboratory and field tests are used to compare the thermal performance of the prototypes with a fire shelter construction in current use in the United States. Laboratory tests showed that the prototype fire shelters outperformed the current shelter in providing fire-blocking thermal insulation in tests designed to simulate exposure to the intense flame conditions encountered in wildland fires. Field tests supported laboratory comparisons, but proved to be statistically inconclusive in differentiating shelter performance because of the variability inherent in thermal data obtained in field burns. This study confirmed the value of evaluating prototype shelter designs in laboratory tests capable of reproducibly simulating exposure to turbulent flames encountered in wildland fires.
Keywords: conduction, convection, field testing of fire shelters, fire shelter, flame-blocking materials, laboratory testing of fire shelters, M2002, personal protection in wildland fires, radiation, wildland fire shelters.
Introduction
This research explores the value of field-testing wildland fire shelters as a means to qualify the results from laboratory tests of fire shelter thermal protective performance. The basic assumption of the study is that the thermal conductivity of a shelter’s composite construction is constant whether measured in the laboratory or in the field. The difference is that laboratory testing occurs in a controlled thermal environment whereas field-testing takes place in unpredictable conditions. Regardless of testing environments, the rate of heat transfer to the shelter interior is dependent on the characteristics of the heat assault and the thermal insulation provided by the shelter construction. Variables that influence the heat transfer rates through fire shelters include the temperature difference between shelter exterior and interior, the surface area of the shelter, the material used in the shelter construction composite and the thickness of the shelter wall. Higher temperature differences between exterior and interior of the shelter translate to higher rates of heat transfer. As would be expected, the lower the thermal conductivity of the shelter wall, the better the thermal protection it provides to the interior of the shelter. The exterior layer of a shelter construction is typically an aluminised fabric laminate that provides excellent reflection of incident radiant energy. Aluminium is a metal with a high thermal conductivity, capable of reflecting radiant energy in the visible and near-infrared range of the spectrum (Pozzobon et al. 2020).
In 2000, the USDA Forest Service Missoula Technology and Development Center (MTDC) started work to develop and test a new fire shelter design. Their goal was to maintain radiant heat protection while improving protection from direct flame exposure in burn-over events. Many different aspects of shelter performance including material strength, durability, flammability, weight, bulk, toxicity and cost were studied. Testing procedures were developed to evaluate performance of prototype shelter materials and designs. Using information gathered from field tests in Montana and Canada’s Northwest Territories, they found that field-testing provided valuable information on fire shelter performance. At the same time, they noted the expense, difficulty and variability of field test conditions and concluded that lab-based tests provide more repeatable and reliable information (Anderson and Petrilli 2003). The fire shelter developed, referred to as the M2002 shelter, offered improved protection and performance in comparison with previous shelter designs.
Although the M2002 fire shelter has contributed to the safety of wildland firefighters, there is an ongoing need for new shelter designs that provide higher levels of protection from convective energy transfer caused by direct contact with flames (Interagency Fire Shelter Task Group 2007). Our laboratory-based research has shown that direct flame contact significantly degrades the thermal integrity of materials used in the construction of the M2002 fire shelter (Nagavalli et al. 2016). The M2002 shelter construction consists of two laminated layers: an outer layer of aluminium foil laminated to a woven silica fabric combined with an inner layer of aluminium foil laminated to a woven fiberglass fabric (Nagavalli et al. 2016). The layers utilise adhesives to laminate aluminium foil to woven fabric for each layer. The aluminium foil exterior effectively minimises radiant energy transfer through the shelter wall construction. Heat transferred in direct flame contact, however, quickly takes the bonding adhesive to its degradation temperature of 260°C (Roberts 2013), causing the structure to delaminate. The outer aluminised layer itself fails when in contact with flames at temperatures that exceed the 660°C melting temperature of aluminium (Leitner et al. 2017). These findings indicate the need for shelter designs that utilise robust fire-blocking layers with low thermal conductivity and stability at high temperatures. In light of the failure mechanisms observed in the M2002 fire shelter materials, there are opportunities to develop shelter constructions that provide enhanced thermal performance by incorporating an inner convective heat-blocking barrier and additional thermal insulation into the shelter construction.
It is apparent that protocols and well-defined performance criteria for field and full-scale laboratory testing of fire shelters in conditions experienced by wildland firefighters are required to continue the improvement of shelter design and evaluation beyond the M2002 design. This paper describes research that has attempted to fill some of the knowledge gap by exploring the relationship between a full-scale laboratory test procedure and field-testing for comparing prototype fire shelters designed to exceed the thermal insulation performance of the M2002 shelter.
Materials and methods
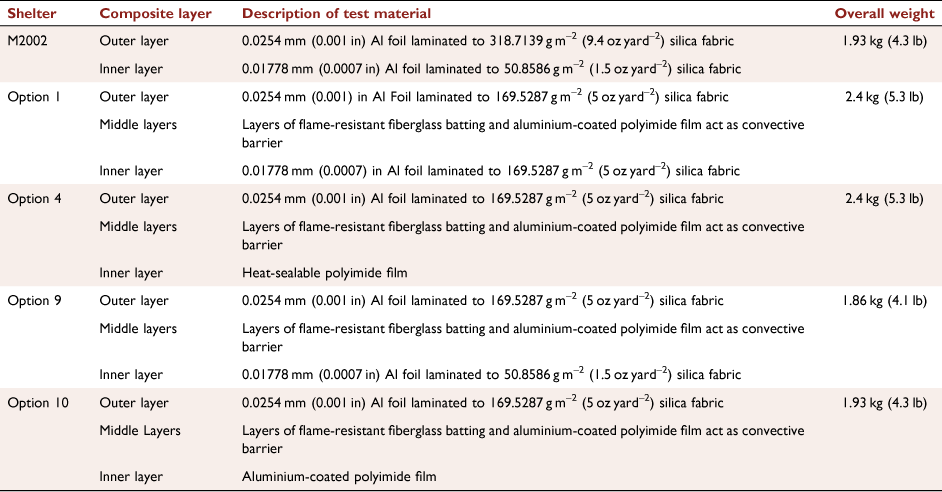
Table 1 describes the prototype fire shelters that are the focus of this paper. We included the M2002 fire shelter in the study group to provide a benchmark for shelter thermal protective performance. Shelter prototypes were developed that incorporated more robust convective heat-blocking and thermal insulating layers than used in the M2002 shelter construction. The additional heat-blocking layers (behind the outer aluminised layer) slow the rate of heat transfer after delamination of the outer aluminised layer has occurred. They enhance the ability of the underlying convective barrier layers to block convective heat and hot gases that transfer after the outer aluminised layer fails from flame contact. We combined these strategies with the use of compressible batting materials to increase thermal insulation without adding significant weight to the fire shelter composite. For example, Prototype Shelter 1 incorporates compressive batting layers, a high-temperature convective barrier in the middle of its construction and the same inner layer used in the M2002 control. Prototype 4 has compressive batting layers, and multiple high-temperature convective barriers to reinforce thermal insulation. Prototypes 9 and 10 are lighter construction versions of Prototypes 1 and 4. In addition, we discovered that heat penetration through the seams in the M2002 shelter was a limiting factor in its thermal protective performance. Therefore, we incorporated new seam designs into the construction of all shelters to minimise heat perpetration into the shelter interior. A complete discussion of materials and methods can be found in Williams (2017).
|
Full-scale laboratory testing
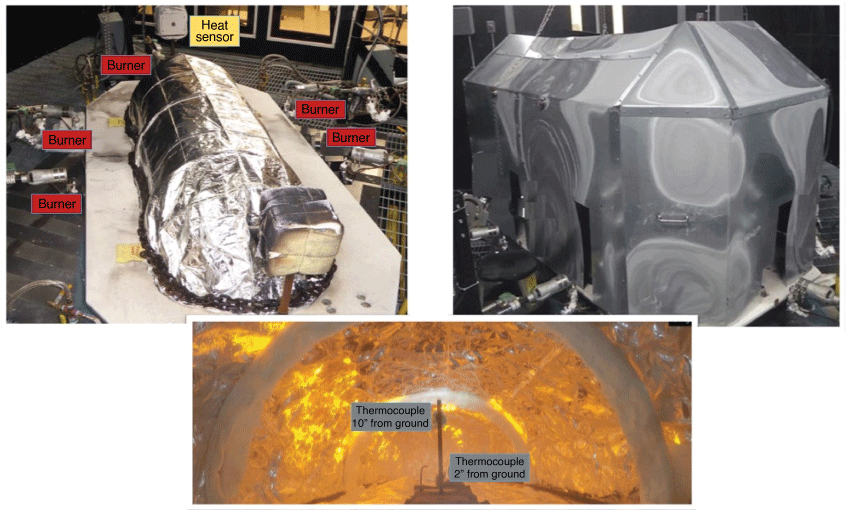
We used a specially built instrumented fire test chamber, called the PyroDome™ Turbulent Flame Fire Shelter Test System, to evaluate the thermal protective performance of prototype fire shelters in a laboratory setting (Fig. 1). This large testing system is capable of exposing full-scale fire shelters to intense heat from turbulent flames simulating wildland fire burn-overs. The burn chamber used five burners that applied direct flame contact to shelters. These burners provided a flux in the range of 60–90 kW m−2 and exterior temperature profiles that ranged from 800 to 1200°C. Thermocouples, positioned 5.08 and 25.4 cm (2 and 10 in) from the floor of the fire shelter measured the air temperature inside the shelter. A GoPro video camera inside the shelter recorded visible changes to inside walls of the shelter construction produced by the external heat exposure. The propane burners provided up to a 60-s exposure to flames calibrated at an average heat intensity of 84 kW m−2. Alashe (2018) provides additional details about the PyroDome™ lab-based fire testing apparatus and testing protocols.
Field testing
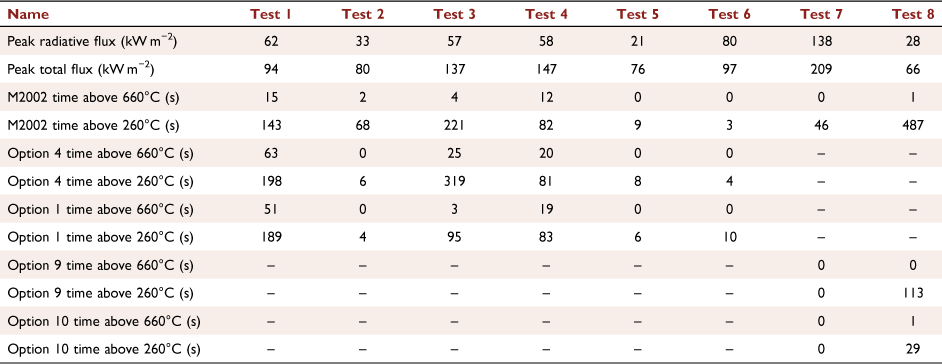
Eight field tests were conducted at four different locations throughout North America, including chaparral in California, grassland in South Dakota, longleaf pine and hardwood slash in North Carolina and boreal forest in the Northwest Territories of Canada. These locations featured a diversity of fuel types, topographies and weather conditions. They provided the potential for a range of heat intensities and flame involvement with the test fire shelters (Table 2).

|
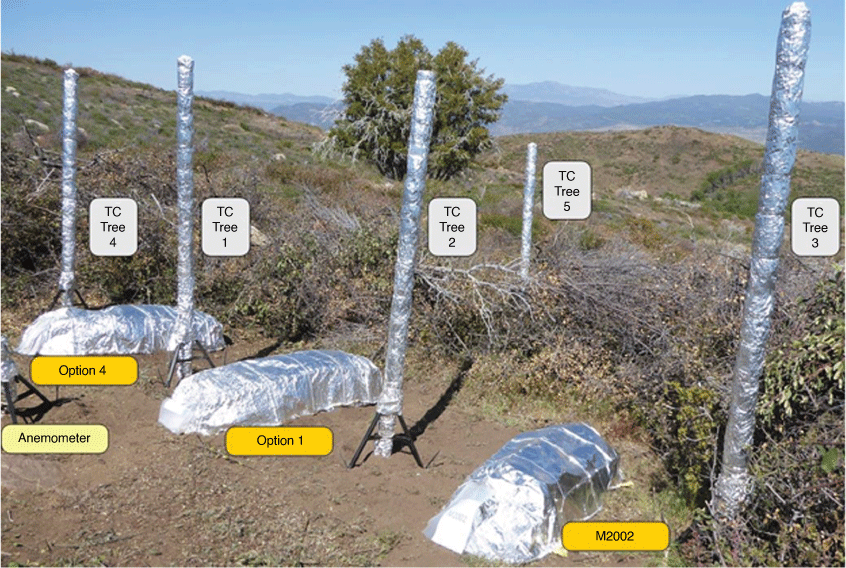
Fig. 2 illustrates the burn site layout showing the positioning of three test shelters and instrumentation used to monitor the thermal conditions outside and inside the fire shelters. Sites of fire shelter deployments were based on the density of available combustible fuel, ground slope and prevailing wind with the objective of maximising the flame exposure of the deployed test shelters. Shelters were oriented in the anticipated direction of the advancing flame front. Local fire managers provided valuable guidance regarding site selection and preparation, and constructed secure fire lines surrounding the burn area.
|
We deployed the fire shelters in a 1.22 by 2.43 m (4 by 8 foot) cleared site following the practice recommended by the US Forest Service for emergency fire shelter deployment (Anderson 2003). We scraped the deployment site to the bare mineral soil with a minimum 0.3048 m (1-foot) buffer between the shelters and any combustible fuel source. We placed soil around the exterior bottom edge of each test shelter to reduce the opportunity for flames to burn under and inside the shelter.
We deployed the shelters 1.829 m (6 feet) apart, or in close proximity, thereby enhancing the probability that each shelter would experience similar fire conditions. Steel frames wrapped with a ceramic blanket stabilised the shape of deployed shelters. Three 0.45 kg (5 lb) weights were placed on the shelter frame to hold the shelter on the ground.
Fig. 2 shows the shelters and instrument fixtures at different stages of Field Test 1 conducted at the Mount Palomar site. These photographs show the staging of the fire shelters and the instrument trees used to monitor the thermal environment near the test shelters before, during and after the burn event at this test site.
The equipment used to measure environmental conditions included heat flux sensors, thermocouples and an anemometer to record wind speed. Ambient temperature, wind speed and direction, and relative humidity were recorded prior to each test. Omega Type K thermocouples with glass insulator beads were used for measuring exterior temperatures. The thermocouple sensors, mounted in instrument ‘trees’, were positioned to measure air temperatures at various heights above ground level. Five instrument trees monitored the temperature of the environment proximate to the shelters. Exterior thermocouple trees (numbers 1 through 5) measured temperature at heights of 2, 4, 6 and 8 feet (0.61, 1.2, 1.8, 2.4 m) from the ground. The exterior thermocouple trees were made of 4-cm-diameter hollow steel pipe, with holes drilled for imbedding thermocouples and connected to wires inside the pipe. The pipes were wrapped with fire-resistant batting covered with aluminium foil. The thermocouple beads protruded through the foil protective wrapping. The thermocouple wires were connected to a Hobo data logger housed in a metal container buried under a support tripod. Temperature readings were recorded at 1-s intervals during the burn event.
Shorter thermocouple tree stands were placed inside the shelter to monitor temperature during the fire event. These thermal sensors were located at the head end of shelter in order to provide a temperature reading close to the firefighter’s breathing space. The internal instrument trees held Type K thermocouple sensors at heights of 2 and 10 in above the ground (5 and 25 cm). A Type J heat flux sensor, placed flat on the ground directly behind the interior thermocouple tree, measured heat flux inside the shelter. GoPro cameras inside the shelters provided a visual recording of the fire’s real-time effects on the fire shelters.
Two Schmidt–Boelter-type heat flux transducers placed on a steel platforms and positioned exterior to the arrayed test shelters measured the intensity of the fire. The heat flux sensors were oriented in the expected direction of the advancing flame front. An anemometer sensor, positioned in the test site on a tripod 5 feet from the ground, provided a measure of wind speed. The anemometer was placed 1.83 m (6 feet) behind thermocouple tree (TC) 1. A GoPro camera mounted on a tripod located 7.62 m (25 feet) behind the middle test shelter recorded the fire as it moved through the test site. GoPro cameras were protected from heat exposure by housing in heat-resistant boxes.
External thermocouples located on instrument Trees 1 through 4 were used to characterise the temperature profile around each fire shelter at a height of 0.61 m (2 feet) above ground level. These thermocouples were used as they are located closest to the shelters. The temperature profiles generated by the thermocouple were used to measure the time that the air temperature near the fire shelter exceeded the 260 and 660°C benchmark temperatures for the degradation and melting of the aluminised layers of the shelter construction. This configuration enabled a comparison of thermal conditions outside the fire shelter with temperatures of the air inside the shelter at a height of 5 and 25 cm (2 and 10 in) above the floor of the shelter. We calibrated all thermocouple sensors in the laboratory before each field test to ensure their accuracy and proper function.
Results: characterising thermal exposure conditions in field tests
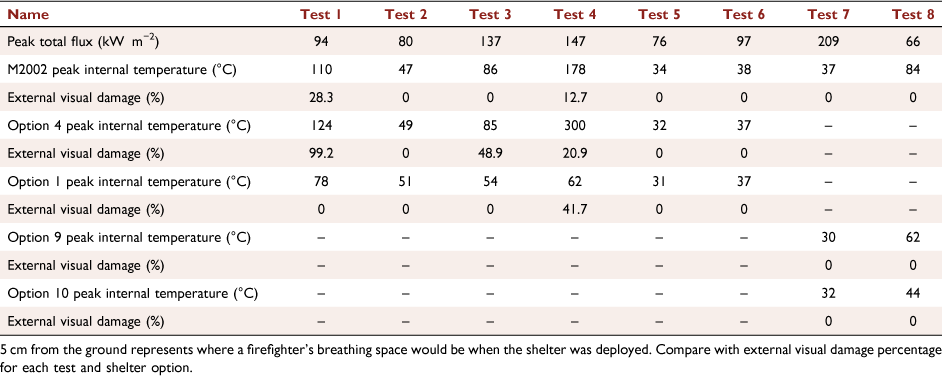
Table 2 shows heat flux intensities recorded at the eight different burn-over events. These data show that the thermal and wind conditions at the test sites varied greatly in the brush, grass and crown fire settings. Peak total heat intensities ranged from less than 70 to over 200 kW m−2, while radiant heat intensities ranged from 21 to 139 kW m−2. This finding confirmed that a significant fraction of the incident heat in the fire environment was in the form of convective thermal energy from flames. Based on the measured heat intensities, the crown fire (Test 7), one of the surface grass fires (Test 4) and one of three chaparral fires (Test 3) produced the hottest fires, at least in the conditions prevailing at the time of these particular burn events. Other thermal data indicate that the localised air temperatures measured by the thermal sensors near the fire shelters themselves provide a better indication of heat exposure for comparing fire shelter performance. Table 3 shows air temperatures measured by the thermal sensors located close to the test fire shelters expressed as the total time that the air temperature near the shelter exceeded 260 and 660°C. These benchmarks are useful indicators of shelter thermal exposure because they represent the melting temperature of aluminium (660°C) and the degradation temperature of the adhesive used to bond the aluminised outer layer in the shelter construction (Nagavalli et al. 2016). These readings show that few of the controlled burns produced temperatures sufficient to degrade the shelter’s outer aluminised layer. They also confirm the variability of thermal exposure in field experiments, indicating the underlying difficulty of estimating thermal exposure to the shelter based on the thermal energy available in different types of fires. For example, because convective winds prevented flame contact with the test shelters in the crown fire test, we observed little effect of the flames on the air temperatures surrounding the test shelters in this burn (Test 7), even though this test nominally represented the highest available fuel energy. Other burn tests, notably two of the brush fires at the Mount Palomar site (Tests 1 and 3) and the grass fire in South Dakota (Test 4) produced higher temperature exposure near the fire shelters, at least for some of the shelter options. However, the most important observation regarding these field thermal exposure data is that they show the difficulty presented in attempting to draw comparisons about the thermal protective performance of fire shelters in controlled burn testing. Decisive performance comparisons are confounded in field tests because the inherent variability of the advancing heat and flames produces different levels of thermal stress on individual shelters at the test site.
Results: the thermal performance of fire shelters in field tests
Table 4 shows the maximum air temperatures measured inside the fire shelters during field tests. All the test shelters, including the M2002 control, maintained interior air temperatures below the 150°C human survivable level. Internal air temperatures exceeded the 150°C criterion in Prototype Shelter 4 and the M2002 shelter only in the grass fire burn conducted in South Dakota. In this test, we observed fire burning under the shelter wall, thus explaining the elevated interior air temperatures recorded. We attributed this anomaly to the combustion of grass and roots characteristic of the organic soil present at the grassy test site.
|
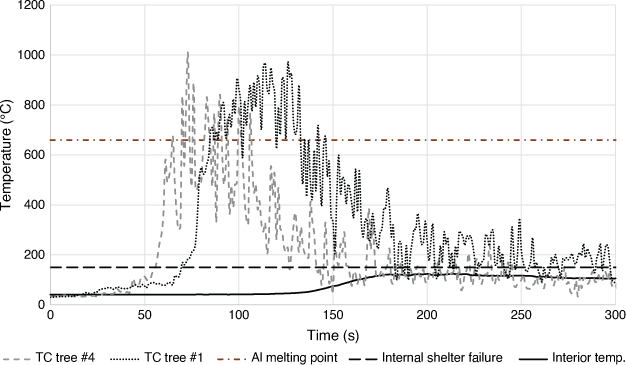
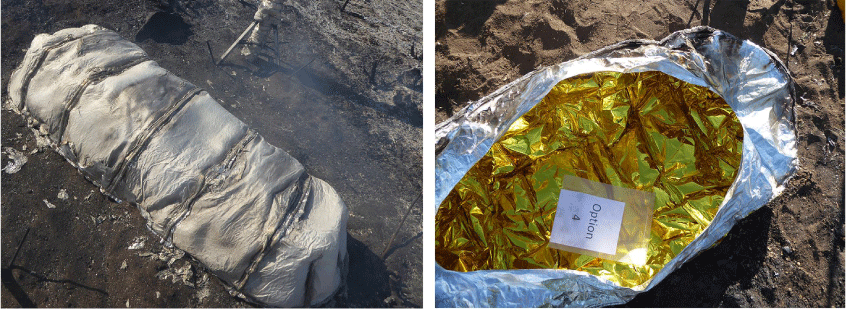
Other field data indicate that the prototype fire shelters maintained a survivable internal air temperature, even in burn conditions that produced external thermal conditions hot enough to degrade the outer aluminised layer of the shelter construction. For example, Fig. 3 shows the rise in the internal air temperatures recorded in Shelter Prototype 4 in Field Test 1, a chaparral burn at the Mount Palomar site. In this graph, the external air temperatures measured by thermocouples attached to the instrument tree located near Shelter 4 are superimposed on the interior temperature profile. It shows that, even as external air temperatures rise to levels sufficient to melt and degrade the aluminised layer of the prototype for several minutes, although the interior air temperature increases, it does not exceed the 150°C survivable level in the breathing space. This level of thermal insulation is evident, even though the heat and flame contact in this controlled burn was sufficient to destroy the outer shell of the prototype shelter (Fig. 4). Fig. 4 compares the visually observable condition of Prototype Shelter 4 in burn Test 1. It shows that, even with the outer aluminised layer badly degraded by the heat and flames, the inner foil layer appears undamaged by the heat. This outcome indicates the efficacy of the reinforced fire-blocking characteristics of the interior layers in this prototype shelter design.
|
|
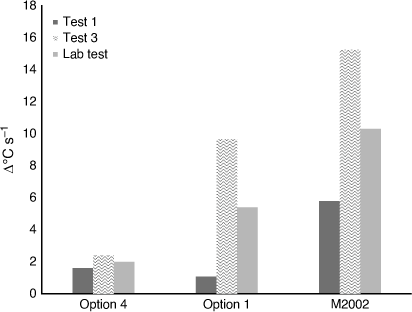
The variability of the heat and flame exposures across the diverse conditions of the field tests, combined with the non-uniform nature of flame contact with individual test shelters, confound statistically meaningful comparisons of individual fire shelter performance. Nevertheless, useful comparisons of the relative performance of fire shelters remain possible. Table 4 and Fig. 5 compare the external and internal air temperatures measured for Prototypes 1 and 4 with the M2002 shelter in Field Tests 1 and 3. Fig. 5 includes the average of laboratory results, giving us three data points. These data use the insulation performance index, calculated as the ratio R660 = ΔT[∑t660]−1 (with units Δ°C s−1 or change in internal temperature per second above 660°C). ΔT = (highest internal temperature − ambient internal temperature, measured 5 cm (2 in) from the floor of the fire shelter) and ∑t660 = (total time external temperature exceeded 660°C). The lower this ratio, the more slowly heat is transferred. Table 4 also includes a measurement of the percentage of the surface area of the shelter visibly degraded in the burn. These data show that, while Prototype Shelter 4 received the most intense heat exposure, the air temperature inside this shelter rose to approximately the same level as measured in the M2002 shelter, even though the M2002 shelter received a lower level of thermal exposure in this test. A comparison of the performance index in Fig. 5, included to enable a means of weighing shelter options in light of external and internal air temperature inside the chamber, confirms the enhanced thermal insulation provided by the prototypes in comparison with the M220 fire shelter (Fig. 6).
|
|
Results: the thermal performance of the fire shelters in the PyroDome™ test
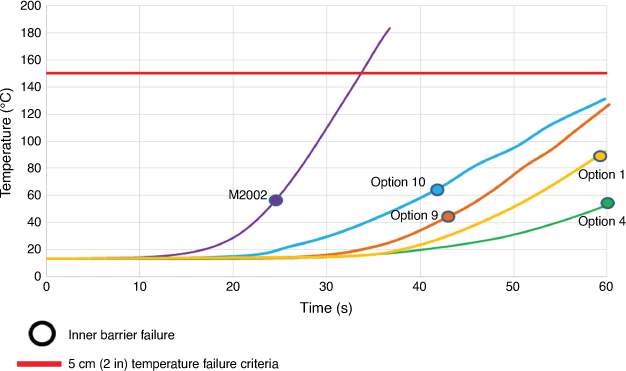
Fig. 6 shows the rise in air temperature inside fire shelters measured in the PyroDome™ full-scale simulation of a wildfire burn-over event. Two measurements were used to rate shelter performance based on the PyroDome™ test. The time in seconds required for the temperature of a thermocouple located 2 in (5 cm) from the floor of the test shelter to reach the 150°C survivability level provided one basis for rating the thermal protective insulation provided by the fire shelter. The other performance measure is the time that elapsed before we observed failure of the innermost layer of the shelter, as recorded by a GoPro® camera located inside the shelter. The appearance of flaming combustion inside the shelter wall, or visually observed loss of flame barrier integrity showing catastrophic heat transmission were indicative of failure of the shelter’s innermost wall.
PyroDome™ data show that all the prototype constructions provide enhanced thermal insulation in comparison with the M2002 fire shelter. They show that Prototype 4 provided at least two times better thermal insulation during intense exposure to turbulent flames in comparison with the current shelter, M2002. The air temperature near the floor of the M2002 shelter reached 150°C in 35 s. In comparison, the near-floor air temperature in shelter Option 10 after 1-min exposure to intense turbulent flames was 133°C, or still below the 150°C threshold survival temperature.
Fig. 6 shows that the time elapsed until innermost failure is significantly shorter than the time metric typically used to rate fire shelter performance, based on air temperature readings taken near the floor of the test shelter. We observed innermost wall failure in the M2002 shelter after only 24 s of turbulent flame exposure. Prototype 10 inner-wall failure occurred after 42 s, almost doubling the predicted survival time in turbulent flames.
The near-floor temperature measured in Prototype shelter 4, the 2.4 kg (5.3 lb) option at 60 s is only 53°C, nowhere near the 150°C survival threshold. Owing to oxygen constraints in the test system, flame exposure on the shelters was unable to consistently go past 60 s. Within this time period, none of the prototype fire shelters transmitted heat sufficiently to cause the air close to the shelter floor to exceed the 150°C survivable level in the 60-s exposure to heat and flame conditions produced in the PyroDome™ test.
It is useful to compare thermal and flame conditions produced in the Pyrodome™ tests with the thermal conditions measured in the field tests. PyrodomeTM intensities produced thermal and physical degradation effects visually similar to the post-exposure thermal degradation observed in the fire shelter exposed in prescribed burn tests (Fig. 7). The heat flux intensity of the controlled burns conducted by this study peaked at levels ranging from 70 to more than 200 kW m−2. This means that the average flame exposure of 80 kW m−2 used in the PyroDome™ protocol, and in standardised laboratory tests of materials thermal protective performance, is at the low end of the range of the maximum heat exposures produced in real wildland burn-over environments. At the same time, we observed that the controlled 80 kW m−2 flame exposure produced in the PyroDome™ test appeared to produce a higher thermal strain on the test shelters, particularly on the M2002 control shelter, than did the field test conditions. We attribute this outcome to the variable nature of the flames in a burn-over. The unpredictable conditions often resulted in little or no direct flame contact with the aluminised layer of the fire shelters in the field test series. Because retention of the outer aluminised layer is crucial to the fire shelter’s ability to block heat, these outcomes support the hypothesis that contact with turbulent flames plays an important role in shelter thermal insulation in wildfire burn-overs.
Discussion
This field test series has demonstrably confirmed the difficulty involved in consistently exposing fire shelters to heat and flames in staged burn-over events, even with carefully prepared sites and fuel distributions. The unavoidable unpredictability of winds and the resulting variability of the interaction of the flames with test shelters produce essentially random thermal exposures, even with the shelters deployed in close proximity on cleared test sites. In field burns, both radiant and convective energy varied through space and time for each test site during the field trial. Most significantly, these data show that the air temperatures measured by the instrument trees located near the test fire shelters varied greatly, depending on prevailing uncertainty of the fire front location with respect to the position of the shelters. The variability of the test site conditions had a profound effect on the observed visual damage to the fire shelters.
At the same time, the field tests provided valuable data on the diverse thermal conditions that may be present in different types of wildland burn-overs. They show that most important factors influencing fire shelter performance are the air temperature near the exterior of the shelter, and the extent of direct contact between the shelter walls and wind-driven turbulent flames. Because of the variable nature of the burn events, many of the field test set-ups did not produce heat assaults at intensity levels sufficient to enable a meaningful comparison of the insulation performance of the test shelters. Of the eight field tests conducted, the chaparral burns at the Mount Palomar site provided the greatest opportunity for comparing the performance of prototype shelter constructions with the M2002 control shelter (Fig. 5). These burns produced thermal assaults adequate to enable comparison of two of the prototype shelters (Option 1 and 4) with the M2002 control, even though the individual shelters received different levels of heat exposures. These tests indicate the efficacy of prototype constructions that incorporated a convective heat-blocking barrier and enhanced thermal insulation layers. They show that the air temperature in the breathing space near the shelter floor remained below the 150°C survivable level, even in burns that destroyed the outer aluminised layer of the shelter. It is noteworthy that all the fire shelters tested in this study, including the M2002 fire shelter, provided thermal insulation sufficient to maintain a survivable interior air temperature in the field tests. The only test that produced air temperatures exceeding survivable levels inside the shelters occurred when deployed in an area where combustible grass and roots remaining in the soil contributed to fire spread under the shelter walls and inside the shelter. This anomalous event showed the value of deploying fire shelters in areas cleared of combustible ground cover and soil materials, or in areas where the organic soil may itself contribute to flame spread.
Conclusions
This field test series has provided insights into the value of using laboratory testing to compare the insulation performance of fire shelters in burn-overs. It showed that the PyroDome™ heat intensity of 60–90 kW m−2 is approximately equivalent to the heat intensity measured in a prescribed burn conducted in a chaparral setting where direct contact with turbulent flames produced visible degradation and delamination in test shelters. These conditions were at the lower range when compared with overall field measurements when evaluating fire shelter performance.
The testing methods used for the field trials should contribute to an evolving methodology for field trial experiments. With three data points, there is little confidence in any result and improvements are required in test site layout, size reduction of scientific equipment and grouping of fire shelters. Lastly, we suggest that multiple tests be conducted in the same fuel type. Chaparral and tallgrass prairie were the two best fuel types conducive to providing needed results.
The performance of the enhanced-insulation prototype fire shelters exceeded the M2002 fire shelter in the Pyrodome™ full-scale lab test. The field tests generally supported this comparison, although none of the field burns produced sustained heat and flame exposures sufficient to cause the M2002 shelter to fail based on the 150°C air temperature criterion. We note that field test conditions that resulted in the highest thermal strain were tests that produced significant visually evident thermal degradation to the outer aluminised layer of the shelter. This is a significant finding because it indicates the importance of producing flame conditions in full-scale laboratory tests of shelter performance that replicate the thermal damage to the outer layer of the test shelter observed in the worst-case field tests.
In summary, we conclude that the controlled heat and flame exposure produced in the PyroDome™ full-scale laboratory test enables a more consistent and decisive comparison of fire shelter thermal performance than possible in the variable thermal environments present in field simulations of wildfire burn-over events. The findings of the present study further contribute to other studies that have validated the use of laboratory tests as practical alternatives to field testing for evaluating the thermal performance of fire shelters against burn-overs that occur in wildland fires.
Limitations of this study
No laboratory-generated data can completely characterise the range of conditions in actual wildfire burn-overs. This study has confirmed that these events are unique and physically complex. The thermal exposures in the field-test series discussed in this study are specific to the conditions at the individual test sites. These tests occurred on sites nominally cleared of combustible fuel sources. They do not represent the hottest wildfire burn-overs that can produce thermal conditions that can easily overwhelm the limited protective insulation provided by any field-deployable fire shelter. This study focused on evaluating thermal performance. The ultimate performance of wildland fire shelters must consider many other properties, as outlined by the US Forest Service guidelines and by the National Fire Protection Association (NFPA) performance standard for wildland firefighter protective equipment (NFPA 1977 Standard on Wildland Firefighter Protective Equipment). This study is not intended to qualify the safety benefits or to recommend or exclude any commercial product or fire shelter construction.
Data availability
The data used to generate the results in this paper are available. To access, please contact corresponding author. The data will be shared using Google Drive. There are 240 files with 7000+ records, 32 videos, and 240 pictures.
Conflicts of interest
The authors declare no conflicts of interest.
Declaration of funding
We would like to acknowledge the DHS FEMA Assistance to Firefighters Grant Program for funding this work.
Acknowledgements
The authors gratefully acknowledge the USDA Forest Service, US Fish and Wildlife, Bureau of Land Management, CALFIRE, North Carolina Forest Service, North Carolina Parks, Alberta Fire Fighters and Northwest Territories Environment and Natural Resources for their cooperation, and for providing opportunity to test on lands managed by their agencies. We are grateful to those who helped at all the test sites including Stephen Fillmore, Tim Gray, Ronald ‘Dink’ Gregor and Gil Toscano at the Cleveland National Forest. Our thanks go to Jeff Meadows, Colby Crawford, Scott Beacham at the USFWS Wetland Management District in Madison in South Dakota. Our thanks go to Mark Ackerman, Gary Dakin, Wes Steed, and others in Canada, as well as to Kenny Griffin, Mark Bost, Thomas Crate and Jimmy Dodson and the North Carolina Forest Service, and to all who volunteered to participate from locations all over North America.
References
Alashe GS (2018) Developing a Bench Scale Test Method for Evaluating the Effects of Dynamic Flame Exposures on Wildland Fire Shelter Materials. Master’s thesis, Textile Engineering, North Carolina State University, North Carolina, USA. Available at https://repository.lib.ncsu.edu/handle/1840.20/37170 [Verified 3 December 2021]Anderson L (2003) The New Generation Fire Shelter. Boise, ID, USA:National Wildfire Coordinating Group, Fire Equipment Working Team, National Interagency Fire Center. Publication Management System (PMS), 411 30 p. https://www.nwcg.gov/sites/default/files/publications/pms411.pdf
Interagency Fire Shelter Task Group (2007) Wildland Fire Shelter History and Development of the Generation Fire Shelter. Available at https://www.fs.fed.us/t-d/programs/fire/documents/shelhist.pdf [Verified 13 July 2021]
Leitner M, Leitner T, Schmon A, Aziz K, Pottlacher G (2017) Thermophysical Properties of Liquid Aluminum. Metallurgical and Materials Transactions A 48, 3036–3045.
| Thermophysical Properties of Liquid Aluminum.Crossref | GoogleScholarGoogle Scholar |
Nagavalli A, Hummel A, Akyildiz H I, Morton-Aslanis J, Barker R (2016) Advanced Layering System and Design for the Increased Thermal Protection of Wildland Fire Shelters. In ‘Performance of Protective Clothing and Equipment, 10th Volume, Risk Reduction Through Research and Testing’. (Eds B Shiels, K Lehtonen) pp. 102–116. (ASTM International: West Conshohocken, PA)
Pozzobon V, Levasseur W, Do K-D, Palpant B, Perré P (2020) Household aluminum foil matte and bright side reflectivity measurements: Application to a photobioreactor light concentrator design. Biotechnology Reports 25, e00399
| Household aluminum foil matte and bright side reflectivity measurements: Application to a photobioreactor light concentrator design.Crossref | GoogleScholarGoogle Scholar | 31867227PubMed |
Roberts MR (2013) Fire Shelters in R&D Stage may have Protected Granite Mountain Hotshots, Engineer Says. Fire Chief (Online Exclusive). Available at https://www.proquest.com/trade-journals/fire-shelters-r-d-stage-may-have-protected/docview/1380587367/se-2?accountid=26957 [Verified 30 November 2021]
Williams JR (2017) Field Testing Wildland Fire Shelters. Master’s thesis, Forestry and Environmental Resoures, North Carolina State University. North Carolina, USA. Available at https://repository.lib.ncsu.edu/handle/1840.20/35101 [Verified 1 December 2021]


