The role of helicity and fire–atmosphere turbulent energy transport in potential wildfire behaviour
Jiawei Zhang A B * , Marwan Katurji B , Peyman Zawar-Reza B and Tara Strand A
A New Zealand Forest Research Institute, Scion, Rotorua, New Zealand.
B School of Earth and Environment, University of Canterbury, Christchurch, New Zealand.
International Journal of Wildland Fire 32(1) 29-42 https://doi.org/10.1071/WF22101
Submitted: 21 June 2022 Accepted: 5 December 2022 Published: 4 January 2023
© 2023 The Author(s) (or their employer(s)). Published by CSIRO Publishing on behalf of IAWF. This is an open access article distributed under the Creative Commons Attribution-NonCommercial-NoDerivatives 4.0 International License (CC BY-NC-ND)
Abstract
Background: Understanding near-surface fire–atmosphere interactions at turbulence scale is fundamental for predicting fire spread behaviour.
Aims: This study aims to investigate the fire–atmosphere interaction and the accompanying energy transport processes within the convective boundary layer.
Methods: Three groups of large eddy simulations representing common ranges of convective boundary layer conditions and fire intensities were used to examine how ambient buoyancy-induced atmospheric turbulence impacts fire region energy transport.
Key results: In a relatively weak convective boundary layer, the fire-induced buoyancy force could impose substantial changes to the near-surface atmospheric turbulence and cause an anticorrelation of the helicity between the ambient atmosphere and the fire-induced flow. Fire-induced impact became much smaller in a stronger convective environment, with ambient atmospheric flow maintaining coherent structures across the fire heating region. A high-efficiency heat transport zone above the fire line was found in all fire cases. The work also found counter-gradient transport zones of both momentum and heat in fire cases in the weak convective boundary layer group.
Conclusions: We conclude that fire region energy transport can be affected by convective boundary layer conditions.
Implications: Ambient atmospheric turbulence can impact fire behaviour through the energy transport process. The counter-gradient transport might also indicate the existence of strong buoyancy-induced mixing processes.
Keywords: convective boundary layer, energy transport, fire behaviour, fire-atmosphere interaction, helicity, large eddy simulation, quadrant analysis, turbulence.
Introduction
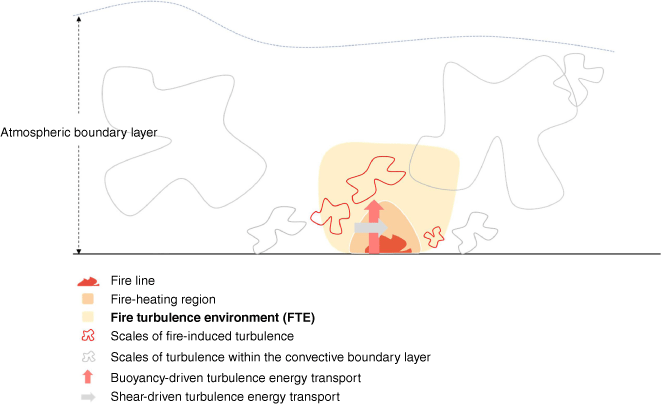
Atmospheric motions vary in scale from thousands of kilometres (planetary circulations) to sub-meter turbulence eddies (Orlanski 1975). These atmospheric motions can interact and influence fire behaviour at different scales (Potter 2002). Synoptic and mesoscale weather patterns can impact local fire risk levels through changing fuel moisture, average wind speed and air temperature. These impacts have been routinely considered in the fire risk management operations through fire weather indices such as Haines Index (Haines 1989; Potter 2018) and Fire Weather Index (Van Wagner 1974). At the microscale (kilometre to sub-metre), atmospheric turbulence is known to influence extreme fire behaviour such as fire swirls (Forthofer and Goodrick 2011; Seto and Clements 2011) and terrain-scale vorticity controlling lateral fire spread (Simpson et al. 2016). The thermal internal boundary layer or the fire turbulence environment (hereafter referred to as the FTE; light yellow region in Fig. 1) caused by localised heating of fire, and the atmospheric boundary layer (ABL) that envelops it, develop at integral time scales spanning from seconds to tens of minutes (Stull 2012). Within the FTE, atmospheric turbulence plays an important part in energy transfer between the fire and the surrounding atmosphere (Kremens et al. 2012; Finney et al. 2015; Sullivan 2017; Dickinson et al. 2021).
The complexity of turbulent interactions across the length and time scales during the short term (within ABL integral scales) development of a fire makes observations of coupled fire–atmosphere interactions very difficult. Coupled fire combustion and spread models like HIGRAD/FIRETEC (Cunningham and Linn 2007; Pimont et al. 2020) and Wildland–Urban Interface Fire Dynamics Simulator (WFDS) (Mell et al. 2007) can assist in studying the dynamics of fire–atmosphere interactions. Applications using these models and other atmospheric large eddy simulation models, such as APRS (Kiefer et al. 2014) and UU-LES (Sun et al. 2009), can give insight on the role of ambient atmospheric turbulence on fire behaviour. For example, Sun et al. (2009) simulated a fire spread case under a prescribed atmospheric Convective Boundary Layer (CBL) that used a fixed 240 W/m2 land surface heat flux of 240 W/m2 and constant mixed layer depth. They found that, compared with the neutral atmospheric stability condition with similar ambient mean wind speed, fire spread rate was increased by 25%, which shows the impact of the ambient atmospheric turbulence regime on the fire spread behaviour. Under neutral atmospheric stability, Kiefer et al. (2015) showed that although both ambient and fire-induced turbulence was significantly suppressed within the canopy due to the drag from the canopy, the fire-induced turbulence is still much higher than the ambient turbulence. On the other hand, when under a convective boundary layer, similar canopy and mean wind speed settings can result in a much-increased turbulence intensity, which is comparable to the TKE buoyant production associated with a fire. These results show the importance of LES numerical modelling for studying, categorising, and developing a better understanding on how atmospheric turbulence regimes can influence fire behaviour – a research area that is still not fully developed (Potter 2012).
The quantification of turbulent heat and momentum fluxes is important to better describe the coupled processes within the FTE that can lead to the spatial and temporal variation in fire behaviour. Traditional observational studies mainly obtained turbulence information using point measurements, such as in situ fire towers instrumented with sonic anemometers and thermocouples (Clements et al. 2007; Frankman 2009; Seto et al. 2014; Heilman et al. 2019). Although experimental observation methods like the thermal infrared camera have been used in some field campaigns to estimate the spatial radiative heat flux, the convective heat flux is still limited to the traditional point measurements (Hudak et al. 2016; Dickinson et al. 2021). This limitation in field observations makes it difficult to study the spatial heterogeneity of convective heat transport in relation to fire spread and the overlying atmospheric turbulence structure. The constraint increases in heterogeneous vegetation cover and density that can lead to a spatial variability in the turbulent fire heat transport (Linn et al. 2013; Kiefer et al. 2015). On the other hand, the well-developed convective boundary layer can lead to aperiodic episodes of downward bursts of turbulent momentum energy, which is also spatially heterogeneous and unpredictable in nature. Because prescribed ignitions and wildfire outbreaks commonly happen during the daytime (Coen et al. 2013; Thomas and Butry 2014), there is a need to understand how these atmospheric turbulence events interact with fire in relation to both ambient atmospheric turbulence intensity and fire heat release magnitude. Moreover, understanding how such interactions impact the spatial near-surface temperature perturbations can be linked to how convective heat transfer onto the un-burnt fuels is modulated.
Quantifying turbulent heat and momentum fluxes is important to better describe the coupled processes within the FTE that can lead to spatial and temporal variation in fire behaviour. This work aims to describe the role of the ambient atmospheric flow in the FTE and processes involved. The main objective is to understand processes that control the spatial and temporal development of turbulent heat and momentum transport under different convective boundary layer (CBL) turbulence intensities. The impact of different fire intensities for each turbulence regime is also considered using a 2D hot patch with different fixed heat flux intensities. The novel quantitative partitioning of heat and momentum flux using spatially distributed energy partitioning (referred to as spatial quadrant analysis) allows the definition of spatial energy transfer zones that define the scales and intensities of these interactions. Finally, and by calculating the helicity above the fire region influenced by atmospheric motion, the potential impact of fire behaviour from atmospheric turbulence is discussed in relation to fire and atmospheric turbulence intensity levels.
Methods
Model description and set-up
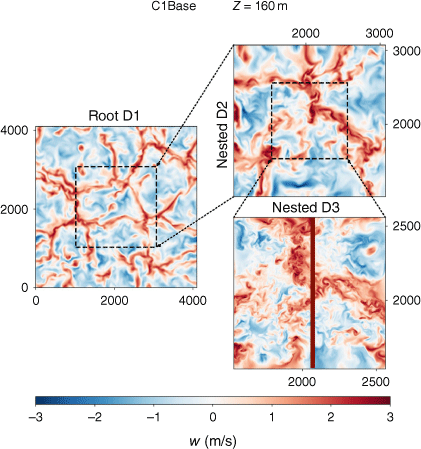
The PArallelized LES Model (PALM) model – developed at the Institute of Meteorology and Climatology (IMUK) of Leibniz University Hannover, Germany – is based on the non-hydrostatic incompressible Navier–Stokes equations (Raasch and Schröter 2001; Maronga et al. 2015). The incompressible assumption is suitable for fire–atmosphere interaction simulations because atmospheric wind speed under typical forest fire scenarios still falls below the Mach number threshold for compressible flow (Tang 2017). A modified Deardorff 1.5-order turbulence closure is used in the model, which treats the energy transport in sub-grid scale according to the local gradient of the average quantities (Deardorff 1980; Moeng and Wyngaard 1988). All the simulations were carried out using three nested domains (Table 1, Fig. 2) whereas the presented analysis mainly used the innermost (D3) domain. The root domain (D1) size was selected to be comparable to previous atmospheric CBL studies (Henn and Sykes 1992; Xue and Feingold 2006). The lateral boundary condition for the D1 domain was set to periodic to allow the boundary layer development. One-way nesting was used to step down to the innermost domain (D3) located in the centre D1. The resolution for D3 was selected to 4 m to resolve smaller near surface motions. For the fire cases, a spatially fixed 2D 12 m wide hot patch was placed at the surface in the centre of the D3 domain. This hot patch simulated a fire with a constant heat flux to represent an idealised line fire condition.

|
|
Three groups of simulations were carried out with each using a different land surface (sensible) heat flux to cover the typical surface heat flux observed for a range of weather conditions, from early morning to close to mid-latitude summer noon time (Table 2) (Sturman et al. 1999; Yates et al. 2001). Inside each group, three fire scenarios were simulated using different hot-patch heat fluxes (low, medium, or high) to represent fire intensities from a grassland fire (Low) (Clements et al. 2007) to medium (Med) and large grassland fires and bush fire (High) respectively (Silvani et al. 2009; Kiefer et al. 2015). The aforementioned one-way coupling and having the hot-patch only in the D3 domain ensures that the atmospheric flow field is the same across all cases in D1 and D2 domain in the same group. Thus, a base case, with no simulated fire, was also run as a control case to represent the ambient atmospheric flow without fire impact.

|
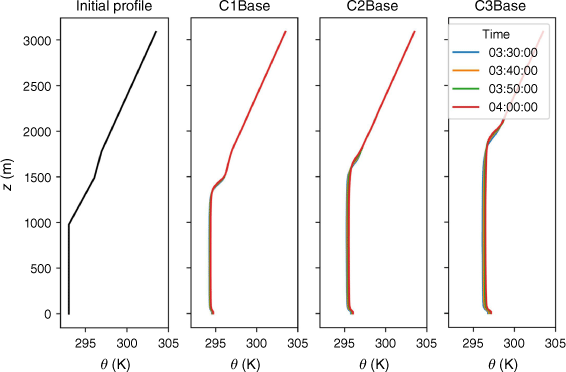
To ensure a typical CBL representation, the initial condition of D1 for the vertical potential temperature profile was derived from the widely used Cooperative Atmosphere Surface Exchange Study (CASES) campaign observations (LeMone et al. 2000; Yates et al. 2001; Rizza et al. 2013). The potential temperature was set to 293 K from the surface up to 1 km, with an inversion then applied (Fig. 3). This setup is also similar to previous fire–atmospheric interaction studies (Kiefer et al. 2015, 2016, 2018) and allows for realistic CBL growth. To avoid false gravity waves caused by the numerical domain top boundary, a Rayleigh damping layer is applied at the upper 30% of the D1 domain.
|
To achieve steady-state in the CBL and buoyancy-driven turbulent flow, all cases were run for 4 h total simulation time, with the first 3.5 h used for CBL development. Only the last 0.5 simulated hour was used for analyses. The potential temperature profiles from the base case in each group shows the growth of the CBL height with different land surface fluxes, suggesting the simulations have reached quasi-steady stage after 3.5 h (Fig. 3).
Helicity
Helicity is used to explore the changes or transfer of vorticity caused by the interaction between the fire-induced buoyancy and the ambient atmospheric flow. The helicity is calculated using the non-integral form (Eqn 1). To better quantify the domain-wide helicity, the averaged magnitude of the vertical helicity component is calculated from the horizontal cross-section of the innermost (D3) domain.

where  is the velocity vector and
  is the vorticity vector
  . In weather forecasting, various parameters like the storm relative helicity (SREH) and superhelicity have been derived from the helicity for different application purposes (Hide 1989). For example, SREH, an integrated variation of the helicity, is used in severe storm forecasting to indicate the potential of the rotation in the low level (0–3 km) wind field (Markowski et al. 1998; Shiqiang and Zhemin 2001).
Although helicity has been previously used in the wildfire studies, it was mainly deployed for qualitative analysis (Canfield et al. 2014; Finney et al. 2015). Here, helicity is used in a quantitative way to study fire-induced flow change and the role of the fire–atmosphere turbulence interaction in it. Because the fire-induced buoyancy was found to be relatively shallow at the fire intensity range used in this study, the vertical component of the non-integral form (Eqn 2) is used.

Similar to other parameters analysed in this study, to highlight the fire-induced influence, helicity is calculated at 10 m AGL to represent the helicity change near the surface.
Quadrant analysis
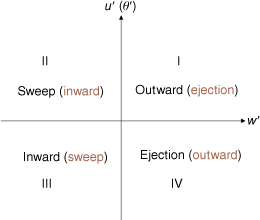
In any point location, the time series of instantaneous vertical transfer of horizontal momentum (w′u′) and kinematic heat flux (w′θ′) can be drawn in the Cartesian coordinate system (Fig. 4) with w′ and the respective perturbation variable as the coordinates (Shaw et al. 1983). Each quadrant in the coordinate system has a different physical interpretation.
|
Based on quadrant analysis, Wyngaard and Moeng (1992) implemented the concept of energy transport efficiency, which was defined as the ratio of downgradient flux to total flux. The mathematical form of energy transport efficiency is further discussed by Li and Bou-Zeid (2011) and is shown below,

where c represents variables like velocity, temperature or other scalars. The flux in each quadrant is calculated using the equation below,

where Ij is defined as,

Noted by Wallace (2016), the sweep and ejection motions account for most of the shear-driven turbulence and the downgradient momentum transport, and the inward and outward motions contribute to the counter-gradient (or upgradient) momentum transport. As for the heat (w′θ′) flux, the sweep/ejection and outward/inward quadrants are switched, for example I and III quadrants represent the ejection/sweep and II and IV represents the inward/outward motions (Li and Bou-Zeid 2011). From the above definition, the transport efficiency (η) is positive when the Ftotal and Fdowngradient have the same sign. This means the down-gradient transport is dominating the energy transport process and the turbulence is mainly shear driven. On the other hand, when the counter-gradient transport component is strong enough to counteract the down-gradient transport, the transport efficiency can be very small and even negative.
Previous studies usually use quadrant analysis on time series of point data. We applied the same method to time series in the 3-dimensional flow field (the innermost D3 domain in all simulations) simulated by the LES model. The spatial patterns of the quadrant analysis, as shown in the next section, can be used to obtain spatial information about the momentum and heat transport within the FTE.
Results
As mentioned in the previous section, the base case in each group serves as a control case to represent ambient atmospheric flow without the impact from fire. Because the fire (hot patch) was only set at the innermost domain (D3), the analyses in this section are all done using data from the D3 domain of the simulations.
General flow patterns within the FTE
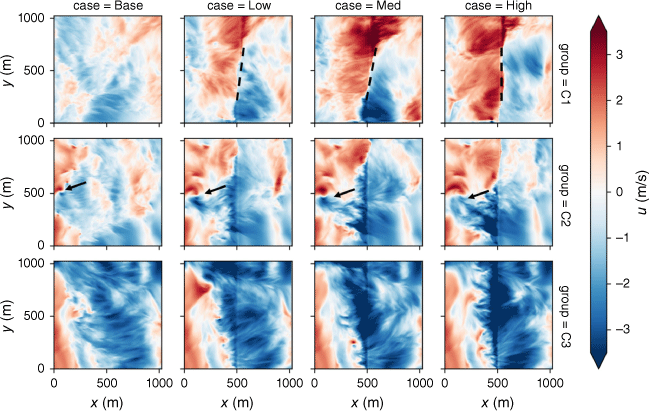
Fig. 5 shows the horizontal cross-section of the 1-min averaged u velocity component at 10 m above ground level (AGL) after the fire had been set up for 15 min. In the C1 group, representing the relatively weak surface heat flux-induced CBL, a clear fire-induced convergence zone is formed across all fire cases but no such zone exists in the base case. Although not shown here, the convergence zone gradually developed and persisted from setting up the hot patch until 20 min after. The convergence zone is a result of the buoyancy above the fire line as the location of the convergence zone aligns with the hot patch that simulates the fire line. In the C2 group, vortex structures can be found in both the ambient atmosphere (represented by the base case) and the fire cases. These vortex structures remain and are strengthened with the addition of the simulated fire. All C3 group cases show similar flow patterns with predominant negative values in the centre of the domain and positive values at the edge. Although not shown here, the fire cases in the C2 and C3 group maintain similar flow patterns of all velocity components to the respective base case up until 20 min after the fire line set-up.
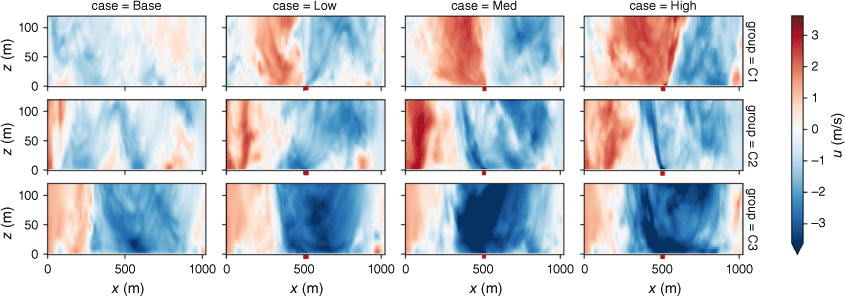
The x–z vertical cross-section at the centre of the D3 domain further confirms that no background convergence zone can be found in the ambient atmosphere in the C1 group (Fig. 6). The fire-induced convergence zone, on the other hand, is quite deep and extends to a much higher level (more than 100 m) above the hot patch in all fire cases. In the C2 and C3 group, representing relatively stronger convective boundary layers with much higher land surface heat flux (240 and 360 W/m2 respectively), there is no convergence zone above the hot patch in any of the fire cases. Compared with the horizontal cross-section (Fig. 5), the convergence zones in the C2 and C3 group are the flow structures that exist in the ambient atmosphere.
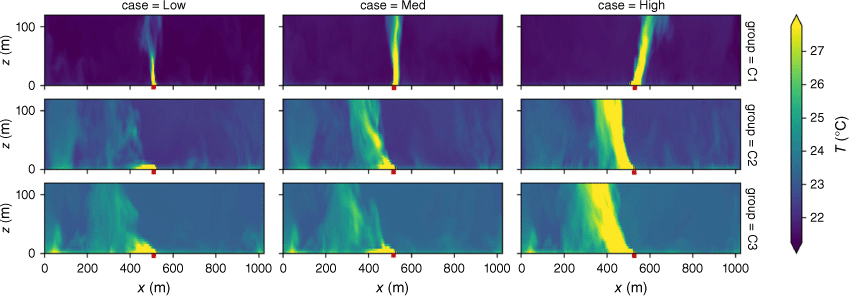
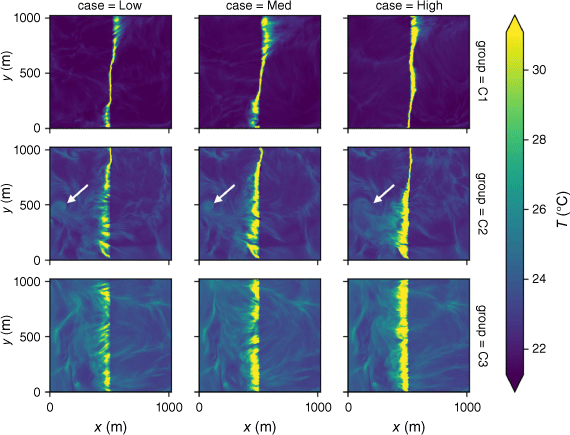
Fire impacts the atmospheric flow through the buoyancy/pressure gradient associated with the fire heat release, and the ambient atmosphere, in turn, can also impact the fire heat release and the fire-induced buoyancy heat plume structure. Close to the surface (10 m AGL), the temperature anomalies caused by fire also show distinctive characteristics between C1 and the two other groups (Fig. 7). Even 15 min after the fire line is set up, the high temperature anomaly zone caused by the fire maintains a relatively straight and narrow line at 10 m AGL in all fire cases in the C1 group. Conversely, the high temperature anomaly in the fire cases in the C2 and C3 groups show much wider horizontal extent. For the fire cases in the C2 group, the vertex structure (indicated by arrows in Figs 5, 7) contributes to the horizontal stretching/expanding of the high temperature zone.
|
The vertical cross-section shows that, in the C1 group, the fire-induced buoyancy plume maintains a relatively vertical orientation with very limited horizontal dispersion up to 100 m AGL (Fig. 8). On the other hand, the plume displays a much wider horizontal dispersion, which aligns with the horizontal cross-section results, in all fire cases in the C2 and C3 group. Although only data at the 15 min after the fire being set up is shown here, the results are consistent from the fire being set up until this point.
Helicity
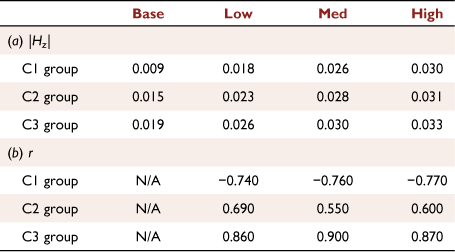
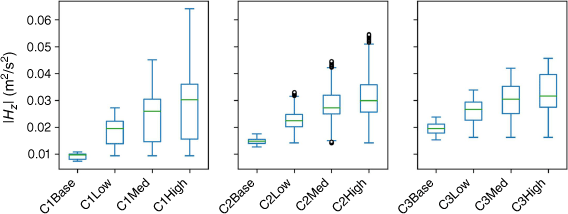
Helicity is used to explore the changes or transfer of the vorticity caused by the interaction between the fire-induced buoyancy and the ambient atmospheric flow. The magnitude of the domain average vertical helicity component (|Hz|) is the lowest (0.009) in the base case in the C1 group (C1Base), whereas the magnitude is much higher in the base cases in the C2 and C3 groups (Table 3a, Fig. 9). In the fire cases, the average/median values of |Hz| are higher than in the base cases and remain similar across all groups. In general, |Hz| in the fire cases also has much higher variation. |Hz| in the C1Base has the smallest variation and C3Base has the largest variation. In contrast, the variation of the |Hz| in the fire cases is reversed, with the fire cases in the C1 group having the largest variation among all three groups.
|
|
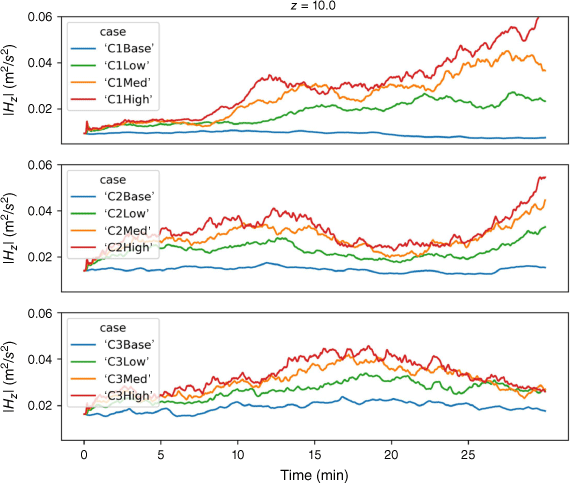
Similarities in the trend of the |Hz| time series can be found between the fire cases and the base case, especially in the C2 and C3 groups (Fig. 10). The similarity can be further confirmed by the correlation coefficient (Table 3b). In the C2 and C3 group, fire cases and the ambient atmospheric flow represented by respective base cases have high correlation coefficients up to 0.9. The correlation coefficients are also about 40% higher in the C3 group than in the C2 group. The high correlation coefficients indicate that, under the convective boundary layer conditions comparable to the C2 and C3 groups, ambient atmospheric flow can maintain its coherent turbulent flow structures and impact fire behaviours.
|
On the other hand, strong anticorrelation can be found between the fire cases and the base case in the C1 group, which means an increase of |Hz| in the fire cases corresponds to a decrease of the |Hz| in the ambient atmosphere. In comparison with the C2 and C3 group, this might suggest that fire might have a more dominant impact on the helicity field in the C1 group. Because the fire strength, represented here by the hot patch heat flux, remains the same, this anticorrelation suggests that the impact of fire on the helicity field is stronger when the impact from the ambient atmosphere is weak.
Energy transport efficiency
Although the above analysis has shown evidence of different fire–atmosphere interaction under different CBL conditions, to understand the physical processes behind these results, the turbulent transport efficiency must be further investigated.
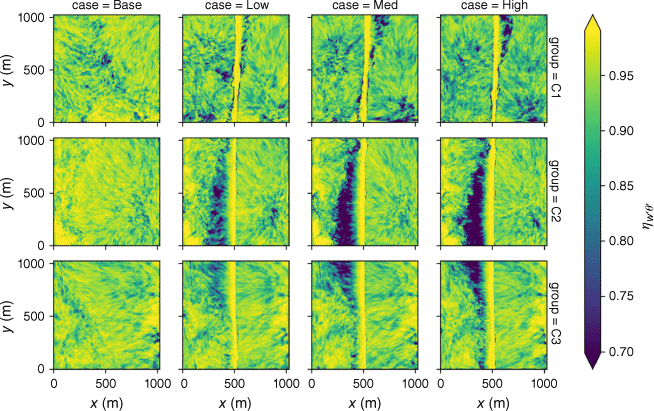
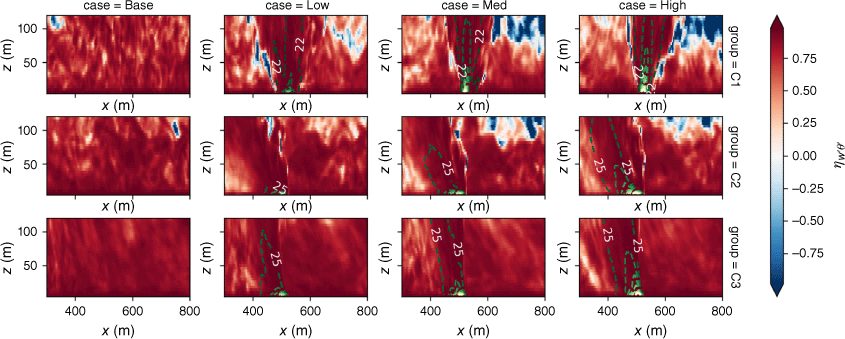
Horizontal and vertical cross-sections of the vertical heat transport efficiency (ηw′θ′) from all cases are shown in Figs 11, 12. As can be seen, the hot patch in all fire cases produces a high efficiency transport region (ηw′θ′ above 95%), which has a horizontal width varying from 20 (near the surface) to 100 m (100 m AGL). The high efficiency transport zone is a result of the strong buoyancy force from the fire heat release, which enhances vertical heat transport. The efficiency difference between the zone and the ambient atmosphere is larger in the C1 group, which makes the zone more distinctive in Fig. 12. From the horizontal cross-section it can also be seen that, in the C2 and C3 group, the transport efficiency at 10 m AGL decreased in some areas immediate to the left of the fire line. In comparison with the average temperature contour lines in the vertical (Fig. 12), it is possible that the decrease of the vertical heat transport efficiency is a result of less vertical heat transport and more horizontal heat transport caused by the wider and more titled vertical temperature distribution close to the surface.
Counter-gradient vertical heat transport zones (ηw′θ′ < 0) can be found in most of the cases. Especially in the C1 group, the counter-gradient vertical heat transport exists between the fire-induced temperature anomaly area (contour lines in Fig. 12) and the and the ambient atmosphere. More counter-gradient vertical transport can be found in the higher intensity (C1Med and C1High) fire cases compared with the low intensity fire case (C1Low).
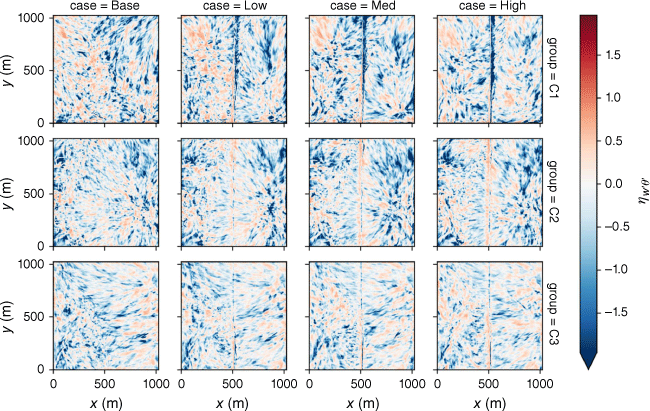
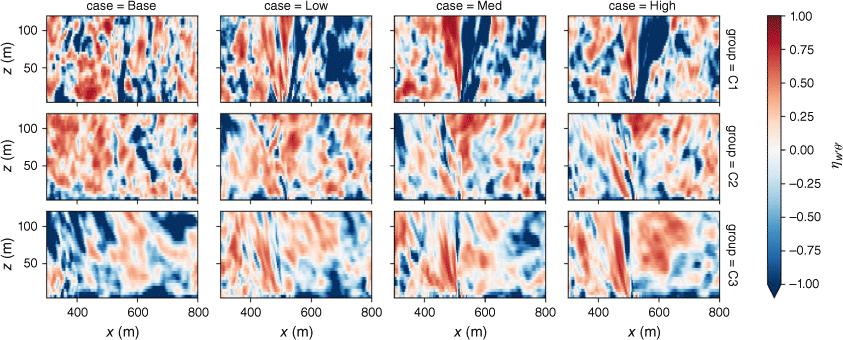
As for the momentum transport, a fire-induced counter-gradient (negative values) momentum transport zone can also be found in the fire cases from the C1 group (Figs 13, 14). Much less fire-induced counter-gradient (negative values) momentum transport can be found in the C2 and C3 groups. On the contrary, a down-gradient (positive values) momentum transport zone over the fire line can be found in the fire cases from these two groups.
Discussion and conclusion
The convective Froude number (Fc) and Byram’s convective number have been used to define the atmosphere–fire interaction regimes (Sullivan 2007; Frangieh et al. 2020). When Fc2 is less than 1, fire behaviour will be influenced by the fire-induced buoyancy force, dominating the influence of the ambient atmosphere, but erratic or extreme fire behaviours are likely to occur when Fc2 is close to 1. In this work, the simulations were all carried out in the low Fc range. The largest Fc2 for the C3 group, the Fc2 is around 0.66 (average ambient wind speed at 10 m AGL is 1.98 m/s, fire depth is 12 m). Although the simulations were all done without the move/spread of the fire line, the fact that all the simulations are in the low Fc category is still a good indication that convective boundary layer turbulence can impact fire spread behaviour when the whole mean flow falls into the fire-driven fire spread regime.
In a relatively weak atmospheric CBL (C1 group), which typically occurs at morning summertime over grassland in the mid-altitude, our results have shown that the near-surface flow field changed substantially due to the fire-induced flow in all fire cases with a convergence zone formed just over the fire line (Figs 4, 5). Fire-induced temperature anomaly aligns with the flow field changes and forms a vertical hot air plume with a confined and straight horizontal extent. On the contrary, in a stronger buoyancy-driven CBL turbulence environment (C2 and C3 groups), which represents conditions closer to noontime, the ambient atmospheric motions, especially large coherent motions like vortices, remain largely unchanged after the setup of the fire. The enhancement of the ambient vortex in the fire cases might support the ambient vortex structures as one of the potential fire whirl origins. The spatial and temporal variations of the temperature anomaly can also be linked to the large coherent atmospheric structures like the vortex structures from the ambient atmospheric flow shown in the cases from the C2 group. This suggests that, in an ABL with stronger buoyancy-driven turbulence, even if the mean flow field still falls into the low Fc category, the ambient atmospheric flow can also play an important role in fire behaviour, though fire-induced flow change can be limited. The spatial variation of the temperature anomaly also indicates the direct impact of ambient atmospheric in the convective heating process during the fire spread.
In general, both the magnitude and variation of the vertical helicity component (|Hz|) increased in the fire cases across all groups. Reorganising and tilting of the ambient vortices from the fire-induced buoyancy, the process brought up by Potter (2012), might be a plausible explanation. This can also explain why the average |Hz| is higher in cases with higher fire intensity within each group. With the increased fire (hot patch heat flux) intensity, the stronger fire-induced buoyancy should make the mechanism more significant and increase the |Hz|. The helicity analysis further shows different fire–atmospheric interactions under different convective boundary layer conditions. The increase of the |Hz| is much larger between the ambient atmosphere (represented by the base case) and the FTE (represented by the fire cases) under a relatively weak atmospheric CBL (C1 group) than a stronger CBL (C2 and C3 groups). This again suggests a larger fire-induced impact in a relatively weak CBL. Under a relatively weak CBL, the |Hz| also has a strong anticorrelation between the FTE and the ambient atmosphere instead of the strong correlation found under relatively stronger CBL. This indicates that two different mechanisms exist in increasing the |Hz| within the FTE. The strong correlation, which aligns with aforementioned flow field and temperature anomaly analyses, shows that the fire has more limited impact in the flow field and is mainly enhancing the existing rotational field/structures under relatively strong CBL. The fire-induced impact is much larger and results in more fire-induced helicity generation than enhancement in the weak CBL. The anticorrelation, under this scenario, might suggest that fire-induced helicity generation is higher when the ambient helicity is low.
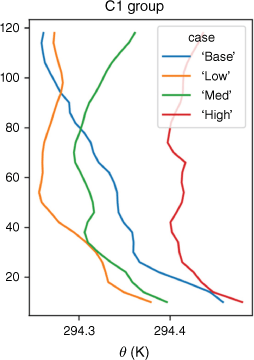
The work then studied the fire–atmospheric interaction from the turbulent energy transport perspective. A high-efficient heat transport zone over the fine line (hot patch) with a confined horizontal extent can be found close to the surface in all cases. This is expected because the fire-induced strong buoyancy force enhances the vertical heat transport. Although existing also in the ambient atmosphere, strong counter-gradient transport zones can mainly be found in the fire cases under relatively weak CBL. The small counter-gradient vertical heat transport found in the ambient atmosphere could be caused by the buoyancy-induced atmospheric eddies (Holtslag and Moeng 1991). The strong counter-gradient transport zones in the fire cases, however, might be related to the heat release aloft from turbulence mixing between the fire buoyancy plume and the ambient air. To prove that, profiles from a location under the strong counter-gradient heat transport zone in C1 group were examined (Fig. 15). The profiles from all fire cases show a temperature inversion at the locations of the counter-gradient transport zone. The reason for less or even no such counter-gradient heat transport zone aloft in a stronger CBL (C2 and C3 groups) might be that more heat is released close to the surface, which leads to weaker fire buoyancy plume and less heat release aloft. Similarly for the momentum transport, a fire-induced buoyancy-dominant counter gradient transport zone can be found in all the fire cases from the C1 group, whereas no such zone formed in fire cases from other groups. Clements et al. (2008) observed strong negative momentum flux (w′u′) changes during the 2006 Fireflux Experiment (Clements et al. 2007), but strong positive changes were found in the pilot experiment with much weaker surface wind. Our study aligns with their findings and might suggest that, with weaker ambient wind, more counter gradient momentum transport can be found (w′u′ > 0) and the fire-induced buoyancy force is dominating the energy transport close to the surface. Future studies are still needed to examine the energy transport process with moving fire lines.
|
The results might provide guidelines to determine the level of influence that ambient atmosphere could have in fire region energy transport (and consequently influence short-term fire behaviours). However, when interpreting the results from this work, there are some limitations that need to be kept in mind, and future studies are needed to further develop this research area. To reduce the variability of the ambient atmospheric conditions in the study, all the simulations were run with humidity turned off. Thus, before linking energy transport regimes in this study to different fire weather conditions classified by indices such as Haines Index or Fire Weather Index, future studies are needed to include the moisture impact in the energy transport process within the FTE. Due to the limitation of the 2D hot patch representation, the 3D dynamics of the fire flame is not represented (McDonough and Loh 2003; Kiefer et al. 2015). The main influence of this is on the intensity of the fire flame. The 3D flame will have much larger heat release due to the larger fire surface area associated with vertical flaming zones. To overcome the 2D patch limitation, the surface fire heat flux intensities used in this study are comparable to typical weak to intense grassland fires, and are already much higher than previous studies using similar 2D fire patches (Silvani et al. 2009; Kiefer et al. 2015, 2016). Nevertheless, the total heat release might still be slightly underestimated. Because of the constant fire heat flux representation, the fuel–fire interaction and flame dynamics cannot be included. The interaction between the energy transport processes and the initiation/combustion process cannot be discussed in this study. On the other hand, heat and momentum transport at the scale studied in this work can potentially interact and influence the smaller fuel flame scale energy transport and combustion process through enhancing the turbulence mixing in the combustion zone. Such interactions might increase the fire intensity and result in a stronger fire-induced flow, which in turn can decrease the shear-driven momentum transport efficiency. This negative feedback might be a controlling dynamic cycle for the grassland fire, and further studies are needed to incorporate the fuel–fire interaction to further the study.
Data availability
The simulation data used in this study can be shared upon request to the corresponding author.
Conflicts of interest
The authors declare no conflicts of interest.
Declaration of funding
The work is co-funded by University of Canterbury through the Doctoral Scholarship, Ministry of Business, Innovation and Employment (MBIE), New Zealand (Grant No. C04X1603 – ‘Preparing New Zealand for Extreme Fire’ and C04X2103 – ‘Extreme wildfire: Our new reality – are we ready?’) and the Royal Society of New Zealand (Grant No. RDF-UOC1701).
Acknowledgements
The work used computational resources from both the high-performance computational centre in University of Canterbury and the New Zealand eScience Infrastructure (NeSI), We thank the technical team from School of Earth and Environment, University of Canterbury for their technical support to this work.
References
Canfield JM, Linn RR, Sauer JA, Finney M, Forthofer J (2014) A numerical investigation of the interplay between fireline length, geometry, and rate of spread. Agricultural and Forest Meteorology 189–190, 48–59.| A numerical investigation of the interplay between fireline length, geometry, and rate of spread.Crossref | GoogleScholarGoogle Scholar |
Clements CB, Zhong S, Goodrick S, Li J, Potter BE, Bian X, Heilman WE, Charney JJ, Perna R, Jang M, Lee D, Patel M, Street S, Aumann G (2007) Observing the dynamics of wildland grass fires: FireFlux – a field validation experiment. Bulletin of the American Meteorological Society 88, 1369–1382.
| Observing the dynamics of wildland grass fires: FireFlux – a field validation experiment.Crossref | GoogleScholarGoogle Scholar |
Clements CB, Zhong S, Bian X, Heilman WE, Byun DW (2008) First observations of turbulence generated by grass fires. Journal of Geophysical Research: Atmospheres 113, D22102
| First observations of turbulence generated by grass fires.Crossref | GoogleScholarGoogle Scholar |
Coen JL, Cameron M, Michalakes J, Patton EG, Riggan PJ, Yedinak KM (2013) WRF-Fire: coupled weather–wildland fire modeling with the weather research and forecasting model. Journal of Applied Meteorology and Climatology 52, 16–38.
| WRF-Fire: coupled weather–wildland fire modeling with the weather research and forecasting model.Crossref | GoogleScholarGoogle Scholar |
Cunningham P, Linn RR (2007) Numerical simulations of grass fires using a coupled atmosphere–fire model: dynamics of fire spread. Journal of Geophysical Research: Atmospheres 112, D05108
| Numerical simulations of grass fires using a coupled atmosphere–fire model: dynamics of fire spread.Crossref | GoogleScholarGoogle Scholar |
Deardorff JW (1980) Stratocumulus-capped mixed layers derived from a three-dimensional model. Boundary-Layer Meteorology 18, 495–527.
| Stratocumulus-capped mixed layers derived from a three-dimensional model.Crossref | GoogleScholarGoogle Scholar |
Dickinson MB, Wold CE, Butler BW, Kremens RL, Jimenez D, Sopko P, O’Brien JJ (2021) The wildland fire heat budget – using bi-directional probes to measure sensible heat flux and energy in surface fires. Sensors 21, 2135
| The wildland fire heat budget – using bi-directional probes to measure sensible heat flux and energy in surface fires.Crossref | GoogleScholarGoogle Scholar |
Finney MA, Cohen JD, Forthofer JM, McAllister SS, Gollner MJ, Gorham DJ, Saito K, Akafuah NK, Adam BA, English JD (2015) Role of buoyant flame dynamics in wildfire spread. Proceedings of the National Academy of Sciences 112, 9833–9838.
| Role of buoyant flame dynamics in wildfire spread.Crossref | GoogleScholarGoogle Scholar |
Forthofer JM, Goodrick SL (2011) Review of vortices in wildland fire. Journal of Combustion 2011, 1–14.
| Review of vortices in wildland fire.Crossref | GoogleScholarGoogle Scholar |
Frangieh N, Accary G, Morvan D, Méradji S, Bessonov O (2020) Wildfires front dynamics: 3D structures and intensity at small and large scales. Combustion and Flame 211, 54–67.
| Wildfires front dynamics: 3D structures and intensity at small and large scales.Crossref | GoogleScholarGoogle Scholar |
Frankman DJ (2009) Radiation and convection heat transfer in wildland fire environments. PhD Thesis, Brigham Young University, Provo, UT, USA.
Haines DA (1989) A lower atmosphere severity index for wildlife fires. National Weather Digest 13, 23–27.
Heilman WE, Bian X, Clark KL, Zhong S (2019) Observations of turbulent heat and momentum fluxes during wildland fires in forested environments. Journal of Applied Meteorology and Climatology 58, 813–829.
| Observations of turbulent heat and momentum fluxes during wildland fires in forested environments.Crossref | GoogleScholarGoogle Scholar |
Henn DS, Sykes RI (1992) Large-eddy simulation of dispersion in the convective boundary layer. Atmospheric Environment Part A General Topics 26, 3145–3159.
| Large-eddy simulation of dispersion in the convective boundary layer.Crossref | GoogleScholarGoogle Scholar |
Hide R (1989) Superhelicity, helicity and potential vorticity. Geophysical & Astrophysical Fluid Dynamics 48, 69–79.
| Superhelicity, helicity and potential vorticity.Crossref | GoogleScholarGoogle Scholar |
Holtslag AAM, Moeng C-H (1991) Eddy diffusivity and countergradient transport in the convective atmospheric boundary layer. Journal of the Atmospheric Sciences 48, 1690–1698.
| Eddy diffusivity and countergradient transport in the convective atmospheric boundary layer.Crossref | GoogleScholarGoogle Scholar |
Hudak AT, Dickinson MB, Bright BC, Kremens RL, Loudermilk EL, O’Brien JJ, Hornsby BS, Ottmar RD (2016) Measurements relating fire radiative energy density and surface fuel consumption – RxCADRE 2011 and 2012. International Journal of Wildland Fire 25, 25–37.
| Measurements relating fire radiative energy density and surface fuel consumption – RxCADRE 2011 and 2012.Crossref | GoogleScholarGoogle Scholar |
Kiefer MT, Heilman WE, Zhong S, Charney JJ, Bian X, Skowronski NS, Hom JL, Clark KL, Patterson M, Gallagher MR (2014) Multiscale simulation of a prescribed fire event in the New Jersey pine barrens using ARPS-CANOPY. Journal of Applied Meteorology and Climatology 53, 793–812.
| Multiscale simulation of a prescribed fire event in the New Jersey pine barrens using ARPS-CANOPY.Crossref | GoogleScholarGoogle Scholar |
Kiefer MT, Heilman WE, Zhong S, Charney JJ, Bian X (2015) Mean and turbulent flow downstream of a low-intensity fire: influence of canopy and background atmospheric conditions. Journal of Applied Meteorology and Climatology 54, 42–57.
| Mean and turbulent flow downstream of a low-intensity fire: influence of canopy and background atmospheric conditions.Crossref | GoogleScholarGoogle Scholar |
Kiefer MT, Heilman WE, Zhong S, Charney JJ, Bian X (2016) A study of the influence of forest gaps on fire–atmosphere interactions. Atmospheric Chemistry and Physics 16, 8499–8509.
| A study of the influence of forest gaps on fire–atmosphere interactions.Crossref | GoogleScholarGoogle Scholar |
Kiefer MT, Zhong S, Heilman WE, Charney JJ, Bian X (2018) A numerical study of atmospheric perturbations induced by heat From a wildland fire: sensitivity to vertical canopy structure and heat source strength. Journal of Geophysical Research: Atmospheres 123, 2555–2572.
| A numerical study of atmospheric perturbations induced by heat From a wildland fire: sensitivity to vertical canopy structure and heat source strength.Crossref | GoogleScholarGoogle Scholar |
Kremens RL, Dickinson MB, Bova AS (2012) Radiant flux density, energy density and fuel consumption in mixed-oak forest surface fires. International Journal of Wildland Fire 21, 722–730.
| Radiant flux density, energy density and fuel consumption in mixed-oak forest surface fires.Crossref | GoogleScholarGoogle Scholar |
LeMone MA, Grossman RL, Coulter RL, Wesley ML, Klazura GE, PouIos GS, Blumen W, Lundquist JK, Cuenca RH, Kelly SF, Brandes EA, Oncley SP, McMillen RT, Hicks BB (2000) Land–atmosphere interaction research, early results, and opportunities in the Walnut River Watershed in southeast Kansas: CASES and ABLE. Bulletin of the American Meteorological Society 81, 757–780.
| Land–atmosphere interaction research, early results, and opportunities in the Walnut River Watershed in southeast Kansas: CASES and ABLE.Crossref | GoogleScholarGoogle Scholar |
Li D, Bou-Zeid E (2011) Coherent structures and the dissimilarity of turbulent transport of momentum and scalars in the unstable atmospheric surface layer. Boundary-Layer Meteorology 140, 243–262.
| Coherent structures and the dissimilarity of turbulent transport of momentum and scalars in the unstable atmospheric surface layer.Crossref | GoogleScholarGoogle Scholar |
Linn RR, Sieg CH, Hoffman CM, Winterkamp JL, McMillin JD (2013) Modeling wind fields and fire propagation following bark beetle outbreaks in spatially-heterogeneous pinyon–juniper woodland fuel complexes. Agricultural and Forest Meteorology 173, 139–153.
| Modeling wind fields and fire propagation following bark beetle outbreaks in spatially-heterogeneous pinyon–juniper woodland fuel complexes.Crossref | GoogleScholarGoogle Scholar |
Markowski PM, Straka JM, Rasmussen EN, Blanchard DO (1998) Variability of storm-relative helicity during VORTEX. Monthly Weather Review 126, 2959–2971.
| Variability of storm-relative helicity during VORTEX.Crossref | GoogleScholarGoogle Scholar |
Maronga B, Gryschka M, Heinze R, Hoffmann F, Kanani-Sühring F, Keck M, Ketelsen K, Letzel MO, Sühring M, Raasch S (2015) The parallelized large-eddy simulation model (PALM) version 4.0 for atmospheric and oceanic flows: model formulation, recent developments, and future perspectives. Geoscientific Model Development Discussions 8, 1539–1637.
| The parallelized large-eddy simulation model (PALM) version 4.0 for atmospheric and oceanic flows: model formulation, recent developments, and future perspectives.Crossref | GoogleScholarGoogle Scholar |
McDonough JM, Loh A (2003) Simulation of vorticity–buoyancy interactions in fire-whirl-like phenomena. In ‘Heat Transfer. Vol. 2’. pp. 195–201. (ASME: Las Vegas, Nevada, USA)
| Crossref |
Mell W, Jenkins MA, Gould J, Cheney P (2007) A physics-based approach to modelling grassland fires International Journal of Wildland Fire 16, 1–22.
| A physics-based approach to modelling grassland firesCrossref | GoogleScholarGoogle Scholar |
Moeng C-H, Wyngaard JC (1988) Spectral analysis of large-eddy simulations of the convective boundary layer. Journal of the Atmospheric Sciences 45, 3573–3587.
| Spectral analysis of large-eddy simulations of the convective boundary layer.Crossref | GoogleScholarGoogle Scholar |
Orlanski I (1975) A rational subdivision of scales for atmospheric processes. Bulletin of the American Meteorological Society 56, 527–530.
Pimont F, Dupuy J-L, Linn RR, Sauer JA, Muñoz-Esparza D (2020) Pressure-gradient forcing methods for large-eddy simulations of fows in the lower atmospheric boundary layer. Atmosphere 11, 1343
| Pressure-gradient forcing methods for large-eddy simulations of fows in the lower atmospheric boundary layer.Crossref | GoogleScholarGoogle Scholar |
Potter BE (2002) A dynamics based view of atmosphere - fire interactions International Journal of Wildland Fire 11, 247
| A dynamics based view of atmosphere - fire interactionsCrossref | GoogleScholarGoogle Scholar |
Potter BE (2012) Atmospheric interactions with wildland fire behaviour – II. Plume and vortex dynamics. International Journal of Wildland Fire 21, 802–817.
| Atmospheric interactions with wildland fire behaviour – II. Plume and vortex dynamics.Crossref | GoogleScholarGoogle Scholar |
Potter B (2018) The Haines Index – it’s time to revise it or replace it. International Journal of Wildland Fire 27, 437–440.
| The Haines Index – it’s time to revise it or replace it.Crossref | GoogleScholarGoogle Scholar |
Raasch S, Schröter M (2001) PALM – a large-eddy simulation model performing on massively parallel computers. Meteorologische Zeitschrift 10, 363–372.
| PALM – a large-eddy simulation model performing on massively parallel computers.Crossref | GoogleScholarGoogle Scholar |
Rizza U, Miglietta MM, Degrazia GA, Acevedo OC, Marques Filho EP (2013) Sunset decay of the convective turbulence with large-eddy simulation under realistic conditions. Physica A: Statistical Mechanics and Its Applications 392, 4481–4490.
| Sunset decay of the convective turbulence with large-eddy simulation under realistic conditions.Crossref | GoogleScholarGoogle Scholar |
Seto D, Clements CB (2011) Fire whirl evolution observed during a valley wind–sea breeze reversal. Journal of Combustion 2011, 1–12.
| Fire whirl evolution observed during a valley wind–sea breeze reversal.Crossref | GoogleScholarGoogle Scholar |
Seto D, Strand TM, Clements CB, Thistle H, Mickler R (2014) Wind and plume thermodynamic structures during low-intensity subcanopy fires. Agricultural and Forest Meteorology 198–199, 53–61.
| Wind and plume thermodynamic structures during low-intensity subcanopy fires.Crossref | GoogleScholarGoogle Scholar |
Shaw RH, Tavangar J, Ward DP (1983) Structure of the Reynolds Stress in a Canopy Layer. Journal of Climate and Applied Meteorology 22, 1922–1931.
| Structure of the Reynolds Stress in a Canopy Layer.Crossref | GoogleScholarGoogle Scholar |
Shiqiang F, Zhemin T (2001) On the helicity dynamics of severe convective storms. Advances in Atmospheric Sciences 18, 67–86.
| On the helicity dynamics of severe convective storms.Crossref | GoogleScholarGoogle Scholar |
Silvani X, Morandini F, Muzy J-F (2009) Wildfire spread experiments: Fluctuations in thermal measurements. International Communications in Heat and Mass Transfer 36, 887–892.
| Wildfire spread experiments: Fluctuations in thermal measurements.Crossref | GoogleScholarGoogle Scholar |
Simpson CC, Sharples JJ, Evans JP (2016) Sensitivity of atypical lateral fire spread to wind and slope. Geophysical Research Letters 43, 1744–1751.
| Sensitivity of atypical lateral fire spread to wind and slope.Crossref | GoogleScholarGoogle Scholar |
Stull RB (2012) ‘An Introduction to Boundary Layer Meteorology.’ (Springer Science & Business Media: Berlin, Germany)
Sturman AP, McGowan HA, Spronken-Smith RA (1999) Mesoscale and local climates in New Zealand. Progress in Physical Geography: Earth and Environment 23, 611–635.
| Mesoscale and local climates in New Zealand.Crossref | GoogleScholarGoogle Scholar |
Sullivan AL (2007) Convective Froude number and Byram’s energy criterion of Australian experimental grassland fires. Proceedings of the Combustion Institute 31, 2557–2564.
| Convective Froude number and Byram’s energy criterion of Australian experimental grassland fires.Crossref | GoogleScholarGoogle Scholar |
Sullivan AL (2017) Inside the inferno: fundamental processes of wildland fire behaviour. Part 2: heat transfer and interactions. Current Forestry Reports 3, 150–171.
| Inside the inferno: fundamental processes of wildland fire behaviour. Part 2: heat transfer and interactions.Crossref | GoogleScholarGoogle Scholar |
Sun R, Krueger SK, Jenkins MA, Zulauf MA, Charney JJ (2009) The importance of fire–atmosphere coupling and boundary-layer turbulence to wildfire spread. International Journal of Wildland Fire 18, 50–60.
| The importance of fire–atmosphere coupling and boundary-layer turbulence to wildfire spread.Crossref | GoogleScholarGoogle Scholar |
Tang T (2017) A physics-based approach to modeling a physics-based approach to modeling wildland fire spread through porous fuel beds. PhD Thesis, University of Kentucky, Lexington, KY, USA.
| Crossref |
Thomas DS, Butry DT (2014) Areas of the US wildland–urban interface threatened by wildfire during the 2001–2010 decade. Natural Hazards 71, 1561–1585.
| Areas of the US wildland–urban interface threatened by wildfire during the 2001–2010 decade.Crossref | GoogleScholarGoogle Scholar |
Van Wagner CE (1974) ‘Structure of the Canadian Forest Fire Weather Index.’ (tCiteSeerX)
Wallace JM (2016) Quadrant analysis in turbulence research: history and evolution. Annual Review of Fluid Mechanics 48, 131–158.
| Quadrant analysis in turbulence research: history and evolution.Crossref | GoogleScholarGoogle Scholar |
Wyngaard JC, Moeng C-H (1992) Parameterizing turbulent diffusion through the joint probability density. Boundary-Layer Meteorology 60, 1–13.
| Parameterizing turbulent diffusion through the joint probability density.Crossref | GoogleScholarGoogle Scholar |
Xue H, Feingold G (2006) Large-eddy simulations of trade wind cumuli: investigation of aerosol indirect effects. Journal of the Atmospheric Sciences 63, 1605–1622.
| Large-eddy simulations of trade wind cumuli: investigation of aerosol indirect effects.Crossref | GoogleScholarGoogle Scholar |
Yates DN, Chen F, LeMone MA, Qualls R, Oncley SP, Grossman RL, Brandes EA (2001) A Cooperative Atmosphere–Surface Exchange Study (CASES) dataset for analyzing and parameterizing the effects of land surface heterogeneity on area-averaged surface heat fluxes. Journal of Applied Meteorology 40, 921–937.
| A Cooperative Atmosphere–Surface Exchange Study (CASES) dataset for analyzing and parameterizing the effects of land surface heterogeneity on area-averaged surface heat fluxes.Crossref | GoogleScholarGoogle Scholar |


