

Factors influencing ember accumulation near a building
Stephen L. Quarles A , Christine Standohar-Alfano B , Faraz Hedayati A and Daniel J. Gorham C *
C *
A Insurance Institute for Business & Home Safety, 5335 Richburg Road, Richburg, SC 29729, USA.
B Haag Engineering, 2224 E 117th Street, Burnsville, MN 55337, USA.
C Fire Safety Research Institute, UL Research Institutes, 6200 Old Dobbin Lane, Suite 150, Columbia, MD 21045, USA.
International Journal of Wildland Fire 32(3) 380-387 https://doi.org/10.1071/WF22132
Submitted: 8 July 2022 Accepted: 31 January 2023 Published: 28 February 2023
© 2023 The Author(s) (or their employer(s)). Published by CSIRO Publishing on behalf of IAWF. This is an open access article distributed under the Creative Commons Attribution-NonCommercial-NoDerivatives 4.0 International License (CC BY-NC-ND)
Abstract
Background: Embers, also known as firebrands, are the leading cause of building ignition during wildland–urban fires. This is attributed both to direct ignition of material on, in, or attached to the building, and indirect ignition where they ignite vegetation or other combustible material near the building, which results in a radiant heat and/or direct flame contact exposure that ignites the building. Indirect ignition of a building can occur when embers accumulate on and ignite nearby combustible fuel, resulting in radiant heat or flame constant exposure.
Aims/implications: Factors that influence ember accumulation near a building include building geometry, such as flat wall and re-entrant corners, building wind angle, wind speed and the surface roughness characteristics of the horizontal landscape close to the building.
Methods: Experiments conducted at the Insurance Institute for Business & Home Safety (IBHS) Research Center using full-scale buildings with the above-mentioned factors provided a means to quantify ember accumulation on a mass per unit area basis.
Key results: Ember accumulation was greatest at locations immediately adjacent to the building and higher wind speeds allowed more embers to reach the building.
Conclusions: The work presented in this paper provides data and insight on wind-blown ember accumulation near a full-scale building.
Keywords: accumulate, accumulation, building, deposit, deposition, ember, firebrand, structure, wildfire, wildland, wildland–urban, WUI.
Introduction
One of the main challenges to combating wildfires is that they spread through three main mechanisms, namely flame impingement, radiant heat and wind-blown embers, also referred to as firebrands. Ignition of a structure can be caused by direct flame contact from the primary fire front or from fires caused by localised fuel sources (i.e. vegetation, fences, etc.) near the structure (Potter and Leonard 2010; Quarles et al. 2010). Regardless of the source of the flame, ignition of the exterior of the building can result in ignition of internal contents. Buildings near flames are subjected to radiant heat and their vulnerability depends on both the intensity of the radiation and its duration (Potter and Leonard 2010).
The third mechanism of wildfire spread is by exposure to embers. This mode is the most important cause and accounts for up to 90% of structural ignitions (Potter and Leonard 2010). For example, two of every three homes destroyed in the 2007 Witch Creek fire in San Diego County, CA, were ignited by ember accumulation (Quarles et al. 2010). The risk of ignition from embers depends on several features, including the number of embers, the ember characteristics, the amount of and type of combustible debris or materials near the building, the duration of the ember attack, and environmental conditions. In some cases, ember attacks can result in the ignition of a building 12 h after the initial fire front passes (Potter and Leonard 2010). The delayed ignition can be explained by either the continued production of embers from burning fuels after the fire front has passed, or the smouldering combustion of a component or assembly that eventually transitions to flaming combustion.
The lifecycle of embers that cause destruction of homes and building can be described in three stages: (1) production and release of embers from burning fuel; (2) transport of embers from the source to where they are deposited, including accumulation; and (3) given sufficient accumulation and receptive fuel, ignition. Given the dominant role that embers play in wildfire spread and home ignition (Manzello et al. 2020), a considerable amount of research has been conducted and is under way on this topic. Experiments conducted by Suzuki and Manzello (2017) also studied accumulation zones created by stagnation planes in front of obstacles. These investigations found that wind speed (6, 8 and 10 m s−1) influenced the accumulation of firebrands in the stagnation plane on the windward side of obstacles and suggest experiments at wind speeds greater than 10 m s−1 would be desirable. In the stagnation zone, roughness of horizontal surface affects the accumulation of embers (Suzuki and Manzello 2017). Later work investigated the effect of structure separation distance on firebrand accumulation (Suzuki and Manzello 2021), highlighting the role of firebrand behaviour between two structures. The heat flux, and ignition potential, from a pile of accumulated embers are distinctly different than from an individual ember (Hakes et al. 2019).
Nguyen and Kaye (2022) conducted a series of small-scale wind tunnel experiments investigating non-combustible ember accumulation on building rooftops and found that building geometry and wind angle were important factors for accumulation rates. Separate from and prior to these studies, a set of experiments were conducted at the Insurance Institute for Business & Home Safety (IBHS) to study the accumulation of embers near a building as a function of wind speed, building geometry and wind angle. This work is the focus of the present paper.
Methodology
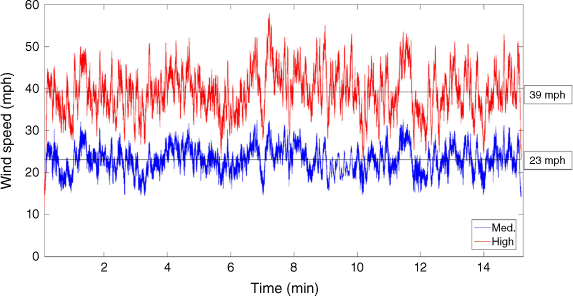
These ember accumulation experiments were conducted as part of the 2015 wildfire experimental campaign at the IBHS Research Center in Richburg, South Carolina. This research facility includes a wind tunnel large enough to hold full-scale one- and two-storey residential and small commercial buildings, allowing for investigations to evaluate the performance of buildings subjected to high winds (Standohar-Alfano et al. 2017). The facility is able to generate wind speeds greater than 71.5 m s−1 (100 mph (miles per hour)) using a 105-fan array. The wind tunnel can generate a constant wind speed or replicate observed, fluctuating wind records from hurricanes, thunderstorms or open-country conditions. For the 2015 wildfire experimental campaign, an open-country wind record was used and was scaled to generate wind time histories defined as medium and high. The medium and high wind speed traces were fluctuating records with an average wind speed of 10.3 and 17.4 m s−1 (23 and 39 mph), respectively. Fig. 1 shows the medium and high wind speed traces used in the experiments. In addition, an idle fan speed was used that ranged between 4.5 and 5.4 m s−1 (10–12 mph).
|
The wind tunnel utilises a large turntable with a radius of 16.8 m (55 feet) that can rotate 360°, allowing the full rotation of the test building and therefore the evaluation of the effect of wind speed and direction on the deposition of embers around the test building.
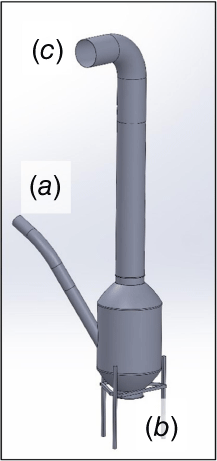
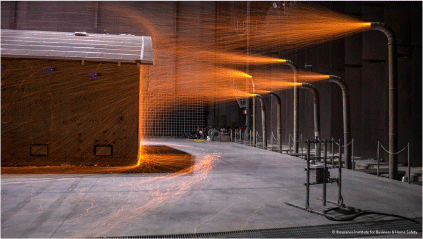
The 2015 wildfire experimental campaign used a custom-made system to deliver fuel and generate embers. The fuel was a mixture of southern yellow pine wood chips and wooden dowels processed from midwestern hardwood species, with a ratio of 80 and 20%, by weight, respectively. All raw material was dried to a moisture content less than 10%. The generators were used to burn fuel and create embers, as shown in Fig. 2. The fuel was delivered into the generator by pneumatic feed line, shown by Fig. 2a. The fuel dropped on top of a metal grate immediately above a gas burner (not shown). A fan located under the burner (Fig. 2b) pushed embers up and out of the exhaust chute indicated by Fig. 2c.
|
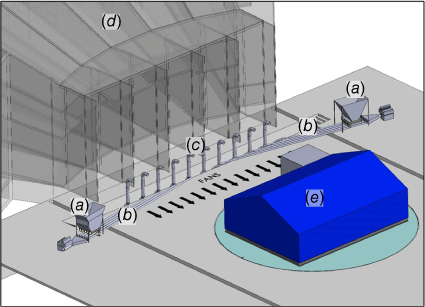
An overview of the auger system, generators and test building is shown in Fig. 3. Fig. 3 shows 10 ember generators; for the ember accumulation study reported here, six generators were used and were at equally spaced intervals in front of the fan array. Prior to testing, fuel was placed in the hoppers shown in Fig. 3a. Five augers (not shown) dropped fuel into the pneumatic feed lines. The feed rate was controlled by powering the augers on and off. The desired feed rate was obtained when individual augers were turned on for a predetermined length of time between 3 and 5 s and then off for 10–20 s. Establishing the on/off times for each individual auger was determined based on visual inspection of ember output and observed overheating of the generators. The goal of using the intermittent fuel delivery was to ensure a consistent output of embers by all generators without damaging the generators from excessive heat in the burn chamber.
|
The auger delivered fuel to feed lines shown as b in Fig. 3. These feed lines delivered the fuel to the generators (Figs 2a, 3c). As described earlier, the generators burned the fuel and a fan pushed embers up the exhaust chute. Using the wind traces shown in Fig. 1, the fan array (Fig. 3d) created the wind flow in the test chamber. The test building shown by e in Fig. 3 was then subjected to ember exposure. The duration of the exposure was 15 min. Photographs of the system and setup used in this study are shown in Fig. 4. By placing a building in the wind field and exposing it to embers, embers could be collected at various near-building locations.

|
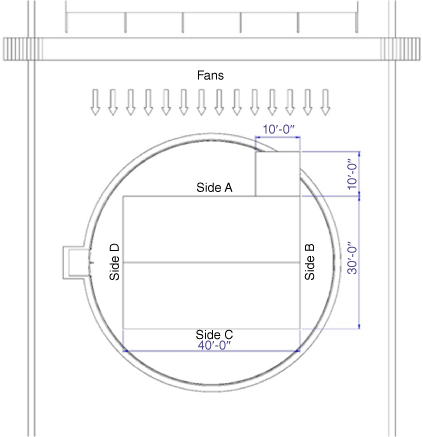
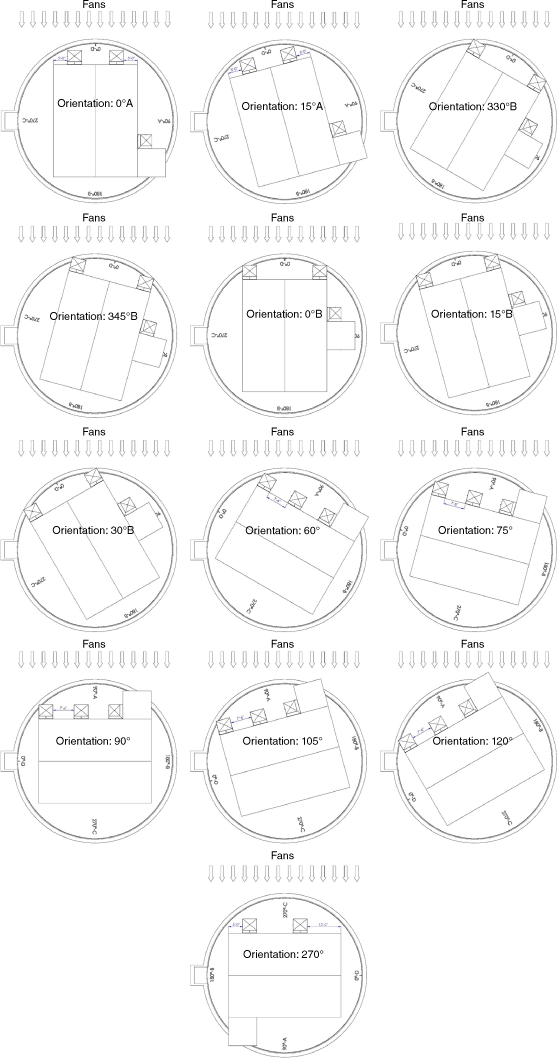
To evaluate ember accumulation in the vicinity of a building, a full-scale structure was positioned in the wind tunnel (Figs 3e, 5). The structure was one-storey with a building footprint of 9.1 × 12.2 m (30× 40 feet). To evaluate the vulnerability of a re-entrant corner, a 3× 3 m (10 × 10 feet) cube was placed on one corner of the long axis, as shown in Figs 4, 5. This cube was detached and re-attached at different locations on the test building. The building and cube were clad with fibre-cement panels. The orientation of the building was varied to assess the impact of wind direction on ember accumulation.
|
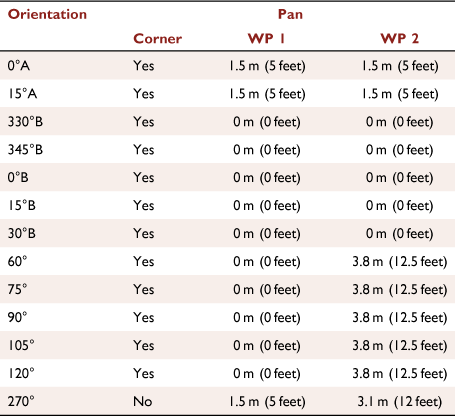
For the ember accumulation portion of the experiments, water-filled pans were placed at various locations around the test building. The building was then subjected to ember exposure for 15 min. Thirteen scenarios were examined at both medium and high wind speeds, as shown in Table 1. In addition, accumulation experiments at the 270° orientation were conducted at idle wind speed. With the exception of the 270° orientation, a water-filled pan was placed in the re-entrant corner. Two additional water-filled pans (denoted WP 1 and WP 2) were positioned at selected locations along the building, as indicated in Table 1. Location information is also provided in Fig. 6.
|
|
As indicated in Table 1, there were four main parent orientations investigated, shown in bold (0°A, 0°B, 90° and 270°). With these four scenarios, the face closest to the fans was perpendicular to the wind field. For three of the main orientations (0°A, 0°B and 90°), the re-entrant corner was directly impacted by the wind field (i.e. not on the leeward side of the building). In order to assess the impact of wind direction on ember accumulation, the building was rotated in 15° increments. The location of the re-entrant corner on the test building was assessed with two of the main orientations (0°A and 0°B). For scenarios with an A orientation, the cube was in its original location at the end of the building as indicated in Fig. 5. For the cases with a B orientation, the cube was moved to the mid-length of the building (centred at 6.1 m (20 feet)).
The pan location is also included in Table 1. The corner pan was located in the re-entrant corner and there was only one orientation where it was not utilised. There were two wall pans (WP 1 and WP 2) used in the ember accumulation experiments. The location is given as the distance from the closest corner. For the A scenarios, both pans were placed 1.5 m (5 feet) from the corners of the windward side. For the B scenarios, both of the wall pans were placed at the corner (0 m). For the cases where the main (parent) orientation was 90°, one pan was placed at the corner and the second pan was placed 3.8 m (12.5 feet) from the same corner. This resulted in a spacing of 2.3 m (7.5 feet) between the pans. For the 270° orientation, one pan was placed 1.5 m (5 feet) from one corner and the second pan was placed 3.1 m (12 feet) from the other corner.
At the beginning of each test, during the time the generators were starting up and output was non-uniform, the pans were covered. Once the generators reached a steady state, the cover was removed and the wind speed record began, marking the start of the 15-min exposure. The orientations summarised in Table 1 were subjected to both the medium and high wind speed traces.
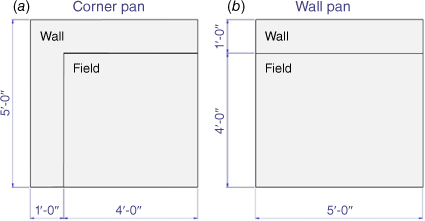
The water-filled pans used in the ember accumulation study measured 1.5 × 1.5 m (5 × 5 feet) and were divided into two sections defined as field and wall. The wall section was the area closest to the exterior wall. For all pans, this section was 0.3 m (1 foot) from the wall edge. The field section was larger than the wall section and was the remaining portion of the water-filled pan that was not immediately adjacent to the building. Fig. 7 shows an image of the two types of pans used in the accumulation study. Fig. 7a illustrates the pan that was placed in the re-entrant corner. As this pan had two edges against a wall, the wall section was larger than the pans placed elsewhere on the building, but the distance from the wall remained the same at 0.3 m (1 foot).
|
Results and discussion
Results from the accumulation study are shown in Figs 8–11. There was variability in the accumulation depending on orientation, wind speed, pan section (wall or field) and pan placement along the wall of the test building. Thirteen orientations were investigated. The orientation of the test building with Side A facing the fans, as shown in Fig. 5, was designated as the 90° orientation. Side B was designated 180°, Side C was designated 270° and Side D was designated 0°.
|
|
|
|
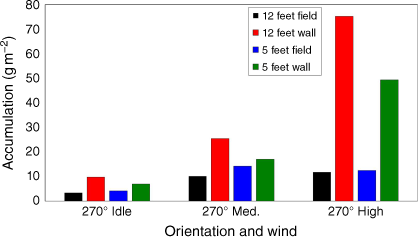
The results for the 270° orientation are shown in Fig. 9. As already stated, this was the only orientation that was tested at the idle (non-fluctuating) wind speed. This orientation positioned the cube on the leeward side of the building, so no embers were collected in the corner pan. The results for this orientation indicated that maximum ember accumulation occurred in the wall sections. At this orientation, the difference in accumulation between the wall and field sections increased with increasing wind speed. With increasing wind speed, more embers were able to reach the exterior wall of the test building. Those embers able to reach the exterior wall moved down the wall and then away from it. As shown in Fig. 8, with a smooth landing surface, ember accumulation was greatest at the ground-to-wall intersection and at a distance several feet from the exterior wall of the building. The distance to the stagnation point is a function of building height (Holmes 2007). With increasing surface roughness of the landing surface, e.g. bark mulch, the embers are not able to move away from the building, but instead ‘stick’ to the location where they land or reach the ground. This phenomenon was observed during experiments evaluating the ignition potential of decking products (Quarles and Standohar-Alfano 2018; Hedayati et al. 2022). Unless stopped by patio furniture, for example, the deck surface was smooth enough for those embers that did not stop at the deck-to-wall junction to move away from the wall until the stagnation point was reached. A limitation of this experimental design was the de facto ‘stickiness’ of water. Embers that reached the test building and moved down the wall were stopped (and quenched) in the near-building water pan. They could go no further. The influence of ember size and mass on deposition in proximity to the building was not evaluated. Future research could evaluate this factor.
As two accumulation locations were observed in the deck experiments (at the deck-to-wall junction and the stagnation point away from the wall), combustible materials such as bark mulch should not be located immediately adjacent to a building. An additional study conducted at the IBHS Research Center suggests that, with the exception of exterior corners, 5 feet (1.5 m) is a fairly conservative building-to-combustible material distance for well-maintained vegetative fuels (Hedayati et al. 2018).
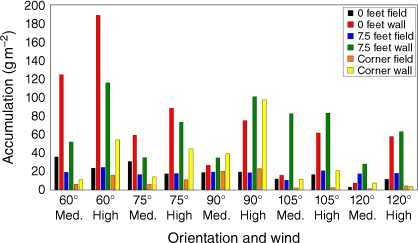
For the orientations in the 90° parent orientation (Fig. 10), the 60° orientation had the highest accumulation for both the medium and high wind speeds. At this orientation, WP 1 and WP 2 were closer to the ember generators and the re-entrant corner was positioned so that embers were naturally caught in the corner pan. For this reason, accumulation values were relatively high. At 105° and 120°, ember accumulation decreased. For these orientations, the cube used to simulate the re-entrant corner did provide some shelter for locations on the leeward side of the cube where the water-filled pans were placed.
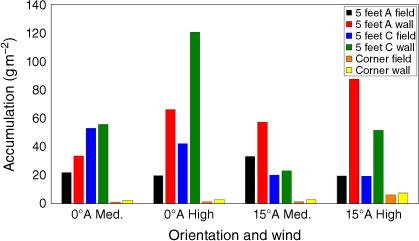
The results of accumulation for the 0°A and 15°A orientation are shown in Fig. 11. As with previous orientations, the wall section of the pans had greater accumulations than the field sections for a given wind speed. The high wind speed record did result in higher values of accumulation. As the re-entrant corner was located 9.1 m (30 feet) from the windward edge of the building, ember accumulation in the corner pan was minimal owing to the distance from the ember generators.
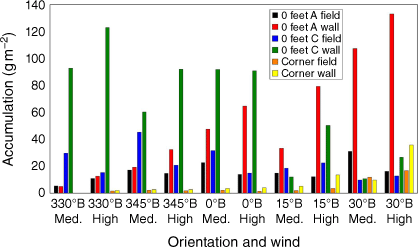
Finally, the results of the 0°B parent orientation are shown in Fig. 12. For these orientations, the re-entrant corner was located at the mid-span of the test building and was closer to the ember generators. As with other orientations, the wall section of the water-filled pans saw larger values of ember accumulation compared with the field section. High wind speeds typically resulted in greater accumulation. The 330°B and 345°B orientations had greater accumulations in the water-filled pan located on the C side of the test building. With these orientations, the test building was rotated such that the C side was closer to the generators, so this result was not surprising. Similarly, for the 15°B and 30°B orientation, the A side of the building was closest to the generators, so accumulation was greatest in the water-filled pan located on the A side of the windward wall. As the test building was rotated counter-clockwise from 0°B, the re-entrant corner moved closer to the generators and there was an observed increase in ember accumulation at the corner pan.
|
A common metric for evaluating the output from ember generators, or burning objects naturally producing embers, is ember flux. Manzello and Suzuki (2017) described a methodology for determining number (embers m−2 s−1) and mass (g m−2 s−1) flux output from the source (generators). It is believed the effective area used for those calculated fluxes is the cross-sectional area of the generator outlet. High speed videography and machine-vision particle tracking techniques were used to quantify the number of embers produced from an ember generator in 2019 (using a similar system setup used and described for the 2015 experiments). The ember output was determined to be 89 embers s−1 per ember generator. With a diameter of 8 inches (20 cm), the cross-sectional area of the generator outlet (snorkel) is 0.0324 m2, and so the ember number flux was calculated to be approximately 2700 embers m−2 s−1 per ember generator.
In quantifying ember flux, a discussion should be had regarding the most appropriate effective area to use. For this study, when tracking the embers from the outlet, it was observed the vast majority of embers strike the top of the snorkel (driven upward by the fan and impacting the top of the duct elbow) and exit through a fraction of the total cross-sectional area. An analysis of the scenario can identify other, potentially more relevant, effective areas including the cross-sectional area of the wind field in which the embers are transported and the blockage object in the flow that can create the conditions for accumulation. For these 2015 tests, the building cross-sectional area was calculated to be approximately 110 m2, and six generators each producing 89 embers s−1 resulted in approximately 5 embers m−2 s−1 impacting the building. One of the limitations of the ember fluxes reported in this study was they were calculated based on two-dimensional tracking, in which case embers could be under-counted. Recent work (Bouvet et al. 2020) has developed and demonstrated a methodology for measuring ember flux in three dimensions.
As more data regarding ember characteristics from active wildfires become available, a comparison could be made with the embers created with the IBHS generators. Using that information, the generator design and/or raw material fuel could be modified to better replicate embers collected in the field.
Conclusion
Overall, the data suggested that the accumulation for the wall section was higher than the accumulation for the field section, thus indicating greater vulnerability at locations immediately adjacent to the building. For the wall sections, higher wind speeds resulted in greater accumulation. Higher wind speeds allowed more embers to reach the building and become caught in the recirculation where they were forced into the water-filled pans. For the field sections, accumulation values were typically largest for the medium wind speed record; however, the dependency of accumulation on wind speed was lower. This likely resulted from the relatively large size of the field section, so at medium wind speed, lower-momentum embers could land directly in the field section because they were unable to reach the building.
These results have important implications, especially for rough ground surfaces immediately adjacent to buildings. If embers strike a building and become contained in recirculation, they can be forced down to the ground. If the ground surface is rough (i.e. mulch), it will capture the embers and force them to accumulate closer to the building. Deposition on a smooth surface, such as an attached deck, will allow embers to also travel back on the deck and accumulate at a location several feet from the building. Any combustible material near accumulated embers can potentially ignite, which would result in direct flame contact or elevated levels of radiant heat to the building.
Data availability
The data that support this study will be shared on reasonable request to the corresponding author.
Conflicts of interest
The authors declare no conflicts of interest
Declaration of funding
This research did not receive any specific funding.
Acknowledgements
The authors appreciate the operations and product team at the IBHS Research Center for making these experiments possible, in particular Conrad Estes, Ian Giammanco and Murray Morrison.
References
Bouvet N, Link ED, Fink, SA (2020) Development of a new approach to characterize firebrand showers during Wildland-Urban Interface (WUI) fires: a Step Towards High-Fidelity Measurements in Three Dimensions. Technical Note 2093. (National Institute of Standards and Technology)| Crossref |
Hakes RSP, Salehizadeh H, Weston-Dawkes MJ, Gollner MJ (2019) Thermal characterization of firebrand piles Fire Safety Journal 104, 34–42.
| Thermal characterization of firebrand pilesCrossref | GoogleScholarGoogle Scholar |
Hedayati F, Stansell C, Gorham DJ, Quarles SL (2018) Near-Building Non-combustible Zone. (Insurance Institute for Business & Home Safety). Available at https://ibhs.org/wp-content/uploads/member_docs/Near-Building_Noncombustible_Zone_Report_IBHS.pdf
Hedayati F, Quarles SL, Standohar-Alfano C (2022) Evaluating Deck Fire Performance – Limitations of the Test Methods Currently Used in California’s Building Codes. Fire 5, 107
| Evaluating Deck Fire Performance – Limitations of the Test Methods Currently Used in California’s Building Codes.Crossref | GoogleScholarGoogle Scholar |
Holmes J (2007) ‘Wind Loading of Structures’, 2nd edn. (CRC Press)
| Crossref |
Manzello SL, Suzuki S (2017) Generating wind-driven firebrand showers characteristic of burning structures. Proceedings of the Combustion Institute 36, 3247–3252.
| Generating wind-driven firebrand showers characteristic of burning structures.Crossref | GoogleScholarGoogle Scholar |
Manzello SL, Suzuki S, Gollner MJ, Fernandez-Pello AC (2020) Role of firebrand combustion in large outdoor fire spread. Progress in Energy and Combustion Science 76, 100801
| Role of firebrand combustion in large outdoor fire spread.Crossref | GoogleScholarGoogle Scholar |
Nguyen D, Kaye NB (2022) Quantification of ember accumulation on the rooftops of isolated buildings in an ember storm. Fire Safety Journal 128, 103525
| Quantification of ember accumulation on the rooftops of isolated buildings in an ember storm.Crossref | GoogleScholarGoogle Scholar |
Potter M, Leonard J (2010) Spray System Design for Firebrand Attack – Research Findings and Discussion Paper. Report No. EP103159. pp. 1–27. (CSIRO – Sustainable Ecosystems)
Quarles SL, Standohar-Alfano C (2018) Ignition Potential of Decks Subjected to an Ember Exposure. (Insurance Institute for Business & Home Safety). Available at https://ibhs.org/wp-content/uploads/Ignition-Potential-of-Decks-Subjected-to-an-Ember-Exposure.pdf [verified 7 September 2022]
Quarles SL, Valachovic Y, Nakamura GM, Nader GA, De Lasaux MJ (2010) ‘Home Survival in Wildfire-Prone Areas: Building Materials and Design Considerations.’ (University of California Agriculture and Natural Resources, ANR Publication 8393)
Standohar-Alfano CD, Estes H, Johnston T, Morrison MJ, Brown Giammanco TM (2017) Reducing losses from wind-related natural perils: research at the IBHS Research Center. Frontiers in Built Environment 3, 9
| Reducing losses from wind-related natural perils: research at the IBHS Research Center.Crossref | GoogleScholarGoogle Scholar |
Suzuki S, Manzello SL (2017) Experimental investigation of firebrand accumulation zones in front of obstacles. Fire Safety Journal 94, 1–7.
| Experimental investigation of firebrand accumulation zones in front of obstacles.Crossref | GoogleScholarGoogle Scholar |
Suzuki S, Manzello SL (2021) Investigating the Effect of Structure to Structure Separation Distance on Firebrand Accumulation. Frontiers in Mechanical Engineering 6, 628510
| Investigating the Effect of Structure to Structure Separation Distance on Firebrand Accumulation.Crossref | GoogleScholarGoogle Scholar |