Experimental study on the ignition of fuel beds by two firebrands in tandem arrangement under wind conditions
Daicai Tian A B and Jiao Lei A B *A
B
Abstract
In wildland fires, the multiple firebrands deposited on the fuel beds are likely to exhibit small separation distances and have the potential to ignite the fuel bed that cannot be ignited by a single firebrand or accelerate the fuel ignition compared to a single firebrand.
This research provided a combined experimental and analytical study on the ignition behaviour of pine needle fuel beds by two cylindrical firebrands in tandem arrangement.
A small-scale wind tunnel was used for the ignition and heat flux measurement experiments with wind speeds up to 4 m s−1.
The heat fluxes produced by the firebrands and the ignition probability of fuel beds increased, while the ignition delay time of fuel beds decreased with increasing wind speed. The two tandem firebrands can accelerate the ignition of the fuel bed within the critical separation distance.
A semi-empirical model for the ignition delay time of the fuel bed was derived based on the energy balance concept, which coupled the separation distance and the wind speed.
This work demonstrates the cooperative ignition effect of two firebrands and is valuable for future research on the ignition behavior of fuel beds by more nearby firebrands.
Keywords: glowing firebrands, heat flux, ignition delay time, ignition probability, separation distance, tandem arrangement, wildland fire, wind speed.
Introduction
Numerous firebrands in wildfires are lofted by the fire plumes and transported to unburned areas far ahead of the fire front due to the horizontal wind. Statistical data indicated that the density of deposited firebrands can reach 2–10 dm−2 on the fuel surface due to continuous firebrand showers (Manzello and Foote 2012; Santamaria et al. 2015; El Houssami et al. 2016). In addition, real fire cases (Manzello and Foote 2012) and field experiments (Sardoy et al. 2008; Koo et al. 2010; Santamaria et al. 2015; El Houssami et al. 2016) showed that the firebrands could deposit and accumulate on the top of the fuel bed to form firebrand piles. Multiple nearby firebrands may ignite the unburned fuels quickly (Alexander and Cruz 2013), accelerating the spread of surface fires significantly.
Spot fire involves three consecutive processes: (1) firebrand generation; (2) firebrand transport; and (3) ignition of fuels by firebrands (Liu et al. 2021). Some researchers have measured the size and mass distribution of firebrands in wildland fires (Manzello et al. 2007; Filkov et al. 2017; Hudson et al. 2020) and developed firebrand transport models (Sardoy et al. 2008; Albini et al. 2012). Many studies have focused on the ignition of fuels by a single firebrand in the laboratory. Urban et al. (2019a) studied the ignition of a sawdust fuel bed due to a single glowing firebrand. The ignition probability of the fuel bed increased with increasing firebrand diameter. The firebrand smaller than 3.17 mm in diameter was unable to ignite dry sawdust. Based on the energy balance equation and experimental results, Yin et al. (2014) showed that the square root of the ignition delay time (tig) of pine needles due to a cuboid glowing firebrand was proportional to the fuel moisture content (FMC = 12.9–65%) at wind speed (U) of 3 m s−1. Recently, Fang et al. (2023) found that as the wind speed increased (U = 0–4 m s−1), the ignition probability of pine needles due to a cubic glowing firebrand first increased and then decreased, and the ignition delay time decreased steadily. Using the energy balance equation, they obtained a prediction correlation for the ignition delay time concerning the wind speed and fuel moisture content. Hernández et al. (2018) placed an electric heater vertically in the pine needle fuel bed and found that the ignition delay time was inversely proportional to the incident radiation heat flux. Moreover, the ignition delay time decreased with increasing bulk density. Ellis (2015) used flaming bamboo sate sticks and glowing eucalyptus barks for experiments and obtained the ignition probability of litter in dry eucalyptus forests under different wind speeds and fuel moisture contents. Several prediction correlations for the ignition probability of the fuel bed, which coupled key parameters including the ambient wind speed, fuel moisture content, and bulk density, were derived based on the Logistic regression model (Ganteaume et al. 2009; Ellis 2015; Cawson et al. 2022; Lin et al. 2024).
For fuel bed ignition due to firebrand piles, it was shown that the ignition delay time was affected by the firebrand pile mass, fuel density (Salehizadeh et al. 2021), and wind speed (Wessies et al. 2019; De Beer et al. 2023). Manzello et al. (Manzello et al. 2010, 2017; Manzello 2013) and Suzuki et al. (2014a) used NIST Dragon to produce continuous glowing firebrand showers of similar size and mass. They found that the accumulation of firebrands accelerated the ignition of building materials and pine needles. Kasymov et al. (2016) studied the ignition process of the pine needle fuel bed with 1–10 smouldering bark and branches at U = 1–3 m s−1. It was found that the ignition probability decreased with increasing bulk density of the fuel bed, while the number of firebrands required to ignite the fuel bed reduced, and the ignition probability increased with increasing wind speed. Suzuki and Manzello (2020) proposed an empirical correlation between the ignition delay time of the fuel bed and the firebrand number based on energy balance analysis but without experimental verification. Recently, some researchers measured the heat fluxes from the firebrand pile to the inert substrate below by heat flux gage (Hakes et al. 2019; Salehizadeh et al. 2021; Tao et al. 2021) or infra-red camera combined with inverse heat transfer analysis (Bearinger et al. 2021a, 2021b; Lattimer et al. 2022a). It was found that the average peak heat flux of the firebrand pile increased with the firebrand pile mass (Hakes et al. 2019; Salehizadeh et al. 2021) and the wind speed (Bearinger et al. 2021a; Salehizadeh et al. 2021; Tao et al. 2021). The temporal heat flux of the firebrand pile first reached its peak and then gradually decreased in the quiescent conditions. As U increased, the temporal heat flux achieved a peak and decreased before entering a relatively stable stage (Tao et al. 2021). For the horizontal array of three firebrands, the heat flux of the downwind firebrand was lower than that of the upwind firebrand (Lattimer et al. 2022a). Since ash accumulated continuously on the surface of the upwind and middle firebrands, their surface temperatures decreased, while that of the downwind firebrand was relatively stable (Lattimer et al. 2022b).
Compared with a single firebrand, the cooperative effect of multiple nearby firebrands can also result in the acceleration of the fuel ignition. For the firebrand density of 10 dm−2 on the ground in field experiments (Santamaria et al. 2015; Filkov et al. 2017), the average separation distance between firebrands is about 4.7 cm if they are uniformly distributed. In the ignition tests with the firebrand shower by the NIST Dragon (Suzuki et al. 2014b), the firebrand number required to ignite 1.2 m × 1.2 m shredded hardwood mulch beds ranged from 1500 to 2000, and the average separation distance between firebrands was 3.5–4.7 cm. Kwon and Liao (2022) measured the temperature variations of a 3 × 3 array of cubic glowing firebrands (initial side length: 1.9 cm) under different separation distances (d = 0–3 cm). It was shown that the firebrand temperature and smouldering duration decreased as d increased. Compared with a single firebrand, the temperature of multiple firebrands increased significantly. Matvienko et al. (2023). studied the ignition characteristics of wood due to two cylindrical firebrands with different d in laminar flow by numerical simulation. It was found that as d increased, the ignition delay time of the wood increased, and the ignition probability decreased. Zhu and Urban (2023) studied the effect of the separation distance between two electrical cartridge heaters on the ignition behavior of white pine wood under quiescent conditions. They found that the cooperative effect of the two heaters accelerated the fuel ignition when d was lower than a critical value. The critical d was found to decrease with increasing radiation heat flux.
A review of the literature showed that the wind speed and the separation distance between firebrands are key parameters that determine the ignition process of fuels. However, previous research on fuel ignition by multiple firebrands with different separation distances was limited and rarely considered the effect of ambient wind. Consequently, prediction correlations for ignition probability and ignition delay time of fuel bed were not developed. This work focused on the ignition behavior of pine needle fuel beds by two tandem cylindrical firebrands under wind conditions. First, the heat fluxes from the two glowing firebrands to an inert substrate, the ignition probability, and the ignition delay time of the pine needle fuel beds were obtained under different separation distances and wind speeds (U = 0–4 m s−1). Second, a logistic regression model for the ignition probability was developed. Finally, a prediction model for the ignition delay time of the fuel bed was proposed based on the energy balance concept and verified using experimental data of this work.
Materials and methods
Experimental set-up and measurements
A small-scale wind tunnel, which consisted of an axial flow fan, contraction section, rectification section, and test section with cross-sectional dimensions of 40 cm × 40 cm and a length of 90 cm was used in the experiment (Fig. 1a). The contraction section could reduce variations in both the mean and fluctuating velocities, and the rectification section was used to match the smaller circular cross-section with the square cross-section of the test section. A damping net layer and a honeycomb mesh with a thickness of 10 cm and a hole diameter of 0.52 cm were placed in the rectification section to stabilise the airflow. The axial flow fan with a power of 750 W was controlled by a frequency transducer and generated a well-controlled flow field in the test section with wind speed (U) ranging from 0 to 4 m s−1. The centre of the square fuel pan (side length: 20 cm, depth: 6 cm) was located on the centerline of the wind tunnel, and its rim was made flush with the ground of the test section. The openings on both sides and the top of the test section (size: 30 cm × 30 cm) were equipped with borosilicate glass (Salehizadeh et al. 2021). To avoid the influence of borosilicate glass on temperature measurement, two observation holes with a diameter of 10 cm were set in the centre of the borosilicate glass on both sides of the test section. Subsequently, the flow fields in the horizontal and vertical planes above the fuel pan were calibrated carefully using a hot wire anemometer (HWA, Kanomax Inc., precision: 0.01 m s−1) with the two holes. The variations of the wind speed with spatial locations and time were less than 10% and 6%, respectively, which were close to those in the study of firebrand ignition of pine needles by Fang et al. (2023).
Schematic of the experimental setup of the (a) wind tunnel, (b) test section, (c) propane burner, (d) glowing firebrands, and (e) two firebrands in tandem arrangement.
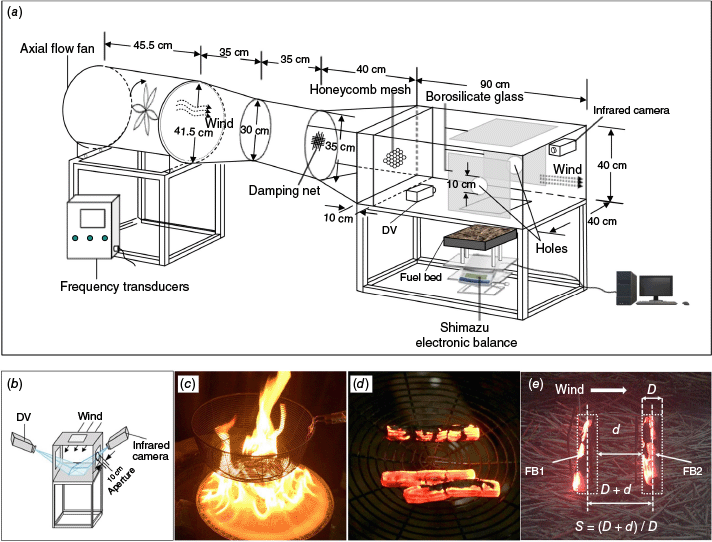
A DV camera (Sony FDR-AX700, 3840 × 2160 pixels, 25 FPS) and an infra-red camera (Fluke RSE600, 60 Hz, accuracy: ±2°C, range: −10~1200°C) recorded the experimental process and the surface temperatures of firebrands, respectively (Fig. 1b). The largest surface temperature of the firebrands was 1089°C in this work and located in the measurement range of the infra-red camera. Lattimer et al. (2022a) used a type K exposed junction thermocouple and an infrared camera to measure the surface temperature of smouldering firebrands whose size was similar to those in this work. They compared the two measurement results and found that the emissivity of the firebrand surface was 0.89 ± 0.01. Wong et al. (2022), Ju et al. (2024), and Zen et al. (2021) also set the emissivity of firebrands as 0.90 without calibration. Therefore, the surface emissivity of firebrands and fuel (ε) was taken as 0.90 in this work without calibration.
Field fire experiments (Santamaria et al. 2015; El Houssami et al. 2016) and crown fire experiments in the laboratory (Manzello et al. 2008) indicated that glowing cylindrical branches were typical firebrands in wildland fires. As shown in Table 1, this paper utilised the cylindrical dowels made of Pinus sylvestris (Salehizadeh et al. 2021) as the initial firebrands with length (L) and diameter (D) of 50 and 10 mm, respectively (Bearinger et al. 2021a; Lattimer et al. 2022a). The aspect ratio was 5 (i.e. AR = L/D = 5) and the initial mass was 1.71 ± 0.05 g. Before the experiment, the initial firebrands were dried in an oven at 75°C for 24 h and the moisture content was about 0.17%. Similarly, Lattimer et al. (2022a) dried twigs in an oven at 75°C for several weeks to reach a moisture content of less than 0.3%. The initial firebrands were then heated in a propane buoyant diffusion flame with a heat release rate of 10.8 kW in a quiescent environment (Fig. 1c). The propane flame was extinguished after 80 s. The initial firebrands continued to burn freely for 10 s, forming glowing firebrands (Fig. 1d). The residual mass of the firebrands was about 20% of the initial mass. The average projected area of the firebrands was 4.12 cm2. Note that the firebrand mass and projected area in this work were consistent with those in previous studies (Manzello et al. 2009; Suzuki et al. 2014a; Suzuki and Manzello 2022). Two glowing firebrands were used in each experiment of fuel bed ignition or heat flux measurement. They were placed in parallel, and their central axes were perpendicular to the wind direction. The upwind and downwind firebrands were named FB1 and FB2, respectively. The separation distance (d) between FB1 and FB2 (i.e. the minimum distance between the firebrand surfaces) varied from 0 to 30 mm (Fig. 1e). The separation distance ratio (S = (D + d)/D) is defined as the ratio of the centre-to-centre distance of the firebrands (D + d) to the firebrand diameter (D). Two fine steel needles were placed in front of and behind each firebrand to fix it (Lattimer et al. 2022a). The placement of the two firebrands was completed within 3 s in each experiment.
| Firebrand size (D, L, mm) | 10, 50 | |
| Fuel bed size (cm) | 20 × 20 × 6 | |
| Fuel moisture content (FMC) | 7.75% ± 0.51% | |
| Wind speed (U, m s−1) | 0, 1, 2, 3, 4 | |
| Bulk density (ρb, kg m−3) | 30 ± 0.5 | |
| Separation distance (d, mm) | 0, 5, 10, 15, 20, 25, 30 |
The ignition experiments used dead pine needles collected from the ground of P. sylvestris forests in Hebei province, China (41°51′37″N, 117°48′55″E) as the fuel. Dead pine needles were then stored in an air-conditioned room for several weeks. The moisture contents of pine needles were measured before the experiments and were found to vary slightly (7.75% ± 0.51%). Note that this moisture content was close to those in the experiments of Urban et al. (2017), Fang et al. (2021), and Kasymov et al. (2016). To reduce the effect of the fuel bed roughness, the pine needles were evenly placed in the fuel pan and the fuel surface was made flush with the pan rim. The dry bulk density (ρb) was 30 kg m−3 ± 0.5 kg m−3. The fuel load (mf) was 1.8 kg m−2. The fuel bed thickness (δ0) was 6 cm. The pine needle surface-to-volume ratio (SVR) was 5096 m−1. Before the experiment, we used an electric sifter to sieve out twigs and other impurities in the pine needles to obtain pure pine needles. The glowing firebrands were naturally placed on the fuel bed surface. Each ignition experiment was repeated 5–18 times. An electronic balance (Shimazu UW6200H, readability: 0.01 g) recorded the mass loss rate of the fuel bed to determine whether it was ignited.
As shown in Fig. 2, the pine needle fuel bed was replaced with an inert substrate, and the heat flux produced by the glowing firebrand was measured individually using a water-cooled radiation heat flux gage (HFG, Captec TS-10C, sensor diameter: 10 mm, 0–200 kW m−2, uncertainty: ±3%). A cylindrical quartz glass hood was placed on the HFG surface to prevent the potential damage of the glowing firebrand to the very thin measurement surface of HFG. The transmissivity of quartz glass is over 85% in a large wavelength range of 0.25–3.5 µm (Incropera et al. 1996). The distance between the upper quartz glass and the measurement surface of the HFG was about 2 mm, and the heat conduction from the quartz glass to the HFG was neglectable due to this air gap. In addition, the temperature of the quartz glass was much lower than that of the firebrands, and its radiation contribution can be ignored. Previous work indicated that the measured heat flux would be affected by the sensor size of the HFG for relatively small firebrands (Hakes et al. 2019). To further improve the spatial resolution of heat flux measurement, aluminum foil strips were placed on the outer surface of the quartz glass cover partially, forming a small central measurement surface with a length of 10 mm and a width of 3 mm (Fig. 2a, b). Calibration was performed using an infrared heater with a maximum radiative heat flux of 60 kW m−2. It was found that the outputs of the original HFG (diameter: 10 mm) and the covered HFG (effective size: 10 mm × 3 mm) were strictly proportional with errors less than 1%, indicating that the covered HFG exhibited good linearity and measurement accuracy. The response time of the covered HFG was found to be less than 150 ms. The surface of the covered HFG was made flush with an inert ceramic fiber board wrapped with aluminum foil (Fig. 2b). The inert surface allowed for the isolation of the heat fluxes produced by the firebrands from fuel bed ignition (Hakes et al. 2019; Tao et al. 2021). The long side of the effective measurement surface of the HFG was perpendicular to the wind direction. The glowing firebrands were placed above the quartz glass hood. Since two HFGs and their water-cooling devices were unable to be placed under the two firebrands simultaneously, the heat fluxes of FB1 and FB2 were measured separately in repeated experiments. Each test for the heat flux measurement was repeated 3–5 times.
Results and discussion
Experimental observations
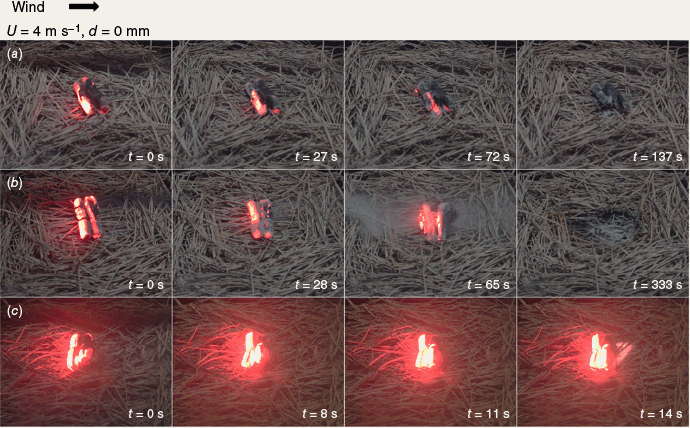
When U = 0–1 m s−1, an ash layer was formed on the surface of the firebrands. The combustion intensity of firebrands was relatively low and the firebrands extinguished quickly. The carbonised zone was not obvious in the fuel bed without wind. For U = 1 m s−1, the firebrands initiated the solid-phase reaction of pine needles, and a significant carbonised zone appeared in the fuel bed. However, the firebrands still cannot ignite the fuel bed. As the wind speed increased from 2 to 4 m s−1, the firebrands could ignite the pine needle fuel bed. Similar to the results using a single glowing firebrand (Yin et al. 2014), three ignition results of the pine needle fuel bed under the action of two tandem glowing firebrands were observed, including no ignition (NI), smouldering ignition (SI), and flaming ignition (FI). Figs 3–5 show the typical experimental images of the fuel bed under the action of two firebrands under different separation distances and wind speeds.
Ignition of the pine needle fuel bed by two adjacent firebrands for U = 4 m s−1 and d = 0. (a) No ignition (NI), (b) smouldering ignition (SI), and (c) flaming ignition (FI).
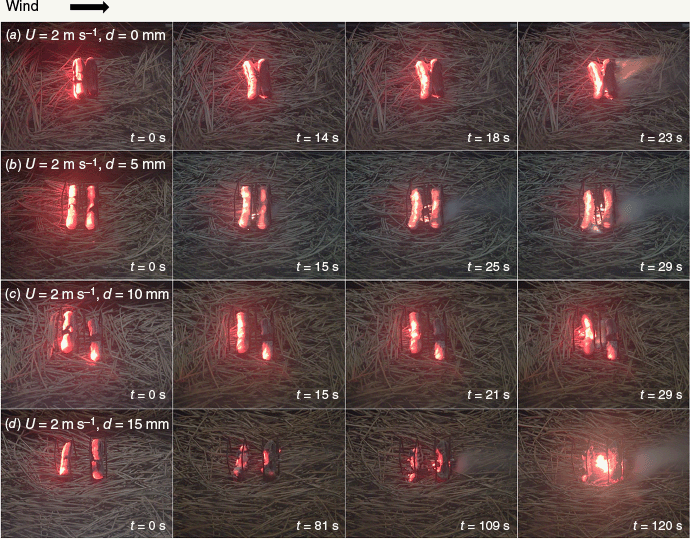
Experimental phenomena of pine needles ignition by two tandem firebrands for d ≤15 mm and U = 2 m s−1. (a) Ignition in the downwind region of FB2, FI, (b) ignition in the region between FB1 and FB2, StF, (c) ignition in the region between FB1 and FB2, FI, and (d) ignition in the region between FB1 and FB2, StF.
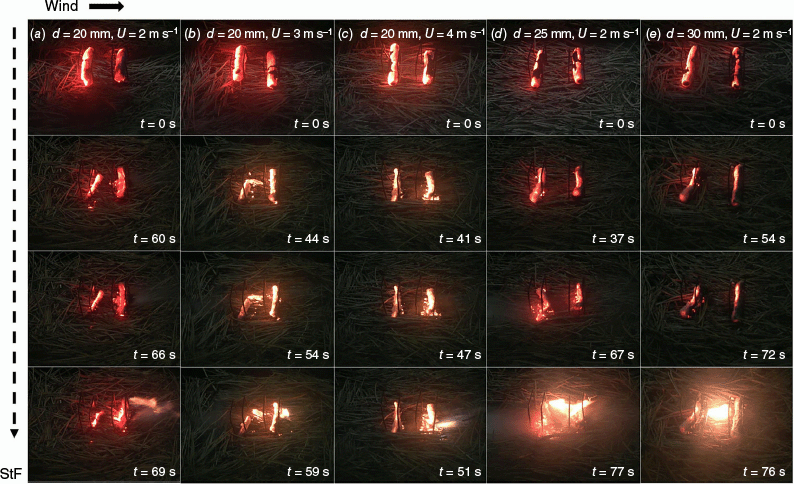
Experimental phenomena of the pine needles ignition by two tandem firebrands for d = 20–30 mm and U = 2–4 m s−1. (a) d = 20 mm, U = 2 m s−1, (b) d = 20 mm, U = 3 m s−1, (c) d = 20 mm, U = 4 m s−1, (d) d = 25 mm, U = 2 m s−1, (e) d = 30 mm, U = 2 m s−1.
As shown in Fig. 3, when U = 2–4 m s−1, except for NI (Fig. 3a), the fuel bed would exhibit SI (Fig. 3b) or FI (Fig. 3c). In smouldering ignition (SI), after the two glowing firebrands were deposited in tandem arrangement on the fuel bed surface, the fuel bed began to produce smoke and undergo smouldering combustion (t = 28 s, Fig. 3b), followed by the release of large amounts of smoke (t = 65 s, Fig. 3b). The smouldering front propagated into the fuel bed or around the firebrands. After some time, the fuel bed may undergo the smouldering-to-flaming (StF) transition. In this study, the SI ignition delay time of the pine needle fuel bed is defined as the time from when the glowing firebrands deposit on the fuel bed to when the pine needles produce continuous smoke and exhibit flameless combustion.
In flaming ignition (FI), the solid-phase reaction occurred in the fuel bed, but the smoke was less and intermittent (t = 8 and 11 s, Fig. 3c), followed by rapid FI in the fuel bed (t = 14 s, Fig. 3c). Therefore, the FI ignition delay time of the pine needle fuel bed is defined as the time from when the glowing firebrands fall on the fuel bed to when the flame appears (Yin et al. 2014). In summary, the ignition delay time (tig) of the pine needles is defined as the time from when the glowing firebrands deposit on the fuel bed to when SI or FI is observed in the pine needles.
Fig. 4 shows the experimental observations of the ignition of pine needle fuel bed for d ≤15 mm at U = 2 m s−1. When d ≤15 mm, FB1 usually did not break under wind conditions. Compared with FB2, the diameter of FB1 varied insignificantly over time. For d = 0 (Fig. 4a), the fuel bed exhibited flameless combustion but did not produce smoke (t = 14 s). The FI of the fuel bed mainly occurred in the downwind region of FB2 (t = 23 s). When 5 mm ≤ d ≤15 mm, smoke and flameless combustion first appeared in the fuel bed and resulted in SI (Fig. 4b, d, t = 15 s and 81 s). Next, the smouldering fronts below FB1 and FB2 spread and intersected in the fuel bed between FB1 and FB2, resulting in most of the gas-phase ignition (StF) occurring here (Fig. 4b, d, t = 29 s and 120 s). The FI of the fuel bed could also be observed in this region (Fig. 4c, t = 29 s). In addition, the smouldering front could propagate downwards in some experiments, leading to gas-phase ignition inside the fuel bed.
Fig. 5 shows the experimental phenomena of smouldering to flaming (StF) transition in the fuel bed for 20 mm ≤ d ≤ 30 mm. Unlike the results with lower d in Fig. 4, the gas phase ignition mainly appeared downwind of FB2 with some occurring between FB1 and FB2 in Fig. 5. Before the occurrence of StF in the fuel bed, FB1 would exhibit partial mass consumption (Fig. 5a), break (Fig. 5b, d), and decrease in size (Fig. 5c, e). In Fig. 5a (t = 60 s) and Fig. 5c (t = 41 s and t = 47 s), due to the greater surface gas velocity of FB1 than FB2 (Hakes et al. 2019), the mass loss rate of FB1 was larger than that of FB2, resulting in the smaller size of FB1 compared to FB2 (Lattimer et al. 2022b). As shown in Fig. 5b, when FB1 broke, part of FB1 approached FB2 under the action of wind, leading to a decrease in the ignition delay time of the fuel bed. When d = 20 mm, as U increased, the time for StF of the pine needles decreased steadily (Fig. 5a–c, 69, 59, and 51 s). For U = 2 m s−1, as d increased from 20 to 30 mm (Fig. 5a, d, e), the time for StF of pine needles increased slightly (69, 77, and 76 s). Compared with d = 0–15 mm, the ignition of the fuel bed required more energy for d = 20–30 mm, resulting in more mass consumption of FB1 and increased ignition delay time.
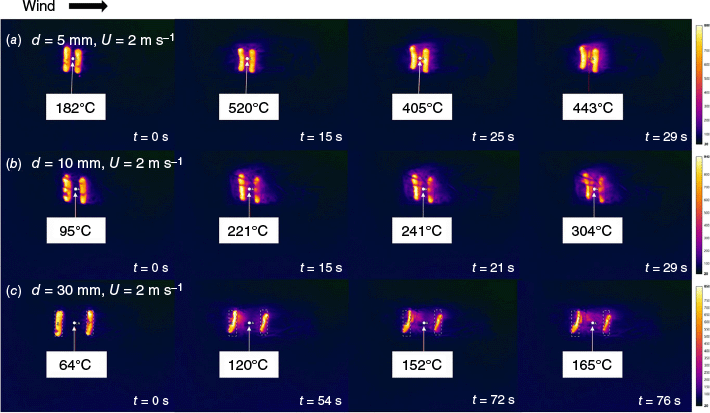
Fig. 6a–c shows the surface temperature distributions of the fuel bed for d = 5, 10, and 30 mm at U = 2 m s−1, corresponding to the tests of Figs 4b, c, and 5e, respectively. It can be observed that SI (t = 15 s, Fig. 6a) and FI (t = 29 s, Fig. 6b) occurred in the pine needle fuel bed that was jointly heated by FB1 and FB2 for d = 5 mm and 10 mm. The temperatures of the pine needles at the center point between FB1 and FB2 could exceed 300°C, while the temperature outside the area between the two firebrands was much lower. For d = 30 mm, the cooperative heating effect on the fuel by the two tandem firebrands weakened. In Fig. 6c, the temperature of the pine needles at the centre point between the two firebrands was only 120°C when SI occurred in the fuel bed at t = 54 s.
Infra-red images of the pine needle fuel beds at U = 2 m s−1, (a) d = 5 mm, StF, Fig. 4b, (b) d = 10 mm, FI, Fig. 4c, (c) d = 30 mm, StF, Fig. 5e.
It should be noted that the ignition of the pine needle fuel bed by the firebrands has a certain degree of randomness. When U = 0 and 1 m s−1, the pine needle fuel bed could not be ignited for all the separation distances. When the pine needle fuel bed was successfully ignited (i.e. SI, StF, and FI), the probability of StF was the highest, at 26.8%, followed by the probability of FI was 23.4%.
Time-resolved heat flux
Fig. 7a, b show the variations of the radiation heat fluxes , from FB1 and FB2 to the inert substrate over time. Here, t = 0 represents the moment when the firebrands are deposited on the heat flux gage, and the shaded region denotes the standard deviation of repeated experiments. Due to the small differences in the initial characteristics of the glowing firebrands, the duration of the effective heat flux of the firebrands varied in repeated experiments. However, the measurement results of heat flux generally exhibited good repeatability.
Variations of heat fluxes produced by the firebrands with time. (a) FB1, d = 30 mm, U = 4 m s−1, (b) FB2, d = 15 mm, U = 2 m s−1, and (c) FB2, d = 10 mm, U = 2 m s−1. FB1 broke and part of FB1 moved to FB2, (d) FB2, d = 30 mm, U = 2 m s−1. FB1 was consumed significantly and broke, and the flow blockage effect on FB2 was weakened.
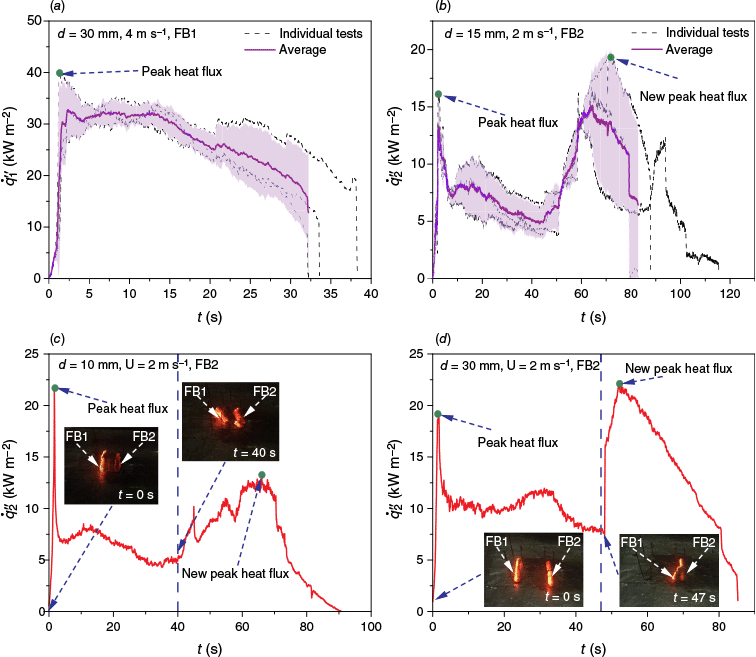
In some experiments, FB1 would break or consume significantly, which affected the variation trend of heat flux greatly. Fig. 7c shows the variation of with time for d = 10 mm and U = 2 m s−1. FB1 broke at t = 28 s, and its diameter changed slightly. The broken part of FB1 was blown downwind by the wind and came into contact with FB2. Then started to increase from 5.03 kW m−2 (t = 40 s), and reached another peak of 13.13 kW m−2 (t = 66 s), with an increase of 2.61 times. Fig. 7d shows the variation of with time for d = 30 mm and U = 2 m s−1. According to the experimental observations (Fig. 5e), the diameter of FB1 decreased steadily with time, which was different from that in Fig. 7c. FB1 broke and came into contact with FB2 with (t = 47 s). As a result, the gas velocity above the surface of FB2 increased, leading to an increase in the char oxidation reaction rate. Then quickly achieved a new peak of 21.88 kW m−2 with an increase of 2.78 times (t = 52 s). In some other experiments, the diameter of FB1 decreased greatly but FB1 was not broken. Then the blockage by FB1 to the gas flow over FB2 weakened, thereby increasing .
Fig. 8 shows the temporal variations of and under different U and d. The shaded region denoted the standard deviation in repeated tests. Hernández et al. (2018) found that the minimum radiative heat flux required to ignite a pine needle fuel bed (ρf = 30.8 kW m−3) with a cylindrical electric heater was 10.4 kW m−2. In this work, the period with or greater than 10 kW m−2 was taken as the effective stage of the heat flux. When d was unchanged, the duration of the effective stage of increased first and then decreased with increasing U. However, due to the variations in the combustion state of the upwind FB1, the duration of the effective stage of fluctuated in repeated tests.
Variations of heat fluxes produced by FB1 and FB2 over time under different separation distances and wind speeds. (a) d = 0 mm, FB1, (b) d = 0 mm, FB2, (c) d = 10 mm, FB1, (d) d = 10 mm, FB2, (e) d = 20 mm, FB1, (f) d = 20 mm, FB2, (g) d = 30 mm, FB1, (h) d = 30 mm, FB2.
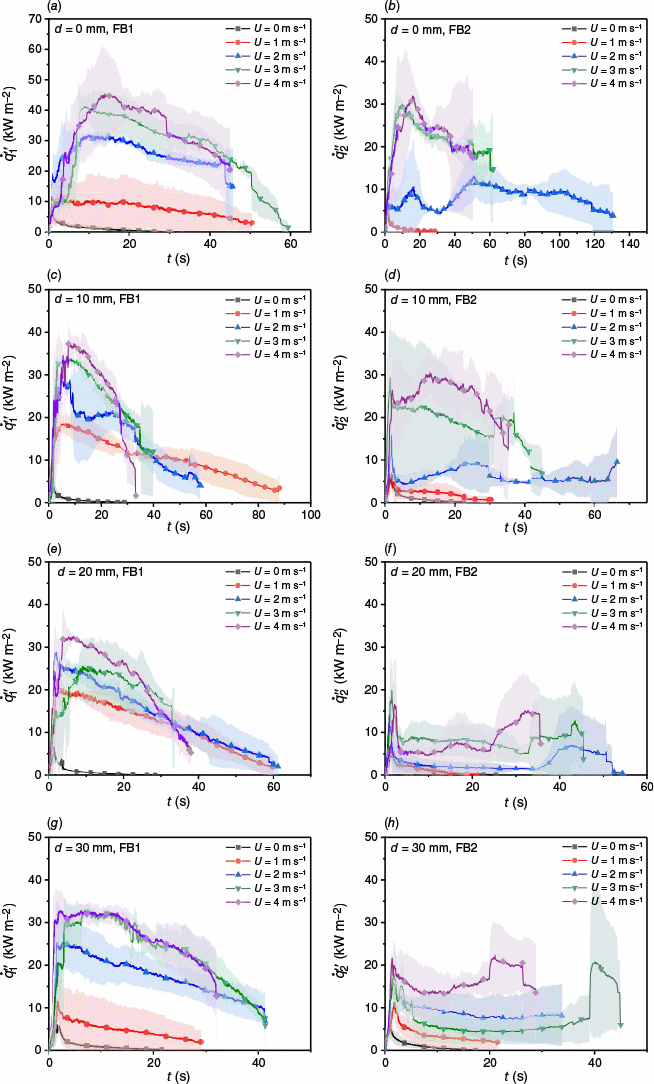
When U = 0–1 m s−1, for all d, and both achieved their peak values in several seconds and then decreased rapidly. When U = 2 m s−1, for all d, reached a peak value for t ≤ 10 s and then decreased slowly, and was greater than 10 kW m−2 for t = 2–40 s. However, as t increased, reached a peak value and then decreased and entered a stable stage. As d increased, the duration of the stable stage decreased. Then began to increase again over time and reached a new peak value. Note that the new peak values were not consistent, and there may be several peaks (e.g. Fig. 7b, U = 2 m s−1). Obviously, the variation trend of was closely related to d.
When U = 3–4 m s−1, for all d, reached its peak for t ≤15 s. For t = 5–30 s, was greater than 15 kW m−2 and remained relatively stable. The peak value of increased to 50–65 kW m−2 for d = 0, and around 40 kW m−2 when d ≠ 0. When d ≤10 mm, the variation of was less affected by FB1, and the variation trends of and were consistent. Similar to the trend at U = 2 m s−1, first reached a peak value, then decreased, and reached a new peak value after a stable period for d ≥15 mm.
Average peak heat flux
Our results showed that the peak heat flux produced by the firebrand was defined as the maximum heat flux in the effective heating period (i.e. the largest value denoted by the green points in Fig. 7). Fig. 9a, b show the variations of the average peak heat fluxes of FB1 and FB2 in repeated tests with the separation distance. As described in Expermental observations, when U = 0, ash was accumulated on the firebrand surface, and the burning intensity of the firebrand was reduced. The interaction between the two firebrands was weak and they were extinguished quickly. Consequently, and were close and low, and their variations with d were not significant. For all d, the mean value of and at U = 0 was 8.43 ± 1.80 kW m−2. When U ≠ 0, the gas velocity around the surface of FB2 was less than that of FB1 (Lattimer et al. 2022b), resulting in . Consistently, when U = 1 m s−1, the mean values of and were 18.59 ± 3.51 and 10.74 ± 2.38 kW m−2, respectively.
Variations of average peak heat fluxes of FB1 and FB2 with separation distance and wind speed.
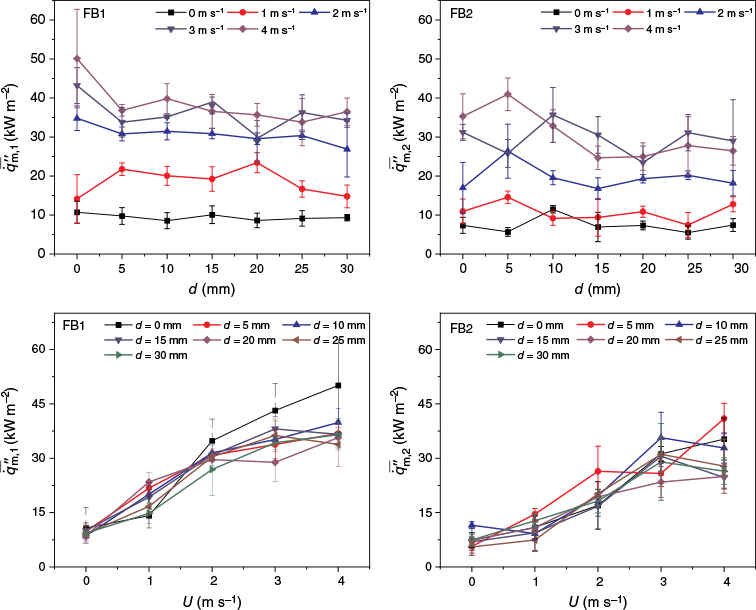
For U = 2–4 m s−1, was the largest at d = 0, and increased from 34.80 to 50.09 kW m−2 with U. As d was increased, the thermal interaction between firebrands weakened. Then tended to decrease. However, the surface gas velocity and char oxidation reaction rate of FB2 may increase. In addition, the state of FB1, i.e. exhaustion, breakage, or blown away by the wind, was somewhat random (Fig. 7c and d). These factors led to inconsistent variations in and with d. When U was unchanged, the average ratio of to ranged from 1.29 to 1.80 for all d. Fig. 9c, d show the variations of and with U, respectively. When d remained unchanged, the char oxidation reaction rates of the two firebrands, , and generally increased with increasing U. For all d, when U increased from 0 to 4 m s−1, and were increased by 1.96–4.07 times and 1.45–4.11 times, respectively.
Here, the possible impact of using the inert substrates instead of the pine needle fuel bed on the heat flux measurement results is discussed. From the experimental observations, the combustion behavior of the firebrands on the inert substrate was similar to that on the pine needle fuel bed. When U = 0–1 m s−1, an ash layer was formed on the surface of the smouldering firebrands on the inert substrate and the fuel bed, and the glowing combustion on the firebrand surface quickly disappeared. The firebrands were not consumed completely at this time, and the remaining mass was significant. When U = 2–4 m s−1, the two firebrands on the inert substrate burned out or were blown away by the wind if the remaining mass was low. However, part of the two firebrands remained on the surface of the fuel bed in some experiments. In addition, due to the interaction between the firebrands and the fuel bed, the combustion times of the firebrands on the inert substrate were generally lower than those of the firebrands on the pine needle fuel bed. However, these factors should have limited influence on the heat flux measurement in the quasi-steady state.
Surface temperature of firebrand
Fig. 10a, b show the temporal variations of the peak surface temperatures (Tm) of FB1 and FB2 in the ignition delay period at U = 3 m s−1 for d = 15 mm and 30 mm, respectively. The shaded region represents the standard deviation. It was found that Tm was relatively steady during the ignition delay period. The standard deviation of Tm of FB2 was greater than that of FB1, indicating that the combustion of FB2 may be greatly affected by the upwind FB1. Moreover, the heat released by the smouldering pine needles would in turn affect the combustion of firebrands, which may also cause fluctuations in the surface temperature.
Variations of peak surface temperatures of FB1 and FB2 during the ignition delay period. (a) d = 15 mm and U = 3 m s−1, (b) d = 30 mm and U = 3 m s−1, (c) average peak surface temperatures of FB1 and FB2, and (d) d = 15 mm and U = 2 m s−1.
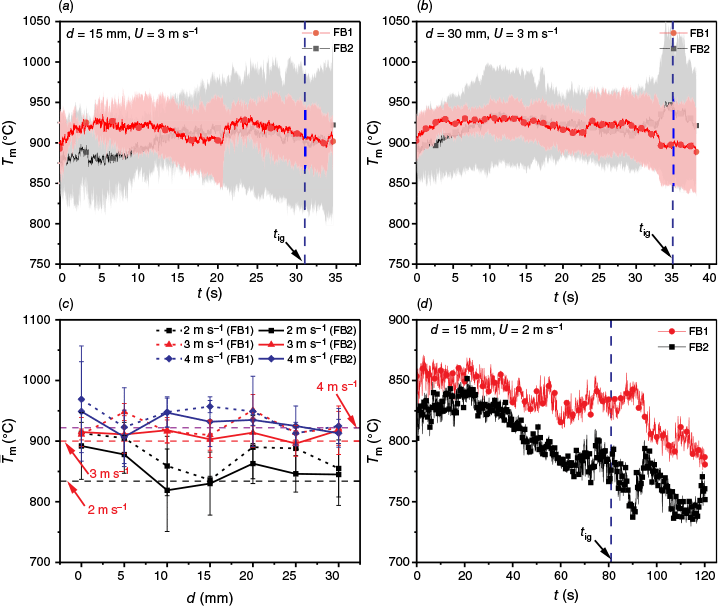
Fig. 10c shows the variations of average peak surface temperatures of FB1 and FB2 in the ignition delay period with d under different U. The horizontal dotted lines refer to the average peak surface temperatures of a single firebrand at U = 2, 3, and 4 m s−1, respectively. Due to thermal interaction between the two firebrands, was generally greater than for all d. of the upwind FB1 was usually higher than that of the downwind FB2. As d increased, tended to decrease. In addition, the ash layer on the firebrand surface in some tests affected the variation of peak surface temperature. For example, Fig. 10d shows the variations of peak surface temperatures of FB1 and FB2 for d = 15 mm and U = 2 m s−1 (corresponding to Fig. 4d). It was found that Tm decreased over time. In Fig. 4c, d, a lot of ash was formed on the firebrand surface, which reduced the oxidation reaction rate of firebrands and may decrease the firebrand surface temperature (Lattimer et al. 2022b), thereby affecting the variation of .
Ignition probability of the fuel bed
Both smouldering ignition and flaming ignition are defined as successful ignition of the fuel bed (Nig). The ignition probability (Pig) is defined as the ratio of the number of times the pine needle fuel bed is ignited (Nig) to the total number of repeated tests (N) (Wang et al. 2016; Fang et al. 2021; Yang et al. 2022):
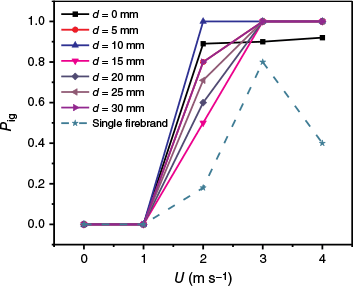
Fig. 11 shows the variation of ignition probability of pine needle fuel bed with wind speed (U) under different d. When d was unchanged, Pig increased with the increase of U. When U remained constant, Pig exhibited a non-monotonic variation with the increase of d. When U = 2 m s−1, an ash layer still existed on the surface of FB1 and FB2 for d = 0 and 15 mm, which reduced the char oxidation reaction rate of the glowing firebrands, leading to a decrease in Pig. When 5 mm ≤ d ≤ 10 mm, FB1 and FB2 effectively heated the pine needles between them and the two smouldering fronts spread and intersected in the middle region, increasing the ignition probability. In addition, in some tests (d = 20 and 25 mm), the deposited FB1 or FB2 extinguished after some time. Only a small amount of the pine needles was carbonised, and the fuel bed was not ignited. Then Pig decreased for d = 20 and 25 mm. Therefore, the state of glowing firebrands after deposition also affected Pig. Fig. 8 also shows that the variation trends of for FB1 were similar, while the change trends of for FB2 depended on d, U, and the state of FB1. The complex variation of heat flux affected the total energy transferred to the fuel bed, resulting in the non-monotonic change in Pig.
The dashed line in Fig. 11 is the ignition probability of pine needles with a single firebrand. Similarly, since the energy transferred to the fuel bed was insufficient, the pine needle fuel bed was not ignited for U ≤1 m s−1. With increasing U, Pig first increased and then decreased. When U = 4 m s−1, the mass of the single firebrand decreased rapidly due to the high char oxidation reaction rate. Then the firebrand was blown away by the wind and the convective cooling of the fuel bed was enhanced, causing Pig to decrease. This is consistent with the results of Fang et al. (2023) for U = 0–4 m s−1 with a single glowing wood cube. Since the energy transferred from two firebrands to the fuel bed was greater than that from a single firebrand, the ignition probability due to a single firebrand was always lower than that due to two firebrands.
Logistic regression models are widely used to formulate the ignition probability of fuel beds by firebrands in wildland fires (Ganteaume et al. 2009; Ellis 2015; Cawson et al. 2022; Lin et al. 2024):
where b0, b1, …, and bn are the coefficients, x1, x2, …, and xn are the independent variables. In this study, wind speed and separation distance were taken as the independent variables, and the ignition results of pine needle fuel beds (ignition: SI or FI; no ignition) were used as the dependent variables. We randomly selected the data on the ignition probability of pine needles by the two tandem firebrands and divided them into training and test sets in a ratio of 7:3 (Sun et al. 2022). Then the model for the ignition probability of pine needles at different d and U is:
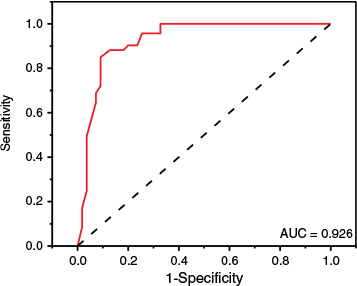
where Pig, pre is the predicted ignition probability of pine needles at different d and U. The prediction accuracy could be calculated using the confusion matrix: Accurary = (TP + TN)/(TP + FN + FN + TN), where TN is the number of true negatives (correctly predicted non-ignited samples), FN is the number of false negatives (samples predicted as non-ignited but ignited), TP is the number of true positives (correctly predicted ignited samples), and FP is the number of false positives (samples predicted as ignited but non-ignited). The results showed that the prediction accuracy of Eqn 3 was 85.8%, indicating that the classification accuracy of the model was high (Chang et al. 2013). Moreover, the receiver operating characteristic curve (ROC curve) was used to measure the accuracy of the ignition probability model (Chang et al. 2013; Lyu et al. 2023). Fig. 12 shows the ROC curve of the ignition probability model, with the horizontal axis being sensitivity and the vertical axis being one-specificity. The area below the ROC curve (AUC) was 0.926, indicating that the ignition probability model had good predictive ability (Chang et al. 2013) for fuel ignition due to two firebrands in tandem arrangement.
Ignition delay time of the fuel bed
Fig. 13 shows the average ignition delay time (tig) of the pine needle fuel bed as a function of wind speed (U) and separation distance ratio (S). The error bars denote the standard deviations of tig in the tests of successful ignitions in repeated experiments. It can be seen that tig decreased with increasing U for a certain S. With increasing S, the cooperative ignition effect of the two firebrands weakened, and tig generally increased. When S was greater than a critical value, the cooperative ignition effect of the two firebrands was insignificant. Then tig leveled off and equaled tig,sig by a single firebrand (Zhu and Urban 2023). In this work, if the ignition delay time ratio (tig/tig,sig) was lower than 0.8, the cooperative ignition effect of two firebrands was considered to be significant (Zhu and Urban 2023). Correspondingly, the critical S were 2, 1.5, and 3 for U = 2, 3, and 4 m s−1, respectively.
Ignition delay time (tig) of pine needle fuel bed by two tandem firebrands versus separation distance ratio (S) under different wind speeds (U).
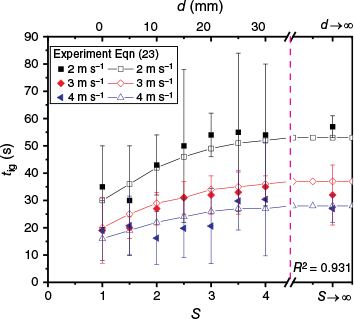
The above results were consistent with Zhu and Urban (2023) using two electric heaters with constant heat fluxes. However, the combustion of wooded firebrands in this work was affected significantly by the wind and the interactions between firebrands. Hence, the heat fluxes produced by the firebrands varied continuously. In addition, when U = 4 m s−1 and S = 2–3, flaming ignition of the fuel bed could occur in a short time (4–8 s) in some tests, resulting in relatively lower tig. The above factors collectively lead to the fluctuations of tig.
As mentioned in Time-resolved heat flux, when U = 2–4 m s−1, first reached a peak value within t = 0–15 s and then decreased. Similarly, first achieved a peak value within t = 0–10 s and then decreased. However, as affected by the combustion state of FB1 and wind, would increase again and decrease finally. Therefore, for U = 2–4 m s−1, the ignition of pine needles occurred under a region of decreasing and under a region of decreasing or increasing . This differed from the results of Salehizadeh et al. (2021), who used a firebrand pile to ignite wood and found that SI and FI occurred under a region of increasing heat flux.
The ignition process of the pine needle fuel bed was affected by the heat released from the char oxidation reaction of the firebrands, the radiation and convection heat losses of the firebrands to the surroundings, and the thermal interaction between the firebrands (Tao et al. 2021). Based on the concept of energy balance, this work aimed to develop a prediction model for tig by quantitatively characterising various heat transfer processes in Fig. 14 under different S and U. For simplicity, we assume that:
The fuel bed ignites when its temperature reaches the smouldering ignition temperature.
The upper half of the cylindrical firebrand is exposed to the air.
Schematic diagram of the heat transfer processes with two tandem glowing firebrands. (a) Front view and (b) top view.
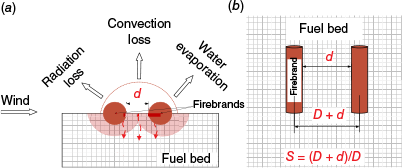
The energy balance equation could be written as (Suzuki and Manzello 2020):
where Qfb is the total heat released by the firebrands, Qrad is the radiative heat loss of firebrands to the ambient, Qconv is the convective heat loss of firebrands to the ambient, Qevap is the energy required to evaporate the water of fuel, and Qheat is the energy required to heat the fuel from the initial temperature (T∞) to the smouldering ignition temperature (Tsm). The total heat released by the two firebrands (Qfb) was expressed as:
where is the actual heat released by the ith firebrand (i = 1, 2), ΔHc = 21,000 kJ/kg is the heat of combustion of the wooden firebrand (Lattimer et al. 2022a). If the firebrand shape is unchanged, according to the assumption 2, the surface area of a firebrand exposed to the air (A) is equal to the contact area between the firebrand and the fuel bed:
The smouldering of firebrands is a surface oxidation reaction process between char and oxygen. Based on the assumption 2, the mass loss rate of a single cylindrical firebrand exposed to air can be given by (Lattimer et al. 2022a):
where ρ∞ = 1.16 kg m−3 is the air density at 300 K (Kwon and Liao 2022; Lattimer et al. 2022a), YO2, i = 0.233 is the mass fraction of oxygen in the air, and ro = 2.666 is the oxygen-fuel ratio (Lattimer et al. 2022b). The convective mass transfer coefficient is hm = hc,sig/(ρ∞cp∞Le2/3), where hc,sig = Nusigk∞/D is the convective heat transfer coefficient, k∞ = 26.3 × 10⁻³ W (mCK) −1 is the thermal conductivity of air at 300 K, cp∞ = 1.007 kJ kg−1 K−1 is the constant-pressure specific heat of air at 300 K (Incropera et al. 1996), Le is the Lewis number, taken as 1.12 (Lattimer et al. 2022a). For a single cylinder in forced convection, the Nusselt number could be given by Nusig = 0.683Re0.466Pr1/3 (40 < Re < 4000) (Incropera et al. 1996), where Re = UD/v∞ is the Reynolds number, where v∞ = 15.89 × 10⁻⁶ m2 s−1 is the kinematic viscosity of air at 300 K (Incropera et al. 1996). Pr = 0.70 is the Prandtl number of air at 300 K (Incropera et al. 1996). Note that Re = 1259–2517 for the cylindrical firebrand with U = 2–4 m s−1 in this work. In addition, Eqn 7 indicates that
In this study, the separation distance between the two tandem cylindrical firebrands (d) in cross-flow significantly affects the flow field structure and convective heat transfer rate (Dhiman et al. 2017). To the best of our knowledge, the explicit correlation for Nu of two tandem cylinders (Re = 1259–2517, S = 1–4), which coupled the two key parameters of S and Re, was not available. Mahír and Altaç (2008) and Harimi and Saghafian (2012) numerically studied the variation of the convective heat transfer rates of two tandem cylinders in cross-flow with S (Re = 100 and 200, S ≥ 2). The results showed that as S increases, Nu1 remains unchanged, while Nu2 increases and levels off when S ≥ 4. Therefore, the convective heat transfer rate of the upwind firebrand in this study can be taken as the same as that of a single cylinder. Then we have Nu1 = Nusig. Thus, the radiative and convective heat losses of FB1 are given by and Qconv,1 = hc,1A(Tfb,1 – T∞)tig, respectively. The heat released by FB1 is expressed by .
A dimensionless parameter of θ = Nu2/Nu2,S→∞ is further defined to characterize the effect of S on Nu2. Similar to the correction method of the Nusselt number in the heat transfer problem of tube banks (Kim 2013), θ is taken as θ = 1 − m exp(−nS). Using the numerical simulation results of Harimi and Saghafian (2012), we have θ = 1 − 1.257exp(−0.544S) by direct data fitting (R2 = 0.934). To ensure that Nu2 = Nu1 as S → ∞, we simply take Nu2 = θNusig. Substituting Nu2 into Eqn 7 yields the mass loss rate of FB2 . Thus, the heat released by FB2 is . The radiative and convective heat losses of FB2 are and Qconv,2 = hc,2A(Tfb,2 − T∞)tig, respectively.
The proportion of the energy absorbed by the firebrand to the heat released by the char oxidation reaction of the firebrand is taken as φ = 0.33 (Sardoy et al. 2007). Therefore, the radiative and convective heat losses of the firebrands and the fraction of the energy transferred to the fuel bed is γ = 1 − φ. Then the energy transferred from the two firebrands to the fuel bed is:
The energy balance equation on the two firebrand surfaces where the char oxidation reaction occurs can be written as (Sardoy et al. 2007; Urban et al. 2019b):
where F is the view factor of two equal-diameter semi-cylinders (Howell and Mengüç 2011):
where X = D/(2d). When X → ∞ (d → 0), F = 0.36. Substituting Eqns 10 and 11 into Eqns 8 and 9, the energy transferred from the two firebrands to the fuel bed can be written as:
The total energy transferred from two firebrands to the fuel bed (Qtrans) is given by:
According to assumption 1, when the fuel temperature reaches its smouldering ignition temperature (Tsm), the fuel bed ignites. The energy required for the ignition of the fuel (Qheat, Qevap) can be written as (Suzuki and Manzello 2020):
where ΔHw is the latent heat of water evaporation, taken as 2570 kJ kg−1, cf is the specific heat of fuel, taken as 1.466 kJ kg−1 K−1 (Yin et al. 2014). The smouldering ignition temperature (Tsm) of pine needles is taken as 500°C (Fang et al. 2023). The dried fuel mass of a single glowing firebrand is expressed by (Yin et al. 2014):
where Vf = Aδf is the dried fuel volume. δf is the thermal penetration thickness of the fuel bed during the ignition delay period, which depends on the geometric characteristics of the firebrand and is given by (Matvienko et al. 2018):
where kf,eff is the effective thermal conductivity of porous media (Skripkin 2015; Matvienko et al. 2018):
where kf = 0.11 × 10⁻³ kW m−1 K−1 is the thermal conductivity of pine needles (without pores) (Tihay et al. 2009). Since the thermal conductivity of the gas (kg) does not significantly affect the total heat exchange in the system of a porous medium and gas (Matvienko et al. 2018), we assumed that kg = k∞. The porosity of the fuel bed (ϕ = 1 − ρB/ρf) is 0.95 with ρf = 607 kg m−3 (Thomas et al. 2014). Note that Eqn 19 is assumed to be valid for the porous fuel bed by using the actual fuel bed properties. In Eqn 18, Vf is taken as the product of A and δf, i.e. the heated fuel volume by the firebrands is assumed to be a cuboid. However, the numerical simulation of Zhu and Urban (2023) showed that the fuel preheating zone by a rectangular heater is nearly a semi-cylinder with a diameter much greater than the heater width. Urban et al. (2019a) found that the heated fuel zone by a single firebrand (AR = 1) is close to a hemisphere, whose diameter is three times the firebrand diameter. Therefore, the actual fuel volume heated by the firebrands is related to the geometric shape and size of the firebrand. In this study, the heated fuel volume (Vf) in Eqn 18 may be significantly lower than the actual value. Hence we introduce a dimensionless coefficient βsig to correct Vf in Eqn 18:
As described in Experimental observations and Matvienko et al. (2023), Zhu and Urban (2023), the energy released by two nearby firebrands would heat the fuels between the firebrands. When S is sufficiently large, the horizontal heat loss increases, and the cooperative ignition effect of the two tandem firebrands becomes insignificant. Then the dried fuel mass approaches twice that of a single firebrand. From Eqns 18 and 19, we can see that σf and mdry,sig increase with increasing tig. By introducing a dimensionless coefficient β:
where the heated fuel by the two tandem firebrands is corrected by mdry = βmdry,sig. k1 and k2 are dimensionless coefficients. When S → ∞, β should be equal to two. Substituting Eqns 15–17 into Eqn 4, the ignition delay time of the fuel bed due to two tandem firebrands is:
When S → ∞, we have , and β = 2. Eqn 23 could be then degenerated into the correlation for the fuel ignition delay time with a single firebrand:
According to Eqns 13 and 14, the heat fluxes transferred by FB1 and FB2 are:
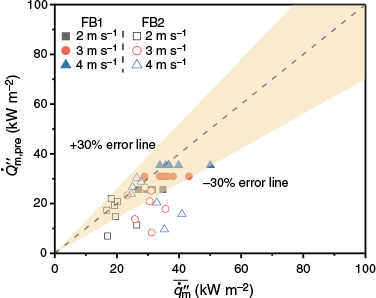
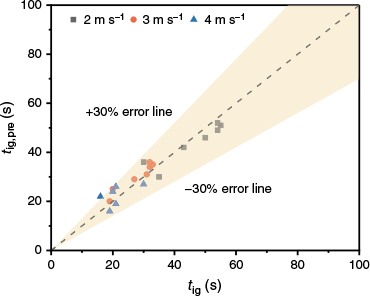
First, the experimental data of the fuel ignition delay time of a single firebrand for U = 2–4 m s−1 were used to fit Eqn 24, resulting in βsig = 1.459. As shown in Fig. 13, the errors between the predicted value and the experimental value of tig were less than 16%. Second, the experimental data of tig under different U and S were used to fit Eqn 23, and we had k1 = −3.249 and k2 = 0.738 with R2 = 0.931. In Fig. 15, the predicted ignition delay time (tig,pre) by Eqn 23 showed good agreement with the experimental data (tig), within the errors of ±30% for almost all the tests. Fig. 16 compares the measured radiation heat flux with the predicted heat flux . It can be seen that the error of the heat flux of FB1 was less than 30%. Due to the prediction error of Nu2 and the influence of FB1 on the surface wind speed and combustion process of FB2, significant errors exist between the predicted and the measured values of FB2 for 0 mm ≤ d ≤ 10 mm. As previously mentioned, pine needle bulk density, fuel moisture content, latent heat of water evaporation, the ambient temperature, porosity, and specific heat of the fuel could be taken as constant values. However, the inevitable error in the calculated Nu2 may affect the results of tig,pre and .
Comparison of the experimental and predicted ignition delay times of the pine needle fuel bed.
As indicated by Zhu and Urban (2023), when S = 1 (d = 0), the cooperative ignition effect of two firebrands may be identical to that of a single firebrand with relatively high heat flux. From Fig. 4a, it can be seen that only a small portion of the FB2 surface that was in contact with FB1 was glowing. Therefore, the heated fuel mass by FB2 may be much less than that by FB1. At this point, β may be close to one. Consistently, β was calculated to be 0.95 by Eqn 22 for S = 1, and mdry = 0.95mdry,sig. When S increased from one, the char oxidation reaction rate of FB2 increased due to the increase in the gas velocity above the FB2 surface. In addition, the fuel bed between the two tandem firebrands was heated (Fig. 4b, c), resulting in an increase in the heating zone area and the volume of heated fuel. Therefore, β should continue to increase with S, as shown by Eqn 22. When S was greater than the critical value, β was close to two as given by Eqn 22. Therefore, the assumed function for β of Eqn 22 was consistent with the experimental findings.
Conclusions
This paper presented a comprehensive experimental study on the ignition characteristics of porous fuel beds by two cylindrical glowing firebrands in tandem arrangement under wind conditions. The heat fluxes produced by the firebrands, surface temperatures of firebrands, ignition probability, and ignition delay time, were measured for wind speeds in the range of 0–4 m s−1 and separation distance ratios in the range of 1–4. The main conclusions from this work include:
The heat fluxes produced by the two firebrands increased significantly with the wind speed for a certain separation distance ratio. Under wind conditions, the average peak heat flux of the upwind firebrand was generally significantly higher than that of the downwind firebrand, and the variation trends of the average peak heat flux with separation distance ratio were not consistent for the two firebrands. When the upwind firebrand was broken, exhausted, or blown away by the wind, the heat flux of the downwind glowing firebrand would increase rapidly.
The average peak surface temperatures of the two firebrands during the ignition delay period were generally greater than that of a single firebrand. The average peak surface temperature of the upwind firebrand was generally higher than that of the downwind firebrand.
The fuel bed was ignited during the decreasing stage of heat flux for the upwind firebrand and during the increasing or decreasing stage of heat flux for the downwind firebrand. Under a specific separation distance ratio, the ignition probability due to the two tandem firebrands increased with the increase in wind speed, and was always larger than that by a single firebrand. The ignition delay time of the fuel bed increased with increasing separation distance ratio within the critical separation distance and decreased with increasing wind speed.
Based on the logistic regression model, the pine needle ignition probability model under different separation distances and wind speeds was obtained and had good prediction ability. A prediction model for the ignition delay time of pine needles was developed based on the energy balance concept. It coupled the separation distance and wind speed and was in good agreement with the experimental data of this work within the errors of 30%.
Future experimental research is needed to better understnd the ignition behaviour of more nearby firebrands on porous fuel beds with different fuel moisture contents, thereby developing ignition probability and delay time prediction models for multiple firebrands in real wildland fire scenarios.
Nomenclature
| A | exposed area of firebrand (m2) |
| AR | firebrand aspect ratio (−) |
| c | specific heat capacity (kJ kg−1 K−1) |
| d | separation distance (m) |
| D | firebrand diameter (m) |
| F | view factor (–) |
| FMC | fuel moisture content (–) |
| ΔHc | heat of combustion (kJ kg−1) |
| ΔHw | heat of water evaporation (kJ kg−1) |
| hm | mass transfer coefficient (m s−1) |
| hc | convection heat transfer coefficient (kW m−2 K−1) |
| k | thermal conductivity (kW m−2 K−1) |
| k1, k2 | dimensionless coefficients (−) |
| L | firebrand length (m) |
| Le | Lewis number (−) |
| ṁc | mass loss rate (kg s−1) |
| mdry | dried fuel mass (kg) |
| N | total number of repeated tests (−) |
| Nig | number of times the pine needle fuel bed is ignited (−) |
| Nu | Nusselt number (−) |
| n | parameter number (−) |
| Pig | ignition probability (−) |
| Pr | Prandtl number (−) |
| Qfb | heat produced from the firebrand combustion (kJ) |
| Qrad | radiation heat loss (kJ) |
| Qconv | convection heat loss (kJ) |
| Qevap | energy required for fuel bed drying (kJ) |
| Qheat | energy required for the fuel bed to reach the ignition temperature (kJ) |
| Qtrans | energy transferred by firebrands to the fuel bed (kJ) |
| q̇″ | radiative heat flux (kW m−2) |
| Re | Reynolds number (−) |
| ro | stoichiometric oxygen to fuel mass ratio (−) |
| S | separation distance ratio (−) |
| T | temperature (K) |
| t | time (s) |
| tig | ignition delay time (s) |
| U | wind speed (m s−1) |
| V | volume (m3) |
| YO2,i | oxygen mass fraction (−) |
Data availability
Data that support this study will be shared on reasonable request to the corresponding author.
Conflicts of interest
All authors declared that they do not have any conflicts of interest, and have participated in: (1) experimental design, and analysis of the data; (2) drafting the article or revising it critically for important intellectual content; and (3) approval of the final version. This manuscript has not been submitted to, nor is under review at, another journal or other publishing venue. The authors have no affiliation with any organization with a direct or indirect financial interest in the subject matter discussed in the manuscript.
Declaration of funding
This work was sponsored by the National Natural Science Foundation of China (Nos. 52222605, 51936011, 52321003).
References
Albini FA, Alexander ME, Cruz MG (2012) A mathematical model for predicting the maximum potential spotting distance from a crown fire. International Journal of Wildland Fire 21, 609-627.
| Crossref | Google Scholar |
Alexander ME, Cruz MG (2013) Limitations on the accuracy of model predictions of wildland fire behaviour: a state-of-the-knowledge overview. The Forestry Chronicle 89, 372-383.
| Crossref | Google Scholar |
Bearinger E, Lattimer BY, Hodges JL, Rippe C, Kapahi A (2021a) Statistical assessment of parameters affecting firebrand pile heat transfer to surfaces. Frontiers in Mechanical Engineering 7, 702181.
| Crossref | Google Scholar |
Bearinger ED, Hodges JL, Yang FC, Rippe CM, Lattimer BY (2021b) Localized heat transfer from firebrands to surfaces. Fire Safety Journal 120, 103037.
| Crossref | Google Scholar |
Cawson JG, Pickering BJ, Filkov AI, Burton JE, Kilinc M, Penman TD (2022) Predicting ignitability from firebrands in mature wet eucalypt forests. Forest Ecology and Management 519, 120315.
| Crossref | Google Scholar |
Chang Y, Zhu Z, Bu R, Chen H, Feng Y, Li Y, Hu Y, Wang Z (2013) Predicting fire occurrence patterns with logistic regression in Heilongjiang Province, China. Landscape Ecology 28, 1989-2004.
| Crossref | Google Scholar |
De Beer JA, Alascio JA, Stoliarov SI, Gollner MJ (2023) Analysis of the thermal exposure and ignition propensity of a lignocellulosic building material subjected to a controlled deposition of glowing firebrands. Fire Safety Journal 135, 103720.
| Crossref | Google Scholar |
Dhiman SK, Prasad JK, Kumar A (2017) Unsteady convective heat transfer in cross flow past two tandem cylinders: an inverse heat conduction approach. Heat and Mass Transfer 53, 1761-1775.
| Crossref | Google Scholar |
El Houssami M, Mueller E, Filkov A, Thomas JC, Skowronski N, Gallagher MR, Clark K, Kremens R, Simeoni A (2016) Experimental procedures characterising firebrand generation in wildland fires. Fire Technology 52, 731-751.
| Crossref | Google Scholar |
Ellis PFM (2015) The likelihood of ignition of dry-eucalypt forest litter by firebrands. International Journal of Wildland Fire 24, 225-235.
| Crossref | Google Scholar |
Fang W, Peng ZH, Chen HX (2021) Ignition of pine needle fuel bed by the coupled effects of a hot metal particle and thermal radiation. Proceedings of the Combustion Institute 38, 5101-5108.
| Crossref | Google Scholar |
Fang W, Yang JL, Chen HX, Zhang LH, Guo PC, Yuan YK (2023) Effect of wind velocity on smoldering ignition of moist pine needles by a glowing firebrand. Fire Technology 60, 1-17.
| Crossref | Google Scholar |
Filkov A, Prohanov S, Mueller E, Kasymov D, Martynov P, Houssami ME, Thomas J, Skowronski N, Butler B, Gallagher M, Clark K, Mell W, Kremens R, Hadden RM, Simeoni A (2017) Investigation of firebrand production during prescribed fires conducted in a pine forest. Proceedings of the Combustion Institute 36, 3263-3270.
| Crossref | Google Scholar |
Ganteaume A, Lampin-Maillet C, Guijarro M, Hernando C, Jappiot M, Fonturbel T, Perez-Gorostiaga P, Vega JA (2009) Spot fires: fuel bed flammability and capability of firebrands to ignite fuel beds. International Journal of Wildland Fire 18, 951-969.
| Crossref | Google Scholar |
Hakes RSP, Salehizadeh H, Weston-Dawkes MJ, Gollner MJ (2019) Thermal characterization of firebrand piles. Fire Safety Journal 104, 34-42.
| Crossref | Google Scholar |
Harimi I, Saghafian M (2012) Numerical simulation of fluid flow and forced convection heat transfer from tandem circular cylinders using overset grid method. Journal of Fluids and Structures 28, 309-327.
| Crossref | Google Scholar |
Hernández N, Fuentes A, Consalvi JL, Elicer-Cortés JC (2018) Spontaneous ignition of wildland fuel by idealized firebrands. Experimental Thermal and Fluid Science 95, 88-95.
| Crossref | Google Scholar |
Howell JR, Mengüç MP (2011) Radiative transfer configuration factor catalog: a listing of relations for common geometries. Journal of Quantitative Spectroscopy and Radiative Transfer 112, 910-912.
| Crossref | Google Scholar |
Hudson TR, Bray RB, Blunck DL, Page W, Butler B (2020) Effects of fuel morphology on ember generation characteristics at the tree scale. International Journal of Wildland Fire 29, 1042-1051.
| Crossref | Google Scholar |
Ju XY, Lisano M, Hajilou M, Sunderland PB, Stoliarov SI, Yang LZ, Gollner MJ (2024) Quantification of firebrand generation from WUI fuels for model development: firebrand generation rate, surface temperature and heat release rate. Proceedings of the Combustion Institute 40, 105729.
| Crossref | Google Scholar |
Kasymov DP, Filkov AI, Baydarov DA, Sharypov OV (2016) Interaction of smoldering branches and pine bark firebrands with fuel bed at different ambient conditions. 22nd International Symposium on Atmospheric and Ocean Optics: Atmospheric Physics 100356H 1382-1388.
| Crossref | Google Scholar |
Kim T (2013) Effect of longitudinal pitch on convective heat transfer in crossflow over in-line tube banks. Annals of Nuclear Energy 57, 209-215.
| Crossref | Google Scholar |
Koo E, Pagni PJ, Weise DR, Woycheese JP (2010) Firebrands and spotting ignition in large-scale fires. International Journal of Wildland Fire 19, 818-843.
| Crossref | Google Scholar |
Kwon B, Liao Y-TT (2022) Effects of spacing on flaming and smoldering firebrands in wildland–urban interface fires. Journal of Fire Sciences 40, 155-174.
| Crossref | Google Scholar |
Lattimer BY, Bearinger E, Wong S, Hodges JL (2022a) Evaluation of models and important parameters for firebrand burning. Combustion and Flame 235, 111619.
| Crossref | Google Scholar |
Lattimer BY, Wong S, Hodges J (2022b) A theoretical model to understand some aspects of firebrand pile burning. Fire Technology 58, 3353-3384.
| Crossref | Google Scholar |
Lin SR, Zhang TH, Huang XY, Gollner MJ (2024) The initiation of smouldering peat fire by a glowing firebrand. International Journal of Wildland Fire 33,.
| Crossref | Google Scholar |
Liu NA, Lei J, Gao W, Chen HX, Xie XD (2021) Combustion dynamics of large-scale wildfires. Proceedings of the Combustion Institute 38, 157-198.
| Crossref | Google Scholar |
Lyu H-F, Wang C-P, Deng J, Wang W-F, Li Y, Shu C-M (2023) Ignition ability prediction model of biomass fuel by arc beads using logistic regression. Journal of Thermal Analysis and Calorimetry 148, 4745-4757.
| Crossref | Google Scholar |
Mahír N, Altaç Z (2008) Numerical investigation of convective heat transfer in unsteady flow past two cylinders in tandem arrangements. International Journal of Heat and Fluid Flow 29, 1309-1318.
| Crossref | Google Scholar |
Manzello SL (2013) ‘The Performance of Concrete Tile and Terracotta Tile Roofing Assemblies Exposed to Wind-Driven Firebrand Showers.’ (National Institute of Standards and Technology, U.S. Department of Commerce) 10.6028/NIST.TN.1794
Manzello SL, Foote EID (2012) Characterizing firebrand exposure from Wildland–Urban Interface (WUI) fires: results from the 2007 Angora Fire. Fire Technology 50, 105-124.
| Crossref | Google Scholar |
Manzello SL, Maranghides A, Mell WE (2007) Firebrand generation from burning vegetation. International Journal of Wildland Fire 16, 458-462.
| Crossref | Google Scholar |
Manzello SL, Cleary TG, Shields JR, Maranghides A, Mell W, Yang JC (2008) Experimental investigation of firebrands: generation and ignition of fuel beds. Fire Safety Journal 43, 226-233.
| Crossref | Google Scholar |
Manzello SL, Maranghides A, Shields JR, Mell WE, Hayashi Y, Nii D (2009) Mass and size distribution of firebrands generated from burning Korean pine (Pinus koraiensis) trees. Fire and Materials 33, 21-31.
| Crossref | Google Scholar |
Manzello SL, Hayashi Y, Yoneki T, Yamamoto Y (2010) Quantifying the vulnerabilities of ceramic tile roofing assemblies to ignition during a firebrand attack. Fire Safety Journal 45, 35-43.
| Crossref | Google Scholar |
Manzello SL, Suzuki S, Nii D (2017) Full-Scale experimental investigation to quantify building component ignition vulnerability from mulch beds attacked by firebrand showers. Fire Technology 53, 535-551.
| Crossref | Google Scholar | PubMed |
Matvienko OV, Kasymov DP, Filkov AI, Daneyko OI, Gorbatov DA (2018) Simulation of fuel bed ignition by wildland firebrands. International Journal of Wildland Fire 27, 550-561.
| Crossref | Google Scholar |
Matvienko O, Kasymov D, Loboda E, Lutsenko A, Daneyko O (2023) Simulation of the impact of firebrands on the process of the wood layer ignition. Fire 6, 148.
| Crossref | Google Scholar |
Salehizadeh H, Hakes RSP, Gollner MJ (2021) Critical ignition conditions of wood by cylindrical firebrands. Frontiers in Mechanical Engineering 7, 630324.
| Crossref | Google Scholar |
Sardoy N, Consalvi JL, Porterie B, Fernandez-Pello AC (2007) Modeling transport and combustion of firebrands from burning trees. Combustion and Flame 150, 151-169.
| Crossref | Google Scholar |
Sardoy N, Consalvi JL, Kaiss A, Fernandez-Pello AC, Porterie B (2008) Numerical study of ground-level distribution of firebrands generated by line fires. Combustion and Flame 154, 478-488.
| Crossref | Google Scholar |
Sun Y, Zhang F, Lin H, Xu S (2022) A forest fire susceptibility modeling approach based on light gradient boosting machine algorithm. Remote Sensing 14, 4362.
| Crossref | Google Scholar |
Suzuki S, Manzello SL (2020) Role of accumulation for ignition of fuel beds by firebrands. Applications in Energy and Combustion Science 1–4, 100002.
| Crossref | Google Scholar |
Suzuki S, Manzello SL (2022) Firebrands generated in Shurijo Castle Fire on October 30th, 2019. Fire Technology 58, 777-791.
| Crossref | Google Scholar | PubMed |
Suzuki S, Brown A, Manzello SL, Suzuki J, Hayashi Y (2014a) Firebrands generated from a full-scale structure burning under well-controlled laboratory conditions. Fire Safety Journal 63, 43-51.
| Crossref | Google Scholar |
Suzuki S, Manzello SL, Kagiya K, Suzuki J, Hayashi Y (2014b) Ignition of mulch beds exposed to continuous wind-driven firebrand showers. Fire Technology 51, 905-922.
| Crossref | Google Scholar |
Tao ZX, Bathras B, Kwon B, Biallas B, Gollner MJ, Yang R (2021) Effect of firebrand size and geometry on heating from a smoldering pile under wind. Fire Safety Journal 120, 103031.
| Crossref | Google Scholar |
Thomas JC, Simeoni A, Gallagher M, Skowronski N (2014) An experimental study evaluating the burning dynamics of pitch pine needle beds using the FPA. Fire Safety Science 11, 1406-1419.
| Crossref | Google Scholar |
Tihay V, Simeoni A, Santoni P-A, Rossi L, Garo J-P, Vantelon J-P (2009) Experimental study of laminar flames obtained by the homogenization of three forest fuels. International Journal of Thermal Sciences 48, 488-501.
| Crossref | Google Scholar |
Urban JL, Song JY, Santamaria S, Fernandez-Pello C (2019a) Ignition of a spot smolder in a moist fuel bed by a firebrand. Fire Safety Journal 108, 102833.
| Crossref | Google Scholar |
Urban JL, Zak CD, Song J, Fernandez-Pello C (2017) Smoldering spot ignition of natural fuels by a hot metal particle. Proceedings of the Combustion Institute 36(2), 3211-3218.
| Crossref | Google Scholar |
Urban JL, Vicariotto M, Dunn-Rankin D, Fernandez-Pello AC (2019b) Temperature measurement of glowing embers with color pyrometry. Fire Technology 55, 1013-1026.
| Crossref | Google Scholar |
Wang SP, Huang XY, Chen HX, Liu NA (2016) Interaction between flaming and smouldering in hot-particle ignition of forest fuels and effects of moisture and wind. International Journal of Wildland Fire 26, 71-81.
| Crossref | Google Scholar |
Wessies SS, Chang MK, Marr KC, Ezekoye OA (2019) Experimental and analytical characterization of firebrand ignition of home insulation materials. Fire Technology 55, 1027-1056.
| Crossref | Google Scholar |
Wong S, Hodges J L, Lattimer B Y (2022) Impact of ash layer retention on heat transfer in piles of vegetation and structure firebrands. Fire Safety Journal 134, 103694.
| Crossref | Google Scholar |
Yang G, Ning JB, Shu LF, Zhang J, Yu HZ, Di XY (2022) Spotting ignition of larch (Larix gmelinii) fuel bed by different firebrands. Journal of Forestry Research 33, 171-181.
| Crossref | Google Scholar |
Yin PP, Liu NA, Chen HX, Lozano JS, Shan YL (2014) New correlation between ignition time and moisture content for pine needles attacked by firebrands. Fire Technology 50, 79-91.
| Crossref | Google Scholar |
Zen S, Thomas J C, Mueller E V, Dhurandher B, Gallagher M, Skowronski N, Hadden R M (2021) Development of a field deployable firebrand flux and condition measurement system. Fire Technology 57, 1401-1424.
| Crossref | Google Scholar |
Zhu LQ, Urban JL (2023) Cooperative spot ignition by idealized firebrands: impact of thermal interaction in the fuel. Fire Safety Journal 135, 103701.
| Crossref | Google Scholar |


