A simplified model to incorporate firebrand transport into coupled fire atmosphere models
Alberto Alonso-Pinar A B * , Jean-Baptiste Filippi
  A , Ha-Ninh Nguyen
  A B and Alexander Filkov
  B
B
A
B
Abstract
During wildfires, vegetation elements can be ignited and detached leading to the generation of firebrands. These firebrands can be lifted by the fire plume, transported far away from the main fire, and ignite new fires – a phenomenon known as fire spotting. Recently, numerical simulations of fire spotting using coupled fire–atmosphere models have provided insights on the role of different components of the phenomena such as fire intensity and turbulence. However, current fire propagation models do not account for long-range spotting distances.
This study aims to develop a medium and long-range firebrand transport model that can provide firebrand trajectories under the numerical and time constraints of a coupled fire–atmosphere model.
A computationally efficient transport model for calculating firebrand transport is proposed. This model is evaluated against more complex models incorporating drag and lift coefficients, and combustion models.
The reduced model accurately replicates firebrand landing patterns for both simple and complex topographies.
The proposed transport model represents firebrand landing patterns with a reduced computational time by a factor of 7, when compared to the more complex model.
Using the proposed model, spotting phenomena can be integrated within coupled fire–atmosphere models and thereby improve fire management.
Keywords: combustion, fire–atmosphere modelling, firebrand, long-range spotting, spotting, turbulence, reduced model, wildfire.
Introduction
During a wildfire, vegetation elements like bark fragments, needles and branches can ignite and detach, creating firebrands or embers. These particles can be lifted by the fire plume, transported away from the main fire, and ignite new fires. This process, known as spotting, complicates fire control, especially with medium and long-range spotting (Filkov et al. 2023).
Firebrand transport models are valuable tools for fire management, providing insights into ember landing distribution and aiding in suppression efforts. Early models used to estimate the maximum spotting distance were developed by Tarifa et al. (1965, 1967), where firebrands were lifted by a simplified plume and fell in a straight line at their terminal velocity. The works of Albini (1979, 1981, 1983) and Albini et al. (2012) expanded this approach by incorporating factors like firebrand mass-loss, vegetation type and local topography.
The usage of computational fluid dynamics (CFD) and large eddy simulations (LES) allows to account for detailed wind flows and plume structures and have been used to calculate firebrand trajectories using Lagrangian particle models. LES techniques solve the Navier–Stokes equations by directly resolving large eddies (corresponding to low-wavenumber turbulence), while parametrising the smaller ones. It is mostly suited for studying turbulence at relatively high spatial and temporal resolution. For example, Sardoy et al. (2007) developed a combustion model, which was later applied to an analytical plume representing a line fire (Sardoy et al. 2008). Later, Bhutia et al. (2010) showed that turbulent plumes lead to greater spotting distances. This was further explored in Thurston et al. (2017), where a Lagrangian model, without any combustion or aerodynamic coefficients, was used in a large numerical domain (38.4 km by 19.2 km), showing that turbulent plumes doubled the maximum spotting distance. Using a similar plume simulation, Thomas et al. (2020) showed that the terminal velocity assumption overestimates firebrand landing densities at long ranges by a factor of 14 under a constant terminal velocity assumption, and by a factor of 5 under the variable terminal velocity assumption. In addition, our recent study (Alonso-Pinar et al. 2025) showed the variability of results produced by different firebrand aerodynamic and combustion models.
Firebrands from different types of vegetation exhibit unique combustion and aerodynamic properties, affecting how far they can be transported. To characterise this, vertical wind tunnel studies (Ellis 2000; Knight 2001; Knight et al. 2001) have investigated firebrand behaviour at their terminal velocity. Particularly, Ellis (2010, 2013) and Hall et al. (2015) investigated different firebrand types, mainly bark from jarrah, karri, ribbon bark and stringybark Eucalyptus trees. Their studies used cylindrical, rectangular or disc-shaped geometries, providing quantitative data on average and maximum burnout times. This data can be useful when parametrising spotting models to individual types of vegetation.
Despite these new techniques, it remains a modelling challenge to describe the evolution of a wildfire when considering spotting as a propagation mechanism due to the difference of scales and magnitudes. Previous spotting models do not consider highly convective plumes nor aerodynamics of firebrands (Storey et al. 2020b). These models are not suitable for large and extreme fires, a limitation that was considered and accounted for during the development of the physical model presented in Kepert et al. (2024). The approach introduced by Kepert et al. (2024) provides a novel parametrisation of a diagnostic firebrand transport model based on simulations of Lagrangian particles within LES simulations of wildfire plumes. However, as a fast model, it does not explicitly resolve the coherent structures readily available in coupled fire–atmosphere models.
Coupled fire–atmosphere models have been developed to better understand large wildfire dynamics and to improve wildfire management. They are expected to be used in an operational context in the coming years (Kochanski et al. 2011, 2016, 2021; Filippi et al. 2018). These models have proven to be useful in a wide range of scales: from grass fires (Kochanski et al. 2011; Filippi et al. 2013) to large wildfires (Kochanski et al. 2013; Peace et al. 2016, 2022, 2023; Filippi et al. 2018). They have also shown to be useful to describe local terrain effects (Simpson et al. 2013, 2014), junction fires (Thomas et al. 2017a) and highly convective plumes leading to the development of Cumulonimbus Flammagenitus clouds (Couto et al. 2024). However, these models do not currently represent firebrand transport or the overall spotting process.
In the present study, we aim to develop a reduced model that describes the long-range transport of firebrands suitable for a coupled fire–atmosphere model. Two different transport models (reduced and complex) are compared, using three different idealised topographies. The reduced model considers the non-resolved turbulent kinetic energy (TKE) and firebrand characteristics. The complex model resolves the firebrand accelerations and is here considered as the reference model.
Methods
Reference firebrand models
Firebrands are typically modelled as spheres, discs or cylinders (Woycheese and Pagni 1999). Among these shapes, discs are considered the most dangerous because they can travel longer distances compared to spheres and cylinders (Anthenien et al. 2006; Sardoy et al. 2007). For this reason, the presented reference model uses disc-shaped firebrands to represent long-range transport, assuming firebrands maintain their shape while being transported. This simplification allows to use the same aerodynamic coefficient and the same mass-loss model during the firebrand transport.
The sub-models in this study are based on similar approaches from past studies (Tse and Fernandez-Pello 1998; Sardoy et al. 2007, 2008; Bhutia et al. 2010; Oliveira et al. 2014). While they have limitations inherent to this type of modelling, they are expected to produce realistic firebrand trajectories.
Combustion model
The combustion of the firebrand results in a change of its mass and volume. It involves two simultaneous phenomena. The firebrand is homogeneously pyrolysed through a subsurface volumetric chemical process and heterogeneous combustion takes place on the outer surface of the firebrand (Tse and Fernandez-Pello 1998).
In this study, firebrands are considered as homogenous wood solids. The combustion happens through a radius regression and a mass decrease following the model from Oliveira et al. (2014), which is built on the model presented by Tse and Fernandez-Pello (1998). This assumption simplifies the complex phenomena of combustion while allowing the calculation of more realistic ember landing distributions (Oliveira et al. 2014). The model from Oliveira et al. (2014) is considered within the scope of this paper to represent the firebrand combustion.
Following the model from Oliveira et al. (2014), an effective mass diameter Deff represents the pyrolysis front. The d-squared law gives the expression for the effective diameter given by Eqn 1:
where β0 is the burning rate constant equal to 3.42 × 10⁻⁷ m2 s−1, Re is the firebrand Reynolds number and Pr is the Prandtl number. Reynolds and Prandtl numbers are calculated depending on the position of the firebrand in the numerical domain. It was observed that the Prandtl number stays close to 0.7 during the firebrand transport as in Oliveira et al. (2014). The effective diameter allows for the calculation of the mass of the firebrand (mp) as shown in Eqn 2:
The actual firebrand diameter Dp is given by Eqn 3:
where E is the aspect ratio (radius to height), C is a constant equal to 1.5242 and t is the time since the firebrand departure.
Transport model
The firebrand trajectories can be calculated through Eqns 4 and 5:
where x and v are respectively the position and velocity of the firebrand, FD and FL are the drag and lift forces, ω is the angular velocity, I is the moments of inertia matrix, δcp is the difference between the centre of mass and the centre of pressure and z is the particle principal axis. Eqn 4 is written in the flat-earth coordinate system and Eqn 5 is written in the body-frame coordinate system.
Rotation can impact trajectories at short distances (Oliveira et al. 2014; Tohidi and Kaye 2017). In our study, it is neglected. This is because the scales required to model firebrand rotation are several orders of magnitude smaller than the main spatial and temporal scales of a large wildfire. Furthermore, the use of a complete six Degree of Freedom simulation is numerically demanding and requires a high level of complexity.
Drag and lift forces are modelled by the Eqns 6 and 7 as given by Sardoy et al. (2007):
where S is the exposed surface of the firebrand, CD is the drag coefficient, CL is the lift coefficient and ρatm is the air density. z′ is the vertical axis of the firebrand supposed here to always be aligned with the global z axis due to the absence of rotation. Haider and Levenspiel (1989) proposed a drag correlation, based on experimental data for different particle sizes and Reynolds numbers, given by Eqn 8:
where A = exp(2.33 − 6.46Φ + 2.45Φ2), B = 0.096 + 0.556Φ, C = exp(4.90 − 13.89Φ + 18.42Φ2 − 10.26Φ3) and D = exp(1.47 + 12.26Φ − 20.73Φ2 + 15.89Φ3), and Φ is the sphericity of the firebrand. The sphericity of the firebrand is equal to the ratio of the surface of a sphere having the same volume as the particle and the actual surface area of the firebrand (Haider and Levenspiel 1989). A lift coefficient is derived using (Hoerner 1958) crossflow principle.
Reduced model
Firebrands can be considered to fall at constant terminal velocity (Eqn 9) which comes from the force balance (Tarifa et al. 1965).
We propose to model the velocities of the firebrand directly, instead of calculating the forces and accelerations which are subject to several assumptions: drag and lift coefficients, particle shape and in-flight combustion for instance. The firebrand position is then directly calculated by integrating Eqn 10:
The three velocity components are then modelled in different ways. The vertical velocity is modelled using Eqn 11:
where vz is the firebrand vertical velocity and uz the vertical wind from the LES simulation. For the firebrands considered (Table 1), terminal velocity will be in the range of 3–8 m s−1. In the proposed model, terminal velocity is prescribed using Eqn 12:
where ρ0 is the firebrand initial density and λ is a parameter of the model; set to 0.0015 m. λ will determine the terminal velocity of the firebrand and how far a firebrand will land. This value was selected to match the reference terminal velocities from Ellis (2010, 2013) and Hall et al. (2015). The lofting phase is mainly determined by the intensity of the updrafts within the plume that is directly linked to the fire intensity already, accounted for in the coupled fire–atmosphere model.
| Firebrand property | Value | Reference | |
|---|---|---|---|
| Density | 100–450 kg m−3 | Sardoy et al. (2007), Bhutia et al. (2010), Tse and Fernandez-Pello (1998) | |
| Radius | 1.0–5.0 cm | Sardoy et al. (2007, 2008), Oliveira et al. (2014) | |
| Thickness | 0.1–1.0 cm | Sardoy et al. (2007, 2008), Oliveira et al. (2014) | |
| Specific heat, wood | 1.4666 kJ kg−1 K−1 | Tse and Fernandez-Pello (1998) | |
| Specific heat, char | 0.712 kJ kg−1 K−1 | Tse and Fernandez-Pello (1998) | |
| Char content | 0.3 | Sardoy et al. (2007, 2008) |
The plume turbulence has a major role when considering long-range transport of firebrands with lateral and longitudinal distances of firebrands, increased by a factor of two for the latter when compared to a time-averaged flow (Bhutia et al. 2010; Thurston et al. 2017). Turbulence should be then taken into consideration when developing a spotting model. Regarding the horizontal components of the firebrand velocity, velocities were related to the flow velocity and to the Turbulence Kinetic Energy (TKE). Here, TKE corresponds to the sub-grid TKE: the energy of non-resolved eddies in the LES simulation. The approach used was to define the firebrand velocities using Eqns 13 and 14:
where vx and vy are the longitudinal and lateral velocities of the firebrand, ux and uy are the wind longitudinal and lateral components extracted from the LES simulation. Finally, γ defines the direction (±1) of the turbulent gust. γ is randomly defined every τ/m second, where m is set to 10 and τ is the characteristic response time of the particle defined by Eqn 15 and adapted from Graham and James (1996), Gouesbet and Berlemont (1999) and Ross and Sharples (2004):
where Lp is a characteristic length of the firebrand (the radius of the firebrand), vair is the air kinematic viscosity. Stochastic wind patterns have been previously analysed by Masoudian et al. (2023) to better represent wildfire uncertainties with successful results.
The characteristic time response, τ, represents the time required for a firebrand to adapt to changes in the fluid flow (Graham and James 1996; Gouesbet and Berlemont 1999; Ross and Sharples 2004). A bigger τ indicates that the firebrand takes longer to adapt to the velocity changes that can exist in very turbulent wind flows. Indeed, due to the relatively large dimensions of the firebrands considered in this study, their response times are on the order of 1000 s and as a result, their inertial effects cannot be neglected.
The downscaling of turbulence into wind gusts modifies firebrand trajectories without making them a simple passive tracer, particularly within the plume where turbulence has a major influence in the firebrand trajectory (Thomas et al. 2020).
Since the reduced model does not provide information on firebrand size reduction, trajectories are calculated until firebrands either land on the ground or reach a maximum flight time. This maximum flight time is defined using data from experimental studies that provide a maximum burning time, such as Ellis (2013) and Hall et al. (2015). A maximum flight time of 1,305 s was selected based on the data for Eucalyptus viminalis, as reported by Hall et al. (2015). This parameter can be adjusted for different vegetation types. For instance, Ellis (2013) reported a maximum burning (flight) time of 420 s for firebrands from Eucalyptus obliqua (Stringybark).
Numerical procedure
The standard Runge–Kutta explicit fourth order scheme is used to compute the trajectories of both models. Time step used for the reference model is 0.01 s (Oliveira et al. 2014; Thomas et al. 2020). A Euler first order scheme is used for calculating the mass loss evolution. The time step used for the reduced physics model is 1 s.
The firebrands initial position is randomly determined from three normal distributions centred on a mean (xm, ym, zm) position (xm = 4,400 m, ym = 7,200 m and zm = 100 m) within the plume and with a standard deviation (σx, σy, σz). The standard deviation is σx = σy = 50 and σz = 10. These values are similar to those in Oliveira et al. (2014) and Thurston et al. (2017). Thickness, radius and density are randomly obtained from a uniform distribution using the values in Table 1. Regarding the reference model, the firebrand trajectory is calculated until it reaches the ground or until its size decreases below a threshold (radius lower than 0.1 mm).
The rate of firebrands ejected for the reference transport model is 10 firebrands every 10 s, and for the reduced model 50 firebrands every 10 s. Injection duration is 600 s, resulting in 60,000 firebrands for the reference model (using 100 processors) and 90,000 for the reduced model (using 30 processors). Landing densities are normalised relative to the number of firebrands generated, focusing on the estimation of potential ignition locations.
Simulating the fire and the atmosphere
To evaluate the firebrand transport models and their ability to estimate firebrand landing zones, three topographies were used: a flat terrain, a hill and a canyon (Linn et al. 2007; Filippi et al. 2011). Building on Linn et al. (2007) and Hilton et al. (2019), we examined how wind, fire plumes and topography influence firebrand landing patterns. Using three topographies, we expect distinct wind flows (varying in intensity and plume shape). Comparing two models across these landscapes will assess the reduced model’s ability to be used in different wind flow conditions.
Wildfire propagation is not resolved but imposed with only heat and vapour fluxes integrated using the ForeFire (Filippi et al. 2009) code forcing the Meso-NH code (Lafore et al. 1998). The resulting flow fields from Meso-NH are used as an input in the firebrand transport calculation.
Topographies
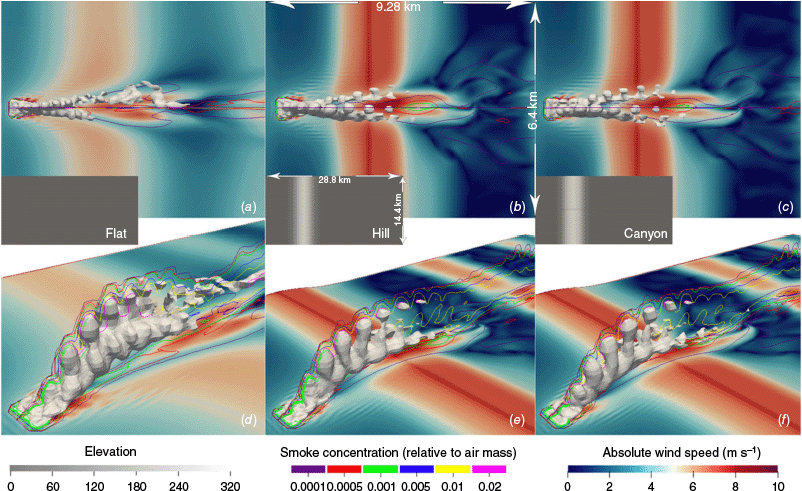
Topographies are idealised and smooth representations of a flat terrain, a hill and a canyon (incised hill). The numerical domain has a length of 28.8 km and a width of 14.4 km. The large size of the domain is justified by our purpose of simulating large-scale spotting and to minimise sensitivity to boundary conditions. Fig. 1 shows the volume-rendered plumes for all three terrains. The hill has a maximum height of 318 m located at 7,920 m from the origin of the domain. The canyons saddle point is located 7,920 m from the origin and at a height of 283 m, it has a width of 800 m. These topographies were chosen based on the configurations presented by Linn et al. (2007) and Hilton et al. (2019). In particular, we used a base function to construct the canyon and the hill. The base terrain is given by base(X, Y) = 240 arctan(X), the hill is given by , and the canyon is given by . The values were selected to produce different plume shapes and wind flows for model comparison across different landscapes.
Volume rendered passive smoke tracer in grey colour. a–c are top views of the plume and wind magnitude at the ground level for the flat, hill and canyon terrains, respectively; d–f are isometric views of the plume and wind magnitude at the ground level for the flat, hill and canyon terrains, respectively. The elevation (in m) can be seen in grey colours (grey rectangles). Dimensions of the numerical domain are given for the hill and are the same for all three terrains.
Meso-NH atmospheric model
Meso-NH is an anelastic non-hydrostatic meso-scale model (Lafore et al. 1998) used in a wide variety of spatial scales describing meteorological phenomena ranging from a characteristic length of 10–1000 m. Here, Meso-NH is run in a Large Eddy Simulation configuration due to the characteristic length of the plume structures coming from the fire. Meso-NH is used in its version 5.6.0.
While Meso-NH can perform at much higher resolution (Costes et al. 2022), here, the numerical setup has been chosen given potential operational constraints, using the highest possible resolution providing faster than real-time forecast (Filippi et al. 2018). Horizontally, the domain uses a Cartesian grid with a size of 80 m in accordance with previous studies analysing firebrand trajectories (Thurston et al. 2017; Thomas et al. 2020). A previous study (Baggio et al. 2022) demonstrated that 80 m grid cell is a reasonable compromise between calculation time and the resolution of wind flow features. Vertically, the first grid cell near the ground has a height of 30 m, while the topmost grid cell reaches 600 m, with cell heights increasing linearly throughout the domain. Details regarding the simulation configuration can be found in Table 2.
| Simulation parameter | Value | |
|---|---|---|
| Number of grid points | 360 × 180 × 50 | |
| Time step | 0.5 s | |
| Boundary conditions | Open for all four lateral surfaces. | |
| Turbulence configuration | 3D where the turbulent mixing length is equal to the cubic root of the grid volume. Turbulence parametrisation comes from Cuxart et al. (2000) | |
| Temperature profile | Initialisation from a radio sounding with T = 301.5°C at 50 m and T= 302.5°C at 250 m. | |
| Wind profile | Initialisation from a radio sounding with u = 10.0 m s−1 at 100 m and u = 10.1 m s−1 at 150 m. | |
| Idealised profile with z0 = 10−7 |
ForeFire fire propagation simulator
The ForeFire propagation model (Filippi et al. 2014) is based on a discrete event simulation formalism using a Lagrangian front-tracking method that describes the fire front as a set of markers virtually linked to each other. For this study, ForeFire only forces the atmosphere: it provides heat fluxes to Meso-NH. In doing so, we focus on the effects of wind on the firebrands while still having a dynamic description of the fire propagation and its plume. The heat flux is set to 80 kW m−2.
The fire propagation is analytically approximated by a 2D matrix with an elliptical fire front propagation. The equation giving the time at which the fire front will arrive at the cell (x, y) is given by Eqn 16:
where tend is the time at which the fire arrives to the last cell, tstart is the time at which the fire begins, xend is the last x-coordinate the fire will burn and xstart is where the fire will be ignited, yupper is the upper y-coordinate the fire will burn and ylower the lower coordinate the fire will burn, ymiddle is located in the middle between yupper and ylower. This approximation represents well the usual local elliptical propagation of a fire front. The total fire length is 0.96 km (xend − xstart) and the total fire width is 0.84 km (yupper − ylower). To let the turbulence develop in the domain, the simulation is run for 15,000 s. Fire ignition starts at 15,000 s with respect to the beginning of the atmospheric simulation. Firebrands are injected at 18,000 s.
Evaluation
Both models calculate individual firebrand trajectories. Landing positions are then aggregated to compute densities incorporating topographic information. Defining the complex model as the reference model, a comparison between the reduced and the reference model is done to assess their differences and common points.
A first level of evaluation of the reduced model is done by comparing large-scale metrics. To do so, maximum travelled distance and maximum lateral spread were analysed and a qualitative comparison of the shape of the ground landing distributions was performed. This approach allows for an initial assessment of the reduced models accuracy in capturing essential features of the reference model.
The second level of evaluation considers the landing of firebrands as a dichotomous event: ‘yes, a firebrand/s will land in a cell’ or ‘no, a firebrand/s will not land in a cell’. Two measures are important in our case: the probability of detection and the false alarm ratio. The probability of detection, Eqn 17, gives the fraction of the observed ‘yes’ (there was an impact) events that were correctly predicted. A ‘hit’ corresponds to both models predicting that a firebrand will land in the same cell and a ‘miss’ corresponds to a positive prediction by the reference model and a negative prediction by the reduced model. The false alarm ratio, Eqn 18, gives the fraction of the predicted ‘yes’ events that did not occur in the reference model. Here, the ‘false alarms’ value corresponds to a negative prediction by the reference model and a positive prediction by the reduced model. Both the false alarm ratio and the probability of detection provide insights into the accuracy of the reduced model when compared to the reference model. However, these measures do not provide information on the spatial performance of the models.
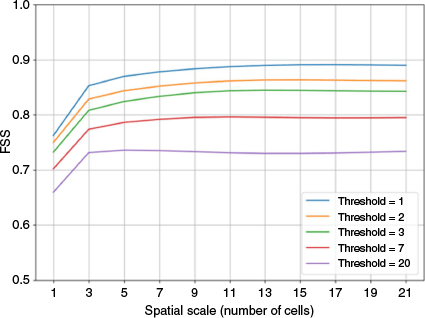
Final evaluation is based on the fraction skill score (FSS) presented in Roberts and Lean (2008). The FSS was originally developed to determine the spatial scales at which rain forecast was similar to real rain data. In our case, it is used to determine the spatial scales at which the ground landing densities obtained with the reduced model will be similar to those obtained with the reference model. FSS values above 0.5 suggest that the model is useful at a given spatial scale and threshold, with 1 representing perfect correspondence.
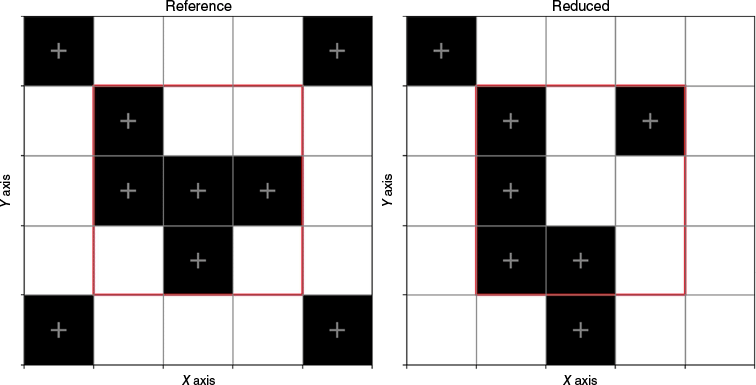
To explain the FSS, we refer to the example presented in Fig. 2, where the reference and reduced binary fields are presented. In the central cell, the reduced model (central cell equal to 0) fails to reproduce the firebrand impacts when compared to the reference model (central cell equal to 1). However, when examining the 3 by 3 neighbourhood area around the central cell, both models have four black cells out of nine (a fraction of 4/9), meaning that the reduced model captures the same number of firebrand impacts over the same area as the reference model. Specifically, to calculate it, a firebrand threshold per cell (named q) is defined (in our case, q = (1, 2, 3, 4, 5, 7, 10, 20)). The landing distributions for both models are then converted into binary fields for each threshold (0 for no impacts, 1 for q impacts). After that, a set of cells (s), representing a set of spatial scales, is defined (s = (1, 3, 5, 7, 11, 13, 15, 17, 19, 21)). For each grid point, the fraction of surrounding points within a given square of length N that have a value of 1 is computed. Doing this for all cell scales and all spatial scales allows to calculate the mean squared error and then calculate the FSS as presented in Roberts and Lean (2008).
Visual representation of the fractions for the reference and reduced binary landing density fields. Cells represent the large eddy simulations mesh. Black cells contain at least one firebrand impact: on the left for the reference model and on the right for the reduced model. White cells do not contain any firebrand impact. The red square highlights the 3 × 3 neighbourhood area.
Results
This section presents only the results of the coupled fire–atmosphere simulations and the firebrand landing distributions for the flat topography. Results for the hill and canyon terrains are included in the Appendix. Results regarding the weather conditions of the simulated atmosphere can be found in the subsection Atmospheric conditions of the Appendix.
Wind flow and plume morphology
The presence of a heat source on the ground creates an ascending flow that interacts with the incoming horizontal wind and the local topography of the ground. Vertical updrafts do not seem to have a large longitudinal coherence and show an instability of around 50 s for the largest eddies. Updrafts and downdrafts alternate along the plume. Maximum updraft values are 31.0 m s−1 and maximum downdraft is 11.1 m s−1. Fig. 3 shows the instantaneous vertical wind 50 min after the beginning of the fire propagation. The individual updraft cores can be seen in red. They have large vertical wind values compared to the outer and non-disturbed wind flow. Firebrands injected within these updraft cores could be transported further as shown by Thurston et al. (2017).
Side view of the instantaneous vertical velocity (solid filled colours, m s−1) for the large eddy simulations at 50 min after the beginning of the fire propagation for the flat terrain. Turbulent kinetic energy (TKE) contours are overlaid on the vertical cross section. Grey horizontal lines correspond to the slice of Fig. 4a (at 500 m) and Fig. 4b (at 900 m), vertical line corresponds to the slice of Fig. 5.

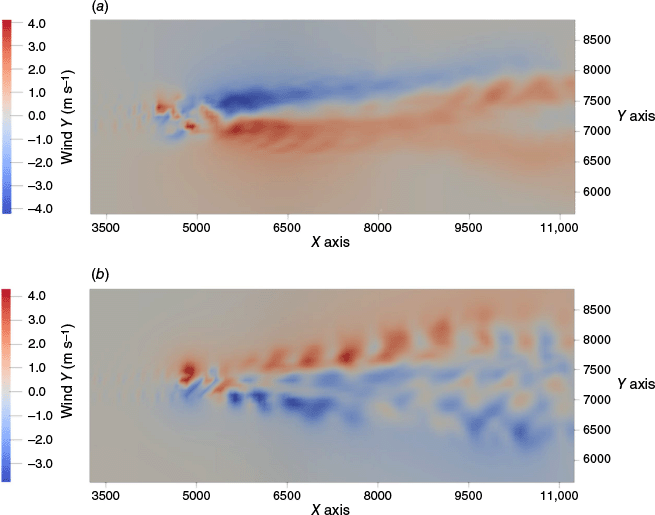
Lateral wind is presented at two different pressure levels (Fig. 4) chosen as they illustrate the counter rotating vortex pattern as identified in simulations by Cunningham et al. (2005), Thurston et al. (2017) and Thomas et al. (2020), as well as in recent radar data observations presented by Lareau et al. (2022). This plume behaviour appears similar to the one observed during the Loyalton Fire (California, United States, August 2020), analysed by Lareau et al. (2022), where vortices are detached from the main updraft and are drifted away with the prevailing wind. Maximum wind value along the Y direction is ±5.6 m s−1. At pressure level 7 (approximately 500 m above the ground), wind along the Y direction reaches values of 3.9 m s−1 from the left flank of the plume and −5.5 m s−1 from the right flank. At pressure level 9 (approximately 900 m above the ground), wind along the Y direction reaches values of 5.7 m s−1 from the left flank of the plume and −4.3 m s−1 from the right flank.
Top view of the instantaneous lateral velocity (solid filled colours, m s−1) for the large eddy simulations at 50 min after the beginning of the fire propagation at (a) 500 m (level 7) above the ground level and (b) 900 m (level 13) above the ground level, for the flat topography.
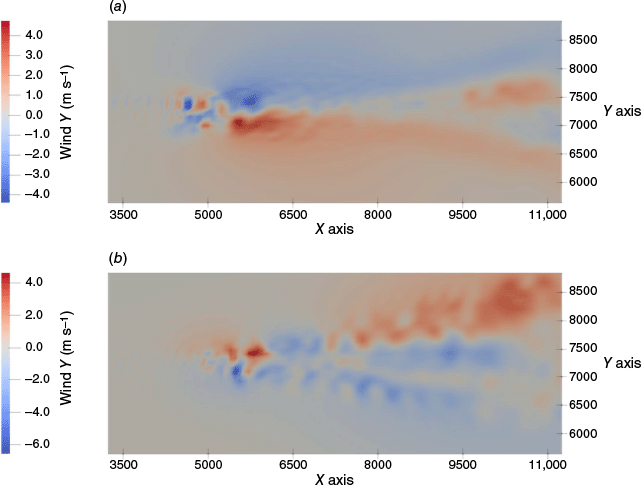
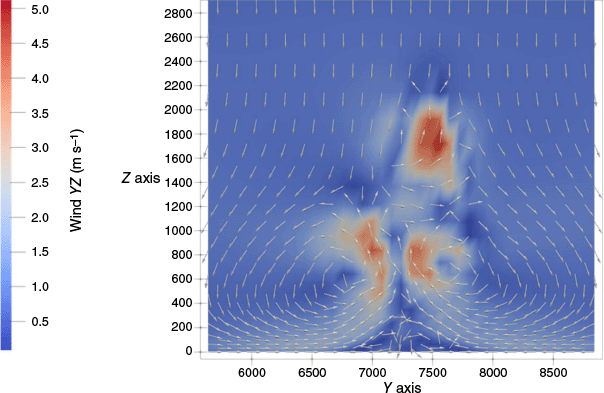
Fig. 5 shows the composite wind YZ in the Y–Z plane: the two counter-rotating vortices can be seen at the base of the plume and an updraft puff arrives at the upper part of the plume, locally increasing the vertical updrafts. This is a complex pattern interaction, where the vertical flow from the two counter rotating vortices interacts with the incoming and higher updraft (at an altitude of 2000 m, in Fig. 5). The counter rotating vortex pair leads to a plume bifurcation. In this bifurcation, an oscillating behaviour is identified where each branch of the pair dominates over the other in agreement with Cunningham et al. (2005).
The view of the instantaneous composite YZ velocity (solid filled colours, m s−1) for the large eddy simulations at 56 min after the beginning of the fire propagation at 7200 m longitudinally from the beginning of the domain, for the flat terrain. Arrows show the direction of the YZ wind. Arrows are normalised.
As it can be seen in Fig. 3, the plume is bent over and shows a turbulent behaviour during its initial path. The lower part of the plume is rather smooth. The upper part of the plume seems more turbulent as the contours show. This behaviour seems in agreement with Thurston et al. 2017. During its path, the lower part of the plume goes up to around 500 m at 7500 m from the origin of the numerical domain (3000 m from the fire) and then smoothly decreases. The upper part of the plume reaches an altitude of 2400 m.
Firebrand transport
The presented densities are all integrated over an 80 by 80 m2 cell to match the horizontal resolution of the atmospheric model, for all topographies. Densities have been normalised by the total number of simulated firebrands, as more firebrands were simulated for the reduced model. Results are presented for the flat case, the hill and canyon terrain results are included in Appendix section Firebrand landing distributions, hill terrain case and Firebrand landing distributions, canyon terrain case. An animation of the firebrand trajectories is included as Supplementary Material. It illustrates the dynamic effects of the wind flow and how firebrands are caught in the updrafts.
Firebrand landing distribution is shown in Fig. 6. The distribution of landed firebrands is initially concentrated near the injection point, around the point of coordinates (5.0; 7.3) km. From 5.0 to 7.5 km, the distribution of firebrands follows a narrow column of constant width. After this, firebrands land within a cone that expands laterally in the streamwise direction. This symmetrical pattern is observed in both the reference and the reduced model. The maximum longitudinal travel distance is 14.6 km for the reference and reduced models. The longitudinal distribution shown in the upper histogram of Fig. 6, is similar for both models: most of the firebrand land near their injection point and the distribution slowly decreases as the distance to the fire increases, it then increases again reaching a local maximum and decreases again. This seems to follow a bimodal distribution.
Landing densities of the reference (orange contours) and reduced (black lines) model for values 0, 1, 5, 100 and histogram of longitudinal (top) and axial (right) landing densities, for the flat topography.
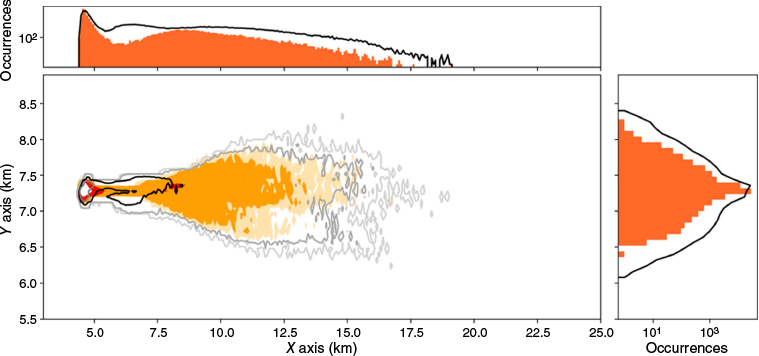
The lateral spread is equal to 1.8 and 2.3 km for the reference and reduced models, respectively. It is modestly higher for the reduced model (relative difference of 22%). The lateral distribution shape is similar for both models. Most of the firebrand land near the injection point. Longitudinally, the lateral distribution is narrow from 5 to 7.5 km. After 7.5 km, the lateral distribution spreads continuously as the plume develops streamwise.
The probability of detection is equal to 0.97 and the probability of a false alarm is 0.46. Fig. 7 presents the results of the FSS score. Best results are obtained for a group of cells larger than nine (that is three adjacent neighbours). Regarding the impact threshold, the score gives good values (closer to one) up to seven firebrands per cell. After this threshold, the score is lower than 80%.
Discussion
Terrain configurations
Three idealised topographies were used to simulate three plumes of increasing complexity. The coupled fire–atmosphere model effectively captures the interactions between the fire, atmosphere and local terrain, providing results consistent with previous studies (Cunningham et al. 2005; Thurston et al. 2017; Thomas et al. 2020).
Figs 6 and A7a, b show that the distribution of firebrand landings depends on the plume morphology. In the flat terrain case, the landing distribution aligns with the shapes described in Thurston et al. (2017). In contrast, the hill and canyon cases show more complex landing patterns. The canyon case shows an asymmetric distribution, likely due to dynamic effects. Indeed, as explained in the section Wind flow and plume morphology, there is an oscillation between the dominant branch of the bifurcating plume. Firebrands caught in the dominant branch are transported further away and in the direction of the dominant branch at that time. This leads to an asymmetric distribution. This highlights the importance of having dynamic wind flows to describe the firebrand trajectories.
Firebrand ground landing distributions
Differences in the maximum travelled distance across the different terrains are likely due to differences in the wind flow, particularly within the plume. The hill and canyon terrains show stronger updraft and lateral winds, which increase the total travelled distance of firebrands. Additionally, these terrains generate turbulence that further contributes to the lateral dispersion of firebrands.
The ground landing distribution can be separated into three main sections: near the injection point, at medium range and long-range. Near the injection point region, firebrands are not lifted by the plume and travel short distances (up to 0.5 km). In the medium range region, firebrands rise for short periods of time and travel between 0.5 and 2.5 km. Their pattern deposition follows the shape of the plume, forming a narrow column with the same width as the plume. In the long-range region, firebrands are laterally dispersed as the plume separates into a large cone. Since firebrand landing densities may be linked to the concentration of pyrometeors in the lower atmosphere, this pattern shows similarities with radar reflectivity measurements of the Loyalton wildfire (39.681°, −120.171°) presented in fig. 5 from Lareau et al. (2022). Their observations indicate that the pyrometeor density extends along the plume, aligned with the main wind. Initially concentrated near the fires active region (the firebrand injection area), the distribution narrows to a minimum width of about 6 km downwind before broadening again, exceeding the smoke signal width at approximately 12 km. The narrower minimum length observed here (2.5 km vs 6 km in Lareau et al. (2022)), may be due to differences in heat intensity and atmospheric properties. Additionally, the Loyalton wildfire plume reached heights between 2000 m and nearly 9000 m (fig. 5c from Lareau et al. 2022), which is significantly higher than those simulated in this study.
The ground landing distribution along the main wind direction (upper histogram in Fig. 6) shows a bimodal distribution: the first mode is concentrated near the injection point, while the second mode is concentrated around 8.5 km from the beginning of the domain (travelled distance of approximately 4 km). While the travelled distances are dependent on the simulation (fire intensity, atmosphere properties and wind profile), the bimodal shape seems in agreement with line scan observations of real fires from Storey et al. (2020a) and other firebrand modelling studies (Sardoy et al. 2008).
The reduced model captures well the interaction between the terrain and the wind flow. The ground landing densities, and so the areas prone to firebrand deposition, are correctly described by the reduced model.
Scores
The probability of detection is nearly one across all three topographies, indicating that if the reference model predicts a firebrand impact in a specific cell, the reduced model will also predict an impact in the same cell. However, the probability of a false alarm is moderately high, meaning the reduced model predicts firebrand impacts in cells where the reference model does not.
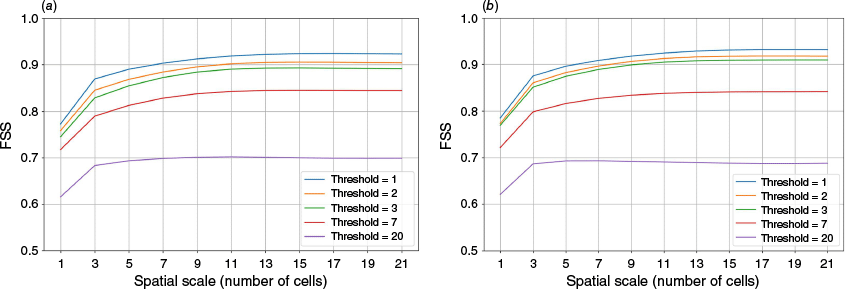
To define how well the reduced model performs spatially, the FSS was used. Across all topographies, the reduced model performs well at spatial scales of at least three neighbour cells. In the current grid this represents a square of 240 m by 240 m. Considering that the numerical domain is 30 km long, the performance of the reduced model at 0.2 km can be considered satisfactory. Regarding the firebrand impact thresholds, the FSS decreases as the threshold increases indicating a reduced accuracy in areas with a higher number of impacts per cell. Specifically, regions with a large number of impacts are located closer to the fire origin, where discrepancies in terms of landed firebrands are noted in both the hill and canyon cases. For example, in the canyon case, 71% of the firebrands simulated with the reference model land within the first 2.5 km and only 50% of those simulated with the reduced model land within this range. This difference contributes to the overall decrease of the FSS at higher thresholds. However, the primary objective of our study is to identify landing impacts at long distances where the effective number of impacts becomes scarce. In these regions, the reduced model seems to reproduce the distributions at lower thresholds, reproducing landing patterns far away from the main fire front.
Numerical performance
The reduced model uses a 1-s timestep which is 100 times greater than the reference model, affecting the computational time. For a reference case of 20 processors, calculating 60 individual firebrand trajectories, the reference model required on average 52 min (standard deviation of 16 min), while the reduced model completed the same task in 7 min (standard deviation of 1 min). The algorithms could be optimised and parallelised, but in their current state, notable time improvements are evident.
Atmospheric simulations using Meso-NH coupled with ForeFire require approximately 30 min to perform a 1-h forecast on a 40,000-ha domain, using 150 processors in parallel (Filippi et al. 2018). Similarly, the firebrand calculations using the reduced model presented here also require approximately 30 min. By treating each firebrand as independent, these simulations can be parallelised. This means firebrands can be simulated simultaneously to the atmospheric simulation, without adding additional time. With the ability to apply more processors and optimise the software further, it is possible to achieve reasonable computation times for both spotting and coupled fire–atmosphere simulations, even in large-scale and dynamic scenarios.
The numerical integration of the reduced model still presents challenges as the firebrands injection and ignition of fuel bed have not been fully described. Firebrand flux should be linked to vegetation variables (species, fuel bulk density and moisture content), atmospheric variables (wind and turbulence) and fire variables (rate of spread and fire intensity). Additionally, enough firebrands must be injected to realistically represent all possibilities and accurately predict the maximum travelled distance. Experimental studies like those by Thomas et al. (2017b), Filkov and Prohanov (2020) and Zen et al. (2021) provide estimates for the firebrand flux, but more extensive and larger experiments are required to fully characterise this phenomenon. Similarly, the ignition of the fuel bed remains a challenging task, requiring a detailed description of the fuel bed as highlighted by Ganteaume et al. (2011) and Ellis (2015).
Assumptions and limitations
The model uses a constant terminal velocity (Eqn 11) determined by a fixed parameter. This simplifies the landing dynamics and does not account for complex mass-loss dynamics resulting from combustion. This simplification may lead to inaccuracies in the landing speed of the smaller firebrands and contribute to the slightly greater lateral spread observed.
The simplified treatment of turbulence may not fully capture the complex interactions between firebrands and turbulent eddies, possibly resulting in discrepancies in lateral dispersion, as the spatial and temporal correlations of turbulent structures are not explicitly modelled. Nevertheless, with an 80 m grid, TKE is the only parameter freely available for accounting for sub-grid turbulence in coupled fire–atmosphere models. Although TKE is a three-dimensional variable, it is treated as isotropic in Meso-NH, making approaches that involve turbulent structures and preferential directions likely unfeasible. In the reduced model, turbulence impacts only the horizontal components of the firebrand velocity while vertical velocity depends on the vertical wind flow velocity and the terminal velocity. This modelling approach is similar to Lin et al. (2003), where turbulence motions are primarily applied in the vertical direction. Here, it is assumed that turbulence primarily affects the horizontal direction, scattering firebrands laterally.
Another limitation of the model is its simplified representation of firebrand shapes and the lack of rotation effect. The reference model formulation presented here is close to the formulation presented by Frediani et al. (2022, 2024) that has been used to parametrise spotting in the WRF-Fire framework. The combustion model used in our study is from Oliveira et al. (2014), which is derived from Tse and Fernandez-Pello (1998) and used by Frediani et al. (2022, 2024). Their parametrisation considers only spherical firebrands, whereas our model uses discs, which may introduce errors in simulations, even though Cervantes (2023) showed that in large wildfire scenarios, the travelled distances of rods and plates are comparable. Additionally, firebrand rotation is neglected to simplify trajectory equations and reduce computational complexity. Previous studies (Ellis 2010; Oliveira et al. 2014; Tohidi and Kaye 2017) have shown that rotation can influence terminal velocity and travelled distance, particularly at short ranges. However, its impact over longer distances remains uncertain. Future model developments could incorporate different firebrand shapes and rotational effects to improve the accuracy of firebrand transport predictions.
Despite these simplifications, the reduced model effectively replicated key metrics such as maximum longitudinal travel distance and general landing distribution patterns (Figs 6 and A7a, b and Appendix section Coupled fire–atmosphere simulations). The overestimations in lateral spread and higher false alarm ratios could be considered as acceptable trade-offs given the reduction in computational time.
Conclusion
We used a two-step modelling approach to develop a reduced physics model able to predict long-distance spotting areas. The reduced model assumes that the firebrand velocities that depend on the non-resolved TKE are coming from the LES simulation and the firebrand characteristics. By doing so, the parametrisation avoids assumptions about plume morphology and instead relies on the firebrand and vegetation characteristics, and wind flow conditions to identify potential spotting areas. Building on recent studies investigating firebrand trajectories and LES simulations, this model incorporates insights from previous work (Thurston et al. 2017; Thomas et al. 2020), showing the important role of turbulence and the terminal velocity assumption on the final ground landing densities. More recently, Kepert et al. (2024) parametrised a model using Lagrangian particles within a high-resolution LES simulation, enabling rapid execution to obtain longitudinal and lateral distributions of firebrands. Although not as fast as the parameterised model proposed by Kepert et al. (2024), the reduced model presented here has the potential to be integrated into a coupled fire–atmosphere model to account for coherent structures, already available in these models.
The results suggest that the proposed reduced model can identify similar areas of firebrand landing density and distribution when compared to the reference model for both simple and complex topography. The reduced model has proved to provide firebrand landing predictions comparable with a more reference model at scales of 200–400 m. Considering that the maximum reported spotting distance is 30 km (Cruz et al. 2012), the spatial scales at which the reduced model matches the reference model, provide useful information to identify areas prone to spotting and an estimation of maximum spotting distance.
The reduced model proposed in this study uses a timestep comparable to the one used in the coupled fire–atmosphere model, enabling its integration into this type of framework. Future steps should focus on applying the reduced model to simulate real wildfire cases involving long-distance spotting. Additionally, radio detection and ranging (Radar) or light detection and ranging (Lidar) data could be used to compare inferred pyrometeor densities with the models predictions, enhancing its validation.
Data availability
The data that support this study will be shared upon reasonable request to the corresponding author.
Declaration of funding
Alberto Alonso Pinar and Ha-Ninh Nguyen were funded by the Graduate Research Projects Scheme between the Centre National de la Recherche Scientifique and The University of Melbourne, ‘Multiscale experimentation and simulation of wildfire SPOTting’. Alex Filkov was funded by the ARC Discovery Project ‘Understanding the Origin and Development of Extreme and Mega Bushfires: Merging Fire Fronts’. Jean Baptiste Filippi was supported by EU H2020 101037419 Fire-Res program.
Acknowledgements
This research was supported by The University of Melbourne’s Research Computing Services and the Petascale Campus Initiative. This research was also supported by the computational resources of the Université de Corse. The authors would like to thank the anonymous reviewers for their valuable and interesting comments.
References
Albini FA, Alexander ME, Cruz MG (2012) A mathematical model for predicting the maximum potential spotting distance from a crown fire. International Journal of Wildland Fire 21(5), 609-627.
| Crossref | Google Scholar |
Alonso-Pinar A, Filippi J-B, Filkov A (2025) Modelling aerodynamics and combustion of firebrands in long-range spotting. Fire Safety Journal 152, 104348.
| Crossref | Google Scholar |
Anthenien RA, Tse SD, Carlos Fernandez-Pello A (2006) On the trajectories of embers initially elevated or lofted by small scale ground fire plumes in high winds. Fire Safety Journal 41, 349-363.
| Crossref | Google Scholar |
Baggio R, Filippi JB, Truchot B, Couto FT (2022) Local to continental scale coupled fire-atmosphere simulation of large industrial fire plume. Fire Safety Journal 134, 103699.
| Crossref | Google Scholar |
Bhutia S, Jenkins MA, Sun R (2010) Comparison of firebrand propagation prediction by a plume model and a coupled–fire/atmosphere large–eddy simulator. Journal of Advances in Modeling Earth Systems 2, 4.
| Crossref | Google Scholar |
Cervantes AQ (2023) Numerical Modeling of Firebrand Transport. Master’s Thesis, 5394, San José State University, San José, CA, USA 10.31979/etd.ddm6-vzya
Costes A, Rodier Q, Masson V, Lac C, Rochoux MC (2022) Effects of High‐Density Gradients on Wildland Fire Behavior in Coupled Atmosphere‐Fire Simulations. Journal of Advances in Modeling Earth Systems 14, e2021MS002955.
| Crossref | Google Scholar |
Couto FT, Filippi J-B, Baggio R, Campos C, Salgado R (2024) Numerical investigation of the Pedrógão Grande pyrocumulonimbus using a fire to atmosphere coupled model. Atmospheric Research 299, 107223.
| Crossref | Google Scholar |
Cruz MG, Sullivan AL, Gould JS, Sims NC, Bannister AJ, Hollis JJ, Hurley RJ (2012) Anatomy of a catastrophic wildfire: the Black Saturday Kilmore East fire in Victoria, Australia. Forest Ecology and Management 284, 269-285.
| Crossref | Google Scholar |
Cunningham P, Goodrick SL, Hussaini MY, Linn RR (2005) Coherent vortical structures in numerical simulations of buoyant plumes from wildland fires. International Journal of Wildland Fire 14, 61-75.
| Crossref | Google Scholar |
Cuxart J, Bougeault P, Redelsperger J‐L (2000) A turbulence scheme allowing for mesoscale and large‐eddy simulations. Quarterly Journal of the Royal Meteorological Society 126(562), 1-30.
| Crossref | Google Scholar |
Ellis PF (2000) The aerodynamic and combustion characteristics of eucalypt bark: a firebrand study. 10.25911/5D7A2814C478D
Ellis PFM (2010) The effect of the aerodynamic behaviour of flakes of jarrah and karri bark on their potential as firebrands. Journal of the Royal Society of Western Australia 93, 21-27.
| Google Scholar |
Ellis PFM (2013) Firebrand characteristics of the stringy bark of messmate (Eucalyptus obliqua) investigated using non-tethered samples. International Journal of Wildland Fire 22, 642-651.
| Crossref | Google Scholar |
Ellis PFM (2015) The likelihood of ignition of dry-eucalypt forest litter by firebrands. International Journal of Wildland Fire 24(2), 225.
| Crossref | Google Scholar |
Filippi J-B, Morandini F, Balbi JH, Hill DRC (2009) Discrete Event Front-tracking Simulation of a Physical Fire-spread Model. SIMULATION 86(10), 629-646.
| Crossref | Google Scholar |
Filippi J-B, Bosseur F, Pialat X, Santoni P-A, Strada S, Mari C (2011) Simulation of Coupled Fire/Atmosphere Interaction with the MesoNH-ForeFire Models. Journal of Combustion 2011, e540390.
| Crossref | Google Scholar |
Filippi J-B, Pialat X, Clements CB (2013) Assessment of ForeFire/Meso-NH for wildland fire/atmosphere coupled simulation of the FireFlux experiment. Proceedings of the Combustion Institute 34, 2633-2640.
| Crossref | Google Scholar |
Filippi J-B, Mallet V, Nader B (2014) Representation and evaluation of wildfire propagation simulations. International Journal of Wildland Fire 23, 46-57.
| Crossref | Google Scholar |
Filippi J-B, Bosseur F, Mari C, Lac C (2018) Simulation of a Large Wildfire in a Coupled Fire-Atmosphere Model. Atmosphere 9, 218.
| Crossref | Google Scholar |
Filkov AI, Tihay-Felicelli V, Masoudvaziri N, Rush D, Valencia A, Wang Y, Blunck DL, Valero MM, Kempna K, Smolka J, De Beer J, Campbell-Lochrie Z, Centeno FR, Ibrahim MA, Lemmertz CK, Tam WC (2023) A review of thermal exposure and fire spread mechanisms in large outdoor fires and the built environment. Fire Safety Journal 140, 103871.
| Crossref | Google Scholar |
Frediani M, Juliano TW, DeCastro A, Kosovic B, Knievel J (2022) A fire-spotting parameterization coupled with the WRF-fire model. Authorea Preprints. 10.1002/essoar.10506771.1
Frediani M, Shamsaei K, Juliano TW, Kosovic B, Knievel J, Tessendorf SA, Ebrahimian H (2024) Modeling firebrand spotting in WRF-fire for coupled fire-weather prediction. 10.22541/au.171045307.73503530/v2
Ganteaume A, Guijarro M, Jappiot M, Hernando C, Lampin-Maillet C, Pérez-Gorostiaga P, Vega JA (2011) Laboratory characterization of firebrands involved in spot fires. Annals of Forest Science 68, 531-541.
| Crossref | Google Scholar |
Gouesbet G, Berlemont A (1999) Eulerian and Lagrangian approaches for predicting the behaviour of discrete particles in turbulent flows. Progress in Energy and Combustion Science 25, 133-159.
| Crossref | Google Scholar |
Graham DI, James PW (1996) Turbulent dispersion of particles using eddy interaction models. International Journal of Multiphase Flow 22, 157-175.
| Crossref | Google Scholar |
Haider A, Levenspiel O (1989) Drag coefficient and terminal velocity of spherical and nonspherical particles. Powder Technology 58, 63-70.
| Crossref | Google Scholar |
Hall J, Ellis PF, Cary GJ, Bishop G, Sullivan AL (2015) Long-distance spotting potential of bark strips of a ribbon gum (Eucalyptus viminalis). International Journal of Wildland Fire 24, 1109-1117.
| Crossref | Google Scholar |
Kepert JD, Thurston W, Tory KJ (2024) A fast, physically based model of firebrand transport by bushfire plumes. Agricultural and Forest Meteorology 345, 109839.
| Crossref | Google Scholar |
Knight IK (2001) The design and construction of a vertical wind tunnel for the study of untethered firebrands in flight. Fire Technology 37, 87-100.
| Crossref | Google Scholar |
Kochanski AK, Jenkins MA, Mandel J, Beezley JD, Krueger SK (2013) Real time simulation of 2007 Santa Ana fires. Forest Ecology and Management 294, 136-149.
| Crossref | Google Scholar |
Kochanski AK, Jenkins MA, Yedinak K, Mandel J, Beezley JD, Lamb B (2016) Toward an integrated system for fire, smoke, and air quality simulations. International Journal of Wildland Fire 25, 534-546.
| Crossref | Google Scholar |
Kochanski AK, Herron-Thorpe F, Mallia DV, Mandel J, Vaughan JK (2021) Integration of a Coupled Fire-Atmosphere Model Into a Regional Air Quality Forecasting System for Wildfire Events. Frontiers in Forests and Global Change 4, 728726.
| Crossref | Google Scholar |
Lafore JP, Stein J, Asencio N, Bougeault P, Ducrocq V, Duron J, Fischer C, Masson V, Pinty JP, Redelsperger JL, Richard E (1998) The Meso-NH Atmospheric Simulation System. Part I: Adiabatic formulation and control simulations. In ‘Annales geophysicae. Vol. 16, No. 1’. pp. 90–109. (Springer Verlag: Göttingen, Germany) 10.1007/s00585-997-0090-6
Lareau NP, Nauslar NJ, Bentley E, Roberts M, Emmerson S, Brong B, Mehle M, Wallman J (2022) Fire-Generated Tornadic Vortices. Bulletin of the American Meteorological Society 103(5), E1296-E1320.
| Crossref | Google Scholar |
Lin JC, Gerbig C, Wofsy SC, Andrews AE, Daube BC, Davis KJ, Grainger CA (2003) A near‐field tool for simulating the upstream influence of atmospheric observations: the Stochastic Time‐Inverted Lagrangian Transport (STILT) model. Journal of Geophysical Research 108, 4493.
| Crossref | Google Scholar |
Linn R, Winterkamp J, Edminster C, Colman JJ, Smith WS (2007) Coupled influences of topography and wind on wildland fire behaviour. International Journal of Wildland Fire 16, 183-195.
| Crossref | Google Scholar |
Masoudian S, Sharples J, Jovanoski Z, Towers I, Watt S (2023) Incorporating stochastic wind vectors in wildfire spread prediction. Atmosphere 14, 1609.
| Crossref | Google Scholar |
Oliveira LA, Lopes AG, Baliga BR, Almeida M, Viegas DX (2014) Numerical prediction of size, mass, temperature and trajectory of cylindrical wind-driven firebrands. International Journal of Wildland Fire 23, 698-708.
| Crossref | Google Scholar |
Peace M, Mattner T, Mills G, Kepert J, McCaw L (2016) Coupled Fire–Atmosphere Simulations of the Rocky River Fire Using WRF-SFIRE. Journal of Applied Meteorology and Climatology 55, 1151-1168.
| Crossref | Google Scholar |
Peace M, Greenslade J, Ye H, Kepert JD (2022) Simulations of the Waroona fire using the coupled atmosphere–fire model ACCESS-Fire. Journal of Southern Hemisphere Earth Systems Science 72, 126-138.
| Crossref | Google Scholar |
Peace M, Ye H, Greenslade J, Kepert JD (2023) The destructive Sir Ivan fire in New South Wales, Australia; Simulations using a coupled fire—atmosphere model. Fire 6, 438.
| Crossref | Google Scholar |
Prohanov S, Filkov A, Kasymov D, Agafontsev M, Reyno V (2020) Determination of firebrand characteristics using thermal videos. Fire 3(4), 68.
| Crossref | Google Scholar |
Roberts NM, Lean HW (2008) Scale-selective verification of rainfall accumulations from high-resolution forecasts of convective events. Monthly Weather Review 136, 78-97.
| Crossref | Google Scholar |
Ross ON, Sharples J (2004) Recipe for 1‐D Lagrangian particle tracking models in space‐varying diffusivity. Limnology & Ocean Methods 2, 289-302.
| Crossref | Google Scholar |
Sardoy N, Consalvi J, Porterie B, Fernandez-Pello A (2007) Modeling transport and combustion of firebrands from burning trees. Combustion and Flame 150, 151-169.
| Crossref | Google Scholar |
Sardoy N, Consalvi JL, Kaiss A, Fernandez-Pello AC, Porterie B (2008) Numerical study of ground-level distribution of firebrands generated by line fires. Combustion and Flame 154, 478-488.
| Crossref | Google Scholar |
Simpson CC, Sharples JJ, Evans JP, McCabe MF (2013) Large eddy simulation of atypical wildland fire spread on leeward slopes. International Journal of Wildland Fire 22, 599-614.
| Crossref | Google Scholar |
Simpson CC, Sharples JJ, Evans JP (2014) Resolving vorticity-driven lateral fire spread using the WRF-Fire coupled atmosphere–fire numerical model. Natural Hazards and Earth System Sciences 14, 2359-2371.
| Crossref | Google Scholar |
Storey MA, Price OF, Bradstock RA, Sharples JJ (2020a) Analysis of variation in distance, number, and distribution of spotting in southeast Australian wildfires. Fire 3, 10.
| Crossref | Google Scholar |
Storey MA, Price OF, Sharples JJ, Bradstock RA (2020b) Drivers of long-distance spotting during wildfires in south-eastern Australia. International Journal of Wildland Fire 29, 459-472.
| Crossref | Google Scholar |
Tarifa CS, Notario PP, del, Moreno FG (1965) On the flight paths and lifetimes of burning particles of wood. Symposium International on Combustion 10, 1021-1037.
| Crossref | Google Scholar |
Thomas CM, Sharples JJ, Evans JP (2017a) Modelling the dynamic behaviour of junction fires with a coupled atmosphere–fire model. International Journal of Wildland Fire 26, 331-344.
| Crossref | Google Scholar |
Thomas JC, Mueller EV, Santamaria S, Gallagher M, El Houssami M, Filkov A, Clark K, Skowronski N, Hadden RM, Mell W, Simeoni A (2017b) Investigation of firebrand generation from an experimental fire: development of a reliable data collection methodology. Fire Safety Journal 91, 864-871.
| Crossref | Google Scholar |
Thomas CM, Sharples JJ, Evans JP (2020) The terminal-velocity assumption in simulations of long-range ember transport. Mathematics and Computers in Simulation 175, 96-107.
| Crossref | Google Scholar |
Thurston W, Kepert JD, Tory KJ, Fawcett RJB (2017) The contribution of turbulent plume dynamics to long-range spotting. International Journal of Wildland Fire 26, 317-330.
| Crossref | Google Scholar |
Tohidi A, Kaye NB (2017) Stochastic modeling of firebrand shower scenarios. Fire Safety Journal 91, 91-102.
| Crossref | Google Scholar |
Tse SD, Fernandez-Pello AC (1998) On the flight paths of metal particles and embers generated by power lines in high winds—a potential source of wildland fires. Fire Safety Journal 30, 333-356.
| Crossref | Google Scholar |
Woycheese J, Pagni P (1999) Combustion models for wooden Brands. International Conference on Fire Research and Engineering (ICFRE3), Third (3rd). In ‘Proceedings. Society of Fire Protection Engineers (SFPE)’. (National Institute of Standards and Technology (NIST) and International Association of Fire Safety Science (IAFSS): Chicago, IL, USA)
Zen S, Thomas JC, Mueller EV, Dhurandher B, Gallagher M, Skowronski N, Hadden RM (2021) Development of a field deployable firebrand flux and condition measurement system. Fire Technology 57, 1401-1424.
| Crossref | Google Scholar |
Coupled fire–atmosphere simulations
As shown in Fig. 1, the plume in the hill and canyon terrains exhibits a less steep rise compared to the flat terrain, with the plume reaching its peak altitude later in its trajectory. Additionally, the plume’s overall coherence is lower in these terrains, as it bifurcates earlier along the longitudinal axis in the hill and canyon cases (Fig. 1a–c). Plumes from the hill and canyon present a similar structure but with two lateral branches that emerge from the bifurcation (Fig. 1d–f). Since the configuration is identical across all three topographies (including the initial wind field, injected heat flux and domain size), the differences in results come from the terrain variations. As shown in Fig. 3, the upper part of the plume starts to decrease around 8000 m from the origin of the domain. This behaviour is not observed in the hill and canyon terrains (see Figs A1 and A3), where the terrain elevation occurs at the same position, influencing the plume dynamics differently.
Hill
Fig. A1 shows the instantaneous vertical wind 50 min after the beginning of the fire propagation. The plume is bent over and shows a turbulent behaviour during its initial vertical path. Vertical updrafts do not seem to have a large longitudinal coherence and show an instability of around 50 s for the largest eddies. The lower part of the plume is rather smooth. The upper part of the plume seems more turbulent as the contours show. This behaviour is in agreement with Thurston et al. 2017. The lower part of the plume goes up to around 500 m at 7000 m from the origin of the numerical domain (3000 m from the fire) and then smoothly decreases. The upper part of the plume reaches an altitude of 2700 m above ground level. Maximum updraft is 31.0 m s−1 and minimum downdraft is 9.9 m s−1.
Fig. A2 shows the lateral velocity at two different altitudes. Maximum wind value along the Y direction is ±6.6 m s−1. The presence of two counter-rotating vortices seems in agreement with Cunningham et al. (2005), Thurston et al. (2017) and Thomas et al. (2020) and the field observations from Lareau et al. (2022). At pressure level 7 (approximately 500 m above the ground), wind along the Y direction reaches values of 4.4 m s−1 from the left flank of the plume and −4.9 m s−1 from the right flank. At pressure level 9 (approximately 900 m over the ground), wind along the Y direction reaches values of 5.8 m s−1 from the left flank of the plume and −3.0 m s−1 from the right flank.
Canyon
Fig. A3 shows the instantaneous vertical wind 50 min after the beginning of the fire propagation. Vertical air movements can be clearly identified with a maximum updraft value of 32.0 m s−1 and maximum downdraft of 10.0 m s−1. The plume behaviour is similar to the flat and hill case: it is bent over and shows a turbulent behaviour during its initial vertical path. The lower part of the plume goes up to around 500 m at 7000 m from the origin of the numerical domain (3000 m from the fire) and then smoothly decreases. The upper part of the plume reaches an altitude of 2700 m above ground level.
Side view of the instantaneous vertical velocity (solid filled colours, m s−1) for the large eddy simulations at 50 min after the beginning of the fire propagation for the canyon topography. Turbulent kinetic energy (TKE) contours are overlaid on the vertical cross section.

Lateral wind is presented at two different pressure levels (Fig. A4a, b) chosen as they illustrate the counter rotating vortex pattern. Maximum wind value along the Y direction is ±10.0 m s−1. At pressure level 7 (approximately 500 m above the ground), wind along the Y direction reaches values of 3.8 m s−1 from the left flank of the plume and −5.1 m s−1 from the right flank. At pressure level 9 (approximately 900 m over the ground), wind along the Y direction reaches values of 8.3 m s−1 from the left flank of the plume and −3.7 m s−1 from the right flank.
Top view of the instantaneous lateral velocity (solid filled colours, m s−1) for the large eddy simulations at 50 min after the beginning of the fire propagation at (a) 500 m (level 7) above the ground level and (b) 900 m (level 13) above the ground level for the canyon topography.
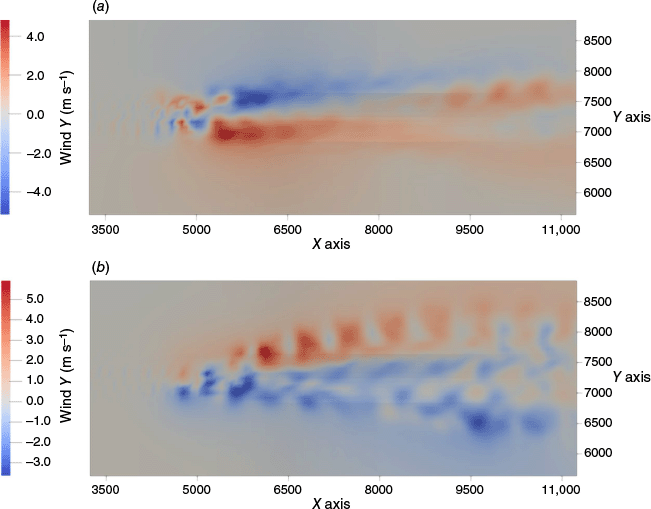
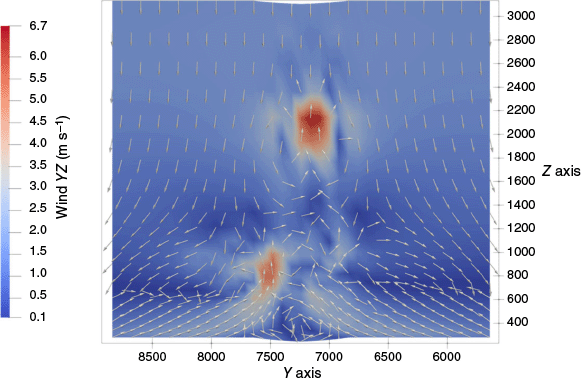
Fig. A5 shows the composite wind YZ in the Y–Z plane: the two counter-rotating vortices can be seen at the base of the plume and an updraft puff arrives at the upper part of the plume, locally increasing the vertical updrafts. This is the same complex pattern interaction as presented for the flat and hill terrains.
View of the instantaneous composite YZ velocity (solid filled colours, m s−1) for the large eddy simulations for the canyon topography at 56 min after the beginning of the fire propagation at 7200 m longitudinally from the beginning of the domain, for the canyon terrain. Arrows show the direction of the YZ wind. Arrows are normalised.
Atmospheric conditions
For all topographies, the initial wind profile is given by a virtual radio sounding specifying a logarithmic wind profile with a reference wind intensity of 10 m s−1 at an altitude of 100 m. As explained in the section ForeFire fire propagation simulator, the simulation is conducted for a duration of 15,000 s in order to let the turbulence develop and have a quasi-steady state atmosphere as in Thurston et al. (2017). The state of the atmosphere prior to the fire ignition is summarised in Fig. A6, showing the horizontally averaged potential temperature and wind intensity. The results are identical for all three topographies.
Domain averaged profiles of the mean conditions before the fire initialisation. (a) Potential temperature (K) and (b) streamwise wind intensity (m s−1).
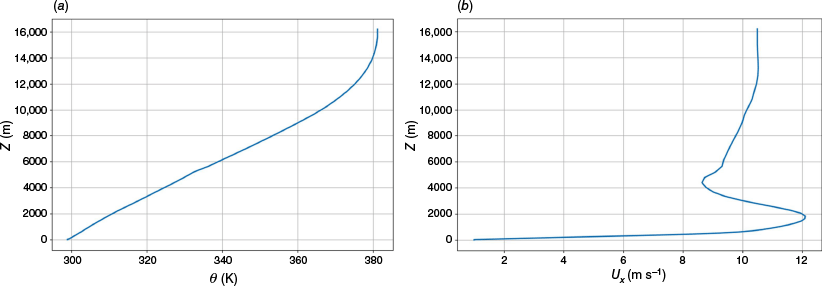
Fig. A6a shows the potential temperature profile for all three topographies, with respect to the altitude at 15,000 s, just before the fire ignition. The potential temperature increases with respect to the altitude showing a characteristic stable atmosphere profile. The gradient is constant and equal to 6.6 K km−1 up to 10 km. After 10 km, the slope is increased before reaching a constant value of 381°K at 15.5 km.
Fig. A6b shows the horizontally averaged streamwise wind profile, with respect to the altitude for all three topographies. The streamwise wind has the characteristic logarithmic profile until an altitude of 2 km reaching a maximum value of 12 m s−1 at this altitude. The wind intensity then decreases down to 8.6 m s −1 at an altitude of 4.2 km. From this point and until the top of the domain, the wind keeps increasing reaching a maximum value of 10.5 m s −1.
Firebrand landing distributions, hill terrain case
Firebrand landing distribution is shown in Fig. A7a. The spread of landed firebrands is in this case more complex compared to the flat terrain. From 7.5 to 10 km longitudinally, the distribution follows a cone that spreads laterally. At the 10 km point, the distribution is oriented towards the right, in the streamwise direction. This pattern is shown by both the reference and the reduced model. The maximum longitudinal travel distance is 17.9 and 16.1 km for the reference and reduced models, respectively. The maximum spotting distance is well reproduced by the reduced model. The longitudinal distribution is similar for both models: most of the firebrand land near their injection point and the distribution slowly decreases as distance increases. Indeed, 70% of the firebrands simulated with the reference model and 51% of the firebrands calculated with the reduced model land in the vicinity of the fire (up to km 7.5 longitudinally).
Landing densities of the reference (orange contours) and reduced (black lines) model for values 0, 1, 5, 100 and histogram of longitudinal (top) and axial (right) landing densities, for the hill topography (a) and canyon topography (b).
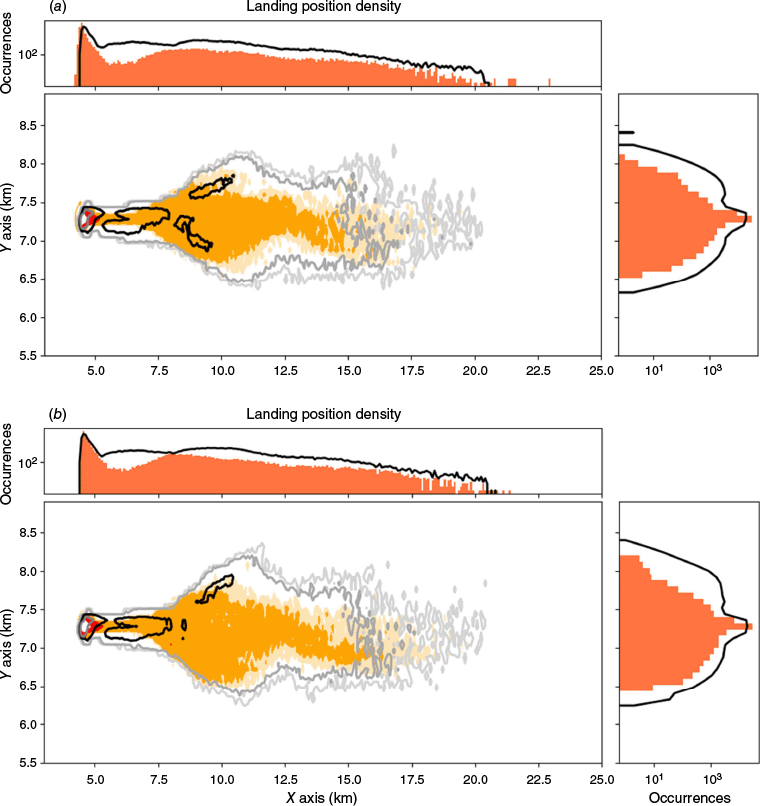
The lateral spread is equal to 1.5 and 2.1 km for the reference and reduced models, respectively. This indicator is slightly larger for the reduced model. The lateral distribution shape is similar for both models with a concentration of impacts near the injection point, a narrower distribution from 5 to 7.5 km and a continuous increasing spread as the plume develops streamwise up to 12.5 km. At this point, the distribution is shifted towards the right in the streamwise direction.
In this case, the probability of detection is equal to 0.94 and the probability of a false alarm is 0.39. Fig. A8a presents the results of the FSS. The best results are obtained for groups of cells larger than nine (that is three adjacent neighbours). Regarding the impact threshold, the score gives good values (closer to one) up to five firebrands per cell. After this threshold, the score is lower than 80%.
Firebrand landing distributions, canyon terrain case
Firebrand landing distribution is shown in Fig. A7b. The distribution of landed firebrands is initially concentrated near the injection point, around the point of coordinates (5.0; 7.3) km. From 5.0 to 7.5 km, the distribution of firebrands follows a narrow column of constant width. Between 7.5 and 10 km longitudinally, the distribution follows a cone that spreads laterally. At the 10 km mark, the landing distribution shifts towards the right, in the streamwise direction. This pattern is shown by the reference model and well reproduced by the reduced model. It can be noted that the lateral spread is no longer as symmetrical as it was in the flat and hill case, where two kidney-shaped landing local maximums are visible at 10 km on both sides longitudinally. In the canyon case, only one is identified, approximately at the point (10.0; 7.5) km. This can be clearly seen in the landing distribution of the reduced model but also in the landing distribution of the reference model as the spread in this area is greater when compared to the hill case.
The maximum longitudinal travel distance is 16.8 and 16.3 km for the reference and reduced model respectively. In this case, the maximum spotting distance is well reproduced by the reduced model with a relative error of 3%. The longitudinal distribution is similar across both models and similar to the longitudinal distribution for the hill topography. Indeed, most of the firebrand land near their injection point and the distribution slowly decreases as distance increases. In this case, 71 and 50% of the firebrands travel less than 2.5 km for the reference and reduced model respectively.
The maximum lateral spread is equal to 1.7 and 2.2 km for the reference and reduced models, respectively. The lateral distribution shape is similar for both models, but the lateral spread is slightly larger for the reduced model. From 5 km up to 7.5 km longitudinally, the lateral distribution is narrow and approximately 0.5 km wide. After 7.5 km longitudinally, the lateral distribution shape widens up continuously to 12.5 km where it reaches its maximum value. At this point, the lateral distribution narrows back and is shifted towards the right, in the streamwise direction.
Scores were calculated for the reduced model assuming the reference model is the reference model. In this case, the probability of detection is equal to 0.96 and the probability of a false alarm is 0.40. Fig. A8b presents the results of the FSS. Best results are obtained for a group of cells larger than nine (that is three adjacent neighbours). Regarding the impact threshold, the score gives good values (closer to one) up to seven firebrands per cell. After this threshold, the score is lower than 80%.


