

An efficient method for estimating dormant season grass biomass in tallgrass prairie from ultra-high spatial resolution aerial imaging produced with small unmanned aircraft systems
Deon van der Merwe A , Carol E. Baldwin B D and Will Boyer CA Royal GD, 7418 EZ, Deventer, The Netherlands.
B Department of Agriculture, Natural Resources and Community Vitality, 103 Umberger, 1612 Claflin, Kansas State University, Manhattan, KS 66506, USA.
C Kansas Center for Agricultural Resources and the Environment, 44 Waters Hall, Kansas State University, Manhattan, KS 66506, USA.
D Corresponding author. Email: carolbaldwin@k-state.edu
International Journal of Wildland Fire 29(8) 696-701 https://doi.org/10.1071/WF19026
Submitted: 22 February 2019 Accepted: 17 March 2020 Published: 9 April 2020
Journal Compilation © IAWF 2020 Open Access CC BY-NC-ND
Abstract
Fire is used extensively in prairie grassland management in the Flint Hills region of the midwestern United States, particularly at the end of the dormant season (March–April). A model is used to manage grassland fires in the region to avoid deterioration of air quality beyond acceptable standards. Dormant season dry biomass is an important parameter in the model. The commonly used method for producing high-quality biomass estimates relies on clipping, drying and weighing small biomass samples, which is tedious, expensive and does not scale efficiently to larger areas to provide regional estimates. Small unmanned aircraft systems (sUAS) were used to develop a reliable and more efficient method of biomass estimation based on the correlation between biomass and vegetation canopy height derived from digital surface models (DSMs). A linear regression model was developed from data collected at 11 representative sites in the Kansas Flint Hills region, and the model was validated at two sites. Biomass and canopy heights derived from DSMs were correlated, with a Pearson product moment correlation value of 0.881 (P-value <0.001). Biomass estimated from clipped vegetation at two validation sites positively correlated with model-derived biomass estimates, resulting in linear regression R2-values of 0.90 and 0.74 and Pearson moment correlation coefficients of 0.99 (P < 0.001) and 0.86 (P = 0.003). The described sUAS method has the potential to increase the efficiency and reliability of dormant season grassland biomass estimates.
Additional keywords: air quality, fire, Flint Hills, grassland, sUAS, smoke.
Introduction
Fire is an integral part of the natural history of the central North American grasslands (Axelrod 1985) and fire is considered an important management tool (Winter et al. 2015). Over 1 million hectares of rangeland in the prairie grasslands of the Flint Hills region of the midwestern United States are burned, on average, each year. These grassland fires generally occur during late March and April, as part of routine rangeland management to maintain productivity for large herbivore production and to control woody plant encroachment. A frequent prescribed burn schedule (annually or biannually) is needed to achieve these management goals (Briggs et al. 2002).
Due to the concentration of burning activity into a relatively small timeframe, and further concentration due to only a few days during this period when weather conditions are appropriate for burning, smoke can contribute to air-quality standards being exceeded (Brooks 2012). To assist ranchers in predicting if smoke will affect urban areas in Kansas and Nebraska, the Kansas Department of Health and Environment provides an on-line model to forecast the smoke direction and potential effect of their fire (publicly accessible: http://ksfire.sonomatechdata.com). The available dormant season biomass (fuel load) is a factor in the production of smoke and is a parameter used in the model. The biomass parameter is, however, only roughly estimated due to a lack of suitable, robust data. The commonly used method for producing high-quality biomass estimates relies on clipping, drying and weighing small biomass samples. However, this method is tedious, expensive and does not scale efficiently to larger areas to provide regional estimates (Tucker 1980; Catchpole and Wheeler 1992). There is a need for the collection of efficient, timely and reliable dormant season grass biomass data to help manage the burn program and reduce the risk of air-quality non-compliance.
Biomass in the Flint Hills is predominantly grass, which can comprise over 90% of the botanical composition on sites without encroachment by woody species (Towne and Owensby 1984). Dominant grass species in this tallgrass prairie type are Andropogon gerardii (big bluestem), Panicum virgatum (switchgrass) and Sorghastrum nutans (Indian grass) (Küchler 1974). A relationship exists between grass plant height and biomass (Harmoney et al. 1997; Vermeire and Gillen 2001). Robel poles and grazing sticks have successfully been used to estimate grassland biomass using plant height in some situations, but this method requires a substantial amount of labour and time commitment. The use of small unmanned aircraft systems (sUAS) to deploy a variety of imaging sensors in terrestrial applications such as vegetation analysis has become common in recent years (Singh and Frazier 2018). Some vegetation analysis applications of sUAS rely on plant height estimates derived from digital surface models (DSMs) (Bendig et al. 2015; Li et al. 2016; Cao et al. 2018). Although the determination of grassland biomass in the Flint Hills region using sUAS has been successful using a normalised difference vegetation index (Wang et al. 2014), the method is not applicable during the dormant season. We therefore investigated the viability of an alternative approach, based on the assumption that grassland canopy height correlates with grassland biomass.
Materials and methods
Eleven grassland sites, located in Chase, Cowley, Pottawatomie and Riley counties, Kansas, USA, were sampled for model generation and calibration during the 2017–18 dormant seasons. After completion of sampling and analysis of the calibration sites, two additional sites (in Chase and Riley counties) were sampled for model validation. Calibration sites were selected to represent a range of biomass values within areas that were 0.5–1 ha in size. Areas in that size range could be surveyed without depleting the flight battery of the sUAS by more than 70% in a single flight. Vegetation at selected sites was predominantly grass and representative of typical grazed tallgrass prairie found in the Flint Hills region. Other factors that influenced site selection included accessibility by vehicle, gentle slopes (< 5°) and consistent aspects, absence of tall obstacles that may interfere with flight operations, airspace classification within Class G (uncontrolled), a minimum of 8 km distance from airports, absence of potential risk of intrusion or interference from uninvolved persons and low risk of injury to people or harm to property in the event of loss of control of the sUAS. Sites were sampled during the dormant season within 2 h of solar noon. Weather conditions also played a role in determining sampling times. Flights were performed under clear skies or consistent overcast skies, when temperatures were above 0°C, and ground-level wind speeds were below 4.5 m s−1.
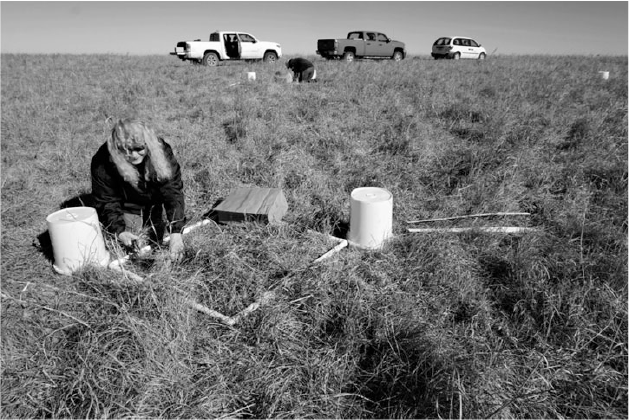
At each site, 5 1 m2 calibration locations were used. Each calibration location was delineated with a white 2.5-cm PVC pipe frame (1 m2) to ensure visibility in the aerial images (Fig. 1). Two overturned white plastic 19-L buckets of identical size were placed diagonally at opposite corners of each frame, positioned so that the bucket rim was in contact with the soil surface. Where necessary, obstructing vegetation was removed from under the bucket rims to ensure contact with the soil. The buckets served as references for soil level. White vinyl panels of 90 × 7 cm were used as dimensional calibration panels and to create unique symbols at each calibration location to eliminate uncertainty regarding location identity in the aerial images. The coordinates of each location were recorded on a hand-held Wide Area Augmentation System (WAAS)-enabled GPS unit with an accuracy performance of 1–2 m horizontal and 2–3 m vertical (Garmin GPSMAP 60CSx; Garmin International Inc., Olathe, KS, USA).
|
Aerial images were generated using automated flight with a sUAS that carried a gimbal-stabilised visible light sensor (DJI Phantom 4 Pro; DJI, Shenzhen, China). Key features of the imaging sensor include: 20 megapixels arrayed in a 3 : 2 aspect ratio, a mechanical shutter and an 8.8-mm focal length resulting in a field of view of 84°. Images were recorded in JPEG format and image location and orientation information derived from the sUAS autopilot were captured in image header files. Flight plans were generated on site using an app that optimised image acquisition for surface modelling applications (Pix4Dcapture; Pix4D S.A., Lausanne, Switzerland). Flight plans were generated with the following parameters: double-grid pattern, 40 m above ground level to provide images with ~1 cm spatial resolution, camera angle 70°, front overlap 90%, side overlap 85%, not looking at grid centre, fast trigger mode, fast flight speed and sunny white balance. Flight areas were positioned to provide at least two flight lines beyond the most peripheral sample locations. Flights were conducted by licenced pilots in accordance with the Federal Aviation Administration Small Unmanned Aircraft Rule (Code of Federal Regulations 14, Part 107).
The DSMs were generated from aerial images using desktop software (Agisoft Metashape Professional ver. 1.5.0; Agisoft LLC, St Petersburg, Russia). Images were aligned using generic and reference preselection, at the highest accuracy setting. DSMs were derived by interpolation from dense point clouds, generated at the ultra-high accuracy setting. Geolocation parameters were based on the World Geodetic System 1984 (WGS84) datum. Average vegetation canopy heights within calibration sites were estimated from the DSMs using the diagonally placed buckets as ground-level references (Figs 2, 3).

|

|
Vegetation within each frame was clipped to ground level and placed into paper bags. Cattle faecal pats were not included. The bags were placed into a forage dryer constructed at the North Agronomy Farm, Kansas State University, at 55°C for 48 h and the bag contents were weighed immediately following removal from the dryer.
Linear regression models that relate vegetation canopy heights and dry biomass were constructed for each site, and for all sites combined, using statistical software (SigmaPlot 11.0, build 11.2.0.5, Systat Software Inc., San Jose, CA, USA). The combined regression model derived from the calibration sites was used to derive dry biomass estimates at the validation sites, at 10 locations and 9 locations respectively, at the Chase County and Riley County validation sites. Correlations between model-derived estimates and clipped vegetation dry biomass were described using linear regression models and Pearson product moment correlation.
Results
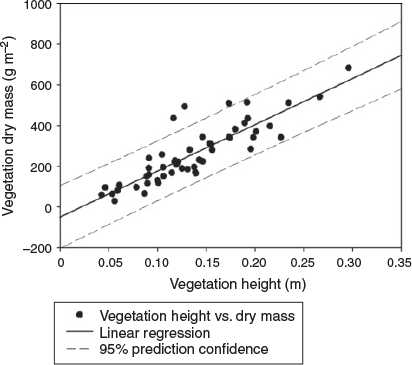
Ground sampling distances of the DSMs were 1.05 cm on average per pixel (range: 1.02–1.08 cm). Projection errors were 0.66 pixels on average (range: 0.15–1.99) and computed dimensional calibration panel length errors were 0.6 cm (range: 0.0–1.9 cm). Average biomass weights at the calibration sites were 259 g m−2 (range: 29–683 g m−2). Average vegetation canopy height above ground level derived from DSMs at the calibration sites were 13.6 cm (range: 4.3–29.6 cm). Biomass (estimated from clipped vegetation weight) and canopy heights (estimated from DSMs) were correlated, with a Pearson product moment correlation value of 0.88 (P < 0.001). When data from all 11 calibration sites (55 data points) were combined to derive a linear regression model, the result was:
Vegetation dry mass = 2268.3(vegetation height) – 49.214, with an R2-value of 0.75 (Fig. 4).
The standard error of the vegetation dry mass estimate was 72 g m−2.
|
Estimated biomass at the validation sites, based on the calibrated model, significantly correlated with biomass estimated from clipped vegetation, resulting in linear regression R2-values of 0.91 and 0.74 and Pearson moment correlation coefficients of 0.99 (P < 0.001) and 0.86 (P = 0.003) for the validation sites in Chase County and Riley County, respectively (Fig. 5).

|
Discussion
The efficiency of estimating dormant season grass biomass, based on linear regression models that relate biomass to plant canopy height and therefore the potential fuel load during spring grassland fires, can be improved using DSMs generated with commercially available software and ultra-high spatial resolution aerial imagery derived from commercially available sUAS. Several factors may affect the success of this approach. To avoid exceeding the inference range of the regression model, the vegetation composition and structural characteristics at the sites used for model calibration should be representative of the range of vegetation where the model will be used. Study site selection should therefore take local and regional variations into account and aim to incorporate a representative range of vegetation into the sampling strategy. The quality of the model calibration can be affected by environmental conditions during the sUAS flight, including variable sunlight intensity due to changes in cloud cover during flight, masking of the vegetation surface by snow and excessive vegetation movement due to high wind speeds. In the present study, 3 out of 55 data points fell outside the 95% confidence interval of the model (Fig. 4) and in all three cases the vegetation height was lower than expected. Possible reasons for a lower than expected grass canopy include compression by animals, vehicles or snow. It is also important to consider that the vegetation height estimate is the result of interpolation from a point cloud. Small vegetation features, such as thin stems or leaves that protrude from the general vegetation canopy shape, are therefore excluded. It is therefore more appropriate to view the vegetation height estimate as an index that is related to general vegetation canopy shape rather than as a measurement of absolute height. The key question, however, is whether this method of vegetation height estimation results in a consistent parameter that can be related to biomass. In this sense, the height estimates were successful. A systematic comparison between traditional ground-based vegetation height estimates and model-derived estimates was beyond the scope of this investigation, but would be of interest in future research, particularly if this modelling approach is expanded to other applications involving vegetation height estimations.
Once an effective model is established, biomass estimates can be generated relatively quickly by placing height references in areas of interest and flying a suitable sUAS to generate aerial images. Typical flight times to generate images for a site are less than 5 min per site. The timeframe for generating suitable aerial images is typically ~4 h day−1. A single sUAS operator can therefore perform flights at multiple sites in a single day, with the total number of flights depending on the distances between sites and availability of roads, and availability and persistence of suitable weather conditions. Subsequent processing can be completed at convenient times after the flights. Processing time varies depending on the number of images and the processing power of the computer system used, with typical processing times of large datasets requiring 2–5 h. Due to the low cost of suitable sUAS and the availability of flight control software that makes a standardised flight methodology easily achievable, it is potentially viable for multiple sUAS operators to generate aerial images concurrently and thereby achieve high levels of efficiency in a biomass estimation campaign. Image processing for such a campaign can be done asynchronously and can be centralised to further enhance efficiency. Improved estimates of fuel load at the landscape scale, based on timeous and efficient biomass estimation campaigns, could therefore be a viable source of data to improve smoke effect forecasts and potentially improve smoke risk management.
The current study did not attempt to estimate biomass on grasslands with woody encroachment, which may require modification of sampling and estimation techniques to capture the biomass contributions of trees and shrubs as well as grass. Another fuel source on grazed rangelands that was not included in the study is cattle faecal pats, which can be numerous and may contribute to smoke emissions. Additional research is needed to determine the robustness of the approach between seasons, to improve the forecast model performance over a wider range of biomass values and to determine the range of grassland types that can be assessed using this same approach. Ideally, studies should be conducted in grassland biomes in multiple regions and continents. Other factors that could influence model accuracy should be investigated in future studies. These include the influence of species composition differences, as well as current and historical land management practices. These and other unknown factors could account for differences in model performance between the two validation sites (Fig. 5). However, overall model performance was consistently good enough to be of practical value in biomass estimations for prescribed burn management in the context of the smoke forecast model used in Kansas.
In conclusion, sUAS have the potential to play an important role in improving smoke emission models and thus fire and smoke management, by providing an efficient method for reliable, rapid assessment of dormant grass fuel loads in grassland ecosystems. This method can also serve as a pasture management tool by providing efficient estimates of available grass biomass.
Conflicts of interest
The authors declare no conflicts of interest.
Acknowledgements
This research did not receive any specific funding. Labour and use of most equipment was donated, as was access to working ranches.
References
Axelrod DI (1985) Rise of the grassland biome, Central North-America. Botanical Review 51, 163–201.| Rise of the grassland biome, Central North-America.Crossref | GoogleScholarGoogle Scholar |
Bendig J, Yu K, Aasen H, Bolten A, Bennertz S, Broscheit J, Gnyp ML, Bareth G (2015) Combining UAV-based plant height from crop surface models, visible, and near infrared vegetation indices for biomass monitoring in barley. International Journal of Applied Earth Observation and Geoinformation 39, 79–87.
| Combining UAV-based plant height from crop surface models, visible, and near infrared vegetation indices for biomass monitoring in barley.Crossref | GoogleScholarGoogle Scholar |
Briggs JM, Knapp AK, Brock BL (2002) Expansion of woody plants in tallgrass prairie: a fifteen-year study of fire and fire-grazing interactions. American Midland Naturalist 147, 287–294.
| Expansion of woody plants in tallgrass prairie: a fifteen-year study of fire and fire-grazing interactions.Crossref | GoogleScholarGoogle Scholar |
Brooks K (2012) Exceptional event requests regarding the exceedances of the 8-hour ozone NAAQS at multiple monitors in Kansas during April of 2011. Letter from United States Environmental Protection Agency (EPA) to John Mitchell, Director, Division of the Environment, Kansas Department of Health and Environment December 28, 2012. Available at http://www.kdheks.gov/bar/air-monitor/exceptevent/Flint_Hills_Letter_12-28-12.pdf [verified 23 March 2020]
Cao J, Leng W, Liu K, Liu L, He Z, Zhu Y (2018) Object-based mangrove species classification using unmanned aerial vehicle hyperspectral images and digital surface models. Remote Sensing 10, 89
| Object-based mangrove species classification using unmanned aerial vehicle hyperspectral images and digital surface models.Crossref | GoogleScholarGoogle Scholar |
Catchpole WR, Wheeler CJ (1992) Estimating plant biomass: a review of techniques. Australian Journal of Ecology 17, 121–131.
| Estimating plant biomass: a review of techniques.Crossref | GoogleScholarGoogle Scholar |
Harmoney KR, Moore KJ, George JR, Brummer EC, Russell JR (1997) Determination of pasture biomass using four indirect methods. Agronomy Journal 89, 665–672.
| Determination of pasture biomass using four indirect methods.Crossref | GoogleScholarGoogle Scholar |
Küchler AW (1974) A new vegetation map of Kansas. Ecology 55, 586–604.
| A new vegetation map of Kansas.Crossref | GoogleScholarGoogle Scholar |
Li W, Niu Z, Chen H, Li D, Wu M, Zhao W (2016) Remote estimation of canopy height and aboveground biomass of maize using high-resolution stereo images from a low-cost unmanned aerial vehicle system. Ecological Indicators 67, 637–648.
| Remote estimation of canopy height and aboveground biomass of maize using high-resolution stereo images from a low-cost unmanned aerial vehicle system.Crossref | GoogleScholarGoogle Scholar |
Singh KK, Frazier AE (2018) A meta-analysis and review of unmanned aircraft system (UAS) imagery for terrestrial applications. International Journal of Remote Sensing 39, 5078–5098.
| A meta-analysis and review of unmanned aircraft system (UAS) imagery for terrestrial applications.Crossref | GoogleScholarGoogle Scholar |
Towne G, Owensby C (1984) Long-term effects of annual burning at different dates in ungrazed Kansas tallgrass prairie. Journal of Range Management 37, 392–397.
| Long-term effects of annual burning at different dates in ungrazed Kansas tallgrass prairie.Crossref | GoogleScholarGoogle Scholar |
Tucker CJ (1980) A critical review of remote sensing and other methods for non-destructive estimation of standing crop biomass. Grass and Forage Science 35, 177–182.
| A critical review of remote sensing and other methods for non-destructive estimation of standing crop biomass.Crossref | GoogleScholarGoogle Scholar |
Vermeire TL, Gillen R (2001) Estimating herbage standing crop with visual obstruction in tallgrass prairie. Journal of Range Management 54, 57–60.
Wang H, Wang C, Price KP, van der Merwe D, An N (2014) Modeling above-ground biomass in tallgrass prairie using ultra-high spatial resolution sUAS imagery. Photogrammetric Engineering and Remote Sensing 80, 1151–1159.
| Modeling above-ground biomass in tallgrass prairie using ultra-high spatial resolution sUAS imagery.Crossref | GoogleScholarGoogle Scholar |
Winter SL, Allred BW, Hickman KR, Fuhlendorf SD (2015) Tallgrass prairie vegetation response to spring fires and bison grazing. The Southwestern Naturalist 60, 30–35.
| Tallgrass prairie vegetation response to spring fires and bison grazing.Crossref | GoogleScholarGoogle Scholar |