

Insights on the dynamics of Miombo woody vegetation in Niassa Special Reserve, northern Mozambique
Matola Salimo A , Victorino Buramuge A , Aide Farão A , Aniceto Chauque A , Romana Bandeira A , Jone Fernando A , Ana I. Ribeiro-Barros B C , Cristina Branquinho C and Natasha Ribeiro A B *A
B
C
Abstract
Fire is a key ecological factor in the Miombo woodlands of southern Africa, but its role in tree dynamics has not been fully explored.
Investigate relationships between fire and forest dynamics and predict Miombo diameter distribution for the year 2033.
Tree data (growth, recruitment and mortality) were collected (2005, 2009, 2015 and 2019) along a fire frequency (ff) and severity (fs) gradient in 50 permanent plots in Niassa Special Reserve (NSR). A transition matrix was used to forecast forest structure for the year 2033.
Fire frequency (ff) and severity (fs) classes (low, medium and high) were associated with different tree species assemblages. High ff and fs had varied effects on tree mortality, recruitment, growth and carbon stocks. Julbernardia globiflora had higher mortality rate in high ff plots compared to other tree species. Projections indicated that, despite the regular distribution of diameter, high ff may reduce tree density in young cohorts.
A moderate fire regime is a determinant of sustaining the Miombo dynamics in NSR.
Fire management action through early dry season controlled burning is needed to prevent the impact of intense late dry season fire.
Keywords: annual periodic increment, biodiversity conservation, carbon stock density, Julbernardia globiflora, mortality, recruitment, transition matrix, tree growth.
Introduction
Miombo woodlands are one of the world’s priorities for biodiversity conservation (Mittermeier et al. 2003) due to their diversity of plant and animal species as well as landscapes. Miombo covers approximately 1.9 million km2 in southern, central and eastern Africa (Dziba et al. 2020), playing important ecological, socio-economic and cultural roles, and providing goods and services to about 100 million people in rural areas and to 50 million urban dwellers (Lupala 2009; Ryan et al. 2016; Ribeiro et al. 2020). This has created important socio-ecological relationships that sustain key ecosystem processes and functions.
Forest dynamics (mortality, recruitment and growth) involves fundamental structural and floristic changes over time, which can be determined by environmental conditions and/or disturbances such as fires (Carvalho 2010). In the Miombo woodlands, the ecological dynamics is influenced essentially by fire, herbivory (especially by elephants), and human activities such as shifting cultivation and honey gathering (Ribeiro et al. 2008a, 2009, 2019, 2020; Timberlake and Chidumayo 2011).
Anthropogenic fire is a readily accessible tool to rural, forest-dependent communities (Syampungani et al. 2009). Given the long fire history of more than 200,000 years, it plays an important role in the ecosystem dynamics and processes (Frost 1996; Ribeiro et al. 2013). Medium fire frequency (every 4–5 years; Frost 1996) and intensity (in early dry season between May and July) promote tree plant regeneration and growth, contributing significantly to maintaining the structure and functioning of the ecosystem (Burgess et al. 2015; Ribeiro et al. 2020). However, high fire frequency and intensity have been reported as one of the causes of changes in tree species composition and ecosystem structure (Ryan and Williams 2011; Ribeiro et al. 2020, 2021). In general, annual burnings contribute to a high tree mortality rate and a decrease in species diversity and, consequently, a conversion of woodland areas to bushlands (Lawton 1982). For example, Ribeiro et al. (2008a) indicated that in the Miombo woodlands of Niassa Special Reserve (NSR), annual fires were responsible for approximately 3% of the total tree mortality. The remaining 97% of the mortality was attributed to natural causes and/or elephants, resulting in an estimated total biomass loss of approximately 6%. Fires may also promote the growth of invasive and fire-resistant species (Timberlake and Chidumayo 2011; Syampungani et al. 2020).
Several authors have explored the relationships between fires and Miombo vegetation (Trapnell 1959; Frost and Robertson 1987; Ribeiro et al. 2008a, 2008b; Syampungani et al. 2009; Maillard et al. 2025; Meneses et al. 2025 and many others). However, except for the study by Trapnell (1959), these investigations were based on only one assessment. Despite providing important insights into Miombo’s ecology, they do not provide information on the long-term ecosystem dynamics. The latter is crucial to understanding its ecology as well as formulating recommendations for management. This is particularly key in protected areas as the last remnants of Miombo biodiversity.
This study aimed to investigate the long-term (14 years; 2005–2019) Miombo vegetation dynamics (mortality, recruitment and growth) and relationships with fire frequency (ff) and severity (fs) in NSR, one of the most important protected areas of Miombo woodlands. The specific objectives of this study were: (i) to explore variations in tree species composition according to ff and fs; (ii) to investigate changes in woody carbon stocks density over time in relation to ff and fs; (iii) to explore the effects of ff and fs on tree growth, mortality and recruitment; and (iv) to predict ecosystem structural changes for the next 14 years under different fire regimes. The ultimate goal of this study was to support management action in NSR.
Methodology
Study area
This study was carried out in NSR, located in northern Mozambique, between the parallels 12°38′48.67″S and 11°27′05.83″S and the meridians 36°25′21.16″E and 38°30′23.74″E (Fig. 1). With a total area of 42,000 km2, the NSR encompasses the Mecula, Mavago Muembe, Majune, Marrupa districts in Niassa province, and part of Mueda and Montepuez districts in Cabo Delgado province. The area is limited by the Rovuma River in the northern border with Tanzania, Lugenda River in the southeast, Luatize River in the southwest and the Lusanhanda River in its western part. Miombo woodlands cover ca. 70% of the total area, hosting approximately 800 plant species (Timberlake 2004). The landscape is subdivided into five vegetation typologies: Open Deciduous Forest, Dense Deciduous Forest, Evergreen Forest, Dambos (flooded prairie) and Riverine Vegetation (Craig 2009; Allan et al. 2017; Ministério da Terra, Ambiente e Desenvolvimento Rural (MITADER) 2018).
Location of the Niassa Special Reserve (NSR) in Mozambiue and distribution of sampling points based on fire frequency (ff) between 2005 and 2019. A ff of 1 represents areas burned once, and 13 represents areas burned 13 times over 14 years. Spatial data source: Landsat images freely available on the GEE platform (Gorelick et al. 2017).
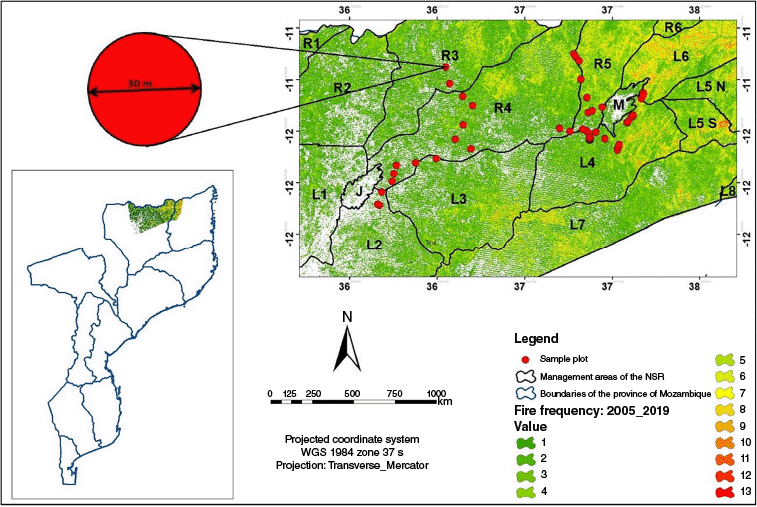
Parts of the reserve experience fires almost every year (Ribeiro et al. 2017), which derives from human activities such as slash-and-burn agriculture, honey gathering and to a lesser extent charcoal production. Ribeiro et al. (2017) estimated a mean fire return interval of 3.29 years, but about 45% of total NSR burned annually, especially in the north-central and eastern zones (Fig. 1). Fire seasonality is determined by precipitation distribution throughout the year, beginning in the early dry (May) and ending in the early wet (November) seasons, with a peak in the late dry season, between August and October (Ribeiro et al. 2017).
The NSR is the largest, best-preserved Miombo woodland (Ribeiro et al. 2008a, 2008b; Cunliffe et al. 2009) and wildlife area in the world (Allan et al. 2017). However, the ecosystem has been under pressure associated with shifting agriculture and other anthropogenic activities, precursor of recurrent wildfires (Ribeiro et al. 2017). Allan et al. (2017) reported that about 108 km2 equivalent to 0.9% of the Miombo woodland area was lost from 2001 to 2014 due to slash-and-burn agriculture and other human-related disturbances. In addition, several other studies (Ribeiro et al. 2008a, 2013, 2017, 2020; Amade 2016; Macave et al. 2022) reported strong relationships between fires and herbivory by elephants, and tree mortality, recruitment, growth, and regeneration. In this study, we expanded the period of analysis to 14 years.
Sample design
We first analyzed fire frequency (ff) and severity (fs) for the 14 -year period (2005–2019) under investigation for the entire NSR. We performed this analysis on the Google Earth Engine (GEE) platform, using a fusion of Landsat 5, 7, and 8 satellite imagery at a spatial resolution of 30 m (Jodhani et al. 2024). The data were acquired online via https://developers.google.com/earth-engine/datasets (acessed on 15 December 2024). The analysis of ff used an adaptation of the methodology proposed by Arruda (2021), which categorised ff in terms of the number of times a pixel is hit by a fire and burns more than 50%. We established three categories of ff: (1) high ff: areas burned 6 or more times; (2) medium ff: areas burned 4–5 times; and (3) low ff: areas burned less than 4 times. Our decision on these categories was based on the average fire return interval in Miombo, which is every 4–5 years (Frost 1996). Fire severity in each plot was assessed using the difference in the normalized burn ratio index (ΔNBR) before (May–June, early dry season) and after the fire season (December–January, early wet season) (Arruda 2021). Fire severity was classified into three categories, based on common approaches found in the literature (Frost 1996; Key and Benson 2006; Eidenshink et al. 2007; Archibald et al. 2010): (1) low severity (ΔNBR between −0.10 and −0.02), where vegetation is not significantly affected, and trees and shrubs generally survive, although herbaceous vegetation may be impacted; (2) medium severity (ΔNBR between −0.02 and 0.10), where there is substantial damage to vegetation, but some trees survive and regeneration is possible; and (3) high severity (ΔNBR between 0.10 and 0.21), characterized by significant defoliation and loss of greenness, with little regeneration and considerable damage to the ecosystem. The use of ΔNBR rather than fire seasonality as a surrogate of fs is justified by the well-known relationship between NBR and fs (Keeley 2009; UN-SPIDER 2025).
To enable a continuous assessment of the effects of fire on the structure and composition of the Miombo vegetation, a stratified sampling methodology, adapted from Makumbe et al. (2020), was used. Fifty permanent circular plots of 0.071 ha (15-m radius) were established in 2004, located along a natural ff gradient (Fig. 1) and measured in 2005, 2009, 2015 and 2019. Fire frequency and fs obtained from satellite data were extracted for each plot. A plot was considered to have burned if more than 50% of its area had been affected by fire over the study period. Table 1 indicates the plot distribution by ff and fs.
Data collection
All trees and shrubs with a diameter at breast height (DBH) greater than or equal to 5 cm were considered. All individuals were identified by their scientific and local names at the species level with the help of a botanist and a field guide (Palgrave 2002) and tagged sequentially with an aluminum plaque. Diameter at breast height was measured using a manual caliper (Mantax Blue 65 cm). To achieve precision in temporal measurements, we secured the measurements at 1.3 m from the ground in every measurement period.
Data analysis
Before performing any statistical analysis, we investigated the spatial autocorrelation of the dataset using the Moran’s I index, to measure the spatial correlation between plots (Bataineh et al. 2006). Our plots were randomly distributed (Moran’s I = 0.639, P < 0.111) (Supplementary Fig. S1).
Woody vegetation dynamics in 14 years (2005–2019)
Tree species composition was determined by multivariate ordination non-metric multidimensional scaling analysis (NMDS, Clarke 1993), to test the dissimilarity between tree communities in different clusters of ff and fs over time. A nonparametric permutation procedure of similarities (ANOSIM; Clarke and Green 1988) analysis was performed to test differences in the species composition across the ff and fs groups formed by the NMDS analysis (9999 permutations). The suitability of the ordination was evaluated through the Standard Residuals Sum of Squares (STRESS) value. When the STRESS tends to zero, the rank orders reach perfect agreement (Clarke 1993). Additionally, we performed a Similarity Percentage (SIMPER) and indicator value index (IndVal) analysis. The SIMPER approach determines which taxa are mostly responsible for a difference across a group of samples. The overall significance of the difference (P < 0.001) was assessed using the Analysis of Similarities (ANOSIM). The indicator value (IndVal) identifies the site group where the associated species are significant (De Cáceres et al. 2012).
Carbon stock density (CSD) was determined based on the norms established by the International Panel on Climate Change (IPCC) (2007), which attributes 50% of the woody biomass to carbon. Four allometric models developed for the Miombo ecosystems by Brown et al. (1989), Chamshama et al. (2004), Macia (2016) and Guedes et al. (2018) were tested. Based on the performance and best model fit for Miombo forests in NSR (Salimo 2021), the model developed by Macia (2016) (Eqn 1) was selected to estimate tree above ground biomass (AGB):
where AGB is above ground biomass (Mg ha−1) and DBH is diameter at breast height (cm).
Vegetation growth was analysed based on periodic annual increment (PAI) in DBH and CSD (Eqn 2), recruitment and mortality rates (Eqns 3 and 4, respectively) for the 14-year period of study:
where PAI is periodic annual increment; Y is dimension of the considered variable (DBH in cm or carbon in MgC ha−1); t is year and n is time (years).
Any individual that reached the DBH of 5 cm in the second measurement round but had not outgrown the threshold in the previous assessment, was considered a recruit (Campos and Leite 2013). Mortality was declared when a tree registered in a previous measurement was reported dead in the following assessment.
RR – recruitment rate (%); MR – mortality rate (%); N0 – initial number of individuals; Nm – number of dead individuals; Nr – number of recruits (ind. ha−1), Nf – final number of individuals (ind. ha−1); t – time (years).
To assess the statistical differences between treatments, the non-parametric Kruskal–Wallis H (KWH) test was employed as the data did not follow a normal distribution, to analyse the influence of ff and fs on vegetation dynamics parameters. In order to investigate the independent effects of both factors, we used two levels of analysis, differences between ff classes and between fs categories across the ff groups. A multiple linear regression analysis was performed to investigate the interaction between ff and fs in determining vegetation dynamics. In this model, the vegetation parameters were considered as the dependent variabled (y), and ff (x1) and fs (x2) were assumed as independent variables. A 95% confidence level (P < 0.05) was considered statistically significant for all analyses.
Projection of DBH distribution for the year 2033
The DBH distribution over time reflects the balance or imbalance of forest stands and is used as an indicator for understanding forest succession and dynamics (Luiz et al. 2010). In this study, tree density (number of trees per unit of area) was recorded in stem DBH classes of 5 cm, starting from 5 cm as the lowest class limit.
A tree stem DBH class projection was done for the year 2033 using a transition matrix used by Sanquetta et al. (1996), based on the enumeration of migration or permanence of individuals in their respective stem DBH classes, as well as the number of recruitments and mortalities within each class in the period of analysis (2005 to 2019). The projection year 2033 was selected because the ideal period should be equal to the interval between the first and the last measurement (Uetela and Arce 2018), which in this case is 14 years. The projection was performed in Excel 2016 software. Below is a description of the transition matrix adopted in this study, keeping other factors constant.
Notes: G = transition probability matrix; in = I-th diameter class; aᵢ, bᵢ, cᵢ = probabilities that a live tree will remain in the same diameter class (aᵢ), change to the subsequent diameter class (bᵢ), or advance two classes (cᵢ). mᵢ = probability of a tree from class ‘I’ dying in the studied period.
In matrix algebra, the simulation process for one period (t → t + 1) can be summarised in Eqn 5 below:
where Yt + Δt is number of projected trees for 2033; Gt is probability of transition by stem diameter class; Yt is diameter class frequency; and It is recruitment.
An accuracy assessment of the projection was done using a non-parametric Kolmogorov–Smirnov (KS) test (Uetela and Arce 2018) at 95% confidence level.
Results
Effect of fire on tree species composition
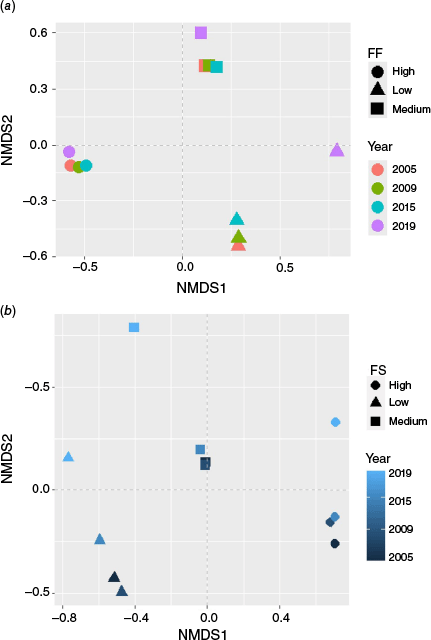
The NMDS ordination of species composition clearly grouped the sample plots in three groups of ff (Fig. 2; Supplementary Fig. S2). Our analysis of similarity revealed that ff strongly influenced species composition for each of the 4 years under study (ANOSIM: R2 = 0.95, P < 0.001, 9999 permutations; STRESS = 0.10). The STRESS value indicated the robustness of our results with minimum risk of drawing false inferences (Clarke 1993).
Non-metric multidimensional scaling (NMDS) based on species composition and fire frequency (FQ – a panel) and fire severity (fs – b panel) over the study period (2005–2019), using the Bray–Curtis index.
The percentage of similarity (SIMPER) indicated that three tree species, Julbernardia globiflora, Diplorhynchus condylocarpon and Pseudolachnostylis maprouneifolia, contributed with 11.7, 11.1 and 7.3%, respectively, to the differences between ff groups (Supplementary Table S1). Frequently burned areas had the most individuals of these species, with 127, 119, and 78, respectively. Several other species contributed modestly to group formation, but their presence in high ff was also significant. Brachystegia boehmii contributed 3.3%, with an average of 43 individuals; Pterocarpus angolensis contributed 1.3%, with 17 individuals; Uapaca kirkiana contributed 1.1%, with nine individuals; and Pericopsis angolensis and Swartzia madagascariensis contributed 1%, with eight individuals each. Brachystegia spiciformis and Combretum hereroense, contributed by 1.3 and 2.7%, respectively, to the group dissimilarity and were more significant in medium ff areas, with 11 and 12 individuals, respectively. However, Markhamia zanzibarica and Combretum zeyheri contributed both 1.2% and were more expressive in the low ff areas, with 7 and 11 individuals, respectively.
The highest overall average dissimilarity value (57.9%) was found between areas with high and low ff. The lowest value, 33.9%, was reported between areas with medium and low ff. Areas with high and medium ff had an overall average dissimilarity of 52.1%.
The IndVal analysis (P < 0.05) for ff revealed that nine species appeared to be indicators of low ff areas, which included C. zeyheri, M. zanzibarica, Milettia stuhlmanniii and Grewia monticola. In medium ff areas, 16 indicator species were observed, which included Combretum fragrans, Burkea africana, C. hereroense, Dalbergia melanoxylon and Ximenia caffra (Supplementary Fig. S3). The highest number of indicator species (34) was found in high ff areas, of which the most important were: Berchemia discolor, Boscia sp., Brachystegia allenii, Combretum collinum, C. elaegnoides, Monotes engleri, Swartzia madagascariensis, U. kirkiana and Diplorhynchus condylocarpon.
The NMDS ordination analysis for fs revealed substantial differences, showing a strong separation of species composition between different fs classes. The ANOSIM statistic analysis resulted in an R2 value of 1 (permutations = 9999), indicating species composition was significantly different between fs classes (Fig. 2). The low STRESS value of 0.037 indicated an excellent fit of the ordination and the IndVal analysis (P < 0.05). A high number of indicator species (43) was found in areas with medium fs, comparing to low (19) and high (8) fs categories (Supplementary Fig. S4).
Effects of fire on carbon stock density
The differences in CSD between the ff treatments were only observed in 2005 (P = 0.0313) and 2019 (P = 0.0200); no differences were detected in 2009 and 2015. In both years (2005 and 2019), plots with high ff had lower CSD (29 MgC ha−1 in 2005 and 34 MgC ha−1 in 2019) compared to those with medium (38 MgC ha−1 in 2005 and 47 MgC ha−1 in 2019) or low ff (36 MgC ha−1 in 2005 and 47 MgC ha−1 in 2019). Areas with medium and low ff showed no statistically significant differences in any of the years (Table 2).
| Years | Fire frequency | Fire severity | ||||
|---|---|---|---|---|---|---|
| Low | Medium | High | ||||
| 2005 | Low | 36.35A | 42.05a | 41.55a | 37.20b | |
| Medium | 38.37A | 31.00a | 30.24a | 34.00a | ||
| High | 28.75B | 30.67a | 21.74a | 29.70a | ||
| 2009 | Low | 33.45A | 34.41a | n.d. | 28.53a | |
| Medium | 32.18A | 33.42a | 29.34a | 35.17a | ||
| High | 30.72A | 34.27a | 38.95a | 34.78a | ||
| 2015 | Low | 34.81A | 59.31a | 31.39b | 28.15b | |
| Medium | 32.39A | 35.05a | 29.74a | 35.49a | ||
| High | 31.46A | 30.12a | 36.21a | 35.50a | ||
| 2019 | Low | 47.25A | 36.47a | 38.84a | 36.70a | |
| Medium | 47.31A | 38.24a | 33.78a | 39.38a | ||
| High | 33.64B | 31.65a | n.d. | 37.61a | ||
Different uppercase letters (A, B) along the columns indicate significant differences between ff groups, while different lowercase (a, b) letters along the rows indicate significant differences between fs groups, based on the Kruskal–Wallis H test at a 95% confidence level.
In 2005 and 2015, low fs plots in the low ff category had significantly higher CSD (42 MgC ha−1; P = 0.036 in 2005 and 59 MgC ha−1; P = 0.012 in 2015) than high fs areas. In 2009 and 2019, no significant differences were found in the low, medium, and high fs plots under all levels of ff. The multiple linear regression analysis indicated a weak relationship between the interacting effects of ff and fs on CSD (r2 = 0.0949).
Effects of fire on tree mortality and recruitment rates
The mortality rate in the 14 -year period was higher (around 2%) in the high and medium ff classes, and lower (1.7%) in the low ff treatment (P = 0.0421; Table 3). A combination of medium ff and high fs, and high ff and medium fs, resulted in higher mortality (2.8%; P = 0.0441 and 2%; P = 0.0291, respectively). Analysing the mortality rate for three ecologically key tree species in the study area, we found that only J. globiflora was affected by ff (significantly lower mortality rate −0.05% – under low ff was observed), but fs did not have an effect. In turn, B. boehmii and D. condylocarpon were not affected by ff nor fs. Overall, the three species showed low levels of mortality comparing with the rates for the ecosystem.
| Rates | Fire frequency | Fire severity | ||||
|---|---|---|---|---|---|---|
| Low | Medium | High | ||||
| Mortality (%) | Low | 1.66A | n.d. | 0.22a | 2.61a | |
| Medium | 2.19B | 1.06a | 1.43a | 2.76b | ||
| High | 2.08B | 1.2a | 2.81b | 2.19b | ||
| Recruitment (%) | Low | 1.80A | n.d. | 2.26a | 1.53a | |
| Medium | 3.11B | 2.59a | 2.69a | 3.65a | ||
| High | 2.01A | 1.13a | 2.25b | 2.29b | ||
Different uppercase letters (A, B) along the columns indicate significant differences between ff groups, while different lowercase letters (a, b) along the rows indicate significant differences between fs groups, based on the Kruskal–Wallis H test at a 95% confidence level.
With regards to the recruitment in the 14 -year period (Table 3), rates were similar (around 2%) in the high and low ff treatments, but higher (3%) in the medium ff treatment (P = 0.038). No significant differences were observed in recruitment rates between the fs classes, except for the combination of high ff and medium and high fs, which showed significantly higher recruitment rates (2%; P = 0.0304). The multiple linear regression analysis on the interactive effects of ff and fs on recruitment (r2 = 0.018) and mortality (r2 = 0.011) rates, indicated a weak relationship between the variables.
Effects of fire on periodic annual increment in tree diameter and woody carbon stock
Overall, regardless of the fire regime, there was a significant increment in CSD and DBH over the study period (2005–2019; Table 4). However, the highest PAI in DBH was observed in areas with low ff (P = 0.041), while the lowest growth occurred in areas with medium and high ff (Table 4). The same pattern was observed for the PAI in CSD, with the highest values found in the low ff class (0.44 MgC ha−1 Y−1) and the lowest in the high ff category (0.25 MgC ha−1 Y−1; P = 0.013). However, when analysing the combined effect of ff and fs, the results showed that, while there were no significant differences in CSD increment across the different fs levels, a significant difference in DBH PAI was observed in the low ff class in which the medium fs had significantly lower increment (0.30 MgC ha−1 Y−1; P = 0.0191). For both medium and high fs classes, no significant differences were found across the ff categories.
| Periodic annual increment | Fire frequency | Fire severity | ||||
|---|---|---|---|---|---|---|
| Low | Medium | High | ||||
| Carbon (MgC ha−1 Y−1) | Low | 0.44A | 0.43a | 0.45a | 0.47a | |
| Medium | 0.22B | 0.26a | 0.21a | 0.19a | ||
| High | 0.25B | 0.26a | 0.25a | 0.26a | ||
| DBH (Cm Y−1) | Low | 0.35A | 0.42a | 0.30b | 0.38a | |
| Medium | 0.20B | 0.20a | 0.22a | 0.19a | ||
| High | 0.18B | 0.19a | 0.19a | 0.16a | ||
Different uppercase letters (A, B) along the columns indicate significant differences between ff groups, while different lowercase letters (a, b) along the rows indicate significant differences between fs groups, based on the Kruskal–Wallis H test at a 95% confidence level.
The coefficient of determination (r2) was 0.1 for DBH and 0.42 for CSD, indicating a weak interactive effect of ff and fs on both increments.
Projection of tree stem diameter distribution for the future (14 years)
The tree DBH distribution for all ff classes followed the typical inverted-J type curve of natural forests (Fig. 3). The inverted-J trend is characterised by the presence of high tree density in the young cohort, reducing as the trees age. This pattern was observed through time, including the projections for the future, despite some variations in the young cohort.
Trend of tree diameter distribution in 2005 (blue line), 2019 (orange line) and projection for 2033 (green line) in the whole forest (a), low ff (b) medium ff (c), and high ff (d) areas of NSR Miombo woodland.

Tree density observed in 2005 (259 ind. ha−1) in the first DBH class (5–10 cm) in the low ff classe increased in 2019 (283 ind. ha−1) and is predicted to register an increase of 23% by 2033 (349 ind. ha−1) (Fig. 3). A similar scenario is observed in the medium ff class, where tree density observed in the 5–10 cm diameter class in 2005 (263 ind. ha−1) increased in 2019 (266 ind. ha−1) and the projection predicted an increase of 5% by 2033 (280 ind. ha−1) (Fig. 3). However, the annual projection for high ff areas, indicates a reverse trend for the young cohort. Tree density in the 5–10 cm class diameter slightly increased from 280 ind. ha−1 in 2005 to 284 ind. ha−1 in 2019 and it is expected to decrease to 273 ind. ha−1 in 2033 (Fig. 3).
The KS adherence test revealed no statistically significant differences between the observed and projected distribution of the number of trees in each diameter class (Dcal = 0.12; Dcrit (95%) = 0.3995).
Discussion
This is the first contemporary long-term study of Miombo dynamics, with the only other known one conducted by Trapnell (1959). The results of our study revealed complex interactions between ff and fs and provided insights on the impacts of fires on Miombo vegetation composition, growth, mortality, recruitment and CSD over a 14 -year period. Our projections for the year 2033 indicated that the ecosystem is expected to maintain its DBH distribution stability. In this section we discuss these results with focus on providing insights for forest management.
Effect of fire on tree species composition
The results of the similarity test using the ANOSIM-Bray-Curtis showed significant dissimilarities between ff (P < 0.001, ANOSIM = 95%; STRESS = 0.10) or fs (P < 0.001; ANOSIM = 100% and STRESS = 0.04) in terms of species composition. These results indicate that fire had a significant role in determining tree species assemblages in the Miombo woodlands of NSR. These results also corroborate with a study conducted in central Mozambique, which revealed significant differences in plant species composition among ff clusters (P < 0.0003), with an overall average dissimilarity of 71.98% (Meneses et al. 2025).
The IndVal index confirmed (P < 0.05) the occurrence of explicit indicator species for each level of ff and fs. In general, fire-resistant species (Trapnell 1959; Frost 1996), such as D. condylocarpon, M. engleri and S. madagascariensis, were more abundant in high ff areas together with Combretaceae species (Combretum apiculatum, C. collinum and C. elaeagnoides; Ribeiro et al. 2008a; Meneses et al. 2025). Although B. boehmii and J. globiflora were considered fire-tender species by Frost (1996), they also dominated areas with a high ff in NSR. Several factors may have contributed to this pattern including the initial relatively fast growth of the species, which allows them to escape the fire trap in high ff areas. In turn, in low ff places seedlings and saplings of these species may had been removed by herbivory (Chinder et al. 2020) or outcompeted by the grass component (Ribeiro et al. 2020). However, since these factors were not addressed in this study, we cannot infer about their importance in determining species assemblages. Despite that limitation, our results are in line with previous studies documenting how ff drives tree species distribution, particularly favouring fire-adapted species (Ryan and Williams 2011; Madoffe et al. 2012; Chinder et al. 2020; Buramuge et al. 2023; Meneses et al. 2025). Therefore, our study contributes to enhancement of our understanding how tree species composition changes according to varied fire regimes in Miombo. Another limitation of this study is the fact that it did not address the effects of fire on trees’ natural regeneration, which would have added value to our compositional analysis and would have provided insights into future ecosystem direction.
Effects of fire on woody carbon stocks
Overall, independently of the ff and fs the woody CSD is within the range estimated for Miombo in NSR and in the region. For example, Ribeiro et al. (2013) estimated the woody CSD in NSR for the year 2009 to be at 30 MgC ha−1. Gumbo et al. (2018) conducted a systematic mapping of woody CSD by screening 11,565 records across the region and found an average of ~34 Mg ha−1. A recent study (Demol et al. 2024) found a much higher value, ~50 Mg ha−1 in the core area of Gile National Park of Central Mozambique, one of the most pristine areas of Miombo in Mozambique.
We found that high ff resulted in lower CSD in 2005 and 2019 and between (years 2009 and 2015) there were no effects on the Miombo's ability to store carbon. Similarly, a combination of low ff and fs resulted in higher CSD for the years 2005 and 2015, with no effects in 2009 and 2019. Several other studies have demonstrated the effects of fires on biomass and C stocks in the Miombo region (Trapnell 1959; Frost 1996; Mapaure and Campbell 2002; Bond and Keeley 2005; Furley et al. 2008; Ribeiro et al. 2008b, 2013; Ryan and Williams 2011; Meneses et al. 2025). Coetsee et al. (2010) and Gumbo et al. (2018) reported reductions of up to 26 MgC ha−1 under annual fire regimes.
The cyclic effect of fire on CSD may be attributed to variations in climatic conditions, mainly precipitation or inter-annual variations in fire return (Ribeiro 2007, 2017; Meneses et al. 2024). According to these authors, a quasi-biannual fire return in NSR and in central Mozambique was observed. This pattern may be attributed to a reduction in fuel load (mainly grass), after a fire peak year and consequently allowing trees to grow faster and thus store more C. These cyclical results were also aligned with findings that longer intervals between fires can promote vegetation regeneration and maintain higher carbon stocks (Gumbo et al. 2018).
The weak regression coefficient (r2 = 0.095), revealed that the interaction between ff and fs did not significantly explain the variations in CSD. Several studies in tropical ecosystem have reported similarly low r2 values when investigating the impact of fire on CSD. For example, Ray et al. (2023) found r2 values below 0.1 in their study on the impact of ff on tree biomass and CSD in the tropical dry deciduous forest of Panna Tiger Reserve, central India. This emphasises the importance of considering additional variables such as soil characteristics, vegetation type, and climatic factors when addressing ecological relationships.
Our study provides baseline information about the effects of fire regimes on CSD and is key from the management point of view. It indicates a need to balance ff and fs to preserve ecological integrity and carbon storage (Gumbo et al. 2018; Nieman et al. 2021).
Effects of fire on tree mortality and recruitment rates
Our results clearly showed how varying levels of fs and ff affect tree mortality and recruitment rates. Mortality rate was significantly higher in medium and high ff (2%). However, the combination of high ff and medium fs, and medium ff and high fs caused higher mortality rates. These results suggest that while high ff increases mortality, fs amplifies that effect, which may have a stronger impact on younger and/or more vulnerable trees (e.g. those impacted by elephant herbivory). In addition, we observed that a fire-prone species J. globiflora (one of the most ecologically important species in NSR and in Miombo; Ribeiro et al. 2013) was more impacted by ff than other key Miombo species (B. boehmii and D. condylocarpon). This may be associated with different degrees of species responses and adaptations to fires (Meneses et al. 2025).
Our findings support those from previous studies reporting increased tree mortality rate (up to 4.5%) as a result of frequent and intense fires in Miombo, with younger and less fire-resistant species being more susceptible (Frost 1996; Bond and Keeley 2005; Mouillot and Field 2005; Ribeiro et al. 2008a; Ryan and Williams 2011; Mganga 2016). Even though the mortality was not extremely high in our study area, it might be expected that in the long run, changes in fire regimes associated with global changes and human growth, may further increase this process, which may create imbalance in Miombo in NSR.
In terms of recruitment rates, areas with medium ff showed significanly higher value (3%) compared to low and high ff, which reveals the importance of fires in Miombo. In fact, several authors stated that fires every 4–5 years (medium ff in this study) are essential to promote plant regeneration and support the growth of smaller individuals, helping to maintain a balanced forest structure (Ryan and Williams 2011; Keane 2019). Medium and high fs produced significantly higher recruitment rates (2.25 and 2.29%, respectively) under high ff. However, high fs under low ff resulted in significantly lower recruitment rate (1.53%). The latter maybe a result of fuel load accumulation due to long periods between fires, which may create fiercer fires that impact tree growth (Ryan and Williams 2011; Mganga 2016).
The complex effects of fs and ff observed in this study may be related to several factors including methodological and environmental. With regards to the former, we assessed fs by using the ΔNBR index, which is sensitive to phenological or vegetation/soil moisture conditions before and after the fire (Arruda 2021). It is important to acknowledge that the ΔNBR is widely used to quantify fs, but its accuracy strongly depends on the quality of the satellite images and the timing of their acquisition (Miller and Thode 2007). Ideally, it should be calculated using a pre-fire image (in our case, obtained between May and June) and an image immediately after the fire event. However, due to the limited availability of high-quality images, the post-fire assessment period in this study was extended to December and January, the subsequent rain season. During this period, the vegetation had likely sufficient time to ‘refresh’ or regenerate, which may have diluted the ΔNBR response, likely resulting in an underestimation of the actual fs (Holden et al. 2005; Parks et al. 2014). However, if a fire is severe enough to negatively impact the ecosystem, vegetation recovery would not be expected at all. But in Miombo, recovery often occurs since vegetation is adapted to fires, and after the first rains it regreens quickly (Williams et al. 2008) and, consequently, influences ΔNBR. Fire severity in Miombo is a complex and an open area for further research.
Furthermore, in the context of Miombo, other environmental pressures, such as herbivory by elephants, and human activities (e.g. honey harvesting), also play a critical role in forest dynamics. These factors, however, were not considered in this study. The interaction between fires, herbivory and human activities may complicate the interpretation of results, as these factors also affect vegetation composition and structure and can alter vegetation response to fire (Chamaillé-Jammes et al. 2007; Shackleton et al. 2007).
Despite these limitations, our results still represent a valid initial exploration of the complexity of fs and ff dynamics in Miombo. They also provide valuable insights into the resilience of Miombo trees to fire. However, for a more comprehensive understanding of fs in Miombo and its long-term effects, we recommend that future studies be more detailed (e.g. controlled burning experiments), addressing not only fs but also the interaction of multiple environmental and biological factors.
Effects of fire on periodic annual increment in tree diameter and woody carbon stock density
Overall, the PAI of both DBH and woody CSD was positive for all ff and fs categories. However, PAI was significantly reduced by fire regimes, particularly by high and medium ff (Table 4) but fs did not have a significant impact on both variables. These findings suggest the current fire regimes do not represent a threat to the ecosystem, but changes, particularly in ff, may in the long run, compromise this Miombo’s structure and C stocks (Ryan and Williams 2011; Gumbo et al. 2018; Ribeiro et al. 2020; Meneses et al. 2025). Grundy (1995) also highlighted that the dynamics of forest ecosystem, including periodic increment or decrement, reflect the level of disturbance caused by various factors (including fire) impacting both forest structure and composition.
Our results of fs do not corroborate studies in the region that indicate high-intensity fires cause significant biomass loss and negatively affect tree growth (Gumbo et al. 2018; Syampungani et al. 2020). As mentioned above the method used to estimate fs has limitations, which may have influenced our results. Since the interaction between ff and fs is crucial in understanding ecosystem dynamics, we conducted a regression analysis to depict that relationship, but our results indicated that the interaction between both variables did not strongly explain PAI. Jiang et al. (2021) reported similarly low r2 values for carbon increment in their study on carbon and nitrogen dynamics in tropical ecosystem following fire. This emphasises the complexity of Miombo ecology and might be associated with the influence of other unaccounted factors as referred above (Zhang et al. 2024).
Projection of stem diameter distribution by fire frequency level
The projection made for the year 2033 forecasts an increase in tree density in the NSR’s Miombo woodlands (Fig. 3). The KS test proved that the transition model was robust. Even though the DBH distribution showed the inverse J-shaped curve typical of tropical unevenly-aged forests for all ff classes, we observed that for high ff the tree density in the young cohort (DBH: 5–10 cm) is projected to decrease by 4% in 2033. This clearly indicates that fire occurrence shapes the pattern of Miombo woodland’s structure but increased ff may compromise the ecosystem structure in the long run (Stepka et al. 2010).
It is important to note that the transition matrix used to predict the future forest structure has its limitations, including the use of data from only two observations (2005 and 2019), excluding predictions based on a multiple years and other key factors such as climate. This demonstrates a certain inflexibility of the model since possible changes in the forest’s growth pattern were not considered (Uetela and Arce 2018). However, the transition matrix revealed trustworthy predictions given the good model fit (Chamshama et al. 2004; Macia 2016; Guedes et al. 2018).
Conclusions
This is one of the first contemporary studies to report on long-term (2005–2019) relationships between fire and woody dynamics in Miombo woodlands. We found varied species assemblages associated with ff and fs levels, with fire resistant species dominating high ff places. Julbernardia globiflora, one of the key tree species in Miombo, was significantly affected by ff experiencing increased mortality rate. A monitoring and protection program for this species is recommended through the adoption of protective initiatives such as promotion of seed regeneration and ex-situ conservation.
Carbon stock density in NSR is within the range for the Miombo region and has increased over time. However, high ff reduced the carbon storage capacity in this area. Mortality rates were significantly higher under medium and high ff, and fs amplified the effect. Medium ff resulted in increased recruitment rates during the period of study. The periodic increment in DBH and CSD was positive, but the magnitude reduced with increased ff. The projection made for the year 2033 showed an increase in tree density per unit area over time in areas of low ff, but a decrease of young trees’ (DBH: 5–10 cm) density with high ff. This may compromise the ecosystem structure stability in the future.
Overall our results are interesting from the point of view of Miombo dynamics in protected areas. Despite the occurrence of fire, management efforts in the area including limitation of other human activities such as agriculture, charcoal, among others, may help maintaining the ecosystem integrity. The results suggest that fire management to keep ff at low to medium ff and fs is important to maintain ecosystem stability. A rigorous fire management program would entail implementing early dry season controlled burnings as an alternative to reduce fuel load, particularly in places where fires occur annually. In fact, given the size (42,000 km2) of NSR, it is expected that different areas may need different strategies. Maintaining medium intervals between fires (4–5 years) and controlling fs are essential to optimise the carbon sequestration capacity of this ecosystem while promoting vegetation regeneration and growth. This will improve the contribution of this important protected area to mitigating the effects of climate change and conserve Miombo’s wealth of biodiversity. Finally, for a comprehensive understanding of the ecosystem dynamics, we recommend that future studies based on controlled burning incorporate multiple factors including environmental (climate and soil) and other disturbances (herbivory) as well as natural regeneration.
Data availability
The data that support this study will be shared upon reasonable request to the corresponding author.
Declaration of funding
This work was funded by the Swedish International Cooperation Agency (SIDA) under the UEM-Sweden Program 2017–2022, and by FCT – Fundação para a Ciência e Tecnologia, I.P. by project reference UIDB/00239/2020 of the Forest Research Centre, DOI 10.54499/UIDB/00239/2020 and LA/P/0092/2020 of Associate Laboratory TERRA, DOI 10.54499/LA/P/0092/2020; UID/BIA/00329/2021 (cE3c) (DOI 10.54499/UIDB/00329/2020). Additional co-funding was provided by the USAID Partnership for Enhanced Engagement in Research (PEER; Project 8-173) and Fundo de Investigação Aplicada e Multisectorial (FIAM-UEM).
Acknowledgements
The authors would like to thank all the contributors to this study such as the extinct Sociedade para a gestão e desenvolvimento da Reserva do Niassa, the Wildlife Conservation Society and the National Administration of Protected Areas in Mozambique, the late Balde Chande for his insights into Miombo ecology, and the rangers and field guides involved in field data collection.
Author contributions
NR conceptualised the research, supervised data analysis and wrote the paper; SM conducted field work and data analysis; VB supported data analysis; all the other authors contribute to the Manuscript development.
References
Allan JR, Grossmann F, Craig R, Nelson A, Maina J, Flower K, Watson JEM (2017) Patterns of forest loss in one of Africa’s last remaining wilderness areas: Niassa national reserve (northem Mozambique). Parks 23(2), 40-50.
| Crossref | Google Scholar |
Archibald S, Scholes RJ, Roy DP, Roberts G, Boschetti L (2010) Southern African fire regimes text dynamics in African savannas. Ecological Applications 15(4), 1331-1341.
| Crossref | Google Scholar |
Arruda VLS (2021) An alternative approach for mapping burn scars using Landsat imagery, Google Earth Engine, and Deep Learning in the Brazilian Savanna. Remote Sensing Applications: Society and Environment 22, 100472.
| Crossref | Google Scholar |
Bataineh AL, Oswald BP, Bataineh MM, Williams HM, Coble DW (2006) Changes in understory vegetation of a ponderosa pine forest in northern Arizona 30 years after a wildfire. Forest Ecology and Management 235(1–3), 283-294.
| Crossref | Google Scholar |
Bond WJ, Keeley JE (2005) Fire as a global “herbivore”: the ecology and evolution of flammable ecosystems. Trends in Ecology and Evolution 20(7), 387-394.
| Crossref | Google Scholar | PubMed |
Brown S, Gillespie AJR, Lugo AE (1989) Biomass estimation methods for tropical forests with applications to forest inventory data. Forest Science 35, 881-902.
| Crossref | Google Scholar |
Buramuge VA, Ribeiro NS, Olsson L, Bandeira RR, Lisboa SN (2023) Tree species composition and diversity in fire-affected areas of Miombo Woodlands, Central Mozambique. Fire 6, 26.
| Crossref | Google Scholar |
Burgess EE, Moss P, Haseler M, Maron M (2015) The influence of a variable fire regime on woodland structure and composition. International Journal of Wildland Fire 24(1), 59-69.
| Crossref | Google Scholar |
Chamaillé-Jammes S, Fritz H, Murindagomo F (2007) Managing heterogeneity in elephant distribution: interactions between elephant population density and surface-water availability. Diversity and Distributions 13(6), 685-695.
| Google Scholar |
Chamshama SAO, Mugasha AG, Zahabu E (2004) Stand biomass and volume estimation for Miombo woodlands at Kitulangalo, Morogoro, Tanzania. The Southern African Forestry Journal 200(1), 59-70.
| Crossref | Google Scholar |
Chinder GB, Hattas D, Massad TJ (2020) Growth and functional traits of Julbernardia globiflora (Benth) resprouts and seedlings in response to fire frequency and herbivory in Miombo woodlands. Southern Africa Journal of Botany 135, 476-493.
| Crossref | Google Scholar |
Clarke KR (1993) Non-parametric multivariate analyses of changes in community structure. Australian Journal of Ecology 18, 117-143.
| Crossref | Google Scholar |
Clarke KR, Green RH (1988) Statistical design and analysis for a ’biological effects’ study. Marine Ecology Progress Series 46, 213-226.
| Crossref | Google Scholar |
Coetsee C, Bond WJ, February EC (2010) Frequent fire affects soil nitrogen and carbon in an African savanna by changing woody cover. Oecologia 162(4), 1027-1034.
| Crossref | Google Scholar | PubMed |
De Cáceres M, Legendre P, Wiser SK, Brotons L (2012) Using species combinations in indicator value analyses. Methods in Ecology Evolution 3, 973-982.
| Crossref | Google Scholar |
Demol M, Aguilar-Amuchastegui N, Bernotaite G, Disney M, Duncanson L, Elmendorp E, Espejo A, Furey A, Hancock S, Hansen J, Horsley H, Langa S, Liang M, Locke A, Manjate V, Mapanga F, Omidvar H, Parsons A, Peneva-Reed E, Perry T, Puma Vilca VL, Rodríguez-Veiga P, Sutcliffe C, Upham R, de Walque B, Burt A (2024) Multi-scale lidar measurements suggest Miombo woodlands contain substantially more carbon than thought. Communications Earth & Environment 5, 366.
| Crossref | Google Scholar |
Dziba L, Ramoelo A, Ryan C, Harrison S, Pritchard R, Tripathi H, Sitas N, Selomane O, Engelbrecht F, Pereira L (2020) Scenarios for just and sustainable futures in the Miombo woodlands. In ‘Miombo woodlands in a changing environment: Securing the resilience and sustainability of people and woodlands’. (Eds NS Ribeiro, Y Katerere, PW Chirwa, IM Grundy) pp. 191–234. (Springer Nature: Switzerland)
Eidenshink J, Schwind B, Brewer K, Zhu Z-L, Quayle B, Howard S (2007) A Project for Monitoring Trends in Burn Severity. Fire Ecology 3(1), 3-21.
| Crossref | Google Scholar |
Furley PA, Rees RM, Ryan CM, Saiz G (2008) Savanna burning and the assessment of long-term fire experiments with particular reference to Zimbabwe. Progress in Physical Geography 32(6), 611-634.
| Crossref | Google Scholar |
Gorelick N, Hancher M, Dixon M, Ilyushchenko S, Thau D, Moore R (2017) Google Earth Engine: Planetary-scale geospatial analysis for everyone. Remote Sensing of Environment 202, 18-27.
| Crossref | Google Scholar |
Guedes SB, Sitoe AA, Olsson B (2018) Allometric models for managing lowland Miombo woodlands of the Beira corridor in Mozambique. Global Ecology and Conservation 13, e00374.
| Crossref | Google Scholar |
Gumbo D, Clendenning J, Martius C, Moombe K, Grundy I, Nasi R, Ribeiro N, Mumba KY, Kabwe G, Petrokofsky G (2018) How have carbon stocks in central and southern Africa’s Miombo woodlands changed over the last 50 years? A systematic map of the evidence. Environmental Evidence 7, 16.
| Crossref | Google Scholar |
Holden ZA, Smith AMS, Morgan P, Rollins MG, Gessler PE (2005) Evaluation of novel thermally enhanced spectral indices for mapping fire perimeters and comparisons with fire atlas data. International Journal of Remote Sensing 26(21), 4801-4808.
| Crossref | Google Scholar |
International Panel on Climate Change (IPCC) (2007) Climate Change 2007: Synthesis Report. Contribution of Working Groups I, II and III to the Fourth Assess- ment Report of the Intergovernmental Panel on Climate Change (Eds Core Writing Team, RK Pachauri, A Reisinger). 104 pp. (IPCC: Geneva, Switzerland)
Jiang D, Chonghua X, Xia X, Yiqi L, Chen C, Chenghui J, Zheng S, Honghua R (2021) Carbon and nitrogen dynamics in tropical ecosystems following fire. Global Ecology and Biogeography 31(4), 378-391.
| Crossref | Google Scholar |
Jodhani KH, Patel H, Soni U, Patel R, Valodara B, Gupta N, Omar P (2024) Assessment of forest fire severity and land surface temperature using Google Earth Engine: a case study of Gujarat State, India. Fire Ecology 20(1), 23.
| Crossref | Google Scholar |
Keane RE (2019) Fire frequency and severity influence the distribution, structure, and functioning of terrestrial ecosystems. Ecological Applications 29(6), e01949.
| Crossref | Google Scholar |
Keeley J E (2009) Fire intensity, fire severity and burn severity: a brief review and suggested usage. International Journal of Wildland Fire 18(1), 116-126.
| Crossref | Google Scholar |
Key CH, Benson NC (2006) Landscape Assessment: Ground measure of severity, the Composite Burn Index; and Remote sensing of severity, the Normalized Burn Ratio. In ‘FIREMON: Fire Effects Monitoring and Inventory System’. (Eds DC Lutes, RE Keane, JF Caratti, CH Key, NC Benson, S Sutherland, LJ Gangi) pp. LA 1–51. (USDA Forest Service, Rocky Mountain Research Station: Ogden, UT)
Lawton RM (1982) Natural resources of Miombo woodland and recent changes in agricultural and land-use practices. Forest Ecology and Management 4, 287-297.
| Crossref | Google Scholar |
Luiz R, Ferreira C, Marangon LC, Felix R, Junior C, Silva SDO (2010) Utilização do quociente de liocourt na avaliação da distribuição diamétrica em fragmentos de floresta ombrófila aberta em Pernambuco. Ciencia Florestal 20, 307-319.
| Crossref | Google Scholar |
Macave OA, Ribeiro NS, Ribeiro AI, Chaúque A, Bandeira R, Branquinho C, Washington-Allen R (2022) Modelling aboveground biomass of Miombo Woodlands in Niassa Special Reserve, Northern Mozambique. Forests 13(2), 311.
| Crossref | Google Scholar |
Maillard O, Ribeiro N, Armstrong A, Ribeiro-Barros AI, Andrew SM, Amissah L, Shirvani Z, Muledi J, Abdi O, Azurduy H, Silva JMN, Syampungani S, Shamaoma H, Buramuge V (2025) Seasonal spatial-temporal trends of vegetation recovery in burned areas across Africa. PLoS One 20(2), e0316472.
| Crossref | Google Scholar | PubMed |
Makumbe P, Chikorowondo G, Dzamara PC, Ndaimani H, Gandiwa E (2020) Effects of fire frequency on woody plant composition and functional traits in a wet savanna ecosystem. International Journal of Ecology 2020, 1672306.
| Crossref | Google Scholar |
Mapaure IN, Campbell BM (2002) Changes in Miombo woodlands cover in and around Sengwa Wildlife Research Area, Zimbabwe, in relation to elephants and fire. African Journal of Ecology 40, 212-219.
| Crossref | Google Scholar |
Meneses OM, Ribeiro NS, Shirvani Z, Andrew SM (2024) Spatio-temporal analysis of wildfire regimes in Miombo of the LevasFlor Forest Concession, Central Mozambique. Fire 7, 5-17.
| Crossref | Google Scholar |
Meneses OM, Ribeiro NS, Shirvani Z, Andrew SM (2025) Resilience of the Miombo Woodland to different fire frequencies in the LevasFlor Forest Concession, Central Mozambique. Forests 16, 11-24.
| Crossref | Google Scholar |
Mganga ND (2016) Plant Species Diversity in Western Tanzania: Comparison between Frequently Burnt and Fire Suppressed Forests. International Journal of Pure & Applied Bioscience 4(3), 28-44.
| Crossref | Google Scholar |
Miller JD, Thode AE (2007) Quantifying burn severity in a heterogeneous landscape with a relative version of the delta Normalized Burn Ratio (dNBR). Remote Sensing of Environment 109(1), 66-80.
| Crossref | Google Scholar |
Mittermeier RA, Mittermeier CG, Brooks TM, Pilgrim JD, Konstant WR, da Fonseca GAB, Kormos C (2003) Wilderness and biodiversity conservation. Proceedings of the National Academy of Sciences 100(18), 10309-10313.
| Crossref | Google Scholar | PubMed |
Mouillot F, Field CB (2005) Fire history and the global carbon budget: a 1×1 fire history reconstruction for the 20th century. Global Change Biology 11(3), 398-420.
| Crossref | Google Scholar |
Nieman WA, Van Wilgen BW, Leslie AJ (2021) A review of fire management practices in African savanna-protected areas. Koedoe 63(1), a1655.
| Crossref | Google Scholar |
Parks SA, Holsinger LM, Miller C, Nelson CR (2014) Relationships between climate, topography, and fire occurrence in a ponderosa pine-dominated landscape. Forest Ecology and Management 334, 201-211.
| Crossref | Google Scholar |
Ray T, Malasiya D, Verma S, Kumar T, Khan ML (2023) Impact of forest fire frequency on tree biomass and carbon stocks in the tropical dry deciduous forest of Panna Tiger Reserve, Central India. Tropical Ecology 64, 337-351.
| Crossref | Google Scholar |
Ribeiro NS, Shugart HH, Washington-allen R (2008a) The effects of fire and elephants on species composition and structure of the Niassa Reserve, northern Mozambique. Forest Ecology and Management 255, 1626-1636.
| Crossref | Google Scholar |
Ribeiro NS, Saatchi SS, Shugart HH, Washington-Allen RA (2008b) Aboveground biomass and leaf area index (LAI) mapping for Niassa Reserve, northern Mozambique. Journal of Geophysical Research: Biogeosciences 113(3), G02S02.
| Crossref | Google Scholar |
Ribeiro N, Okin G, Swap RJ, Shugart HH (2009) The influence of rainfall, vegetation, elephants and people on fire frequency of Miombo. In ‘International Geoscience and Remote Sensing Symposium (IGARSS), Vol. 4’. pp. IV-322–IV-325. 10.1109/IGARSS.2009.5417378
Ribeiro NS, Matos CN, Moura IR, Washington-Allen RA, Ribeiro AI (2013) Monitoring vegetation dynamics and carbon stock density in Miombo woodlands. Carbon Balance and Management 8(1), 11.
| Crossref | Google Scholar | PubMed |
Ribeiro NS, Cangela A, Chauque A, Bandeira RR, Ribeiro-Barros AI (2017) Characterisation of spatial and temporal distribution of the fire regime in Niassa National Reserve, northern Mozambique. International Journal of Wildland Fire 26, 1021-1029.
| Crossref | Google Scholar |
Ribeiro N, Ruecker G, Govender N, Macandza V, Pais A, Machava D, Chauque A, Lisboa SN, Bandeira R (2019) The influence of fire frequency on the structure and botanical composition of savanna ecosystems. Ecology and Evolution 9, 8253-8264.
| Crossref | Google Scholar | PubMed |
Ribeiro NS, Armstrong AH, Fischer R, Kim YS, Shugart HH, Ribeiro-Barros AI, Chauque A, Tear T, Washington-Allen R, Bandeira RR (2021) Prediction of forest parameters and carbon accounting under different fire regimes in Miombo woodlands, Niassa Special Reserve, Northern Mozambique. Forest Policy and Economics 133, 102625.
| Crossref | Google Scholar |
Ryan CM, Williams M (2011) How does fire intensity and frequency affect Miombo woodland tree populations and biomass? Ecological Applictions 21, 48-60.
| Crossref | Google Scholar | PubMed |
Ryan C, Pritchard R, McNico I, Owen M, Fisher JA, Lehmann C (2016) Ecosystem services from Southern African woodlands and their future under global change. Philosophical Transations of the Royal Society of London B 371, 20150312.
| Crossref | Google Scholar |
Sanquetta CR, Brena DA, Angelo H, Mendes JB (1996) Matriz de transição para simulação da dinâmica de florestas naturais sob diferentes intensidades de corte. Ciência Florestal 6(1), 65-78.
| Crossref | Google Scholar |
Shackleton CM, Timmermans HG, Nongwe N, Hamer N, Palmer R (2007) Exploring the options for fuelwood policies to support poverty alleviation policies: evolving dimensions in South Africa. Forests, Trees and Livelihoods 17(3), 269-292.
| Crossref | Google Scholar |
Stepka TF, Dias NA, Filho AF, Machado AS, Sawczuk AR (2010) Prognose da estrutura diamétrica de uma Floresta Ombrófila Mista com os métodos razão de movimentos e matrizes de transição. Pesquisa Florestal Brasileira 30(64), 327-335.
| Crossref | Google Scholar |
Syampungani S, Chirwa PW, Akinnifesi FK, Sileshi G, Ajayi OC (2009) The Miombo woodlands at the cross roads: potential threats, sustainable livelihoods, policy gaps and challenges. Natural Resources Forum 33, 150-159.
| Crossref | Google Scholar |
Syampungani S, Chirwa PW, Geldenhuys CJ, Handavu F, Chishaleshale M, Rija AA, Mbanze A A, Ribeiro NS (2020) Managing Miombo: ecological and silvicultural options for sustainable socio-economic benefits. In ‘Miombo Woodlands in a changing environment: Securing the resilience and sustainability of people and woodlands’ (Eds NS Ribeiro, Y Katerere, PW Chirwa, IM Grundy) (Springer: Switzerland). pp. 101–138. 10.1007/978-3-030-50104-4
Trapnell CG (1959) Ecological results of woodland and burning experiments in Northern Rhodisia. Journal of Ecology 47, 129.
| Crossref | Google Scholar |
Uetela AE, Arce JE (2018) ‘Dynamic and Production Prognosis of a Miombo Forest, using Transition Matrices in Pindanyanga-Manica.’ (Academic Star Publishing Company) 10.15341/mese(2333-2581)/10.04.2018/003.
UN-SPIDER (2025) ‘Normalized Burn Ratio (NBR).’ (United Nations Platform for Space-based Information for Disaster Management and Emergency Response) Retrieved from UN-SPIDER Knowledge Portal.
Williams C, Reichstein M, Buchmann N, Baldocchi D, Beer C, Schwalm C, Wohlfahrt G, Hasler N, Bernhofer C, Foken T (2008) Climate and vegetation controls on the surface water balance: synthesis of evapotranspiration measured across a global network of flux towers. Water Resources Research 48, W06523.
| Crossref | Google Scholar |
Zhang T, Hu Y, Guan S, Zhu M, Lei T, Hu H (2024) Spatiotemporal changes and influencing factors of ecosystem services in the Nanchang metropolitan area, China. Frontiers in Ecology and Evolution 12, 1470912.
| Crossref | Google Scholar |