

Scat DNA as a non-invasive method for estimating the abundance of the vulnerable mala (Lagorchestes hirsutus)
Shannon Treloar A * , Cheryl Lohr B , Anna J. M. Hopkins A , Kym Ottewell B , Shelley McArthur B and Robert A. Davis A
A Centre for Ecosystem Management, School of Science, Edith Cowan University, 270 Joondalup Drive, Joondalup, WA 6027, Australia.
B Biodiversity and Conservation Science, Department of Biodiversity Conservation and Attractions, Locked Bag 104, Bentley Delivery Centre, Bentley, WA 6983, Australia.
Abstract
Population-monitoring programs often use direct (e.g. live capture or spotlighting) or indirect (e.g. scats sightings) observations to estimate population abundance. Such methods, however, are often inadequate for rare, elusive, or cryptic species due to the difficulty in achieving sufficient encounters or detection rates. The mala (Lagorchestes hirsutus), a small native Australian macropod, listed as Vulnerable by the IUCN, is difficult to capture, susceptible to capture myopathy, and not easily sighted in their dense habitat; consequently, the population size cannot always be estimated. The use of molecular markers to identify individual genotypes from non-invasively collected samples is increasingly being used in wildlife conservation and may be an alternative approach for mala.
The aim of this study was to evaluate the efficacy of non-invasive scat DNA sampling to estimate the population abundance of mala.
A panel of microsatellite markers was developed for the identification of individual mala via profiling of their scats. Scats were systematically collected from a wild mala population located in an 1100-ha fenced reserve in Western Australia. Individual genotypes were determined using the microsatellite markers, and the abundance of mala was estimated using the genotypes with spatially explicit capture–recapture (SECR) and mark–resight analyses.
The genetic markers proved variable and with sufficient exclusionary power to confidently identify unique individuals (mean locus genotyping error rate: 3.1%). Individual genetic identification from scat sampling, when used with traditional mark–recapture/resight analytical models, provides feasible estimates of population abundance. This is the first reliable abundance estimate of this mala population, suggesting a >70% increase in population size since the initial reintroduction of 64 individuals in 2011–13.
Given the inherent difficulties in surveying mala, this approach would be valuable to ensure effective monitoring of the few remaining fenced and island mala populations to prevent further decline of this vulnerable species.
This is the first study to identify species-specific microsatellite markers for mala and use genetic-capture sampling with scat DNA to estimate the abundance of a mala population. The study provides an evaluation of a valuable species monitoring technique that can be applied to other rare, elusive, or cryptic threatened species.
Keywords: abundance, arid zone, cryptic species, eDNA, environmental DNA, fenced reserve, mala, scat.
Introduction
Population parameters such as abundance, sex ratio, fecundity, survival, distribution, and genetic diversity are important data required to support effective conservation and management of endangered wildlife. Abundance estimates especially are a critical parameter required by wildlife managers, and are used for monitoring the size and status of extant populations to determine the conservation status of species (IUCN 2012) and identify critical habitat that requires conservation attention (Newson et al. 2008). Abundance estimates also assist in identifying the ecological determinants of rarity and population responses to environmental stochasticity or disturbances (Possingham et al. 1994), often highlighting knowledge gaps regarding species ecology and assisting in developing hypotheses for empirical testing (Reed et al. 1998). Without information on population abundance, and trends over time, conservation efforts and management decisions cannot be optimised.
Traditional methods for estimating population abundance are based on either direct observations of individuals or indirect observations such as scat counts and track sightings (Piggott and Taylor 2003a). Such methods are effective for many animals, but are often inadequate for rare, elusive, or cryptic species (McDonald 2004). It is often difficult to achieve sufficient encounters or detection rates, resulting in underestimates of species abundance (Piggott and Taylor 2003a; DeMars et al. 2015). Detectability may be further influenced by trap avoidance (Laurance 1992; Schipper 2007) or trap exclusion by another species (Sims et al. 2017), or be strongly biased towards a particular demographic group, resulting in inaccurate estimates of abundance across a population (Kay et al. 2000; Harmsen et al. 2011). The lack of ability to discriminate individuals using indirect methods such as scat counts can overestimate abundance, as demonstrated by reports of a small colony of brush-tailed rock-wallabies (Petrogale penicillata penicillata) surviving in the Grampians, Victoria, when only a single animal actually remained (Piggott and Taylor 2003a). Overestimates can lead to drastic consequences for rare species, such as a lack of conservation prioritisation, potentially resulting in local or global extinctions (McDonald 2004).
Significant effort has been made to develop reliable, cost-effective monitoring techniques where direct observations or live captures are not feasible due to inaccessible habitat (Eggert et al. 2003; Piggott et al. 2006), cryptic behaviour of target species or where risks to animal welfare in capture-sensitive species are high (Banks et al. 2003). The use of molecular markers to identify individuals from non-invasively collected samples (‘genetic fingerprinting’) is increasingly being used in wildlife conservation (Piggott and Taylor 2003a; Roon et al. 2005; Ferreira et al. 2018). Non-invasive sources of DNA, or environmental DNA samples that have been used for estimating the abundance of rare wildlife, include urine, regurgitates, feathers, egg shells, snake skins, and skulls in owl pellets, with hair and faeces being common sources (Thomson 2004). Once processed, each scat sample can be considered a ‘capture event’, and with this, the population size can be estimated using capture-mark–recapture analyses (Piggott et al. 2006; Dziminski et al. 2021). The use of scat DNA has proved more cost-effective and safer than traditional sampling methods for large, dangerous or difficult to capture species, including brown bears (Bellemain et al. 2005), Arabian leopards (Perez et al. 2006), and red foxes (Wegge et al. 2019). Scat DNA sampling can also be more cost-effective for surveying species at low densities with large home ranges because broad scale live-capture may be resource-intensive (Ruibal et al. 2009).
DNA sampling methods, however, are not infallible, and there is one major limitation that must be assessed via pilot studies for each new study species prior to using the method as a monitoring tool (Banks and Piggott 2022). DNA recovered from scats is often of low quantity and quality (Carpenter and Dziminski 2017), resulting in a high risk of genotyping errors (allelic dropout and false alleles) (Piggott and Taylor 2003a). Such genotyping errors lead to misidentification of individuals and false matches, and subsequently to biased population estimates (Eggert et al. 2003). Genotyping errors can be identified and minimised through additional laboratory practices (e.g. performing multiple replicates of samples) or by only collecting recently deposited scats to minimise DNA degradation (Carpenter and Dziminski 2017). However, such measures can become very time consuming and costly if there are many samples, or if genotyping errors are frequent with the DNA source (Ruibal et al. 2009). Therefore, it is important to evaluate whether non-invasive DNA sampling is the most effective approach for detecting individuals in a population.
The rufous hare-wallaby (Lagorchestes hirsutus Gould, 1844), listed as Vulnerable by the IUCN (Burbidge and Woinarski 2016), is a small macropod that was once distributed throughout much of Australia’s central and western arid and semi-arid regions (Van Dyck and Strahan 2008). There are three subspecies of rufous hare-wallaby: Lagorchestes hirsutus hirsutus Gould, 1844 formerly occurred in south-western Australia but is now listed as extinct (Van Dyck and Strahan 2008); Lagorchestes hirsutus bernieri Thomas, 1907 occurs only on Bernier, Dorre, and Dirk Hartog Islands in WA (Cowen et al. 2018); and Lagorchestes hirsutus unnamed subsp. (referred to as mala) once occurred on central mainland Australia, but is now extinct in the wild and only occurs on Trimouille Island in the Montebello Islands Archipelago, Western Australia (WA) where they were translocated in 1998 (Van Dyck and Strahan 2008), and in several predator-free fenced reserves in WA and the Northern Territory (Richards 2012).
Continuous monitoring is essential for the management and ongoing survival of the remaining mala populations (Richards 2012). Non-invasive monitoring approaches are preferred for mala because they are difficult to capture and vulnerable to the potentially fatal disorder capture myopathy, which can be induced by stressors such as trapping and handling (Morris et al. 2004; Cowen et al. 2018). The related subspecies, rufous hare-wallaby (L. h. bernieri), has predominantly been surveyed via spotlighting and distance sampling (Short and Turner 1992; Short et al. 1998; Sims et al. 2019). However, spotlight surveys are of limited use in dense vegetation because animals are difficult to sight, leading to a lack of observations required to generate reasonable detection probabilities for distance sampling analysis (minimum n = 60; Buckland et al. 2001; Sims et al. 2017, 2019). This is the case for the fenced mala (or mantanalgu Burbidge et al. 1988) population that is located on the Matuwa Indigenous Protected Area (hereafter referred to as Matuwa) in central WA. In 10 years, a maximum of 13 mala have been sighted via spotlight transects in the enclosure due to dense spinifex grassland. Additionally, only seven recaptures have occurred in 10 years of annual cage trapping surveys, with a maximum known-to-be-alive estimate in 2017 of four. Low capture rates are likely due to trap shyness and the presence of large populations of gregarious boodies (Bettongia lesueur) and golden bandicoots (Isoodon auratus) (Sims et al. 2017). Consequently, there are currently no survey methods in place at Matuwa to monitor the mala population, and the population size is unknown.
The aim of this study was to evaluate the efficacy of non-invasive scat DNA sampling to estimate the population abundance of mala. Specifically, our objectives were to:
Materials and methods
Study site and sampling design
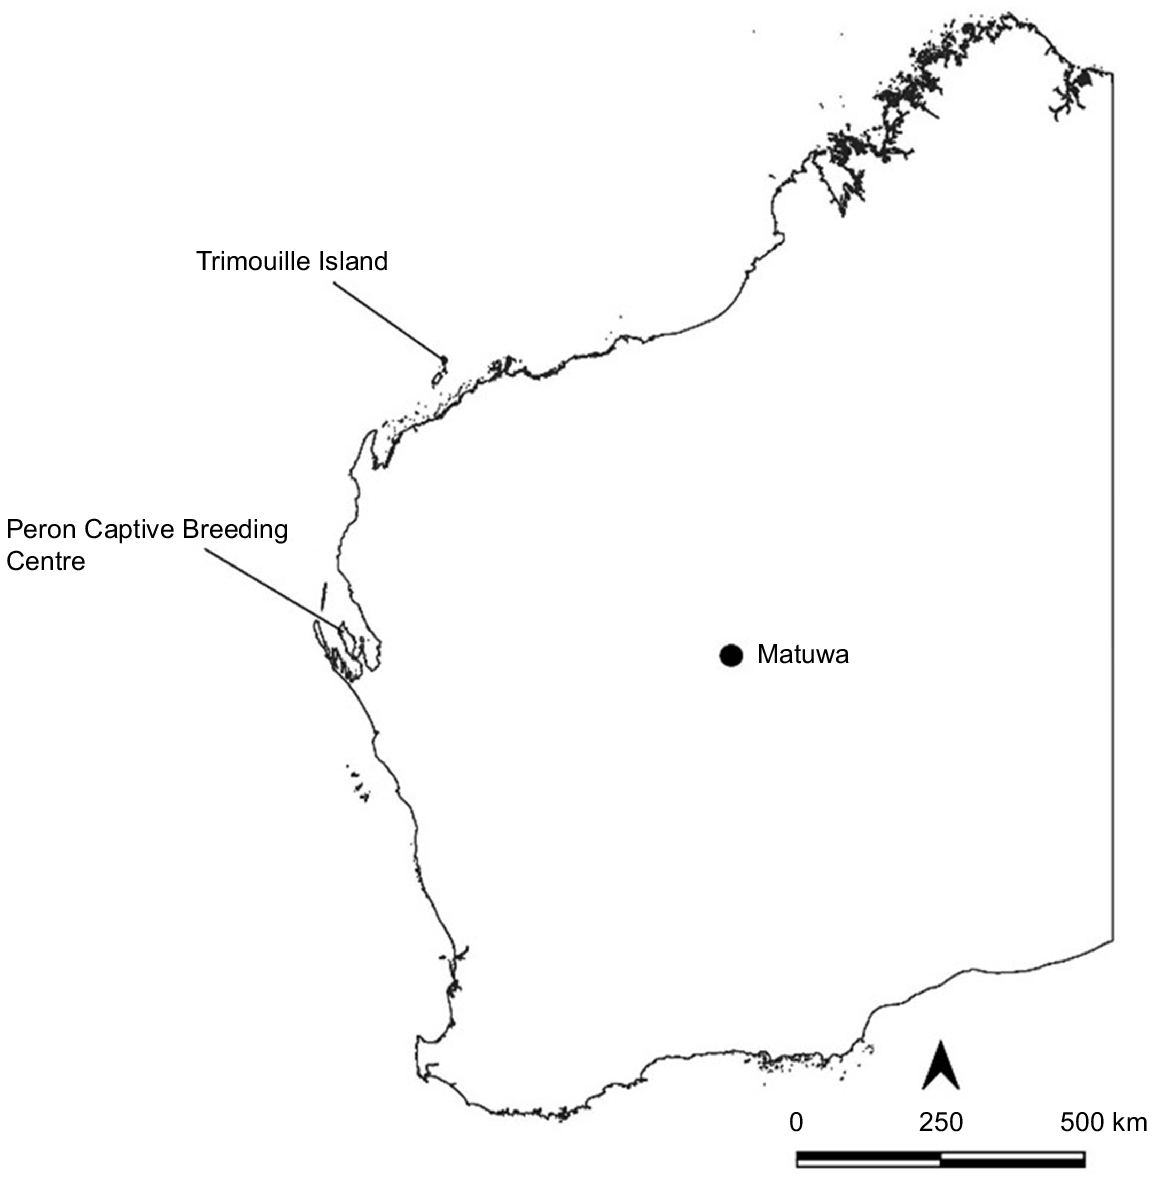
Scat samples were collected from the mala population located in the 1100-ha non-native predator-free fenced area on the Matuwa Indigenous Protected Area in central WA, previously known as the Lorna Glen pastoral lease (26°13′32.0″S 121°33′25.3″E) (Fig. 1). The species was first reintroduced into the fenced area in 2011, with 34 individuals translocated from Trimouille Island WA. A further 12 individuals from Trimouille Island were translocated in 2012, and 22 individuals from the Peron Captive Breeding Centre WA were translocated in 2013 (Lohr 2019).
Map of Western Australia, indicating the location of Matuwa (study site) and the locations of translocation source populations: Trimouille Island and Peron Captive Breeding Centre.
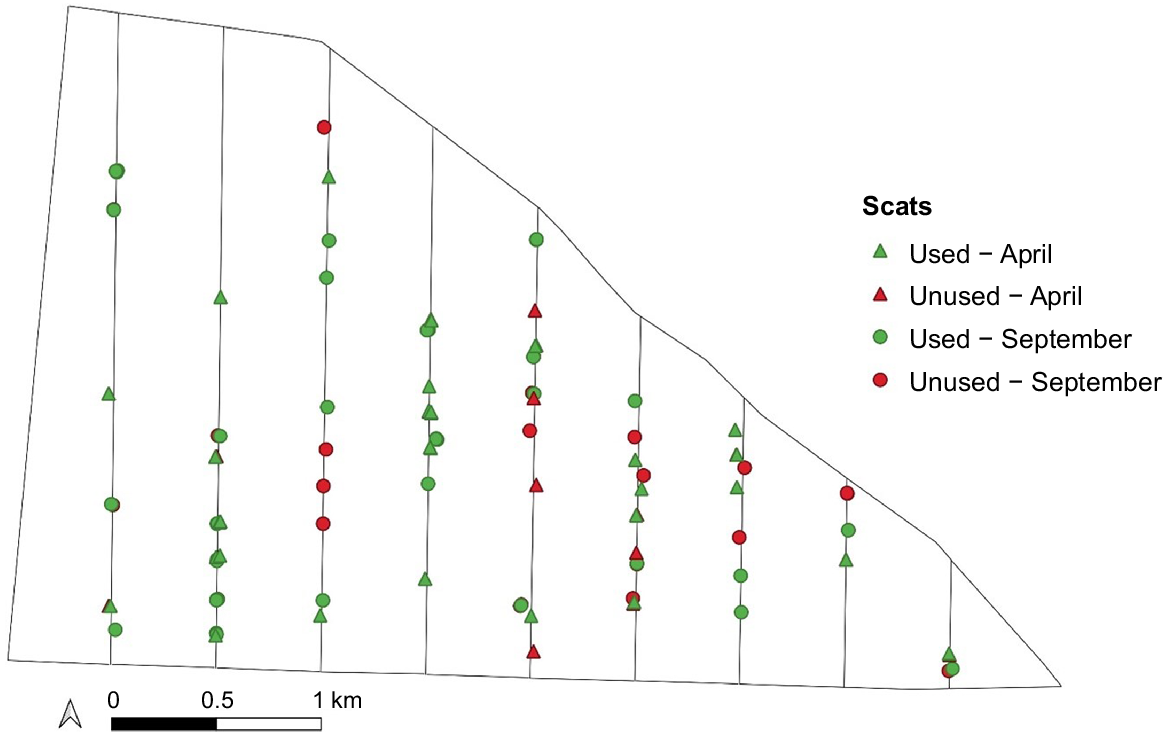
Sampling was carried out over two 4-day sessions in April (autumn, wet season) and September (spring, dry season) 2019, enabling assessment of the difference in genotyping success between seasons. Scats were collected at 150-m intervals (totalling 108 collection plots) along nine parallel north–south transects spaced approximately 500 m apart (Fig. 2), ensuring coverage of the entire study area and habitat types. All transects were sampled once per session. Only scats that appeared fresh (i.e. shiny mucus coating and no cracks, c.f. Triggs 2004) were collected from within a 5-m radius of the stopping point with forceps sterilised between each sample collection using household bleach and distilled water to avoid cross-contamination. Scat samples were placed separately in 5-mL plastic vials, transported on ice, and stored in a freezer at −18°C until DNA extraction (Piggott and Taylor 2003b). Mala scats were easily discernible from the scats of co-occurring species due to their unique shape (Triggs 2004). Seventy-two scats were collected for genetic fingerprinting. An additional 40 scats collected for dietary analysis (Treloar 2022) and not genotyped were treated as ‘unmarked’ sightings of individuals in the mark–resight abundance estimates, resulting in a total of 112 samples for analysis (Fig. 2).
Map of the fenced area at Matuwa, showing the nine transects and the mala scats that were collected. Colours indicate the scats that were used for genetic fingerprinting from April (autumn, green triangle) and September (spring, green circle) and scats that were not used for genetic fingerprinting from April (autumn, red triangle) and September (spring, red circle). These latter samples were included as unmarked sightings of individuals in recapture analyses.
DNA extraction
DNA extraction of all samples was carried out within 3 months of the September sampling session. To maximise DNA from the mucosal cells of the source animal, the outer layer of the pellet was gently scraped using a scalpel, then surface material suspended in 800 μL of stool lysis buffer (Deuter et al. 1995) by vortexing briefly on a Tissue Lyser (Qiagen, Hilden, Germany). To remove coarse material, the solution was then centrifuged for 2 min at 21 952g, and DNA extraction performed on 300 μL of the supernatant using the Mag-Bind® Stool DNA 96 Kit following the manufacturer’s standard protocol (Omega Bio-Tek, Norcross, GA, USA).
Identification of microsatellite loci
We developed nine novel microsatellite loci (RHW01, RHW10, RHW18, RHW12, RHW20, RHW240, RHW26, RHW09, RHW4) for genetic fingerprinting of mala using a single mala (L. hirsutus unnamed subsp.) tissue sample obtained from the Peron Captive Breeding Facility (Tissue no. T4480), Western Australia by The Department of Biodiversity Conservation and Attractions. An additional three microsatellite loci (BHW37 BHW17, BHW35) identified in the related banded hare-wallaby (Lagostrophus fasciatus fasciatus (Peron & Lesueur, 1807), but known to amplify in mala, were sourced from Cowen et al. (2022). DNA was extracted from the tissue sample using a standard salting-out extraction protocol (Sunnucks and Hales 1996) with the addition of 3 μL 10 mg/mL RNase to the TNES buffer (Tris, NaCl, ethylenediaminetetraacetic acid, sodium dodecyl sulfate) to remove RNA contamination, and sent to the Monash University Malaysia genomics facility (Petaling Jaya, Selangor, Malaysia) for library preparation and sequencing. Briefly, the library was prepared using a NEBnext Ultra DNA preparation kit for Illumina (New England Biolabs, Ipswich, MA, USA) following the manufacturer’s protocol and sequenced on the Illumina Miseq desktop sequencer (Illumina, San Diego, CA, USA). We generated 425 905 paired-end reads and, in total, 118 loci were identified as containing microsatellites with a minimum five repeats using QDD v3.1 software (Meglécz et al. 2014). Forty-eight loci were selected for further testing after applying the following filters: PCR product size (90–300 bp); repeat length (7–10 repeats); repeat class (A); motif length (2–6); remove AT motifs; PR class (>0); difference between left and right primer Tm < 1; large High End Stability; and primer penalty <3. The 48 selected loci were screened for amplification and polymorphism on a panel of six L. hirsutus samples, including two from mainland Australia (T03347, T04448), two from Bernier Island (T04384, T04387), and two from Dorre Island (T03402, T03404) to encompass all populations of the species. Screening of loci was performed on an Eppendorf Mastercycler ep (Eppendorf, Hamburg, Germany) using 15 μL reaction mixes containing ~5 ng DNA, 1× Taq polymerase buffer (50 mM KCl, 20 mM Tris-HCl pH 8.4), 2 mM each deoxynucleotide triphosphate, 2 μM of forward and reverse primers, 3 mM MgCl2 and 0.1 μL of Taq DNA polymerase, with PCR cycling conditions as follows: 96°C for 2 min followed by 30 cycles of 95°C for 30s, 56°C for 30s, 72°C for 30s, and final extension at 72°C for 5 min. PCR products were visualised on an 8% polyacrylamide gel. Those that amplified cleanly and were polymorphic across samples were labelled with fluorescent dyes and arranged into PCR multiplexes (Table 1).
| Locus | Motif | Primer sequence (3′−5′) | GenBank accession number | Multiplex | Dye | Size (bp) | |
|---|---|---|---|---|---|---|---|
| RHW01 | (ACC)8 | (F) GAGAATAAAGGACCAACCACAGC (R) AAACTTGGGCTAGGCACTCA | ON184275 | 1 | Fam | 82–84 | |
| RHW10 | (AC)15 | (F) ACAATGCTTCTAAATTGCTTTGCA (R) AGCTTCAATTCTTCCTGTAAATCTGT | ON184276 | 1 | Ned | 128–148 | |
| RHW18 | (AGAT)20 | (F) GCAATGTAGTTACAGAGATAGATAGAC (R) TGAATGGGATGAACTAACTCAGAA | ON184277 | 1 | Vic | 185–234 | |
| BHW37 | (ATC)8 | (F) TGTGAATCCGGACAAGTCACT (R) GGCCCTCAGCAACGATGATA | ON184278 | 2 | Vic | 232–253 | |
| RHW12 | (AC)24 | (F) CACCCTTATTTAAGCTGAGGAGC (R) ACAAAGAGAAACCAGCTGTCT | ON184279 | 2 | Pet | 133–155 | |
| RHW20 | (ATC)11 | (F) CTCAGTGCCTACCCGAATCC (R) GTTGATTGAGGTGAGGACTGGT | ON184280 | 2 | Ned | 197–206 | |
| RHW40 | (AG)5 | (F) CCTGGTGATGTCAGTGCCTT (R) CCTACCACCTGTGCACTGAA | ON184281 | 2 | Fam | 164–174 | |
| BHW17 | (AATG)9 | (F) AGGGCAGCTGGTCTTTGTC (R) AGGCTTGGCACTTCTGAGTT | ON184282 | 3 | Pet | 133–141 | |
| BHW35 | (ATCC)10 | (F) GTCAGGGAGCTGCCTCTTAC (R) CATACTGGGCAGCCAAAGGA | ON184283 | 3 | Vic | 251–259 | |
| RHW26 | (AC)17 | (F) TCCAGGGTTTGAGGTAAGTCAG (R) AGGCATGACTCATGTGGGTA | ON184284 | 3 | Ned | 273–295 | |
| RHW09 | (AC)16 | (F) AGGGCCAGGAGATAAGAGGG (R) GGTGAAATGCATTCCTGTACCC | ON184285 | 5 | Vic | 132–136 | |
| RHW24 | (AC)18 | (F) TGACTTCTGATAACTAGGATGAATGT (R) AGGTCCAAATACGCTACTTCAGT | ON184286 | 5 | Ned | 207–215 |
Multilocus genotyping
Scat DNA samples were PCR amplified using the Qiagen Multiplex PCR Plus kit. Each multiplex reaction contained 4 μL Qiagen mastermix, 1 μL primer mastermix, and 4 μL DNA, and were run on an Eppendorf Mastercycler using cycling conditions recommended by the manufacturer with an annealing temperature of 60°C with 35 cycles. Fragment analysis was conducted on an Applied Biosystems 3100 capillary sequencer (Applied Biosystems, Foster City, CA, USA) using a commercial service (State Agricultural Biotechnology Centre, Western Australia). A minimum of two PCRs were initially performed for each scat sample. A heterozygous genotype was accepted if two different alleles occurred in at least one replicate. A homozygote was accepted if only one allele was recorded in both replicates. Sequencing was repeated a third time if neither of these criteria were met for a given sample. Samples that failed to amplify at seven or more loci were discarded from further analysis. Alleles were scored using GENEMAPPER v.6.0 (Applied Biosystems) with reference to an internal size standard (LIZ500, Applied Biosystems, Waltham, MA, USA). Results were manually reviewed to ensure consistent scoring of alleles and to confirm any genotyping errors such as the presence of false alleles and allelic dropout (Dziminski et al. 2021).
Genotyping quality
We calculated the locus-specific error rate, allele-specific error rate, allelic drop out and false alleles (Pompanon et al. 2005) using the genotypes obtained from replicate PCRs. For samples that had three replicates, two replicates were chosen by alternating between which two replicates were used (i.e. rep 1 and 2 were used for sample x, then rep 1 and 3 were used for sample y etc.). Error rates were calculated for each locus and then averaged across loci.
Individual identification
The software COLONY v.2.0.6.6 was used to group scat samples by similar genotypes to infer unique individuals (Jones and Wang 2010). COLONY explicitly accounts for genotyping error at each locus, resulting in increased reliability of genotype clustering when genotyping errors are present (Jones and Wang 2010). We inputted the project-specific genotyping error rates and used COLONY to identify ‘clonal’ genotypes using the ‘with clone’ setting in Mating System and remaining default settings. This analytical approach was taken to reduce the costs associated with addressing genotyping errors using the ‘multi-tubes’ approach (Taberlet et al. 1999) that may require up to eight replicate PCRs per sample to detect errors.
We performed a second genetic clustering method using the R package ‘allelematch’ v.2.5.1 (Galpern et al. 2012) in R software v.4.0.1 (R Core Team 2020). Allelematch finds similarities between genotypes while accounting for missing data (but not genotyping error), then uses hierarchical clustering to group similar genotypes at a specified threshold of dissimilarity to identify which genotypes are unique and which are matches. In this analysis we allowed up to three genotype mismatches when clustering sample genotypes.
Genotypes were manually inspected to compare consistency in the groupings identified by COLONY and allelematch. Genotypes from different samples were considered to represent an identical mala when all alleles from at least seven of the 12 loci were identical. This threshold was chosen based on the probability of identity (PID), which was 0.00016 for seven loci, an acceptable probability to achieve a high level of discrimination among individuals (Waits et al. 2001). PID was computed using GENALEX 6.5 software (Peakall and Smouse 2006, 2012).
Once unique individuals were identified, the expected and observed heterozygosity within the population were computed using GENALEX 6.5 software. We also tested whether microsatellite loci showed significant deviation from Hardy–Weinberg Equilibrium at P < 0.0125 and P < 0.05 (with and without Bonferroni correction applied, respectively) using GENALEX. We also evaluated linkage disequilibrium between pairs of microsatellite loci using the test for genotypic disequilibrium in Genepop on the Web (Raymond and Rousset 1995; Rousset 2008), with statistical significance estimated using the log likelihood ratio statistic.
Estimation of population size
Because there was only 6 months between the two surveys, the population was assumed temporarily closed (i.e. no mortality and no recruitment), and the data formatted as one session with eight sampling occasions. This is the first attempt to estimate the abundance of mala using non-invasive scat samples. Therefore, the abundance of mala was estimated using two different analytical models in R to check the validity of the density estimates. First, spatially explicit capture–recapture (SECR) models were used with the package ‘openCR’ v.1.5.0 (Efford 2019), with the fenced enclosure as a closed survey area. The analysis was performed using four different spatial openCR Jolly–Seber (JSSA) models with model selection based on AICc (Akaike’s Information Criterion corrected for small sample size). These models produce a superpopulation density (SuperD) estimate for estimating abundance. The other parameters being estimated vary with each JSSA model and are listed in Table 2. All four models are constant because no parameters vary with time. We used the default hazard halfnormal detection function.
| Model type | λ0 | Sigma | z | Phi | b | f | Gamma | λ | SuperD | |
|---|---|---|---|---|---|---|---|---|---|---|
| JSSAsecrb | ● | ● | ● | ● | ● | ● | ||||
| JSSAsecrf | ● | ● | ● | ● | ● | ● | ||||
| JSSAsecrg | ● | ● | ● | ● | ● | ● | ||||
| JSSAsecrl | ● | ● | ● | ● | ● | ● |
λ0 (Lambda0), detection function intercept; Sigma (m), detection function scale; z, detection function shape parameter; Phi, apparent survival; b (beta), entry probability; f, per capita recruitment rate; Gamma, seniority (Pradel 1996); λ (Lambda), population growth rate (finite rate of increase); SuperD, super-population density.
The second model used was mark–resight with the package ‘secr’ v.4.3.3 (Efford 2020). This method has been used extensively on a variety of animals by marking a segment of the population using approaches such as radio-collars and paint-ball marking, followed by aerial surveys, camera trap surveys, or direct observations to observe marked and unmarked individuals (Bear et al. 1989; Hein and Andelt 1995; Magle et al. 2007). This study used scat DNA to identify and ‘mark’ individuals. The DNA marked scats were treated as initial detections of animals that were marked, and the DNA ‘recaptures’ were treated as re-sightings of the marked individuals. The remaining scats that were not genotyped were treated as sightings of unmarked animals. Some of these sightings may have been of marked animals that cannot be identified, therefore the probability of identity (pID) was fixed to 1 so that this uncertainty is ignored (Rees et al. 2019). The half normal detection function was used for the model as determined by the AICc value. Scats have not previously been used with mark–resight models.
Results
DNA extraction and evaluation of multilocus genotyping
We extracted genomic DNA from 72 scat samples (34 from April and 38 from September); 65 of these (i.e. 90%) were successfully genotyped with amplification of at least seven of the 12 loci. The mean locus genotyping error rate across the 65 genotypes was 3.1% and the mean allele genotyping error rate was 2.1% (allelic dropout: 2.7%; false alleles: 0.4%) (Table 3). Observed (HO) and expected (HE) heterozygosity were significantly different from those predicted under Hardy–Weinberg equilibrium for seven of the 12 loci without Bonferroni correction applied (P < 0.05), and five of the 12 loci with Bonferroni correction applied (P < 0.0125) (Table 3); however, there was little correlation with allele error rates. Similarly, we detected linkage disequilibrium across five locus pairs but no one locus was involved in more than one significant test. As such, we retained all loci for analysis. Based on the PID determined for this study, the set of twelve markers allows for discrimination among individuals with sufficient certainty (PID = 4.5 × 10⁻⁷). Our minimum criteria for sample inclusion (genotypes present at seven loci) represent a PID of 1.6 × 10⁻⁴.
| Locus | NA | HE | HO | F | Locus error rate | Allelic drop out | |
|---|---|---|---|---|---|---|---|
| RHW01 | 2 | 0.107 n.s./n.s. | 0.114 | −0.060 | 0.014 | 0.014 | |
| RHW10 | 4 | 0.704 n.s./n.s. | 0.667 | 0.053 | 0.056 | 0.056 | |
| RHW18 | 5 | 0.664 */* | 0.659 | 0.008 | 0.056 | 0.049 | |
| BHW37 | 4 | 0.263 */* | 0.216 | 0.177 | 0.000 | 0.000 | |
| RHW12 | 6 | 0.732 */* | 0.643 | 0.121 | 0.056 | 0.056 | |
| RHW20 | 3 | 0.528 n.s./n.s. | 0.500 | 0.053 | 0.021 | 0.021 | |
| RHW40 | 2 | 0.397 */n.s. | 0.545 | −0.375 | 0.021 | 0.021 | |
| BHW17 | 4 | 0.659 */* | 0.523 | 0.207 | 0.063 | 0.028 | |
| BHW35 | 4 | 0.445 n.s./n.s. | 0.415 | 0.068 | 0.049 | 0.049 | |
| RHW26 | 5 | 0.575 */* | 0.500 | 0.131 | 0.014 | 0.014 | |
| RHW09 | 2 | 0.357 */n.s. | 0.233 | 0.348 | 0.021 | 0.014 | |
| RHW24 | 3 | 0.404 n.s./n.s. | 0.405 | −0.002 | 0.000 | 0.000 | |
| Mean | 3.667 ± 0.376 | 0.486 ± 0.055 | 0.452 ± 0.053 | 0.061 ± 0.051 | 0.031 ± 0.007 | 0.027 ± 0.006 |
n.s., no significance.
Asterisks represent significant difference between observed and expected heterozygosity at P < 0.05 (without Bonferroni corrected) and P < 0.0125 (Bonferroni corrected), respectively.
Identification of individuals
Of the 65 genotypes, 44 unique individuals were identified by COLONY, with 21 genotypes scored as recaptures of 13 individuals. Allelematch identified 48 unique individuals and 17 recaptures of 10 individuals. On the whole, the genotype clusters identified between the two methods were similar, with the exception that allelematch identified samples with >3 genotype mismatches as new individuals (whereas COLONY was able to cluster these with the closest genotype with high likelihood). We based our downstream analyses on the results from COLONY as a more conservative estimate of the number of individuals identified through scat sampling.
Genetic diversity
Across the 44 unique individuals identified by COLONY, 44 alleles were detected across the 12 loci, ranging from two to six alleles per locus (mean = 3.7 ± 0.4) (Table 3). The observed heterozygosity across the genotypes was medium at HO = 0.452 ± 0.053, with the expected heterozygosity only being slightly higher at HE = 0.486 ± 0.055.
Estimation of abundance
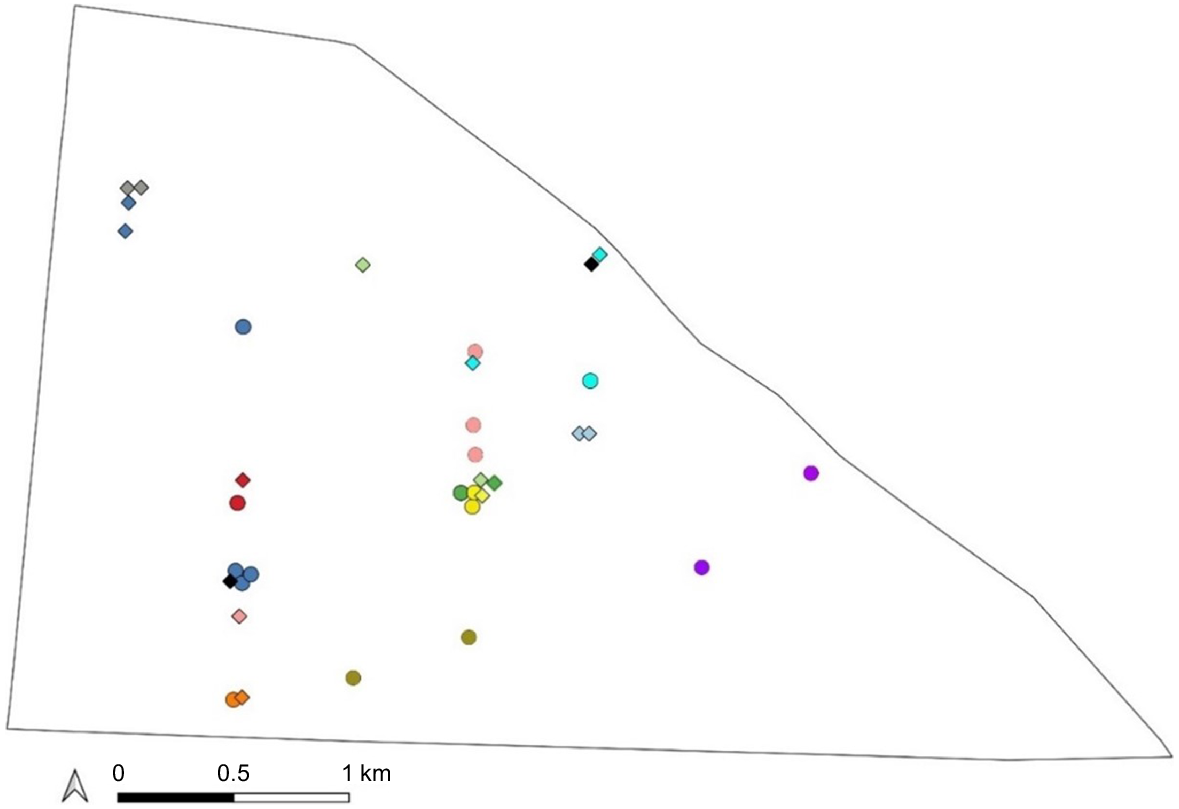
Across the two sessions, 31 animals were captured only once. Nine animals were recaptured once, two animals were recaptured twice, one animal three times, and one animal five times (Fig. 3). In April, two individuals were recaptured once, with recaptures occurring 0.65 km and 0.54 km away from the original captures. In September, four individuals were recaptured once, with recaptures occurring 0–2.5 km away from the original captures. There were seven individuals recaptured one to five times during both sessions at 0–2 km apart. Three of these individuals were recaptured at the same location or just 500 m apart between sessions.
Locations of the 13 recaptured individuals within the Matuwa enclosure from both sampling sessions. Each colour represents an individual. Individuals captured in April are identified by the circles and individuals captured in September are identified by the diamonds.
According to AICc model selection procedures, the JSSAsecrl openCR model was the best for mala abundance (Table 4), with a population estimate of 119.7 animals and an approximate 95% confidence interval of 63.4–226.1 (s.e.: 38.8). This wide error margin may be due to the large variation in distances moved by recaptured individuals (range from >2 km to <0.005 km) and the low number of recaptures. Due to the limited sample size, we were unable to model any sources of heterogeneity that might be influencing the estimates and error margins. The more conservative mark–resight analysis produced a very similar, though slightly smaller, estimate of 112.3 animals with a tighter confidence interval of 91.9–137.2 (s.e.: 11.5). These two estimates suggest an 87% (SECR) and 75% (mark–resight) increase in mala abundance from the 64 individuals that were initially released in the enclosure in 2011–13.
| SuperD | s.e. | LCL | UCL | Log likelihood | AICc | ||
|---|---|---|---|---|---|---|---|
| JSSAsecrf | 0.1076977 | 0.03555248 | 0.05639145 | 0.2056836 | −215.7761 | 443.219 | |
| JSSAsecrl | 0.107566 | 0.03490068 | 0.05695027 | 0.2031676 | −215.7758 | 443.218 | |
| JSSAsecrg | 0.1076584 | 0.03536431 | 0.05655098 | 0.2049538 | −215.776 | 443.219 | |
| JSSAsecrb | 0.1070412 | 0.03507327 | 0.0563177 | 0.2034496 | −215.7807 | 443.228 |
SuperD, super population density (number of individuals per hectare); LCL, lower confidence limit; UCL, upper confidence limit.
Discussion
The use of non-invasive or environmental DNA sampling can provide an alternative approach to invasive mark–recapture sampling methods for monitoring of disturbance-sensitive or difficult to trap species. With careful application, field studies relying on using scat DNA to identify individuals and undertake capture–recapture modelling can achieve high levels of accuracy (Mondol et al. 2009). Early applications of this technique have also been used to identify abundance and changes in population size of invasive red foxes (Marks et al. 2009) and monitor spotted-tailed quolls (Ruibal et al. 2009). To our knowledge, this is the first study to identify species-specific microsatellite markers for mala and use genetic-capture sampling with scat DNA to estimate the abundance of a mala population. Our genetic markers proved variable and with sufficient exclusionary power to confidently identify unique individuals, and we show that individual genetic identification from scat sampling, when used with traditional mark–recapture/resight analytical models, provides feasible estimates of population abundance – the first reliable abundance estimate of the Matuwa mala population since the initial reintroduction in 2011–13. We propose this approach could be valuable to ensure effective monitoring of the few remaining fenced and island mala populations to prevent further decline of this vulnerable species.
Here, we estimate that the mala population at Matuwa comprises in the order of 110–120 individuals, representing a >70% increase in population size since the initial release of 64 individuals in 2011–13. Given such a positive growth trend over an 8-year timeframe, the translocation should be considered successful against both short- and medium-term success criteria. However, it is not currently clear how mala population abundance may fluctuate over time, particularly with climatic cycles in the unpredictable arid environment at Matuwa. Future annual scat sampling will provide information on population trends to confirm the stability of this population, and assist in understanding the factors that influence population size of this vulnerable species such as drought and competition with co-occurring species (Treloar et al. 2021).
Other non-invasive approaches (spotlight surveys) have been an adequate method for monitoring the related sub-species, rufous-hare wallaby, on Bernier and Dorre Islands in most years (Sims et al. 2019), yet DNA scat sampling appears to produce greater accuracy and reliability of results. In this study, the error margin for the mark–resight analysis was within 10% of the estimate, whereas despite sufficient detections, the Dorre and Bernier Island spotlight surveys from years 2011 to 2018 produced global (Dorre and Bernier Islands combined) rufous-hare wallaby abundance estimates with error margins between 18 and 23% of the estimates. Similarly, Short and Turner (1992) estimated the global abundance of rufous hare-wallabies on Bernier and Dorre Islands in 1992 with an error margin above 15% from 78 sightings.
At Matuwa, survey effort is likely similar for spotlighting and scat sampling because both techniques require walking along transects across the survey area. However, scat sampling afforded a substantially increased rate of detection of individuals (n = 44) compared with the low number of sightings (<4 mala in 2016) from spotlighting on the same transects (Sims et al. 2017). Additionally, unlike spotlighting, DNA scat sampling can incorporate recapture information because individuals are identified via ‘molecular tagging’, in contrast to raw counts via spotlighting, resulting in improved performance of the estimation models. DNA scat sampling may therefore be a superior method to estimate abundance in this Vulnerable (IUCN), trap-shy species.
Comparison of population estimation models
Many studies have used only one method to estimate abundance (Banks et al. 2003; Perez et al. 2006; Hettinga et al. 2012), which makes them subject to the biases of that method. We used two analytical methods, spatially explicit capture–recapture (SECR) analysis and mark–resight analysis, allowing a comparison of how different assumptions in the models affect the density estimates. SECR analysis uses both spatial and temporal data to estimate the density of individuals, and is advantageous over distance sampling because all individuals included in the analysis are identified. Limitations of SECR analysis include significantly reduced robustness of estimates when there is >5% tag loss or misidentification of animals (Arnason and Mills 1981), captured/sighted animals that have not been marked are not considered (resulting in potential loss of information), and the error margin is dependent on recapture rate. The low number of recaptures in this study would have contributed to the greater error margins produced by the SECR analysis.
Mark–resight estimators, however, consider all detections of individuals, including unmarked individuals, that have been sighted (in this case via scat dropping), because distinct sampling occasions do not need to be delineated as they do for SECR (Alonso et al. 2015). Therefore, mark–resight used a greater sample size at no additional cost, resulting in a narrower error margin compared with SECR. A limitation of using information on ‘unmarked’ individuals is that there can be uncertainties on whether these animals are marked or not. This is especially the case for scat DNA sampling because all unmarked scats are essentially ‘uncertain’ animals. An additional limitation of mark–resight models is that the number of marked individuals available for resighting at the time of sampling usually needs to be known exactly. This can be an issue when the time between marking and resighting is of long enough duration for the assumption of closure (no mortality or recruitment) to be violated (McClintock et al. 2009). It is possible mortalities of marked individuals occurred during the single 6-month session of this study – consequently all the marked individuals in April may not have been available for resighting again in September. This is also an issue for on-going monitoring of the population.
The estimate of population size from the mark–resight model was lower than that from the SECR model. Both estimates should be considered, but we recommend management decisions be based on more conservative estimates because there is minimal room for error in managing threatening processes for endangered species. As such, we recommend using mark–resight analyses for future population estimates of mala.
Detection probabilities
In a natural environment, individuals will never have equal probabilities of being detected (Frantz et al. 2003) due to individual heterogeneity and temporal variation (McClintock et al. 2006). Genetic capture may reduce variation in detection probabilities because individuals do not need to interact with traps. Age and sex may affect detection probability. For example, male mala may be more active or have larger home ranges than females, as seen in bridled nail-tail wallabies (Onychogalea fraenata; Evans 1996), resulting in males having a greater probability of being recaptured via our survey methodology. A useful addition to our methodology would be a sex-linked molecular marker to explore such heterogeneity in detection rate by sex (Ottewell et al. 2020).
Seasonal differences in environmental conditions (e.g. rainfall, temperature, UV) will also influence the quality of scat DNA (Piggott 2004). To manage this potential temporal heterogeneity, scats should be collected around the same time each year. Here, we obtained scats in both April and September. Genotyping rates were similar between the two collections (88–92%), suggesting little difference in scat quality between these seasons, although sample sizes were small. Additional sources of heterogeneity may be introduced by differences in time between scat deposition and collection, which can affect DNA extraction and amplification success (Carpenter and Dziminski 2017). Similarly, the location of a scat (e.g. under a shaded tree or in direct sunlight) will affect the quality of DNA, thus introducing further individual heterogeneity (Cowen et al. 2022). This is particularly likely for this study because Matuwa experiences over 13 h of daylight in summer (Time and Date AS 2022) and has a mean maximum temperature of 44.1°C (Australian Bureau of Meteorology 2021). Due to the limited sample size, we were unable to model any sources of heterogeneity that might be influencing the estimates and error margins. Future studies should further investigate sources of individual heterogeneity and temporal variation that may influence detection probabilities for mala.
Genotyping success
Variation in DNA quality and quantity from non-invasively collected scats can lead to errors in microsatellite genotyping, particularly caused by non-amplification of alleles (allelic dropout) or spurious amplification of artefactual sequences (false alleles) (Bonin et al. 2004). Such genotyping errors can result in over-estimation of the number of unique individuals identified in a study area, with consequent flow-on effects for statistical mark–recapture analyses. For genetic monitoring purposes, Roon et al. (2005) recommend a per-locus genotyping error rate below 0.05, but ideally near 0.01. The mean locus error rate for the 12 microsatellite markers used in this study was 0.03, with eight markers having an error rate <0.05. Statistical confidence in individual genotypes can be improved using a ‘multi-tubes’ approach (Taberlet et al. 1999) but often requires performing large numbers of sample replicates, which may be prohibitively expensive and consumes large volumes of limited DNA. An alternative approach is to undertake fewer replicates and explicitly account for sources of genotyping error within maximum likelihood models used in identifying genotype clusters equating to unique individuals. We performed this latter approach using the COLONY program (Jones and Wang 2010) that we found to cluster genotypes more conservatively than the R package ‘allelematch’, which tended to over-split genotypes when genotyping errors were present. Future improvement to collection and genotyping methods to reduce variation in sample quality may assist in reducing genotyping errors and improving certainty in individual identification.
Implications for management of mala at Matuwa
Prior to this study, there was little information on the abundance of mala at Matuwa. Although the carrying capacity has been predicted at 0.4 mala per hectare (Lees and Bennison 2016), the density estimates suggest there are approximately 0.1 mala per hectare in the enclosure. In comparison, the densities of four intensively managed mala populations were much higher (0.4, 0.6, 1.5, and 0.5 mala per hectare) because there are fewer competing species present, and supplementary feeding and habitat manipulation has been provided (Lees and Bennison 2016). Rufous hare-wallabies on Bernier (0.2–0.4 per hectare) and Dorre island (0.2–0.3 per hectare) live in similar conditions to Matuwa and have lower densities (Sims et al. 2019) than the intensively managed populations. Based on these estimates, the current mala abundance at Matuwa is not of concern but on-going monitoring is important to ensure the population does not decrease.
Conclusion
This study has demonstrated promising results for implementing genetic-capture sampling with non-invasively collected environmental DNA for estimating the abundance of mala. Given the inherent difficulties in surveying this elusive species, scat DNA sampling would be a valuable alternative for estimating mala abundance in situations where other survey methodologies are impractical. Additionally, genetic data obtained through scat DNA sampling can be used to assess genetic diversity, home range size, fecundity, and relatedness amongst mala (Piggott and Taylor 2003a), gaining further insight into the biology and demographic patterns of the species. The addition of molecular sexing markers to our microsatellite panel would add further value in quantifying gender specific statistics of a population (e.g. sex ratio), and could assist in improving accuracy of sample identifications. Sex-linked markers that have been developed for other macropods (Graves and Dawson 1988; Piggott et al. 2006; MacDonald et al. 2014) could be trialled for application to mala.
Data availability
The data that support this study are available in Research Online, Edith Cowan University’s institutional repository, at https://ro.ecu.edu.au/about.html.
Acknowledgements
We acknowledge the Wiluna Martu people, who are the traditional custodians of Matuwa, and appreciate the input of Tarlka Matuwa Piarku Aboriginal Corporation, and members of the Matuwa Kurrara Kurrara Indigenous Protected Area Management Team. We also thank Mitchell Wright and Kristen Nilsson for assisting with field work.
References
Alonso RS, McClintock BT, Lyren LM, Boydston EE, Crooks KR (2015) Mark–recapture and mark–resight methods for estimating abundance with remote cameras: a carnivore case study. PLoS ONE 10, e0123032.
| Crossref | Google Scholar |
Arnason AN, Mills KH (1981) Bias and loss of precision due to tag loss in Jolly–Seber estimates for mark–recapture experiments. Canadian Journal of Fisheries and Aquatic Sciences 38, 1077-1095.
| Crossref | Google Scholar |
Australian Bureau of Meteorology (2021) Monthly mean maximum temperature: Wiluna Aero. Available at http://www.bom.gov.au/jsp/ncc/cdio/weatherData/av?p_nccObsCode=36&p_display_type=dataFile&p_startYear=&p_c=&p_stn_num=013044 [Accessed 27 April 2021]
Banks SC, Piggott MP (2022) Non-invasive genetic sampling is one of our most powerful and ethical tools for threatened species population monitoring: a reply to Lavery et al. Biodiversity and Conservation 31, 723-728.
| Crossref | Google Scholar |
Banks SC, Hoyle SD, Horsup A, Sunnucks P, Taylor AC (2003) Demographic monitoring of an entire species (the northern hairy-nosed wombat, Lasiorhinus krefftii) by genetic analysis of non-invasively collected material. Animal Conservation 6, 101-107.
| Crossref | Google Scholar |
Bear GD, White GC, Carpenter LH, Gill RB, Essex DJ (1989) Evaluation of aerial mark–resighting estimates of elk populations. The Journal of Wildlife Management 53, 908-915.
| Crossref | Google Scholar |
Bellemain E, Swenson JE, Tallmon D, Brunberg S, Taberlet P (2005) Estimating population size of elusive animals with DNA from hunter-collected feces: four methods for brown bears. Conservation Biology 19, 150-161.
| Crossref | Google Scholar |
Bonin A, Bellemain E, Bronken Eidesen P, Pompanon F, Brochmann C, Taberlet P (2004) How to track and assess genotyping errors in population genetics studies. Molecular Ecology 13, 3261-3273.
| Crossref | Google Scholar |
Burbidge AA, Woinarski JCZ (2016) Lagorchestes hirsutus. The IUCN red list of threatened species 2016: e.T11162A21954429. Available at https://dx.doi.org/10.2305/IUCN.UK.2016-2.RLTS.T11162A21954429.en [Accessed 18 March 2020]
Burbidge AA, Johnson KA, Fuller PJ, Southgate RI (1988) Aboriginal knowledge of the mammals of the central deserts of Australia. Australian Wildlife Research 15, 9-39.
| Crossref | Google Scholar |
Carpenter FM, Dziminski MA (2017) Breaking down scats: degradation of DNA from greater bilby (Macrotis lagotis) faecal pellets. Australian Mammalogy 39, 197-204.
| Crossref | Google Scholar |
Cowen S, Smith M, Mcarthur S, Rayner K, Jackson C, Anderson G, Ottewell K (2022) Novel microsatellites and investigation of faecal DNA as a non-invasive population monitoring tool for the banded hare-wallaby (Lagostrophus fasciatus). Australian Journal of Zoology 69, 55-66.
| Crossref | Google Scholar |
Deuter R, Pietsch S, Hertel S, Müller O (1995) A method for preparation of fecal DNA suitable for PCR. Nucleic Acids Research 23, 3800-3801.
| Crossref | Google Scholar |
Dziminski MA, Carpenter FM, Morris F (2021) Monitoring the abundance of wild and reintroduced bilby populations. The Journal of Wildlife Management 85, 240-253.
| Crossref | Google Scholar |
Efford MG (2019) openCR: open population capture–recapture models. R package version 1.4.1. Available at https://cran.r-project.org/package=openCR
Efford MG (2020) secr: spatially explicit capture–recapture models. R package version 4.2.2. Available at https://cran.r-project.org/package=secr
Eggert LS, Eggert JA, Woodruff DS (2003) Estimating population sizes for elusive animals: the forest elephants of Kakum National Park, Ghana. Molecular Ecology 12, 1389-1402.
| Crossref | Google Scholar |
Evans M (1996) Home ranges and movement schedules of sympatric bridled nailtail and black-striped wallabies. Wildlife Research 23, 547-555.
| Crossref | Google Scholar |
Ferreira CM, Sabino-Marques H, Barbosa S, Costa P, Encarnação C, Alpizar-Jara R, Pita R, Beja P, Mira A, Searle JB, Paupério J, Alves PC (2018) Genetic non-invasive sampling (gNIS) as a cost-effective tool for monitoring elusive small mammals. European Journal of Wildlife Research 64, 46.
| Crossref | Google Scholar |
Frantz AC, Pope LC, Carpenter PJ, Roper TJ, Wilson GJ, Delahay RJ, Burke T (2003) Reliable microsatellite genotyping of the Eurasian badger (Meles meles) using faecal DNA. Molecular Ecology 12, 1649-1661.
| Crossref | Google Scholar |
Galpern P, Manseau M, Hettinga P, Smith K, Wilson P (2012) Allelematch: an R package for identifying unique multilocus genotypes where genotyping error and missing data may be present. Molecular Ecology Resources 12, 771-778.
| Crossref | Google Scholar |
Graves JAM, Dawson GW (1988) The relationship between position and expression of genes on the kangaroo X chromosome suggests a tissue-specific spread of inactivation from a single control site. Genetical Research 51, 103-109.
| Crossref | Google Scholar |
Harmsen BJ, Foster RJ, Doncaster CP (2011) Heterogeneous capture rates in low density populations and consequences for capture–recapture analysis of camera-trap data. Population Ecology 53, 253-259.
| Crossref | Google Scholar |
Hein EW, Andelt WF (1995) Estimating coyote density from mark–resight surveys. Journal of Wildlife Management 59, 164-169.
| Crossref | Google Scholar |
Hettinga PN, Arnason AN, Manseau M, Cross D, Whaley K, Wilson PJ (2012) Estimating size and trend of the north interlake woodland caribou population using fecal-DNA and capture–recapture models. The Journal of Wildlife Management 76, 1153-1164.
| Crossref | Google Scholar |
Jones OR, Wang J (2010) COLONY: a program for parentage and sibship inference from multilocus genotype data. Molecular Ecology Resources 10, 551-555.
| Crossref | Google Scholar |
Kay B, Gifford E, Perry R, van de Ven R (2000) Trapping efficiency for foxes (Vulpes vulpes) in central New South Wales: age and sex biases and the effects of reduced fox abundance. Wildlife Research 27, 547-552.
| Crossref | Google Scholar |
Laurance WF (1992) Abundance estimates of small mammals in Australian tropical rainforest: a comparison of four trapping methods. Wildlife Research 19, 651-655.
| Crossref | Google Scholar |
MacDonald AJ, Fitzsimmons NN, Chambers B, Renfree MB, Sarre SD (2014) Sex-linked and autosomal microsatellites provide new insights into island populations of the tammar wallaby. Heredity 112, 333-342.
| Crossref | Google Scholar |
Magle SB, McClintock BT, Teipp DW, White GC, Antolin MF, Crooks KR (2007) Mark–resight methodology for estimating population densities for prairie dogs. Journal of Wildlife Management 71, 2067-2073.
| Crossref | Google Scholar |
Marks CA, Gigliotti F, McPhee S, Piggott MP, Taylor A, Glen AS (2009) DNA genotypes reveal red fox (Vulpes vulpes) abundance, response to lethal control and limitations of contemporary survey techniques. Wildlife Research 36, 647-658.
| Crossref | Google Scholar |
McClintock BT, White GC, Burnham KP (2006) A robust design mark–resight abundance estimator allowing heterogeneity in resighting probabilities. Journal of Agricultural, Biological, and Environmental Statistics 11, 231-248.
| Crossref | Google Scholar |
McClintock BT, White GC, Antolin MF, Tripp DW (2009) Estimating abundance using mark–resight when sampling is with replacement or the number of marked individuals is unknown. Biometrics 65, 237-246.
| Crossref | Google Scholar |
Meglécz E, Pech N, Gilles A, Dubut V, Hingamp P, Trilles A, Grenier R, Martin J-F (2014) QDD version 3.1: a user-friendly computer program for microsatellite selection and primer design revisited: experimental validation of variables determining genotyping success rate. Molecular Ecology Resources 14, 1302-1313.
| Crossref | Google Scholar |
Mondol S, Ullas Karanth K, Samba Kumar N, Gopalaswamy AM, Andheria A, Ramakrishnan U (2009) Evaluation of non-invasive genetic sampling methods for estimating tiger population size. Biological Conservation 142, 2350-2360.
| Crossref | Google Scholar |
Morris K, Sims C, Himbeck K, Christensen P, Sercombe N, Ward B, Noakes N (2004) Project Eden – fauna recovery on Peron Peninsula, Shark Bay: Western Shield review – February 2003. Conservation Science Western Australia 5, 202-234.
| Google Scholar |
Newson SE, Evans KL, Noble DG, Greenwood JJD, Gaston KJ (2008) Use of distance sampling to improve estimates of national population sizes for common and widespread breeding birds in the UK. Journal of Applied Ecology 45, 1330-1338.
| Crossref | Google Scholar |
Ottewell K, Thavornkanlapachai R, McArthur S, Spencer PBS, Tedeschi J, Durrant B, Knuckey C, Armstrong K, Byrne M (2020) Development and optimisation of molecular assays for microsatellite genotyping and molecular sexing of non-invasive samples of the ghost bat, Macroderma gigas. Molecular Biology Reports 47, 5635-5641.
| Crossref | Google Scholar |
Peakall R, Smouse PE (2006) GENALEX 6: genetic analysis in Excel. Population genetic software for teaching and research. Molecular Ecology Notes 6, 288-295.
| Crossref | Google Scholar |
Peakall R, Smouse PE (2012) GenAlEx 6.5: genetic analysis in Excel. Population genetic software for teaching and research – an update. Bioinformatics 28, 2537-2539.
| Crossref | Google Scholar |
Perez I, Geffen E, Mokady O (2006) Critically Endangered Arabian leopards Panthera pardus nimr in Israel: estimating population parameters using molecular scatology. Oryx 40, 295-301.
| Crossref | Google Scholar |
Piggott MP (2004) Effect of sample age and season of collection on the reliability of microsatellite genotyping of faecal DNA. Wildlife Research 31, 485-493.
| Crossref | Google Scholar |
Piggott MP, Taylor AC (2003a) Extensive evaluation of faecal preservation and DNA extraction methods in Australian native and introduced species. Australian Journal of Zoology 51, 341-355.
| Crossref | Google Scholar |
Piggott MP, Taylor AC (2003b) Remote collection of animal DNA and its applications in conservation management and understanding the population biology of rare and cryptic species. Wildlife Research 30, 1-13.
| Crossref | Google Scholar |
Piggott MP, Banks SC, Stone N, Banffy C, Taylor AC (2006) Estimating population size of endangered brush-tailed rock-wallaby (Petrogale penicillata) colonies using faecal DNA. Molecular Ecology 15, 81-91.
| Crossref | Google Scholar |
Pompanon F, Bonin A, Bellemain E, Taberlet P (2005) Genotyping errors: causes, consequences and solutions. Nature Reviews Genetics 6, 847-859.
| Crossref | Google Scholar |
Possingham HP, Lindenmayer DB, Norton TW (1994) A framework for the improved management of threatened species based on population viability analysis (PVA). Pacific Conservation Biology 1, 39-45.
| Crossref | Google Scholar |
Pradel R (1996) Utilization of capture-mark-recapture for the study of recruitment and population growth rate. International Biometric Society 52, 703-709.
| Google Scholar |
Raymond M, Rousset F (1995) GENEPOP (version 1.2): population genetics software for exact tests and ecumenicism. Journal of Heredity 86, 248-249.
| Crossref | Google Scholar |
R Core Team (2020) R: a language and environment for statistical computing version 4.0.3. Available at https://www.r-project.org/
Reed JM, Murphy DD, Brussard PF (1998) Efficacy of population viability analysis. Wildlife Society Bulletin 26, 244-251.
| Google Scholar |
Rees MW, Pascoe JH, Wintle BA, Le Pla M, Birnbaum EK, Hradsky BA (2019) Unexpectedly high densities of feral cats in a rugged temperate forest. Biological Conservation 239, 108287.
| Crossref | Google Scholar |
Roon DA, Waits LP, Kendall KC (2005) A simulation test of the effectiveness of several methods for error-checking non-invasive genetic data. Animal Conservation 8, 203-215.
| Crossref | Google Scholar |
Rousset F (2008) Genepop’007: a complete re-implementation of the Genepop software for Windows and Linux. Molecular Ecology Resources 8, 103-106.
| Crossref | Google Scholar |
Ruibal M, Peakall R, Claridge A, Firestone K (2009) Field-based evaluation of scat DNA methods to estimate population abundance of the spotted-tailed quoll (Dasyurus maculatus), a rare Australian marsupial. Wildlife Research 36, 721-736.
| Crossref | Google Scholar |
Schipper J (2007) Camera-trap avoidance by kinkajous Potos flavus: rethinking the “non-invasive” paradigm. Small Carnivore Conservation 36, 38-41.
| Google Scholar |
Short J, Turner B (1992) The distribution and abundance of the banded and rufous hare-wallabies, Lagostrophus fasciatus and Lagorchestes hirsutus. Biological Conservation 60, 157-166.
| Crossref | Google Scholar |
Short J, Turner B, Majors C (1998) The fluctuating abundance of endangered mammals on Bernier and Dorre Islands, Western Australia – conservation implications. Australian Mammalogy 20, 53-61.
| Crossref | Google Scholar |
Sunnucks P, Hales DF (1996) Numerous transposed sequences of mitochondrial cytochrome oxidase I-II in aphids of the genus Sitobion (Hemiptera: Aphididae). Molecular Biology and Evolution 13, 510-524.
| Crossref | Google Scholar |
Taberlet P, Waits LP, Luikart G (1999) Noninvasive genetic sampling: look before you leap. Trends in Ecology & Evolution 14, 323-327.
| Crossref | Google Scholar |
Time and Date AS (2022) Wiluna, Western Australia, Australia – sunrise, sunset, and daylength. Available at https://www.timeanddate.com/sun/australia/wiluna?month=7&year=2021 [Accessed 27 April 2021]
Treloar S, Lohr C, Hopkins AJM, Davis RA (2021) Rapid population expansion of boodie (burrowing bettong, Bettongia lesueur) creates potential for resource competition with mala (rufous hare-wallaby, Lagorchestes hirsutus). Ecological Management & Restoration 22, 54-57.
| Crossref | Google Scholar |
Waits LP, Luikart G, Taberlet P (2001) Estimating the probability of identity among genotypes in natural populations: cautions and guidelines. Molecular Ecology 10, 249-256.
| Crossref | Google Scholar |
Wegge P, Bakke BB, Odden M, Rolstad J (2019) DNA from scats combined with capture–recapture modeling: a promising tool for estimating the density of red foxes – a pilot study in a boreal forest in southeast Norway. Mammal Research 64, 147-154.
| Crossref | Google Scholar |