

Comparisons of morphometrics and body condition between two breeding populations of Australian humpback whales
Grace Russell A * , Fredrik Christiansen B , Andrew Colefax C , Kate R. Sprogis D and Daniele Cagnazzi A
A
B
C
D
Abstract
The east and west coasts of Australia form the breeding grounds for two of the world’s largest and fastest-growing populations of humpback whales (Megaptera novaeangliae). These populations show differences in mean lipid content, fatty acid profiles, and stable isotope values.
To determine whether these differences result in variation in nutritional health and physiology between populations, we quantified and compared the morphology, body condition and energetic requirements between the two populations.
We used unmanned aerial vehicles to measure body morphometrics (residual of body volume vs length) of humpback whales from May to November in 2017, 2020 and 2021.
Morphometric measurements were obtained from 973 humpback whales (119 calves, 249 juveniles, 486 adults, and 119 lactating females). Results showed that the two populations did not differ significantly in their morphology. The average body condition was significantly different for sexually mature reproductive classes, with adults and lactating females on the west coast having a lower body condition, by an average of 7.7 and 11.1 percentage points below the east coast population respectively. All reproductive classes, with the exception of calves followed a similar pattern in body condition loss through the breeding season. Calves on the east coast exhibited a curvilinear relationship with days post-partum, with early and late-migrating calves being in poorer body condition than were those migrating mid-season. In contrast, west coast calves did not significantly change their condition through the breeding season.
The poorer body condition of sexually mature individuals in the west coast population is concerning, given the overall condition loss during a breeding season. This difference could be influenced by variations in sampling time; however, differences in feeding opportunities, climatic regimes and/or environmental variables may influence the ability of one population to acquire similar amounts of energy.
The difference in body condition between these two humpback whale populations highlighted the need to assess populations individually, so as to develop representative levels that can be used for future conservation monitoring and management.
Keywords: Baleen whale, body condition, capital breeder, drones, Megaptera novaeangliae, morphology, photogrammetry, unmanned aerial vehicle (UAV).
Introduction
Marine mammals face a host of environmental and anthropogenic threats that can affect the health and survival of individuals within a population (Doney et al. 2012; Evans and Bjørgec 2013; Van Der Hoop et al. 2013; Sanderson and Alexander 2020). These threats, including anthropogenic noise, vessel strikes, fishing gear entanglement, pollution, overharvesting of prey, habitat degradation, and climate change, can have an influence on the fitness of an animal as well as an indirect influence by affecting ecosystem health and prey availability (Fortune et al. 2013; Peel et al. 2018; Tulloch et al. 2020; Kershaw et al. 2021). If ongoing and severe, the various anthropogenic and environmental disturbances can compound and cause alterations in behaviour or deplete the abundance of individuals in populations (Leaper et al. 2006; New et al. 2014; Williams et al. 2016; Stewart et al. 2021). Investigating a population nutritional status and body condition can provide an indication of ecosystem health and population viability (Bonde et al. 2004; Bengtson Nash et al. 2018; Groskreutz et al. 2019). Body condition is often used as a proxy for the relative energy reserves of individuals, which can affect fitness, somatic growth rates, fecundity and survivability (Lockyer 1990; Merilä and Svensson 1997; Lockyer 2007; Bradford et al. 2012; Castrillon and Bengtson Nash 2020).
Comparisons of body condition can be used to identify differences in prey availability, foraging success, and anthropogenic threats between among populations, and provide insights into recent changes in critical habitat, somatic growth rates, and calving (Goodman 1997; Rode et al. 2012; Ashton et al. 2015; Christiansen et al. 2020a). For example, the shorter body length and poorer body condition of southern resident killer whales than of the sympatric population Bigg’s killer whales, has been linked to differences in the adaptive selection of prey and its differential availability (Kotik et al. 2023). Furthermore, a comparison of body condition across one population of the North Atlantic (Eubalaena glacialis) and three populations of southern right whales (Eubalaena australis) showed that the former is in a significantly poorer nutritional state, which may be contributing to the low reproductive rate and high mortality of the population (Christiansen et al. 2020a).
Most baleen whale populations undertake long-distance migrations from polar feeding areas to tropical breeding grounds (Chittleborough 1965; Dawbin 1966; Stone et al. 1990; Mikhalev 1997; Palsbøll et al. 1997; Jenner et al. 2001). This movement enables populations to exploit seasonally favourable habitats (Clapham 1996, 2001; Pallin et al. 2023). On the breeding grounds, humpback whales (Megaptera novaeangliae) rely primarily on stored energy acquired during the previous feeding season(s) to support their energetic needs. Because of this, physical (morphological) changes in stored energy can be observed over the course of their migration and breeding season (Perryman and Lynn 2002; Christiansen et al. 2016a; Soledade Lemos et al. 2020). In addition, temporal and spatial changes to prey availability due to climate change, climate regimes (i.e. El Niño Southern Oscillation, ENSO) or anthropogenic disturbances (i.e. over harvesting of prey) should be reflected in time spent on feeding grounds, prey choice and/or foraging locations, and therefore the body condition of individuals (Holyoake et al. 2012; Eisenmann et al. 2016; Owen et al. 2017; Bengtson Nash et al. 2018).
There are two breeding populations of humpback whales in Australia, one that migrates along the west coast and another that migrates along the east coastline, namely, Breeding stock D (BSD) and Breeding stock E1 (BSE1) respectively (IWC 2011). Both are believed to be among the largest breeding populations of humpback whales in the world, with current estimates exceeding 30 000 whales (Kent et al. 2012; Noad et al. 2019). The two populations are putatively discrete breeding populations and are considered to be largely separate. They feed in neighbouring areas in Antarctica, known as Feeding areas IV and V (Bettridge et al. 2015; Bestley et al. 2019), before undertaking their annual migrations along the west and east coasts, towards their breeding grounds in the Kimberly region of Western Australia (BSD) and Great Barrier Reef Marine Park (BSE1) (Jenner et al. 2001; Smith et al. 2012). There is evidence of individuals crossing between feeding (Chittleborough 1965; Andrews-Goff et al. 2018) and breeding grounds (Kaufman et al. 2011) within these two populations, resulting in low levels of genetic differentiation between the two populations (Schmitt et al. 2014).
The west and east coast populations display similar migratory patterns, with whales travelling annually from Antarctic feeding areas to northern Australian breeding areas. However, their migratory route and important habitats exhibit anthropogenic and environmental differences (Commonwealth of Australia 2007, 2008, 2009). Humpback whales migrating along the west and east coasts both face anthropogenic stressors; however, stressors vary among populations. On the east coast, whales face threats from noise pollution, vessel strikes and disturbance from the heavy shipping industry, with large ports situated along the east coast and within their calving ground (Bureau of Infrastructure Transport and Regional Economics 2014; Smith et al. 2020). In addition, the use of permanent shark nets (gillnets) in Queensland increases the risk of entanglement for northbound- and southbound-migrating humpback whales (Bolin et al. 2020; Tulloch et al. 2020). On the west coast, whales face net entanglement threat primarily from Western Australia’s largest fishing industry, the Western Rock Lobster fishery (Groom and Coughran 2012; How et al. 2015), and disturbances from heavy shipping traffic and tourism, including swim-with-whale tourism, in more northerly areas of their migration (Bejder et al. 2019; Sprogis et al. 2020a, 2020b). Furthermore, Australia’s largest production of offshore oil and gas is situated in north Western Australia, increasing the risk of acoustic disturbance and vessel strikes on migrating whales (Geoscience Australia 2021; Thomson et al. 2021).
Although the west and east coasts are both flanked by warm southward-flowing boundary currents, the Leeuwin Current and the East Australian Current have different seasonal and interannual variability (Pattiaratchi and Siji 2020). This interannual variability in current strength, as well as variability induced by different phases of ENSO, is weaker along the east coast than in the west, meaning that greater differences in current strength are experienced on the west coast (Pattiaratchi and Siji 2020). The positive phase of ENSO (La Niña) and other significant climate regimes, including the Southern Annular Mode (SAM), have been linked to variation in the adiposity, diet and fatty acid profiles of BSE1 (Bengtson Nash et al. 2018; Groß et al. 2020). This significance of climatic phenomena on the diet of humpback whales (Groß et al. 2020) is likely to influence individual- and population-level body condition and, consequently, population growth. In addition, stable isotope values (nitrogen and carbon), used to provide insights into feeding patterns, are different in the west and east coast populations during a positive SAM phase, indicating that the feeding grounds of these two populations may respond differently to climatic regimes and, therefore, result in different feeding opportunities (Dedden and Rogers 2022).
There have been few comparative studies between the two populations in terms of health. Those that exist have indicated that the west Australian population has comparatively lower mean lipid content, along with differing fatty acid profile and stable isotope values (Groß et al., in press). In addition, the two populations may experience climate regimes in their feeding areas differently (Dedden and Rogers 2022) and employ different feeding strategies via supplemental feeding opportunities during migration (Eisenmann et al. 2016). However, there is a lack of empirical investigation into the difference in body condition of the two populations. The two populations are close to or fully recovered from whaling exploitation (Kent et al. 2012; Bejder et al. 2016; Noad et al. 2019); however, the impact and implications of the differences mentioned above may vary for the two populations, potentially affecting their continued recovery success. It is therefore imperative to provide a body condition baseline and comparison of the two populations for future and continued monitoring that will enable the identification of threats to population health and viability. This is particularly important for a sentinel species, such as humpback whales, because their nutritional health can infer the health of their feeding grounds, and help us identify changes in their environment that may influence population vital rates.
The overall aim of this study was to compare the morphology and body condition of the west and east coast humpback whale populations. More specifically, we aimed to compare the (1) morphological measurements (e.g. body width, head length, length to blowhole, width of eyes and fluke width), (2) the average body condition of each reproductive class (calves, juveniles, adults and lactating females), and (3) the change in body condition for each reproductive class over the course of the breeding season. Because of the genetic mixing between the populations, we hypothesised there would be no differences between the populations across all three aims.
Methods
Data collection
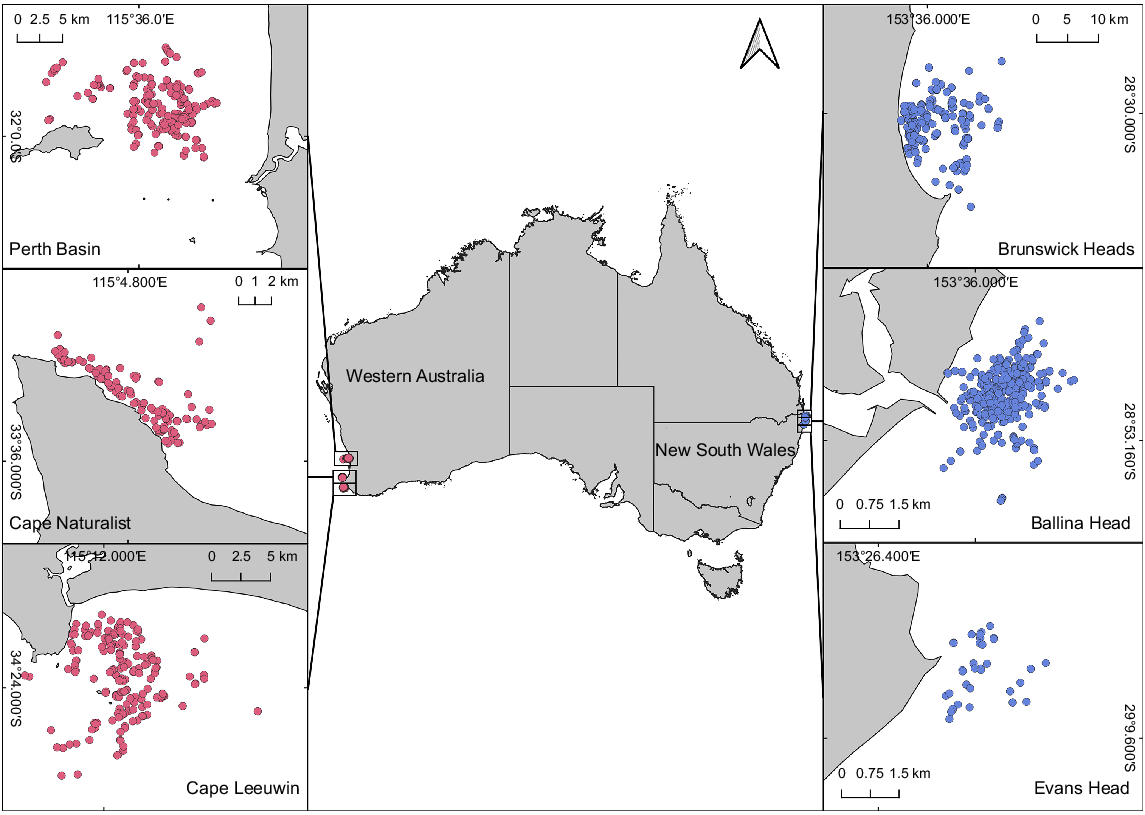
Data on the east coast were collected from three sites in subtropical northern New South Wales (NSW), Australia, from June to November 2020, including Ballina Head, Evans Head, and Brunswick Heads (Fig. 1). The sampling periods covered the peaks of both the northern (June–August) and southern (August–November) migrations (Russell et al. 2022). Migration direction was determined by time of sampling and predominate direction of travel. Data on the west coast were collected in the south of Western Australia (WA) in 2017 and 2021 from Flinders Bay (Cape Leeuwin) and Geographe Bay (Cape Naturalist), and additionally in the Perth Basin in 2021 (Christiansen et al. 2020b). Data for the northbound migration were obtained from Flinders Bay from April to August, and data for the southbound migration were collected from Geographe Bay and the Perth Basin between August and November (Fig. 1). The chosen locations allowed humpback whales to be sampled as they entered (northern migration) and exited (southern migration) Australian waters, to and from their breeding grounds. The study locations on Australia’s west and east coasts are ~3500–4000 km from the respective feeding areas.
Map of the sampling locations of the west-coast humpback whale population off south Western Australia (including Perth Basin, Cape Naturalist, and Cape Leeuwin) sampled in 2017 and 2021 and of the east-coast population off mid-eastern Australia (including Brunswick Heads, Ballina Head and Evans Head) sampled in 2020. Dots indicate the locations of all photographed individual whales, with those sampled in Western Australia in pink (n = 571) and those on the east coast of Australia in blue (n = 701).
Along the east coast, sampling was conducted from two headland sites (Ballina Head and Evans Head) and from an 8.5 m Cougar Cat research vessel operating out of Brunswick Heads. A DJI Phantom 4 Pro UAV (weight 1388 g, diagonal size 350 mm, D1 Store Brisbane) with an integrated camera (focal length of 8.8 mm and sensor size of 12.8 × 7.2 mm) was used to record video footage of whales (Russell et al. 2022). The west-coast data were collected in 2021, and combined with data previously collected in 2017 (Christiansen et al. 2020b). In 2017, sampling was conducted from a small (~6 m) research vessel by using a DJI Inspire 1 Pro UAV (weight 3400 g, diagonal size 559 mm, D1 Store Perth) with a Zenmuse X5 camera and a 25 mm lens (sensor size of 17.3 × 13 mm), with a laser range finder attached (Christiansen et al. 2020b). In 2021, sampling in Western Australia took place onboard a whale-watching vessel by using the same UAV model as was used on the east coast (DJI Phantom 4 Pro).
Once a whale was sighted, the UAV was launched from either the headland (east coast) or vessel (west coast) and flown 20–60 m in altitude towards the whale. Once above the whale, the UAV descended to 20–30 m in altitude for approximately 10 min to record videos from above the whale. From this position, zenithal (from directly above) 4 K ultra-high definition (UHD) video recordings were made of the dorsal side of surfacing humpback whales. Body-height data (dorso-ventral distance) when the whale rolled on its side were also obtained to calculate body volume (from 2017 data; Christiansen et al. 2020b).
Data processing
A still frame of each individual was obtained from the UAV videos. The ideal frame for photogrammetry needs the whale to be lying flat on the surface, the body straight and non-rolled, and the contours of the dorsal side clearly visible (Christiansen et al. 2016a). Still-frame photos of the body height were similarly extracted, with the whale rolled on the side (Christiansen et al. 2020b). Each still frame underwent quality control and was graded for focus, body posture, and length and width measurability, by using protocols from Christiansen et al. (2018).
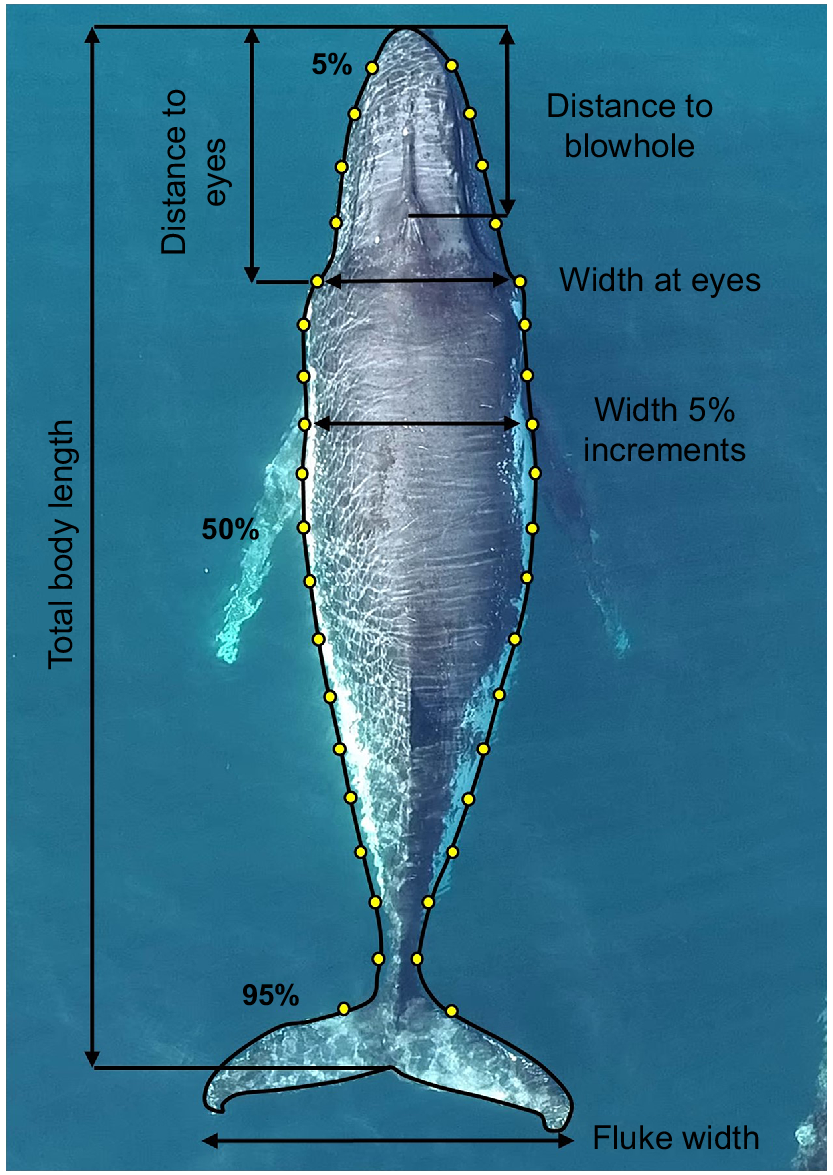
Morphometric measurements, including the total body length (from the tip of the rostrum to the notch of the tail fluke), body width (at 5% intervals along the body axis), head length (from the tip of the rostrum to the eyes), length to blowhole (from the tip of the rostrum to the top point of the blowhole), and width between the eyes, were derived only for those individuals with at least a good-quality aerial photograph (Fig. 2) (Christiansen et al. 2016a). Body-height data were extracted using 5% intervals along the body axis, similar to body width. Using the body height of an individual will account for all body fat reserves, of which a body volume can be calculated. These measurements were completed once on each individual, by using the best still frame according to the quality-control measures. Because animals are migrating through the area, it is unlikely that the dataset contains replicates; however, to mitigate the risk of the same individual being entered into the dataset more than once, photo-identification of each individual was taken by using a DSLR camera and individuals were compared among sampling days and within a sampling day. The altitude of the UAV (obtained from either the UAV barometric altimeter (2020 and 2021) or a laser range finder (2017)), camera sensor size, focal length and image resolution were used to convert the relative length and width measurements of the whale, expressed as the number of linear pixels in the image to absolute size (m) by using the following equation (Christiansen et al. 2018):
A photograph of a humpback whale collected via unmanned aerial vehicle, with yellow points indicating the position and black lines indicating the length of morphometric measurements, including length and width at 5% increments along the body axis to assess body condition. Body-height data were also obtained to calculate volume (see Christiansen et al. 2020b).
Whales were classified according to reproductive class, including calves, juveniles, adults, or lactating females. Individuals were assigned either lactating females and calves because of the close and consistent association, and calf size being approximately <8 m in body length and/or <2/3 body length of their mothers (Sprogis et al. 2020a). Because historical whaling data have recorded sexual maturation of humpback whales to occur at approximately 11.2 m in length (Chittleborough 1965), individuals <11.2 m that were not classified as calf were classified as juveniles, whereas those ≥11.2 m were classified as adults (following Christiansen et al. 2016a).
The eastern coast data have been presented in Russell et al. (2022) and the west coast data have been presented in Chrisitiansen et al. (2020b) and Russell et al. (in press). In this study, we combined the two data sets to calculate a common body condition (BC) metric for comparison. First, the body volume (BV) of the whales was calculated from the body width, body length (BL) and height data, following procedures from Christiansen et al. (2019). Height data were obtained using height-to-width ratios, which were calculated using still frames of whales with both dorsal (width) and lateral (height) images, from data collected during Christiansen et al. (2020b). Each whale was modelled using small ellipses to form the cross-section of its body at each 5% increment. The ellipses varied in the ratio of width and height according to each segment along the whale body (Christiansen et al. 2019). The volume for each body segment (ellipses) was then calculated (Christiansen et al. 2019). We used a linear interpolation of both body width and height from 0% to 5% BL (tip of the rostrum) and from 85% to 100% BL (tail region). The total BV of a whale was calculated by the summation of all body segments and BC was calculated from the residual of the log-linear relationship between BV and BL (Christiansen et al. 2018).
Measurement errors
The body condition metric used in this study uses the relationship between body volume (based on the body widths and heights of an individual) and the body length. Therefore, although photogrammetry studies that use UAVs carry inherent measurement errors from the recorded altitude (i.e. altimeter accuracy), the relationship between body volume and body length should remain the same. In saying this, the reported body lengths in this study will carry some error. To test the measurement error from the UAV barometric altimeter and the laser range finder used for this study, we performed calibration tests on objects of known size. Measurement errors using the laser range for the 2017 sampling year have been described in Christiansen et al. (2018). To test the UAV barometric altimeter for the 2020 and 2021 sampling years, two objects of 5 and 10 m were placed on a flat surface and three UAV flights were conducted over each object at altitudes of 5–100 m. Between 5 and 50 m, the UAV was flown at 5 m intervals, whereas between 50 and 100 m, the UAV was flown at 10 m intervals. A video was recorded during each flight, with a still image being extracted at each interval. At each interval, the length of the object was estimated using a custom-written script in R (Christiansen et al. 2016a; R Core Team 2021) and was converted from pixels to absolute metres by using methods described in Christiansen et al. (2018). The percentage measurement error was calculated by comparing the estimated and actual size of the object at each altitude for each UAV flight. The measurement errors were compared at each altitude by using an ANOVA and the coefficients of variation (CV) were calculated.
Data analysis
To investigate the differences in body-shape morphology, we used linear mixed-effects models (LME) in R v4.1.2 (R Core Team 2021). Differences in body width (as a percentage of BL) along the body axis (5–95%; width at x% body axis) of whales were compared between the east and west coasts (population) and within each reproductive class (Aim 1). As BC (and width) significantly decreases along migration direction (i.e. travelling north towards breeding grounds, compared with travelling south towards feeding grounds) (Christiansen et al. 2020b; Russell et al. 2022), we used migration direction as a random variable in the model (LME: width at x% body axis ~ population (1| migration direction), subset = reproductive class). A subset of the data collected using only barometric measurements of altitude were used to compare structural morphology. We plotted each structural variable (including head length, distance between eyes, distance to blowhole and fluke width) against body length and used generalised additive models (GAM) to test differences between the two populations (Aim 1). We used LMEs to compare the difference in mean BC between the east and west coasts (population) for each reproductive class (Aim 2) (LME: BC ~ population (1| migration direction), subset = reproductive class). Because the west coast population was sampled over 2 years, we tested the effect of year on the BC of each reproductive class in this breeding population (LME: BC ~ year (1| migration direction), subset = reproductive class). Linear models (LM) were used to investigate the change in BC over the breeding season for juveniles, adults and lactating females (Aim 3). A GAM with Gaussian family distribution was used for calves to account for non-linear relationship, because they acquire energy (from their mothers) during the breeding season. Migration time was defined as day of the year (Day) for adults and juveniles, whereas relative calf length (RCL), expressed as a percentage of the mother’s body length, was used as a proxy for days post-partum for lactating females and calves (Russell et al. 2022). The BC was plotted for each reproductive class in each population against migration time (LM: BC ~ Day/RCL, subset = reproductive class and population or GAM: BC ~ smooth spline [RCL], subset = reproductive class and population). Model selection was based on data exploration and around the energetic usage/acquisition of each reproductive class during their breeding season. Linear models and linear mixed-effects models were deemed appropriate for the temporal scale of the explanatory variable and the spread of data, whereas a generalised additive model was used for calves because their energetic acquisition may not occur linearly throughout the breeding season. Although there exists a possibility of potential biasing with regard to the timing of samples within migration direction when contrasting the two populations, there has been no discernible evidence to support migration timing influencing body condition (Russell et al. 2022). In contrast, migration direction (northbound/southbound) has been demonstrated to have a strong influence on body condition. Hence, the models accounted for migration direction by assigning a random intercept, with data assumed to be independent therein. All models were visually inspected for signs of violations of model assumptions, including homoscedasticity, normality of residuals and independence of data points. In addition, we tested the influence of outliers by using Cook’s distance (Nieuwenhuis et al. 2012).
Ethical approval
Research was conducted under a research permit from the Department of Planning, Industry and Environment (License no. SL102097), Department of Primary Industries (Permit no. MEAA20/170), Department of Biodiversity, Conservation and Attractions, WA (Permit no. 08-000702-1, and License no. FO25000334), Department of Primary Industries and Regional Development (License no. U6/2020-2022) and animal ethics permits from Murdoch University (R2935/17 and RW3216/20) and Southern Cross University (19/052, 21/030). The UAV was operated under a UAV Operator Certificate (CASA.ReOC.0075 and CASA.ReOC.0882) as well as a Remotely Piloted Aircraft System Licence and Remote Pilot License in accordance with regulation by the Australia Civil Aviation Safety Authority.
Results
The research effort totalled 180 survey days, with 68 days on the east coast and 112 days on the west coast (Christiansen et al. 2020b; Russell et al. 2022; Russell et al. in press). We extracted a total of 1272 still images from the UAV videos of individual humpback whales (701 on the east coast and 571 on the west coast). In total, 973 still images from individual whales passed quality control for morphometric measurements and were used in the final analysis (Table 1). There was no visible behavioural response from individual humpback whales owing to the presence of the UAV. The UAV was maintained ≥20 m in altitude, where possible acoustic disturbance from the UAV would be minimal (Christiansen et al. 2016b).
| Reproductive class | West coast | East coast | Total | |
|---|---|---|---|---|
| Calves | 71 | 48 | 119 | |
| Juveniles | 83 | 166 | 249 | |
| Adults | 235 | 251 | 486 | |
| Lactating females | 71 | 48 | 119 | |
| Total | 460 | 513 | 973 |
Body length, volume and condition
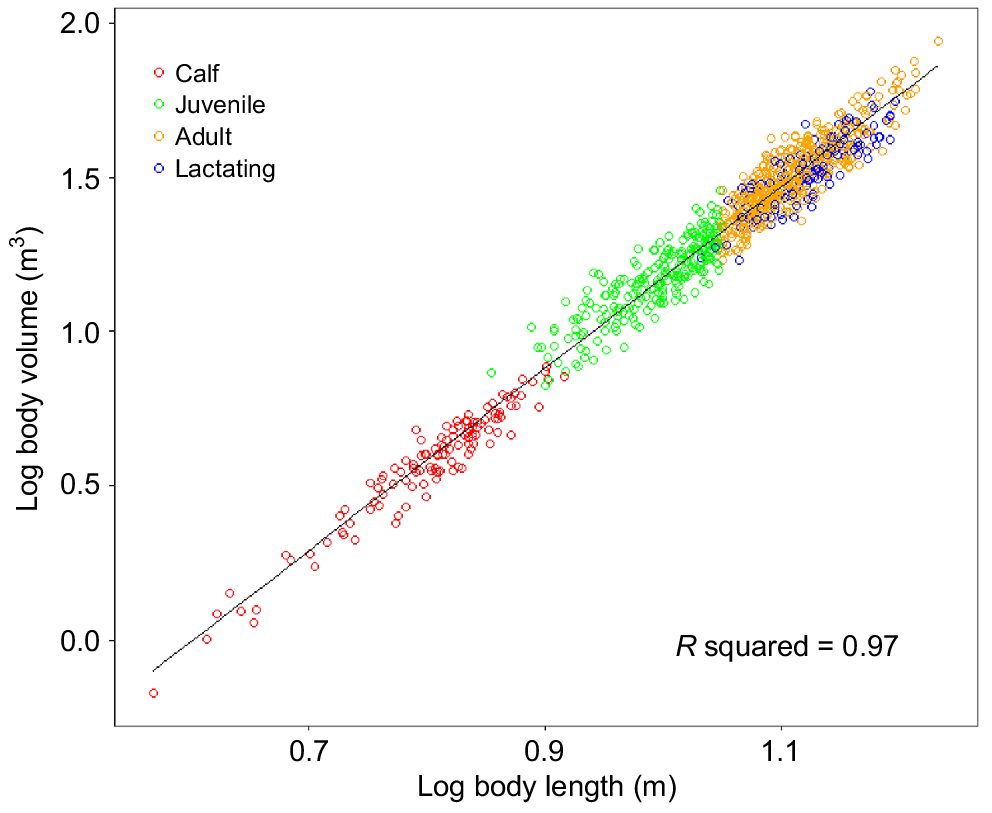
The measured body lengths for individuals sampled along the east and west coasts ranged between 3.7 m and 17.10 m (±5.3% s.e.) (3.7–16.2 m on the east coast and 4.2–17.1 m on the west coast) (Supplementary Fig. S1), whereas the BC ranged from −0.32 to 0.54 (−0.32 to 0.52 on the east coast and −0.31 to 0.54 on the west coast) (Table 2). The relationship between body length and body volume (F1,1008 = 3401, P-values < 0.01, R2 = 0.97) (Fig. 3) could be described by the equation
| Reproductive class | Body length (m) | Body condition | |||
|---|---|---|---|---|---|
| East coast | West coast | East coast | West coast | ||
| Calf ( ± s.d.) | 3.70–7.94 (6.00 ± 0.76) | 4.19–8.47 (6.78 ± 0.81) | −0.32 to 0.34 (−0.01 ± 0.13) | −0.26 to 0.16 (−0.04 ± 0.10) | |
| Juvenile ( ± s.d.) | 7.95–11.2 (10.08 ± 0.83) | 7.14–11.14 (9.67 ± 0.99) | −0.27 to 0.43 (0.03 ± 0.15) | −0.23 to 0.54 (0.06 ± 0.18) | |
| Adult ( ± s.d.) | 11.20–16.20 (12.74 ± 1.05) | 11.21–17.10 (13.09 ± 1.18) | −0.23 to 0.52 (0.06 ± 0.13) | −0.31 to 0.35 (−0.02 ± 0.12) | |
| Lactating female ( ± s.d.) | 10.78–15.09 (12.85 ± 1.05) | 11.06–16.83 (13.68 ± 1.17) | −0.20 to 0.38 (0.03 ± 0.13) | −0.28 to 0.19 (−0.10 ± 0.11) | |
| Total | 3.70–16.20 | 4.19–17.10 | −0.32 to 0.52 | −0.31 to 0.54 | |
See Table 1 for sample sizes for each reproductive class.
Measurement errors
The average measurement error using the UAV barometric altimeter to measure an object of known length was 5.3% for altitudes between 5 and 100 m. The highest errors occurred at ≤15 m, with errors of 8.8%, 10.2% and 6.9% at 5, 10 and 15 m respectively. There was no significant difference in measurement errors at altitudes from 20 to 100 m (Fig. S2). The average error for altitudes between 20 and 100 m was 4.48%. The lowest CV of 0.20 was recorded at 100 m altitude, whereas the highest CV of 1.26 was recorded at 5 m altitude. Owing to the significant error incurred at ≤15 m, the UAV stayed above 20 m for humpback whale measurements. The measurement error with the use of the laser range finder during the 2017 sampling year was 0.73 cm (s.d. = 0.494) (Christiansen et al. 2018).
Morphometrics of the east and west coast populations (Aim 1)
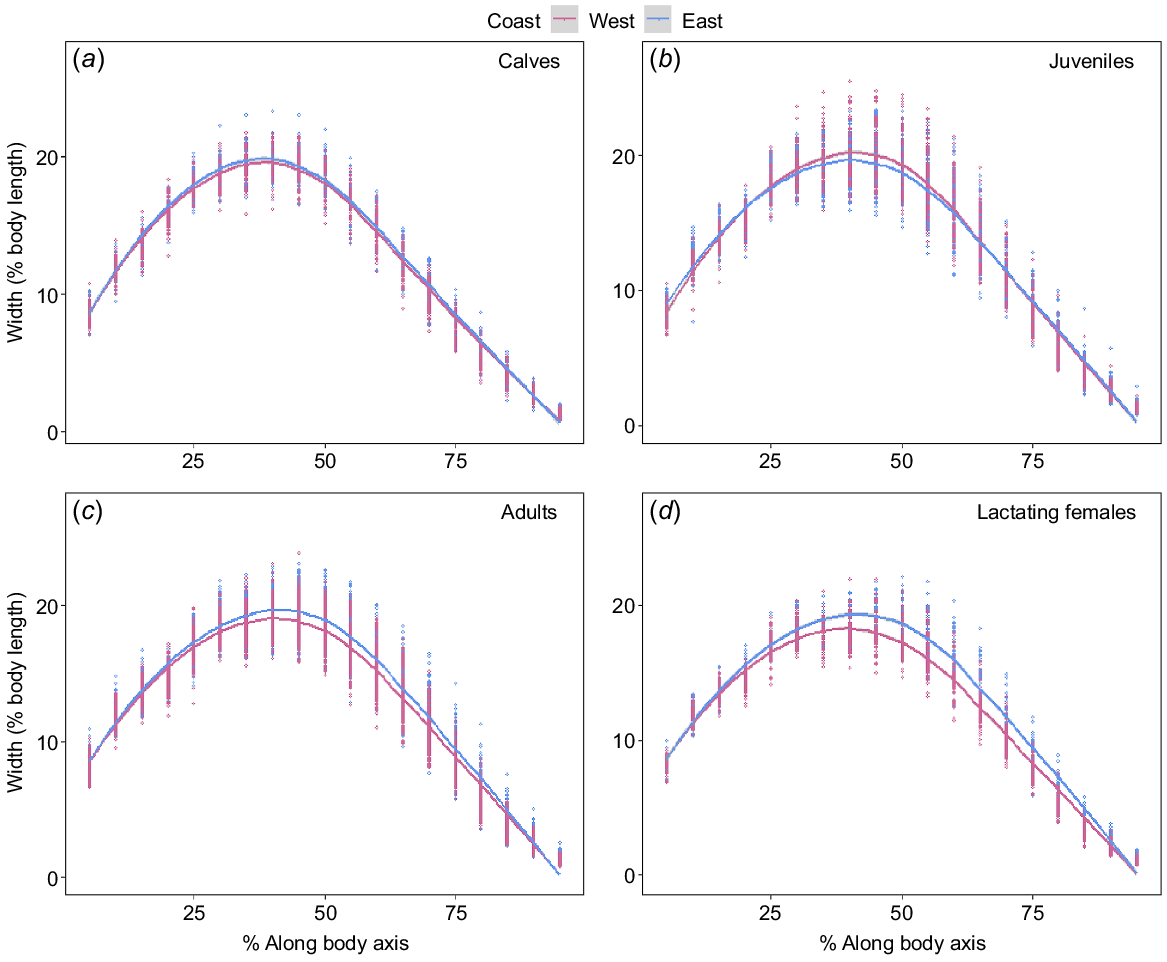
Adults and lactating females showed some difference in the width of structural body areas (head and tail regions) between the two populations; however, only lactating females had a large effect size (Supplementary Table S1). Metabolically active areas along the body (25–80% BL) exhibited differences for juveniles, adults and lactating females, whereas calves showed no difference between populations (Fig. 4, Table S1). Juveniles seemed marginally wider along the anterior section of the mid-region; however, the effect size was small (Fig. 4b, Table S1). Both adults and lactating females in the east coast population were wider across the entire metabolically active area, which is indicative of a better BC (Fig. 4c, d).
Linear mixed-effects model showing estimated width (as a percentage of estimated body length) along the body axis at 5% increments (head to tail; 5–95%) for (a) calf (east coast, n = 48; west coast, n = 71), (b) juvenile (east coast, n = 166; west coast, n = 83), (c) adult (east coast, n = 251; west coast, n = 235) and (d) lactating female (east coast, n = 48; west coast, n = 71) humpback whales sampled on the west (pink) and east (blue) coasts of Australia. Migration direction as a random variable because width significantly decreases with migration direction (north vs south). Data points represent the width at each segment along the body axis for a particular individual.
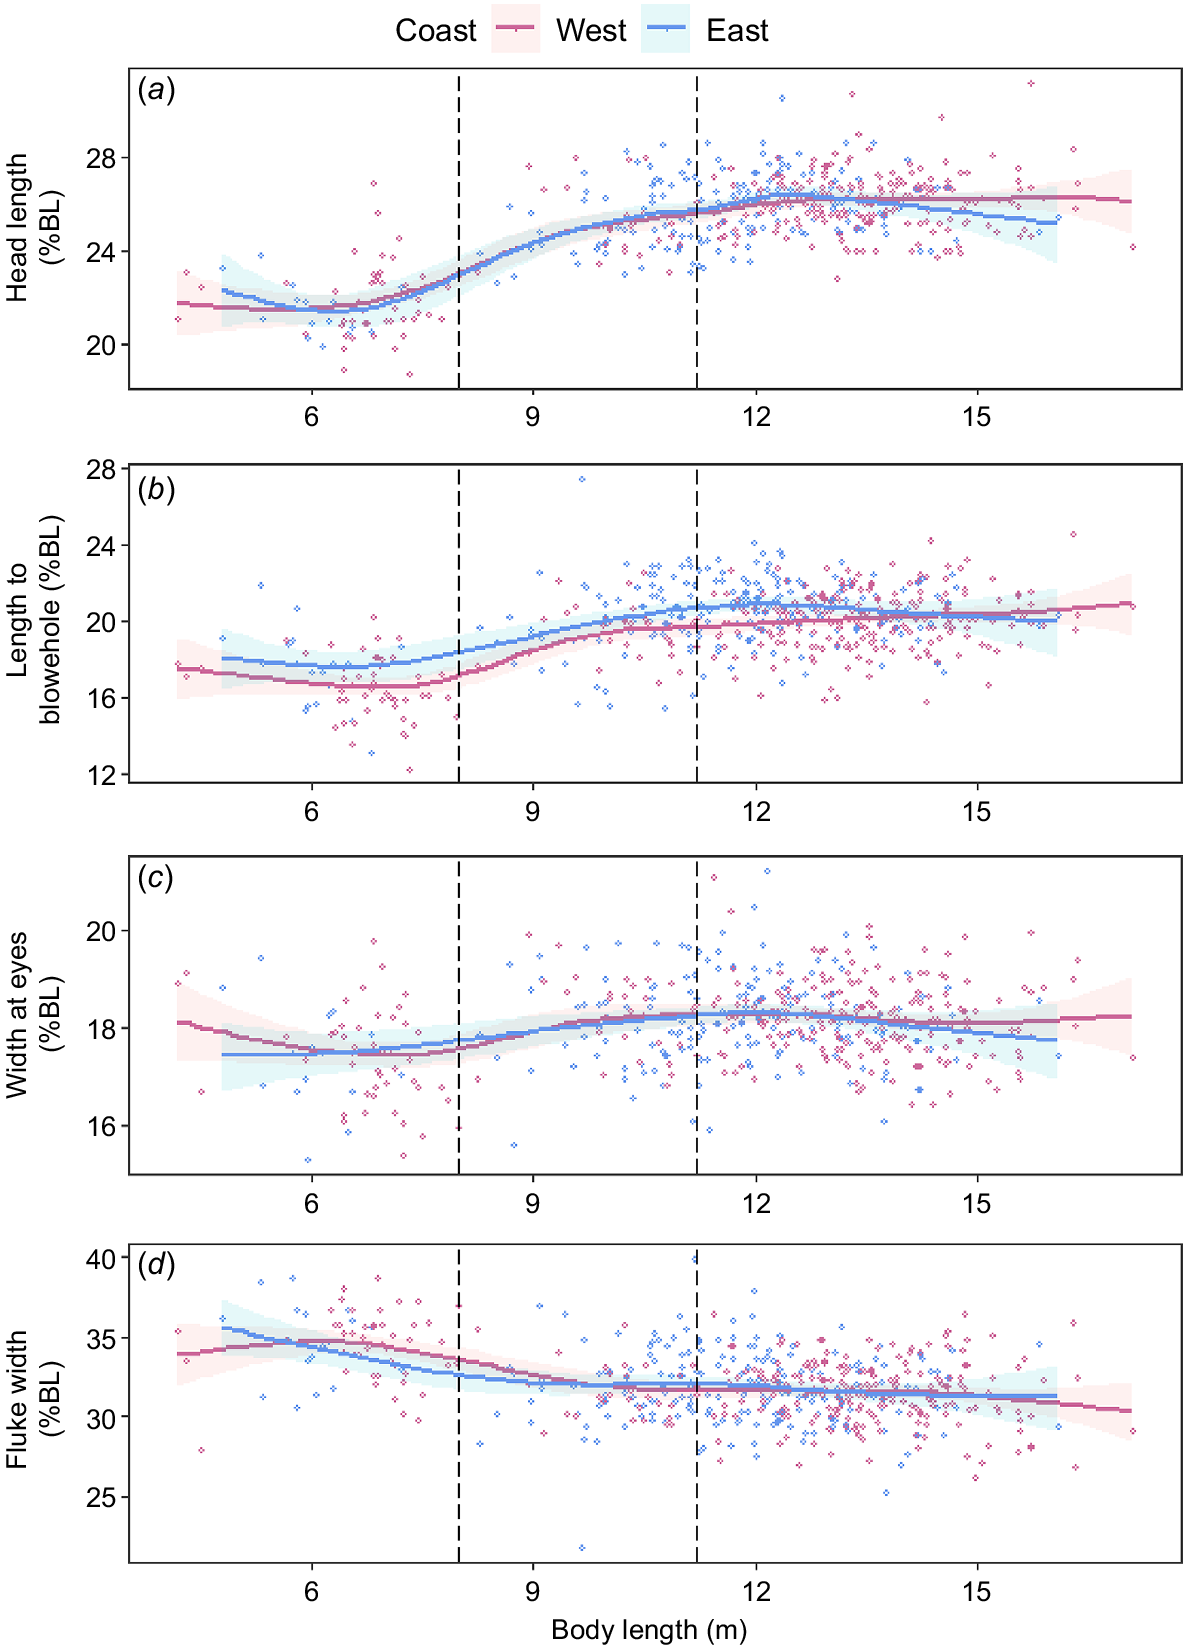
Both populations had significant (P < 0.001) relationships with each structural variable (head length, length to blowhole, width at eyes and fluke width) and total body length (Fig. 5). However, there was no significant (P > 0.05) difference of this relationship between the two populations for any structural variable. Only the length to blowhole differed marginally for individuals between 11 and 13 m body length, but the magnitude of difference was <1% (Fig. 5b).
Morphometric comparisons for (a) head length, (b) length to blowhole, (c) width of eyes and (d) fluke width (percentage of body length) between the east (blue) and west (pink) coast populations of humpback whales in Australia (n = 512). Solid lines were fitted for each population by using a generalised additive model; shaded areas represent 95% confidence intervals for the model fits. The left-most dashed line represents upper limit of calf length (8 m) used in this study, and the right-most dashed line represents the body length cut-off between juvenile (<11.2 m) and adult (≥11.2 m) whales, as derived from Christiansen et al. (2016a).
Body condition comparison between populations (Aim 2)
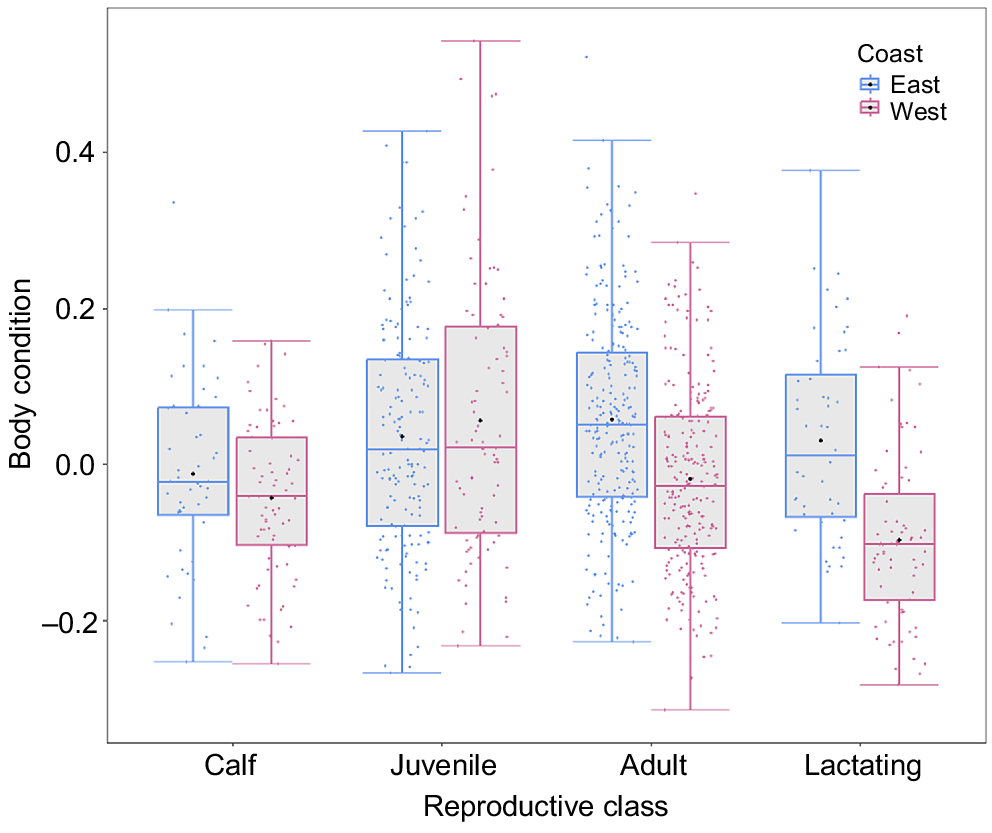
There was a significant difference between populations in mean BC for both adults (χ2 = 55.78, P < 0.001) and lactating females (χ2 = 32.46, P < 0.001) (Fig. 6). The east coast (BSE1) adults and lactating females were in a relatively better condition than were the west coast (BSD) by 7.7 and 11.1 percentage points respectively. Juveniles (χ2 = 0.44, P = 0.502) and calves (χ2 = 2.35, P = 0.125) showed no significant difference in mean BC between the two populations (Fig. 6). For the west coast population, year had a significant effect for juveniles only (χ2 = 10.54, P < 0.01) (Fig. S3).
Boxplot showing the body condition of different reproductive classes (calves: n = 48 (east coast), 71 (west coast); juveniles: n = 166 (east coast), 83 (west coast); adults: n = 251 (east coast), 235 (west coast); and lactating females: n = 48 (east coast), 71 (west coast)) of humpback whales between the west coast (outlined in pink) and east coast (outlined in blue) of Australia. Jittered points represent sampled individuals (pink = west coast, blue = east coast). The black points indicate the means for each reproductive class in their respective population. Box margins indicate upper and lower quartiles, with the solid lines representing the median body condition for each reproductive class. Whiskers depict maximum and minimum ranges of body condition.
Change in body condition over the breeding season (Aim 3)
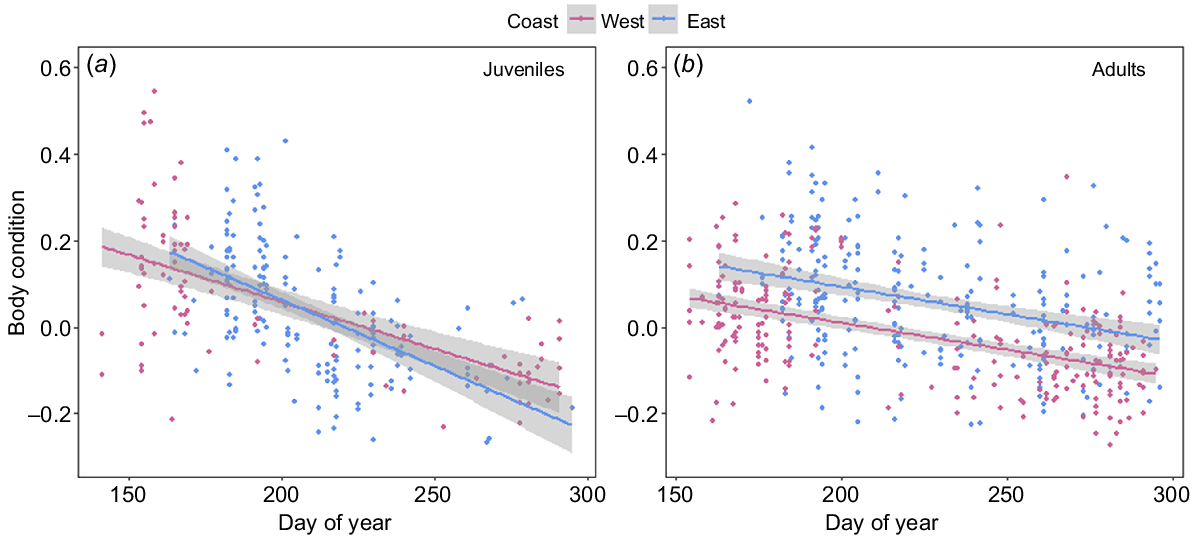
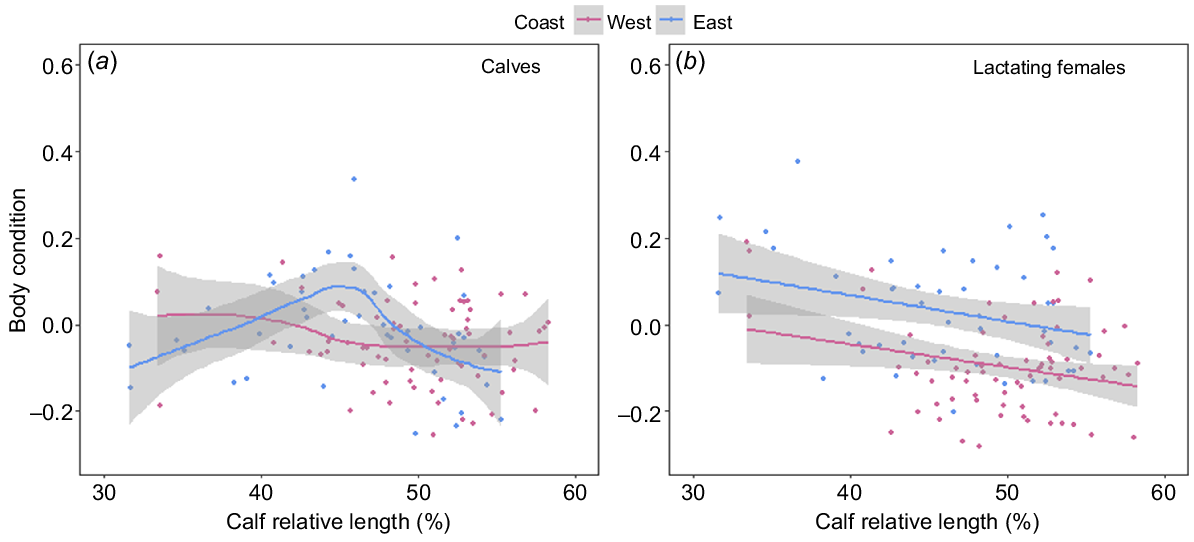
In both populations, all reproductive classes, with the exception of calves, showed a significant decrease in BC over the course of the breeding season. Adult humpback whales from both the east (F1,249 = 32.17, P < 0.001) and west (F1,233 = 83.44, P < 0.001) coast populations declined in BC at an average rate of 0.12 (±0.01) percentage points per day (Fig. 7a). Lactating females sampled on the east (F1,46 = 4.2, P = 0.045) and west (F1,69 = 5.15, P = 0.026) coasts showed a significant decrease in BC over the course of their migration (days post-partum), with females losing approximately 0.60 and 0.52 (±0.2 s.e.) percentage points in BC with every 1% increase in calf relative length respectively (Fig. 8b). Juveniles from both the east (F1,164 = 68.61, P < 0.001) and west coasts (F1,81 = 58.26, P < 0.001) declined significantly in BC over the course of the breeding season, at a rate of 0.30 (±0.03 s.e.) and 0.21 (±0.02 s.e.) percentage points in BC per day respectively (Fig. 7b). Calves sampled on the east coast (F1,9 = 1.6, P = 0.001) showed a significant curvilinear relationship in BC change over the course of their migration (Fig. 8a), whereas calves sampled on the west coast showed no change in BC over their migration (F1,9 = 0.08, P = 0.188) (Fig. 8a).
Linear models showing the change in body condition over the breeding season for humpback whales on the west (pink) and east (blue) coasts of Australia for (a) juveniles (east coast: n = 166; west coast: n = 83) and (b) adults (east coast: n = 251; west coast: n = 235). Solid lines represent predicted values from the fitted models, with 95% confidence intervals represented by grey-shaded areas.
(a) Generalised additive model and (b) linear model showing the change in body condition with calf age (calf relative body length as a percentage of maternal body length used as a proxy for days post-partum) for humpback whale cow–calf pairs on the west (pink, n = 71) and east (blue, n = 48) coasts of Australia. Solid lines represent predicted values from the fitted models, with 95% confidence intervals represented by grey-shaded areas.
Discussion
This study compared the external morphology and body condition (BC) of two Australian humpback whale populations and estimated BC changes over the breeding season. The west and east coast populations did not differ significantly in their morphology. East coast adults and lactating females were in significantly better BC than were the west coast individuals. This could be due to differences in sampling time of each population because the west and east coast were sampled in two separate years. However, each population largely feeds, migrates and breeds in different areas, each being influenced differently by climatic regimes, climate change, and anthropogenic stressors, potentially affecting the ability of each population to acquire similar amount of energy. Both populations showed similar patterns in BC loss over the breeding season, with adults, lactating females and juveniles all declining significantly in condition over the breeding season, indicating that the energetic usage over the breeding season is similar for both populations. However, in contrast to our hypothesis, west coast calves exhibited a different relationship with migration timing (days post-partum) and BC from the east coast calves. This difference may be influenced by the poorer BC of west coast lactating females.
It is worth noting that all photogrammetry studies carry inherent errors in measurement accuracy (Christiansen et al. 2018; Burnett et al. 2019; Bierlich et al. 2021; Ejrnæs and Sprogis 2022). To test the accuracy of measurements made during this study, a calibration test was completed with six UAV flights over an object of known length. The average error over all altitudes (5–100 m) was 5.3%, with the highest errors occurring at 5 and 10 m. No measurements of whales were taken below 20 m in altitude during this study, therefore all body length measurements presented in this study include a confidence interval of ±5.3%. Similar accuracy tests were completed by Ejrnæs and Sprogis (2022), with errors of 2.1 cm (~3% for a 70 cm object) between 25 and 30 m in altitude, by using a Phantom 4 UAV. The largest adult in this study measured a total body length of 17.1 m, which is likely to be a measurement error. However, the method to calculate BC uses the relationship between body length and body width, so whereas length and width may carry some error, the relationship between the two variables remains the same. In saying this, there may be some precision error when measuring whales that are not completely flat, and therefore will affect the relationship used for the BC metric. Errors pertaining to this precision have been recorded at 0.30% and 0.38% for body length measurements, and 2.11% and 2.31% for body width measurement by using photographs of whales that were graded 1 or 2 for quality respectively (Christiansen et al. 2018).
Morphometrics of east and west coast populations (Aim 1)
We did not detect morphological differences between the two populations for head length, width at eyes, or fluke width, although for individuals between 11 and 13 m in length, the distance to the blowhole was marginally longer (<1%) in the east coast individuals. Using historical whaling data from 1949 to 1962, Chittleborough (1965) tested the morphological difference between the two Australian populations and concluded that the difference in measurements between two observers measuring whales from the same population was greater than the difference in measurement between the two populations. The authors concluded that there may be sufficient interchange between the two populations to prevent differences in morphology and genetics occurring. In addition, morphometric measurements from humpback whales caught during whaling in two other southern hemisphere breeding populations, South Georgia (Breeding stock A, BSA) and South Africa (Breeding stock B, BSB), did not show any significant differences across the head region (Mathews 1937). Allometric growth was also considered in the studies of Mathews 1937; measurements taken from BSA and BSB found that as total length increased (i.e. with age), both populations increased the relative size of their head region and decreased the relative size of their tail region (Mathews 1937). Similar positive allometry was recorded in the present study, where relative head length and length to blowhole increased with body length, continuing to grow with length (age). The relative head length ranged between 18% and 24% of the body length when a calf, reaching between 24% and 30% of the body length when sexually mature. While length to blowhole ranged from 12% to 20% of the body length as a calf, and increased to 16–24% when sexually mature. Negative allometry was also observed, with relative fluke width decreasing with increasing body length, ranging from 30 to 40% of the body length as a calf, decreasing to 25–35% when sexually mature. This allometric growth has also been observed in other baleen whales, such as fin whales (Balaenoptera physalus), bowhead whales (Balaena mysticetus) and blue whales (Balaenoptera musculus sp.) (Goldbogen et al. 2010; Armfield et al. 2011; Ortega-Ortiz et al. 2018). When addressing the morphology of a species, it is important to consider allometric growth. One way to do this is by dividing samples into reproductive class and offering a direct comparison. The morphological and allometric results from this study, along with historical whaling data, provided evidence that the two populations are morphologically similar.
Body condition comparison between west and east coast populations (Aim 2)
The BC estimates for west coast adults and lactating females were lower than those for the east coast by 7.7 and 11.1 percentage points respectively. This difference in BC is concerning when taking into consideration the total BC loss over an entire breeding season, when sexually mature reproductive humpback whales lose approximately 14.5 percentage points (Christiansen et al. 2020b). There may be several reasons as to why there is a difference in BC between the west and east coast populations, including temporal variation. Baleen whales showed fluctuations in BC among years of varying environmental conditions (Lockyer 1986; Vikingsson et al. 2013; Soledade Lemos et al. 2020; Wachtendonk et al. 2022), with the potential for this change to be extreme (Coughran et al. 2023). This may lead to different amounts of acquired energy among different feeding seasons and, in turn, a poorer or better BC at the time of sampling. Climate drivers, including the El Niño Southern Oscillation (ENSO) and the Southern Annular Mode (SAM), affect environmental conditions and resource availability in the Southern Ocean (Stammerjohn et al. 2008; Holland et al. 2017; Fogt and Marshall 2020), which can, in turn, affect the nutritional condition of predators. In particular, changes to sea ice in Antarctica can result in dramatic changes in the abundance of lower trophic organisms that rely on such habitats for food sources and survival. For example, Antarctic krill (Euphausia superba), which is a species of primary prey for humpback whales, is highly sensitive to changes in ocean conditions as it relies on sea-ice extent during larval and juvenile stages of life (Loeb et al. 1997; Nicol 2006). A decrease in sea-ice extent owing to ENSO or the SAM will likely cause a change in krill larval recruitment and survival (Loeb et al. 1997; Quetin et al. 2007), and also prey availability for top Antarctic marine predators such as humpback whales (Flores et al. 2012), and in turn affect the amount of energy acquired during a feeding season (Pallin et al. 2023). The feeding season prior to data collection for the east coast took place during the austral summer of 2019–20, during a neutral ENSO phase (Bureau of Meteorology 2022), whereas the feeding seasons prior to data collection for the west coast were the austral summers of 2016–17 and 2020–21, during a La Niña watch and La Niña active (moderate to strong level) respectively. During these times, the SAM was predominantly in a positive phase, with negative phases occurring briefly at the end of 2017 and 2019 (NOAA 2023).
Humpback whales are an important sentinel species, meaning that they are reliable indicators of oceanic ecosystem health and environmental change (Bengtson Nash et al. 2018). Quantifying biological processes of these sentinel species, such as condition and diet, and how they respond to environmental changes or fluctuating prey availability, is an important step in understanding how climatic regimes or climate change may affect these populations. A study examining the adiposity and diet of the east coast humpback whales over an 8-year period found that a particularly lean year in terms of adiposity for the population (2011) coincided with one of the strongest La Niña events on record (Bengtson Nash et al. 2018). In addition, elevated concentrations of nitrogen and carbon stable isotopes were found in the baleen plates of east coast humpback whales corresponding to La Niña events, potentially indicating reduced feeding opportunities during La Niña (Dedden and Rogers 2022). Furthermore, 23% of the variation in fatty acid profiles (used to indicate dietary consumption) in eastern coast whales was explained by SAM, indicating the significance of these climatic phenomena on the diet of humpback whales (Groß et al. 2020). On the basis of this, it is possible that the conditions resulting from La Niña and the positive SAM negatively affected the BC during the feeding season of the west coast population, resulting in a poorer BC for adults and lactating females than for the east coast population.
Estimated calf BC was similar between the two populations, despite the BC of lactating females being significantly poorer in the west coast population. Humpback whales exhibit a positive linear relationship between maternal and calf BC, whereby fatter mothers generally have fatter calves (Christiansen et al. 2016a). This is because the energy reserves a female carries will determine fetal growth rates, birth size, and calf growth rates (Christiansen et al. 2018, 2022), which should aid their swimming ability and survival. Therefore, because the estimated BC of lactating females was significantly poorer in the west coast population, one would expect west coast calves to also display poorer BC than that of the calves in the east; however, this was not the case. Our results are similar to those reported for North Atlantic right whale mothers, which showed significantly poorer BC than did the southern right whale mothers, whereas their calves exhibited a robust BC (Christiansen et al. 2020a). The mean growth rate of the North Atlantic right whales has decreased since 1981 (Stewart et al. 2021), which may reflect decreasing BC in mothers (Christiansen et al. 2020a). Consequently, North Atlantic right whales are potentially extending their weaning time, which may be causing longer inter-calving intervals (Christiansen et al. 2020a). Future investigations examining reproductive intervals in the two Australian humpback populations could provide further insight and determine whether the west coast populations exhibit extended weaning and longer inter-calving intervals as a result of poorer overall BC. If this is the case, we would expect to see population growth decrease from the previously reported rate of 13% in 2012 (Kent et al. 2012), making continued monitoring important for this population, so as to identify any decline in body condition from the baseline reported in this study.
Body condition change over the breeding season and comparison between populations (Aim 3)
Capital breeding baleen whales store energy in the form of blubber, muscle and visceral fat (Lockyer 1987). Variation in this stored energy can be observed by physical changes (i.e. fattening and thinning) in their body volume because of the seasonal feeding/fasting strategy (Lockyer 1987; Niæss et al. 1998; Christiansen et al. 2020b). All reproductive classes, with the exception of calves, followed a similar pattern of BC change over the breeding season. Our results showed that sexually mature individuals from the west coast arrived in Australian waters in poorer BC than did those in the east coast population, but maintained a similar difference in BC throughout their migration. This indicates that the differences observed during this study are most likely to be due to differences in energetic acquisition over the feeding season rather than differences in energetic usage over the breeding season. Both adult and lactating female humpback whales decreased BC over their breeding season (Christiansen et al. 2016a, 2020b; Russell et al. 2022). Our results indicated that this decline in condition happens at a similar rate for both populations. Juveniles exhibited no difference in BC between populations, arriving and departing Australian waters in relatively similar conditions, and declining in condition at a similar rate throughout the breeding season. This was not the case in Exmouth, Western Australia, where juveniles maintained their BC; however, data were taken closer to the breeding grounds and therefore may not reflect the full BC change over the breeding season (Christiansen et al. 2016a). Contrary to this, calves displayed different BC change over the breeding season between the two populations. We expected calves to increase in BC throughout the breeding season because they are nursing on high caloric milk from their mothers (Oftedal 1997). However, calves from the western coast maintained their BC, rather than increasing their BC, a similar pattern to that from Exmouth population (Christiansen et al. 2016a). However, calves from the east coast exhibited a curvilinear relationship over the breeding season, with early and late-migrating calves being in a significantly poorer BC than those migrating mid-migration (40–50% mother’s body length). The poorer condition of mothers from the west coast may be a contributing factor to differences in BC change of their calves over the breeding season. In addition, factors that this study did not test, including milk richness, behavioural differences or anthropogenic disturbances (i.e. boater presence) disrupting nursing, could cause differences observes in this study.
Conclusions
This study compared the morphology, BC and energetic usage over the breeding season of the two populations of humpback whales that migrate to northern Australian breeding grounds. We estimated a poorer BC in sexually mature individuals from the west coast than in those from the east coast, which is concerning given the BC difference is comparable to the BC loss during a full breeding season where individuals are predominantly fasting for 4–5 months. Although the direct consequences of this BC difference are not known, it is speculated that a poor condition may contribute to extended weaning time and longer inter-calving intervals (Christiansen et al. 2020a). The difference shown in this study could be influenced by variations in sampling time; however, differences in feeding opportunities, climatic regimes and/or environmental variables may also influence nutritional condition. These two populations, according to the latest estimates, are growing in abundance and are considered to be the two largest breeding populations in the world (Fleming and Jackson 2011; Kent et al. 2012; Noad et al. 2019). The few comparative studies between the two populations have shown that they experience climate regimes differently (Dedden and Rogers 2022), and also differ in feeding strategies (Eisenmann et al. 2016) and the associated mean lipid content (Groß et al. in press). These differences may influence their respective ability to sustain the high population levels that have been reported for these two populations, when subject to severe anthropogenic disturbances or reduced prey availability owing to climate-induced environmental changes (Kent et al. 2012; Noad et al. 2019). In addition, the migratory routes for each population exhibit variation in both anthropogenic stressors and environmental variables. With this in mind, it is important to provide separate baseline information on the BC of each population, so as to develop custom management plans that take into account the unique variables, threats and current condition of each population. Although the Australian humpback whale populations were recently delisted from the Endangered Species List (DAWE 2022), regular monitoring of their BC (every 5 years) is recommended to ensure that the population remains healthy. In addition, regular monitoring of a sentinel species, such as humpback whales, will help us understand changes in their Southern Ocean feeding grounds and how climatic phenomena influence the health and vital rates of each population.
Data availability
The data that support this study will be shared upon reasonable request to the corresponding author.
Declaration of funding
This project was supported and funded by Southern Cross University and the Ecological Society of Australia through the Holsworth Wildlife Research Endowment.
Acknowledgements
We thank Interspacial Aviation Service Pty Ltd for providing UAV training, Whale Watch Western Australia who provided us with the use of their vessel ‘Steep Point’ to collect data in 2021, as well as Cape Leeuwin Lighthouse, Turners Caravan Park and Dunsborough Lakes Holiday Resort for providing assistance and accommodation during fieldwork. The project could not have been a success without the dedication of the volunteers.
References
Andrews-Goff V, Bestley S, Gales NJ, Laverick SM, Paton D, Polanowski AM, Schmitt NT, Double MC (2018) Humpback whale migrations to Antarctic summer foraging grounds through the southwest Pacific Ocean. Scientific Reports 8, 12333.
| Crossref | Google Scholar |
Armfield BA, George JC, Vinyard CJ, Thewissen JGM (2011) Allometric patterns of fetal head growth in mysticetes and odontocetes: comparison of Balaena mysticetus and Stenella attenuata. Marine Mammal Science 27, 819-827.
| Crossref | Google Scholar |
Ashton DT, Bettaso JB, Welsh HH (2015) Changes across a decade in size, growth, and body condition of western pond turtle (Actinemys marmorata) populations on free-flowing and regulated forks of the Trinity River in Northwest California. Copeia 103, 621-633.
| Crossref | Google Scholar |
Bejder M, Johnston D. W, Smith J, Friedlaender A, Bejder L (2016) Embracing conservation success of recovering humpback whale populations: evaluating the case for downlisting their conservation status in Australia. Marine Policy 66, 137-141.
| Crossref | Google Scholar |
Bejder L, Videsen S, Hermannsen L, Simon M, Hanf D, Madsen PT (2019) Low energy expenditure and resting behaviour of humpback whale mother–calf pairs highlights conservation importance of sheltered breeding areas. Scientific Reports 9, 771.
| Crossref | Google Scholar |
Bengtson Nash SM, Castrillon J, Eisenmann P, Fry B, Shuker JD, Cropp RA, Dawson A, Bignert A, Bohlin-Nizzetto P, Waugh CA, Polkinghorne BJ, Dalle Luche G, McLagan D (2018) Signals from the south; humpback whales carry messages of Antarctic sea-ice ecosystem variability. Global Change Biology 24, 1500-1510.
| Crossref | Google Scholar | PubMed |
Bestley S, Andrews-Goff V, van Wijk E, Rintoul SR, Double MC, How J (2019) New insights into prime Southern Ocean forage grounds for thriving Western Australian humpback whales. Scientific Reports 9, 13988.
| Crossref | Google Scholar | PubMed |
Bettridge S, Baker CS, Barlow J, Clapham PJ, Ford M, Gouveia D, Mattila DK, Pace RM, Rosel PE, Silber GK, Wade PR (2015) Status review of the humpback whale (Megaptera novaeangliae) under the endangered species act. NOAA Technical Memorandum NMFS, 263. US Department of Commerce, National Oceanic and Atmospheric Administration, National Marine Fisheries Service, Southwest Fisheries Science Center.
Bierlich KC, Hewitt J, Bird CN, Schick RS, Friedlaender A, Torres LG, Dale J, Goldbogen J, Read AJ, Calambokidis J, Johnston DW (2021) Comparing uncertainty associated with 1-, 2-, and 3D aerial photogrammetry-based body condition measurements of baleen whales. Frontiers in Marine Science 8, 749943.
| Crossref | Google Scholar |
Bolin JA, Schoeman DS, Pizà-Roca C, Scales KL (2020) A current affair: entanglement of humpback whales in coastal shark-control nets. Remote Sensing in Ecology and Conservation 6, 119-128.
| Crossref | Google Scholar |
Bonde RK, Aguirre AA, Powell J (2004) Manatees as sentinels of marine ecosystem health: are they the 2000-pound Canaries? EcoHealth 1, 255-262.
| Crossref | Google Scholar |
Bradford AL, Weller DW, Punt AE, Ivashchenko YV, Burdin AM, VanBlaricom GR, Brownell RL, Jr (2012) Leaner leviathans: body condition variation in a critically endangered whale population. Journal of Mammalogy 93, 251-266.
| Crossref | Google Scholar |
Bureau of Meteorology (2022) ENSO outlook archive. Available at http://www.bom.gov.au/climate/enso/outlook/archive.shtml [Accessed 20 July 2022]
Burnett JD, Lemos L, Barlow D, Wing MG, Chandler T, Torres LG (2019) Estimating morphometric attributes of baleen whales with photogrammetry from small UASs: a case study with blue and gray whales. Marine Mammal Science 35, 108-139.
| Crossref | Google Scholar |
Castrillon J, Bengtson Nash S (2020) Evaluating cetacean body condition; a review of traditional approaches and new developments. Ecology and Evolution 10, 6144-6162.
| Crossref | Google Scholar | PubMed |
Chittleborough RG (1965) Dynamics of two populations of the humpback whale, Megaptera novaeangliae (Borowski). Australian Journal of Marine and Freshwater Research 16, 33-128.
| Crossref | Google Scholar |
Christiansen F, Dujon AM, Sprogis KR, Arnould JPY, Bejder L (2016a) Noninvasive unmanned aerial vehicle provides estimates of the energetic cost of reproduction in humpback whales. Ecosphere 7, e01468.
| Crossref | Google Scholar |
Christiansen F, Rojano-Doñate L, Madsen PT, Bejder L (2016b) Noise levels of multi-rotor unmanned aerial vehicles with implications for potential underwater impacts on marine mammals. Frontiers in Marine Science 3, 277.
| Crossref | Google Scholar |
Christiansen F, Vivier F, Charlton C, Ward R, Amerson A, Burnell S, Bejder L (2018) Maternal body size and condition determine calf growth rates in southern right whales. Marine Ecology Progress Series 592, 267-281.
| Crossref | Google Scholar |
Christiansen F, Sironi M, Moore MJ, Di Martino M, Ricciardi M, Warick HA, Irschick DJ, Gutierrez R, Uhart MM (2019) Estimating body mass of free-living whales using aerial photogrammetry and 3D volumetrics. Methods in Ecology and Evolution 10, 2034-2044.
| Crossref | Google Scholar |
Christiansen F, Dawson SM, Durban JW, Fearnbach H, Miller CA, Bejder L, Uhart M, Sironi M, Corkeron P, Rayment W, Leunissen E, Haria E, Ward R, Warick HA, Kerr I, Lynn MS, Pettis HM, Moore MJ (2020a) Population comparison of right whale body condition reveals poor state of the North Atlantic right whale. Marine Ecology Progress Series 640, 1-16.
| Crossref | Google Scholar |
Christiansen F, Sprogis KR, Gross J, Castrillon J, Warick HA, Leunissen E, Bengtson Nash S (2020b) Variation in outer blubber lipid concentrations does not reflect morphological body condition in humpback whales. Journal of Experimental Biology 223, jeb227850.
| Crossref | Google Scholar |
Christiansen F, Uhart MM, Bejder L, Clapham P, Ivashchenko Y, Tormosov D, Lewin N, Sironi M (2022) Fetal growth, birth size and energetic cost of gestation in southern right whales. The Journal of Physiology 600, 2245-2266.
| Crossref | Google Scholar | PubMed |
Clapham PJ (1996) The social and reproductive biology of Humpback Whales: an ecological perspective. Mammal Review 26, 27-49.
| Crossref | Google Scholar |
Clapham P (2001) Why do baleen whales migrate? A response to Corkeron and Connor. Society for Marine Mammalogy 17, 432-436.
| Crossref | Google Scholar |
Coughran DK, Gales NJ, Smith HC (2023) A note on the spike in recorded mortality of humpback whales (Megaptera novaeangliae) in Western Australia. Journal of Cetacean Research and Management 13, 105-108.
| Crossref | Google Scholar |
Dawbin WH (1966) The seasonal migratory cycle of humpback whales. In ‘Whales, dolphins and porpoises’. (Ed. KS Norris) pp. 145–170. (University of California Press: Berkeley and Los Angeles, CA, USA) doi:10.1525/9780520321373-011
DAWE (2022) Listing advice Megaptera novaeangliae (humpback whale). Department of Agriculture, Water and the Environment. Available at http://www.environment.gov.au/biodiversity/threatened/species/pubs/38-listing-advice-26022022.pdf
Dedden A V, Rogers TL (2022) Stable isotope oscillations in whale baleen are linked to climate cycles, which may reflect changes in feeding for humpback and Southern right whales in the Southern Hemisphere. Frontiers in Marine Science 9, 832075.
| Crossref | Google Scholar |
Doney SC, Ruckelshaus M, Emmett Duffy J, Barry JP, Chan F, English CA, Galindo HM, Grebmeier JM, Hollowed AB, Knowlton N, Polovina J, Rabalais NN, Sydeman WJ, Talley LD (2012) Climate change impacts on marine ecosystems. Annual Review of Marine Science 4, 11-37.
| Crossref | Google Scholar | PubMed |
Eisenmann P, Fry B, Holyoake C, Coughran D, Nicol S, Bengtson Nash S (2016) Isotopic evidence of a wide spectrum of feeding strategies in Southern Hemisphere humpback whale baleen records. PLoS ONE 11, e0156698.
| Crossref | Google Scholar | PubMed |
Ejrnæs DD, Sprogis KR (2022) Ontogenetic changes in energy expenditure and resting behaviour of humpback whale mother–calf pairs examined using unmanned aerial vehicles. Wildlife Research 49, 34-45.
| Crossref | Google Scholar |
Fleming A, Jackson JA (2011) Global review of humpback whales (Megaptera novaeangliae). NOAA Technical Memorandum NMFS. p. 206. US Department of Commerce. Available at https://doi.org/10.13140/2.1.3335.7600
Flores H, Atkinson A, Kawaguchi S, Krafft BA, Milinevsky G, Nicol S, Reiss C, Tarling GA, Werner R, Bravo Rebolledo E, Cirelli V, Cuzin-Roudy J, Fielding S, van Franeker JA, Groeneveld JJ, Haraldsson M, Lombana A, Marschoff E, Meyer B, Pakhomov EA, Van de Putte AP, Rombolá E, Schmidt K, Siegel V, Teschke M, Tonkes H, Toullec JY, Trathan PN, Tremblay N, Werner T (2012) Impact of climate change on Antarctic krill. Marine Ecology Progress Series 458, 1-19.
| Crossref | Google Scholar |
Fogt RL, Marshall GJ (2020) The Southern Annular Mode: variability, trends, and climate impacts across the Southern Hemisphere. Wiley Interdisciplinary Reviews: Climate Change 11, e652.
| Crossref | Google Scholar |
Fortune SME, Trites AW, Mayo CA, Rosen DAS, Hamilton PK (2013) Energetic requirements of North Atlantic right whales and the implications for species recovery. Marine Ecology Progress Series 478, 253-272.
| Crossref | Google Scholar |
Geoscience Australia (2021) Oil: Australias energy commodity resources. Australian Government. Available at https://www.ga.gov.au/digital-publication/aecr2021/oil [Accessed 19 December 2022]
Goldbogen JA, Potvin J, Shadwick RE (2010) Skull and buccal cavity allometry increase mass-specific engulfment capacity in fin whales. Proceedings of the Royal Society B: Biological Sciences 277, 861-868.
| Crossref | Google Scholar |
Groom CJ, Coughran DK (2012) Entanglements of baleen whales off the coast of Western Australia between 1982 and 2010: patterns of occurrence, outcomes and management responses. Pacific Conservation Biology 18, 203-214.
| Crossref | Google Scholar |
Groskreutz MJ, Durban JW, Fearnbach H, Barrett-Lennard LG, Towers JR, Ford JKB (2019) Decadal changes in adult size of salmon-eating killer whales in the eastern North Pacific. Endangered Species Research 40, 183-188.
| Crossref | Google Scholar |
Groß J, Virtue P, Nichols PD, Eisenmann P, Waugh CA, Bengtson Nash S (2020) Interannual variability in the lipid and fatty acid profiles of east Australia-migrating humpback whales (Megaptera novaeangliae) across a 10-year timeline. Scientific Reports 10, 18274.
| Crossref | Google Scholar | PubMed |
Groß J, Franco-Santos RM, Virtue P, Nichols PD, Totterdell J, Marcondes MCC, Garrigue C, Botero-Acosta N, Christiansen F, Castrillon J, Caballero SJ, Friedlaender AS, Kawaguchi S, Double MC, Bell EM, Makabe R, Moteki M, Hoem N, Fry B, Burford M, Bengtson Nash S No local cuisine for humpback whales: a population diet comparison in the Southern Hemisphere. Science of the Total Environment in press.
| Google Scholar |
Holland MM, Landrum L, Kostov Y, Marshall J (2017) Sensitivity of Antarctic sea ice to the Southern Annular Mode in coupled climate models. Climate Dynamics 49, 1813-1831.
| Crossref | Google Scholar |
How J, Coughran D, Smith J, Double M, Harrison J, Mcmath J, Hebiton B, Denham A (2015) Effectiveness of mitigation measures to reduce interactions between commercial fishing gear and whales. Fisheries Research Report. p. 120. (Department of Primary Industries and Regional Development) Available at www.frdc.com.au
IWC (2011) Humpback whales: status in the Southern Hemisphere. Journal of Cetacean Research and Management 3, 317.
| Google Scholar |
Jenner KCS, Jenner M-NM, McCabe KA (2001) Geographical and temporal movements of humpback whales in Western Australian waters. The APPEA Journal 41, 749.
| Crossref | Google Scholar |
Kaufman G, Coughran D, Allen JM, Burns D, Burton C, Castro C, Childerhouse S, Constantine R, Franklin T, Franklin W, Forestell P, Gales R, Garrigue C, Gibbs N, Jenner C, Paton D, Noad M, Robbins J, Slooten E, Smith F, Stevick P (2011) Photographic evidence of interchange between east Australia (BS E-1) and west Australia (BS – D) humpback whale breeding populations. Scientific Committee of the International Whaling Commission SC63/SH11, 16. IWC Scientific Committee, Tromsø, Norway
Kent CS, Jenner C, Jenner M, Bouchet P, Rexstad E (2012) Southern Hemisphere Breeding Stock D humpback whale population estimates from North West Cape, Western Australia. Journal of Cetacean Research and Management 12, 29-38.
| Crossref | Google Scholar |
Kershaw JL, Ramp CA, Sears R, Plourde S, Brosset P, Miller PJO, Hall AJ (2021) Declining reproductive success in the Gulf of St. Lawrence’s humpback whales (Megaptera novaeangliae) reflects ecosystem shifts on their feeding grounds. Global Change Biology 27, 1027-1041.
| Crossref | Google Scholar |
Kotik C, Durban JW, Fearnbach H, Barrett-Lennard LG (2023) Morphometrics of mammal-eating killer whales from drone photogrammetry, with comparison to sympatric fish-eating killer whales in the eastern North Pacific. Marine Mammal Science 39, 42-58.
| Crossref | Google Scholar |
Leaper R, Cooke J, Trathan P, Reid K, Rowntree V, Payne R (2006) Global climate drives southern right whale (Eubalaena australis) population dynamics. Biology Letters 2, 289-292.
| Crossref | Google Scholar | PubMed |
Lockyer C (1986) Body fat condition in northeast Atlantic fin whales, Balaenoptera physalus, and its relationship with reproduction and food resource. Canadian Journal of Fisheries and Aquatic Sciences 43, 142-147.
| Crossref | Google Scholar |
Lockyer CH (1990) The importance of biological parameter in popluation assessments. North Atlantic Studies 2, 22-31.
| Google Scholar |
Lockyer C (2007) All creatures great and smaller: a study in cetacean life history energetics. Journal of the Marine Biological Association of the United Kingdom 87, 1035-1045.
| Crossref | Google Scholar |
Lockyer C (1987) Evaluation of the role of fat reserves in relation to the ecology of North Atlantic fin and sei whales. In ‘Approaches to marine mammal energetics. Society for Marine Mammalogy – Special Publication No. 1’. (Eds AC Huntley, DP Costa, GAJ Worthy, MA Castellini) pp. 183–203. (Society for Marine Mammalogy)
Loeb V, Siegel V, Holm-Hansen O, Hewitt R, Fraser W, Trivelpiece W, Trivelpiece S (1997) Effects of sea-ice extent and krill or salp dominance on the Antarctic food web for these compounds as signals in marine trophic interactions. Nature 387, 897-900.
| Crossref | Google Scholar |
Merilä J, Svensson E (1997) Are fat reserves in migratory birds affected by condition in early life? Journal of Avian Biology 28, 279-286.
| Crossref | Google Scholar |
Mikhalev YA (1997) Humpback whales Megaptera novaeangliae in the Arabian Sea. Marine Ecology Progress Series 149, 13-21.
| Crossref | Google Scholar |
New LF, Clark JS, Costa DP, Fleishman E, Hindell MA, Klanjšček T, Lusseau D, Kraus S, McMahon CR, Robinson PW, Schick RS, Schwarz LK, Simmons SE, Thomas L, Tyack P, Harwood J (2014) Using short-term measures of behaviour to estimate long-term fitness of southern elephant seals. Marine Ecology Progress Series 496, 99-108.
| Crossref | Google Scholar |
Nicol S (2006) Krill, currents, and sea ice: Euphausia superba and its changing environment. BioScience 56, 111-120.
| Crossref | Google Scholar |
Nieuwenhuis R, te Grotenhuis M, Pelzer B (2012) influence.ME: tools for detecting influential data in mixed effects models. The R Journal 4, 38-47.
| Crossref | Google Scholar |
Niæss A, Haug T, Nilssen EM (1998) Seasonal variation in body condition and muscular lipid contents in northeast atlantic minke whale, Balaenoptera acutorostrata. Sarsia 83, 211-218.
| Crossref | Google Scholar |
NOAA (2023) Climate prediction centre: observation of monthly mean Antarctic oscillation. Available at https://www.cpc.ncep.noaa.gov/products/precip/CWlink/daily_ao_index/aao/month_aao_index.shtml [Accessed 30 January 2023]
Noad MJ, Kniest E, Dunlop RA (2019) Boom to bust? Implications for the continued rapid growth of the eastern Australian humpback whale population despite recovery. Population Ecology 61, 198-209.
| Crossref | Google Scholar |
Oftedal OT (1997) Lactation in whales and dolphins: evidence of divergence between baleen- and toothed-species. Journal of Mammary Gland Biology and Neoplasia 2, 205-230.
| Crossref | Google Scholar | PubMed |
Ortega-Ortiz CD, Gómez-muñoz VM, Gendron D (2018) Allometry and morphometry of blue whales photographed in the Gulf of California: insights into subspecies taxonomy in the Eastern North Pacific. Endangered Species Research 37, 183-194.
| Crossref | Google Scholar |
Owen K, Kavanagh AS, Warren JD, Noad MJ, Donnelly D, Goldizen AW, Dunlop RA (2017) Potential energy gain by whales outside of the Antarctic: prey preferences and consumption rates of migrating humpback whales (Megaptera novaeangliae). Polar Biology 40, 277-289.
| Crossref | Google Scholar |
Pallin LJ, Kellar NM, Steel D, Botero-Acosta N, Baker CS, Conroy JA, Costa DP, Johnson CM, Johnston DW, Nichols RC, Nowacek DP, Read AJ, Savenko O, Schofield OM, Stammerjohn SE, Steinberg DK, Friedlaender AS (2023) A surplus no more? Variation in krill availability impacts reproductive rates of Antarctic baleen whales. Global Change Biology 29, 2108-2121.
| Crossref | Google Scholar |
Palsbøll PJ, Allen J, Bérubé M, Clapham PJ, Feddersen TP, Hammond PS, Hudson RR, Jørgensen H, Katona S, Larsen AH, Larsen F, Lien J, Mattila DK, Sigurjónsson J, Sears R, Smith T, Sponer R, Stevick P, Øien N (1997) Genetic tagging of humpback whales. Nature 388, 767-769.
| Crossref | Google Scholar | PubMed |
Pattiaratchi CB, Siji P (2020) Variability in ocean currents around Australia. In ‘State and trends of Australia’s ocean report’. (Eds AJ Richardson, R Eriksen, T Moltmann, I Hodgson-Johnston, JR Wallis) pp. 1.4.1–1.4.6. (Integrated Marine Observing System) doi:10.26198/5e16a2ae49e76
Peel D, Smith JN, Childerhouse S (2018) Vessel strike of whales in Australia: the challenges of analysis of historical incident data. Frontiers in Marine Science 5, 69.
| Crossref | Google Scholar |
Perryman WL, Lynn MS (2002) Evaluation of nutritive condition and reproductive status of migrating gray whales (Eschrichtius robustus) based on analysis of photogrammetric data. Journal of Cetacean Research and Management 4, 155-164.
| Crossref | Google Scholar |
Quetin LB, Ross RM, Fritsen CH, Vernet M (2007) Ecological responses of Antarctic krill to environmental variability: can we predict the future? Antarctic Science 19, 253-266.
| Crossref | Google Scholar |
R Core Team (2021) ‘R: a language and environment for statistical computing.’ (R Foundation for Statistical Computing) Available at https://www.r-project.org
Rode KD, Peacock E, Taylor M, Stirling I, Born EW, Laidre KL, Wiig Ø (2012) A tale of two polar bear populations: ice habitat, harvest, and body condition. Population Ecology 54, 3-18.
| Crossref | Google Scholar |
Russell G, Colefax A, Christiansen F, Russell G, Fowler Z, Cagnazzi D (2022) Body condition and migration timing of east Australian humpback whales. Marine Ecology Progress Series 692, 169-183.
| Crossref | Google Scholar |
Sanderson CE, Alexander KA (2020) Unchartered waters: climate change likely to intensify infectious disease outbreaks causing mass mortality events in marine mammals. Global Change Biology 26, 4284-4301.
| Crossref | Google Scholar | PubMed |
Schmitt NT, Double MC, Jarman SN, Gales N, Marthick JR, Polanowski AM, Scott Baker C, Steel D, Jenner KCS, Jenner M-NM, Gales R, Paton D, Peakall R (2014) Low levels of genetic differentiation characterize Australian humpback whale (Megaptera novaeangliae) populations. Marine Mammal Science 30, 221-241.
| Crossref | Google Scholar |
Smith JN, Grantham HS, Gales N, Double MC, Noad MJ, Paton D (2012) Identification of humpback whale breeding and calving habitat in the Great Barrier Reef. Marine Ecology Progress Series 447, 259-272.
| Crossref | Google Scholar |
Smith JN, Kelly N, Childerhouse S, Redfern JV, Moore TJ, Peel D (2020) Quantifying ship strike risk to breeding whales in a multiple-use marine park: the Great Barrier Reef. Frontiers in Marine Science 7, 67.
| Crossref | Google Scholar |
Soledade Lemos L, Burnett JD, Chandler TE, Sumich JL, Torres LG (2020) Intra- and inter-annual variation in gray whale body condition on a foraging ground. Ecosphere 11, e03094.
| Crossref | Google Scholar |
Sprogis KR, Bejder L, Hanf D, Christiansen F (2020a) Behavioural responses of migrating humpback whales to swim-with-whale activities in the Ningaloo Marine Park, Western Australia. Journal of Experimental Marine Biology and Ecology 522, 151254.
| Crossref | Google Scholar |
Sprogis KR, Videsen S, Madsen PT (2020b) Vessel noise levels drive behavioural responses of humpback whales with implications for whale-watching. eLife 9, e56760.
| Crossref | Google Scholar | PubMed |
Stammerjohn SE, Martinson DG, Smith RC, Yuan X, Rind D (2008) Trends in Antarctic annual sea ice retreat and advance and their relation to El Niño–Southern Oscillation and Southern Annular Mode variability. Journal of Geophysical Research: Oceans 113, C03S90.
| Crossref | Google Scholar |
Stewart JD, Durban JW, Knowlton AR, Lynn MS, Fearnbach H, Barbaro J, Perryman WL, Miller CA, Moore MJ (2021) Decreasing body lengths in North Atlantic right whales. Current Biology 31, 3174-3179.e3.
| Crossref | Google Scholar |
Stone G, Florez-Gonzalez L, Katona S (1990) Whale migration record. Nature 346, 705.
| Crossref | Google Scholar |
Thomson PG, Pillans R, Jaine FRA, Harcourt RG, Taylor MD, Pattiaratchi CB, McLean DL (2021) Acoustic telemetry around Western Australia’s oil and gas infrastructure helps detect the presence of an elusive and endangered migratory giant. Frontiers in Marine Science in Marine Science 8, 631449.
| Crossref | Google Scholar |
Tulloch V, Pirotta V, Grech A, Crocetti S, Double M, How J, Kemper C, Meager J, Peddemors V, Waples K, Watson M, Harcourt R (2020) Long-term trends and a risk analysis of cetacean entanglements and bycatch in fisheries gear in Australian waters. Biodiversity and Conservation 29, 251-282.
| Crossref | Google Scholar |
Van Der Hoop JM, Moore MJ, Barco SG, Cole TVN, Daoust P-Y, Henry AG, Mcalpine DF, Mclellan WA, Wimmer T, Solow AR (2013) Assessment of management to mitigate anthropogenic effects on large whales. Conservation Biology 27, 121-133.
| Crossref | Google Scholar | PubMed |
Vikingsson GA, Auðunsson GA, Elvarsson BÞ, Gunnlaugsson T (2013) Energy storage in common minke whales (Balaenoptera acutorostrata) in Icelandic waters 2003-2007. Chemical composition of tissues and organs. Reports of the Scientific Committee of the International Whaling Commission, Reykjavik, Iceland, Document SC/F13/SP10.
Wachtendonk R, Calambokidis J, Flynn K (2022) Blue whale body condition assessed over a 14-year period in the NE Pacific: annual variation and connection to measures of ocean productivity. Frontiers in Marine Science 9, 847032.
| Crossref | Google Scholar |
Williams R, Thomas L, Ashe E, Clark CW, Hammond PS (2016) Gauging allowable harm limits to cumulative, sub-lethal effects of human activities on wildlife: a case-study approach using two whale populations. Marine Policy 70, 58-64.
| Crossref | Google Scholar |