

Potential exposure of perfluorinated compounds to Chinese in Shenyang and Yangtze River Delta areas
Guo-Hui Lu A B , Yong-Liang Yang A E , Sachi Taniyasu B , Leo W. Y. Yeung B C , Jing Pan A , Bingsheng Zhou D , Paul K. S. Lam C and Nobuyoshi Yamashita B EA National Research Center for Geoanalysis (NRCGA), 26 Bai Wan Zhuang Avenue, Xicheng District, Beijing, 100037, People’s Republic of China.
B National Institute of Advanced Industrial Science and Technology (AIST), 16-1 Onogawa, Tsukuba, Ibaraki 305-8569, Japan.
C Centre for Coastal Pollution and Conservation, Department of Biology and Chemistry, City University of Hong Kong, Tat Chee Avenue, Kowloon, Hong Kong Special Administrative Region, People’s Republic of China.
D State Key Laboratory of Freshwater Ecology and Biotechnology, Chinese Academy of Sciences, Wuhan, 430072, People’s Republic of China.
E Corresponding authors. Email: ylyang2003@yahoo.com.cn; nob.yamashita@aist.go.jp
Environmental Chemistry 8(4) 407-418 https://doi.org/10.1071/EN10139
Submitted: 16 February 2011 Accepted: 4 April 2011 Published: 19 August 2011
Journal Compilation © CSIRO Publishing 2011 Open Access CC BY-NC-ND
Environmental context. A total of 21 perfluorinated compounds (PFCs) including PFOS were quantified in river waters, sewage, sea waters, shallow ground waters as well as fish and domestic poultry, focussed on the main river basins in Shenyang and the Yangtze River Delta areas, China. The distribution characteristics of PFCs in the aquatic environment and evaluation of the potential risk for human health via the diet of fish was discussed. Comprehensive research was carried out using the world leading knowledge about PFOS-related chemicals in AIST, Japan to enable reliable evaluation of PFOS risk in Chinese environments, supported by ISO25101.
Abstract. A total of 21 perfluorinated compounds (PFCs) were quantified in water and biota samples collected from Shenyang in North-east China and the Yangtze River Delta area in East China. The human health risk owing to intake of perfluorooctane sulfonate (PFOS) and perfluorooctanoic acid (PFOA) via fish and domestic poultry dietary was evaluated. The total PFC concentration (∑PFC) in water samples from the rivers in Shenyang averaged 5.32 ng L–1, with PFOS and PFOA as the predominant compounds. The urban sewage could be the source of PFOS and perfluorohexane sulfonate (PFHxS) in the surface waters. The total PFCs in water samples from the Yangtze River Delta area ranged from 42.4 to 170 ng L–1. The highest concentrations of most PFCs were observed in waters from the Shanghai section of the Yangtze River. In the biota samples, PFOS and PFUnDA (perfluoroundecanoic acid) were the most abundant. The acceptable daily intake (ADI) and hazard ratio (HR) values for PFOS and PFOA intake through the diet of fish and poultry in the studied areas were calculated, and showed that the HR values for PFOS and PFOA are all less than 1.0 for both the areas.
Additional keywords: biota, groundwater, river water, seawater.
Introduction
Perfluorinated compounds (PFCs) are organic pollutants that have caused great concern by both the public and environmental scientists throughout the world in recent years. With high thermal and chemical stability and in many cases extremely slow biological degradation and chemical decomposition, they are used in large amounts in many products such as stain-resistant carpets and fabrics, fire-fighting foam, agrochemicals, surface cleaners, cosmetics and industries such as electronic, medicine and electric plating.[1–3] PFCs have been widely detected in the environment. Among them perfluorooctane sulfonate (PFOS, CF3(CF2)7SO3H) and perfluorooctanoic acid (PFOA, CF3(CF2)6COOH) have received more attention than the others because of their ubiquitous presence in the environment. PFOS and PFOA possess both hydrophobic and oleophobic characteristics. Although with low volatility, they can be transported via sea currents.[4] Their semi-volatile precursor compounds can be transported in the atmosphere causing global pollution.[5] PFCs are extremely stable and highly biologically accumulative and thus can accumulate in the environmental media over an extended period of time and enter the food chain and human body, posing a potential threat to human health.[6,7] The use of PFOS is regulated in the USA; further regulations of PFOS and related compounds have been implemented in the EU (Directive 76/769) from December 2007, whereas the remaining permitted uses will be phased out by 2011 (OJ Directive 2006/122/ECOF). In Japan, according to the Chemical Substance Control Law, PFOS and PFOSF (perfluorooctane sulfonyl fluoride) were listed as class I hazardous chemicals in April 2010. To a certain extent, they were classified as one of the contaminants similar to polychlorinated biphenyls (PCBs) that can pose the highest risks to humans. On the other hand, PFOA was classified as a Class II chemical on the watch list in 2002. PFOA-related chemicals such as perfluorododecanoic acid (PFDoDA), perfluorotridecanoic acid (PFTriDA), perfluorotetradecanoic acid (PFTeDA), perfluoropentadecanoic acid (PFPeDA) and perfluorohexadecanoic acid (PFHxDA) were classified as Class I chemicals on the watch list in 2008.
Manufacturers in China began large scale production in 2003 at the advent of 3M’s 2002 global PFOS phase-out. China had an annual production of less than 50 Mg in 2004, but has increased production dramatically in recent years, with an estimated production of more than 200 Mg in 2006.[8] These chemicals can be a possible risk to the Chinese and it has been reported that PFOS concentrations in Chinese blood serum were significantly higher than those of people in other countries of the world.[9] PFOS and PFOA have been detected widely in surface waters in China.[10–12] So et al. found that the water in the Shanghai section of the Yangtze River was the most polluted with PFCs.[11] Previous investigations showed that the PFOS concentrations (142 ng mL–1 for males and 170 ng mL–1 for females) in the blood serum of non-working people in the Shenyang area were significantly higher than the mean concentration of 52.7 ng mL–1 in China.[13,14] PFOA and PFOS were detected in tap water in Shenyang and river waters of the Hun River in Shenyang section.[10]
Further studies on the above-mentioned ‘hot spots’ (Shenyang area and the Shanghai section of the Yangtze River) of PFC pollution are necessary. The previous studies on Shenyang were limited to PFOS and PFOA, with only river (the Hun River) and tap water investigated.[10] However, sewage could be the main source of PFCs in the aquatic environment. Sewage may contain a large amount of PFC precursors,[15] which could be transformed into PFOA and PFOS through microorganisms, directly raising the concentrations of various PFC compounds. In addition to waters, the PFC pollution level in edible fish and poultries in these two areas should also be investigated so as to understand the contributions of diet via eating fish and poultry, both of which are important staple foods in China, to the PFC level in the human blood serum in these areas. Edible fish was reported to be the main source of PFCs in human blood serum of the people in Baltic coastal area.[16] A study investigating PFCs in fish and seafood has been just begun in China. PFCs were detected in seafood from Zhoushan, East China and Guangzhou, South China.[17] Wang et al.[18] and Li et al.[19] investigated PFCs in chicken eggs and fish blood serum in China; however, the study of PFCs in fish tissue[17] and poultry is still rare. For these reasons, investigation has been conducted on the status quo of the pollution levels of 24 PFC compounds in river waters, sewage, seawaters and shallow groundwaters, as well as in fish and domestic poultry. The aims were to (1) measure the concentrations of PFCs in the aqueous environment and common animal food items collected in the hot-spot areas of PFCs pollution in China, focussed on the main river basins in Shenyang and the Yangtze River Delta, and (2) assess the potential health risks to human consumers via the diet of fish and poultry in these two areas.
Materials and methods
Sample collection
Surface river water, shallow groundwater and biota samples were collected in the Shenyang area in March and August 2008 (Fig. 1a). River water samples were collected from the upper streams to the downstreams of the Hun River, Pu River and Xi River, and the surface water samples were collected from urban sewage channels in Shenyang city. The total number of the surface water samples was 23. Three shallow groundwater (water table <40 m) samples in the local villages were collected from the mid-stream area (Zhangyi Town) and down-stream area (Tutaizi Town) of the Xi River Basin. The shallow groundwater samples were directly collected from farm field and farmers’ courtyards. River water and surface seawater samples were collected at four sites in the Yangtze River Delta area (the Qiantang River, Hangzhou; the Yangtze River, Shanghai; the coastal sea, Shanghai and Haiyan County, Jiangsu Province) in 2008 (Fig. 1b). Two samples were collected from each site. Water samples were collected using polypropylene (PP) bottles. Every sampling site location was recorded using GPS (Garmin Ltd., Olathe, KS, USA). The water samples were stored at 4°C in 250-mL polypropylene (PP) bottles until analysis. The field blanks and travel blanks employed the Millipore water.

|
Three chickens and three ducks (home-fed) were purchased from the farmers in local villages along the Xi River in March 2008. Serum and liver samples were collected from the chicken and ducks. The samples were collected in PP bottles. Three species of fish, i.e. crucian carp (Carassius auratus), catfish (Ictalurus punctatus) and stone moroco (pseudorasbora parva) were collected at the junction of the Hun River and the Xi River in August 2007. Three pooled samples were made of five individuals. Farmed fish Crucian Carp (Carassius auratus) (n = 3) and catfish (Ictalurus punctatus) (n = 1) were collected in the northern Chongming Island, Shanghai. The fish samples were washed with Milli-Q water. Only edible muscle tissue of fish was taken. All the samples except serum were freeze-dried and stored at –20°C until analysis.
Reagent and chemicals
The potassium salt of PFOS, potassium salts of perfluorohexanesulfonate (PFHxS), perfluorooctane sulfonamide (PFOSA), N-ethylperfluorooctanesulofonamidoacetic acid (N-EtFOSAA), perfluorononanoic acid (PFNA), perfluorooctanoic acid (PFOA), perfluoroheptanoic acid (PFHpA), 10 : 2 fluorotelomer unsaturated carboxylic acid (10 : 2 FTUCA), perfluorodecanesulfinate (PFDSi), 13C4-PFOS, 13C2-PFDA, 13C5-PFNA, 13C4-PFOA and 13C4-PFBA were purchased from Wellington Laboratories Inc. (ON, Canada). Unsaturated fluorotelomer carboxylate (8 : 2 FTUCA) and saturated fluorotelomer carboxylate (8 : 2 FTCA) were provided by Asahi Glass Co Ltd (Tokyo, Japan). Perfluorohexanoic acid (PFHxA) was purchased from Wako Pure Chemical Industries Ltd (Osaka, Japan). Perfluorododecanoic acid (PFDoDA), perfluoroundecanoic acid (PFUnDA), perfluorodecanoic acid (PFDA), perfluoroheptanoic acid (PFHpA) and perfluoropentanoic acid (PFPeA) were purchased from Fluorochem Ltd (Derbyshire, UK). Perfluorobutanesulfonate (PFBS) was purchased from Chiron (Trondheim, Norway). Perfluoropropanesulfonate (PFPrS) and perfluoroethanesulfonate (PFEtS) were purchased from JEMCO Inc. (Yokohama, Japan). Perfluorohexadecanoic acid (PFHxDA), perfluorotetradecanoic acid (PFTeDA) and 7 : 3 fluorotelomer carboxylate (7 : 3 FTCA) were purchased from SynQuest Laboratory Inc. (Alachua, FL, USA). Purities of all the analytical standards were >95%. Oasis-weak anion exchange (WAX; 6 cm2, 150 mg, 30 μm) solid phase extraction (SPE) cartridges were purchased from Waters (Milford, MA, USA). Milli-Q water was used throughout the whole experiment. Methanol (residual pesticide and PCB analytical grade), ammonium acetate (97%), ammonium solution (25%), acetic acid (99.9%), tetra-n-butyl ammonium hydrogen sulfate (TBA), methyl-tert-butyl ether (MTBE), sodium carbonate and sodium hydrogen carbonate (99%) were from Wako Pure Chemical Industries.
Sample analysis
Twenty one PFCs including PFOS, PFHxS, PFBS, PFPrS, PFEtS, PFOSA, N-EtFOSAA, PFOcDA, PFHxDA, PFTeDA, PFDoDA, PFUnDA, PFDA, PFNA, PFOA, PFHpA, PFPeA, 8 : 2 FTCA, 10 : 2 FTUCA, 8 : 2 FTUCA and 7 : 3 FTCA were analysed in water samples. The water samples were extracted using solid phase extraction (SPE) using WAX cartridges following the published method.[20,21] The cartridge was pre-conditioned by passing a sequence of 4 mL of 0.1% ammonia/methanol, 4 mL of methanol and 4 mL of Milli-Q water. The water samples (250 mL) were passed through the wet cartridge at the rate of 1–2 drops s–1. After loading all samples, cartridges were rinsed with 4 mL of 25 mM acetate buffer solution (pH 4) and this fraction was discarded. The water remaining in the cartridge was completely removed by centrifugation at 1500g for 2 min at room temperature, because residual water would affect the recovery of PFOSA. The target analytes were eluted into two fractions. The first fraction (Fr1) and second fraction (Fr2) were eluted by 4 mL of methanol and 4 mL of 0.1% ammonia/methanol respectively. The eluents were then concentrated to 0.5 mL under a gentle stream of nitrogen (G3 grade: >99.9995%).
Twenty two PFCs including PFOS, PFHxS, PFBS, PFPrS, PFEtS, PFDSi, PFOSi, PFHxSi, PFOSA, N-EtFOSAA, PFTeDA, PFDoDA, PFUnDA, PFDA, PFNA, PFOA, PFHpA, PFPeA, 8 : 2 FTCA, 10 : 2 FTUCA, 8 : 2 FTUCA and 7 : 3 FTCA were analysed in biological samples. Biological samples were extracted using the ion-pairing (IP) method and the extract was purified by SPE before instrumental analysis.[8,20] Briefly, 0.5 g of the liver/fish mussel samples was homogenised in 4 mL of Milli-Q. 1–2 mL of the homogenate/0.5 mL serum was mixed with 1 mL of 0.5 M TBA solution and 2 mL of 0.25 M sodium carbonate buffer (pH 10), and then added to a 15-mL PP tube for extraction. After mixing, 5 mL of MTBE was added, and the mixture was shaken for 20 min at 250 rpm. The organic and the aqueous layers were separated by centrifugation at 1500g for 15 min at room temperature 23°C. Then, 4 mL of MTBE was removed and transferred to a second 15-mL PP tube. The extraction was repeated twice as described above, except that 5 mL of MTBE was removed each time, instead of 4 mL. All three extracts were combined in the second 15-mL PP tube. The final extract was purged to 2 mL under a gentle stream of nitrogen after adding 1 mL of methanol, and was adjust to 1 mL by adding methanol. After ion-pairing extraction, 0.5 mL of extract was added to 50 mL of Milli-Q water in a 100-mL PP bottle for further SPE cleanup following the method reported above.
Instrumental quantification
Analysis of the PFCs was performed using a high performance liquid chromatograph tandem mass spectrometer. Separation of the target analytes was performed using an Agilent HP1100 liquid Chromatograph (Agilent, Palo Alto, CA) interfaced with a Micromass Quattro Ultima Pt mass spectrometer (Waters Corp., Milford, MA) operated in the electrospray negative ion mode. PFPrS, PFEtS and PFPeA were quantified with an RSpak JJ-50 2D column (2.0-mm internal diameter × 150-mm length; Shodex, Showa Denko K.K., Kawasaki, Japan), an OPTI-GUARD 1 mm anion exchange (Optimize Technologies, OR, USA) as a guard column, and the other compounds with a Betasil C18 column (2.1-mm internal diameter × 50-mm length, 5 µm; Thermo Hypersil-Keystone, Bellefonte, PA), and an XDB-C8 (12.5 × 2.1 mm, 5 µm; Agilent Technologies, Foster City, CA) as a guard column. The desolvation gas flow and temperature were kept at 610 L h–1 and 450°C respectively. The collision energies, cone voltages and MS/MS parameters for the instrument were optimised for individual analytes, and were similar to those reported elsewhere.[21,22] It should be noted that the monitored ion pair for quantifying PFOS in the chicken and duck samples was 499 Da/99 Da instead of the usually used 499 Da/80 Da, in order to eliminate the interference from taurodeoxycholate (TDC) co-eluted with PFOS.[22,23] For water and fish samples, quantification of PFOS was based on the 499 Da/80 Da as it can provide a stronger signal than 499 Da/99 Da transition of PFOS.[24]
Quality assurance and quality control
To achieve lower detection limits, all of the accessible PTFE and fluoropolymer materials were removed from the instruments and apparatus to minimise background signal caused by contamination. The details on removing various interferences were described elsewhere.[25] PP tubes that had been strictly examined for low PFC blanks were chosen. Procedure blank and travel blank for water were conducted, and concentrations of all target analytes in the procedure blank and travel blank were below their limit of quantification (LOQ) (Table 1). The recovery test was carried out using both surrogates and native standard chemicals. If the recovery exceeded the acceptable range (65 to 125%), samples were analysed again. Matrix recoveries were also conducted by adding surrogates and native standard chemicals in real samples. Quantitative responses according to the amount of standards added were evaluated and samples were re-analysed if not sufficient result. The procedural recoveries of PFCs ranged from 68 to 94% for water analysis and 77 to 112% for biota samples (Table 1). The procedural PFC concentrations in samples were not corrected for the recoveries. The concentrations of analytes were calculated using an external calibration curve.

|
Every sample, blank and recoveries were extracted in duplicates to make sure stable repeatability. When repeatability was realised, the peak area was greater than the procedure blank, and signal/noise ratio (S/N) was ≥10, the lowest concentration of the target analyte was defined as the LOQ of the method. A calibration curve for the instrument was prepared with a series of seven concentrations of 0, 2, 10, 50, 200, 1000, 5000 and 20 000 pg mL–1. The standard deviation of every point from the standard was less than 20%. The instrumental response of target analytes was confirmed for their quantification using individual chromatogram. Detailed information about quality assurance and quality control have been previously described elsewhere.[20,21,25,26]
Results and discussion
Concentrations of PFCs in waters from the Shenyang area
PFC concentrations in the surface waters (i.e. river water and channel waters) and shallow ground waters from the Shenyang area are shown in Table 2. A total of 11 PFC compounds were detected in the samples, with the total concentrations of PFCs (∑PFCs) ranging from 0.27 to 8.38 ng L–1 (arithmetic mean: 5.32 ng L–1). PFOS and PFOA were the most predominant PFC compounds and were detected in all of the water samples from the Shenyang area, ranging from <0.1 to 2.83 and from <0.1 to 5.71 ng L–1 respectively with means of 1.05 and 2.04 ng L–1 respectively.

|
The composition profiles of PFCs in the Shenyang River water samples showed several characteristics as the following: PFOS was the predominant perfluoroalkyl sulfonates (PFASs), whereas PFOA and PFNA were the main perfluoroalkycarboxylates (PFCAs) (Table 2), with a detection rate of 100%. PFHpA and PFPeA were partially detected. Although PFBS, PFHxS, N-EtFOSAA, PFUnDA and PFDA could be detected, they were close to their LOQs and accounted for less than 5% of the total PFCs detected. Other compounds (i.e. PFOSA, PFPrS, PFEtS and long-chain (C11–C18) PFC compounds) were all below their LOQs. Therefore, the results for these chemicals will not be discussed in the present study.
|
Distributions of PFCs in river waters of Shenyang
The concentrations of main PFAS and PFCA compounds in river waters along the Hun River and Xi River collected in July 2008 are shown in Figs 3 and 4 respectively. The concentrations of PFOS in the Hun River waters increased substantially after flowing through the urban area of Shenyang, accompanied with the occurrence of PFHxS. The concentrations of PFOS in the waters of the upper stream of the Shenyang section of the Hun River were significantly lower than those in the Xi and Pu Rivers as well as the downstream of Shenyang section of the Hun River. The concentrations of PFOS in waters of the upper stream of Shenyang section of the Hun River ranged from 0.06 to 1.10 ng L–1 and gradually increased towards Shenyang city and reached a maximum of 2.8 ng L–1 in the downstreams of the Shenyang section. The concentrations of PFOS in waters of the upper stream of the Hun River were different from the result in a previous study by Jin et al.[10] that the PFOS concentration in the water of Dahuofang Reservoir in the upper stream watershed of the Hun River was 0.20 ng L–1 and increased up to 4.4 ng L–1 when the reservoir water joined into the Hun River.[10] The occurrence of PFHxS in the Xi River and the downstream of the Hun River indicate that PFHxS source might exist in the urban area of Shenyang city.

|

|
There were no significant variations in concentrations of the main PFCAs between the Hun River and the Xi River and between the upper stream and downstream of the Hun River (Fig. 4). However, the composition profile of PFCs in the Xi River waters was different with that in the Hun River waters. In the Xi River waters, PFOA was the predominant PFCA, whereas in the Hun River waters, PFHpA and PFOA were both the predominant PFCAs. PFHpA was the dominant PFCA compounds in the upper stream water of the Hun River. In contrast, PFOA was the predominant PFCA in the Xi River. The mean concentrations of PFHpA and PFOA in the Hun River waters were 1.86 and 1.87 ng L–1 respectively. PFHpA in the upper stream water ranged from 1.76 to 4.06 ng L–1, averaging 2.9 ng L–1, which was higher than those in the downstream of the Hun River (range: <0.1 to 3.30 ng L–1, mean: 1.86 ng L–1). On the other hand, PFOA in the upper stream water ranged from 1.71 to 2.13 ng L–1 (mean: 1.90 ng L–1), higher than that in the downstream of the Hun River (1.40 to 1.98 ng L–1, mean: 1.66 ng L–1). PFOA ranged from 1.96 to 2.24 ng L–1 (mean: 2.11 ng L–1) in the Xi River waters, slightly higher than that of the Hun River.
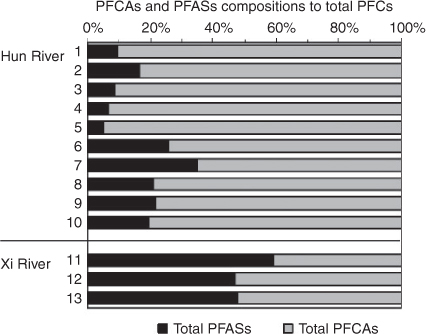
In the upper stream of the Hun River, PFAS compounds were significantly lower than PFCA compounds (PFASs/PFCAs: 0.05–0.20). The PFAS/PFCA ratio in the Hun River water began to increase (0.24–0.53) when flowing through the urban area of Shenyang city. The PFAS/PFCA ratio in the Xi River water ranged from 0.73 to 1.44 (Fig. 2). The different contributions of PFASs and PFCAs to the total PFCs in the two rivers indicate that there were different sources of PFCs existing for the two rivers. The water source of the Xi River is industrial waste water and domestic sewage in Shenyang city, whereas the Hun Rive originated from the rural mountain area and received the sewage from Fushun city before it flows into Shenyang city. After flowing though the urban area of Shenyang city, the PFASs/PFCAs ratio in the downstream Hun River water lay between the ratios of the upper stream of the Hun River and the Xi River, suggesting that the industrial waste water and domestic sewage in Shenyang city were the possible cause of the difference in the PFC composition profiles of the two rivers. The mean concentration (4.49 ng L–1) of the total PFCs in the surface waters in March 2008 was lower than that in the water samples collected in August 2008 (6.26 ng L–1).
In this study, there were no significant correlations between PFOS and PFOA concentrations in Shenyang surface waters. Significant correlations between PFOS and PFOA concentrations in nine snow samples collected in the central Shenyang urban area have been reported.[27] So et al. found there were significant correlations between PFOS, PFNA and PFHpA in the Yangtze River and Pearl River water samples.[11] These differences indicated that contamination sources in the Shenyang area might be more complicated.
PFCs in river waters and surface seawaters in the Yangtze River Delta area
Concentrations of the detected PFC compounds and ∑PFCs (the sum of PFOS, PFHxS, PFBS, PFPrS, PFOSA, N-EtFOSAA, PFDoDA, PFUnDA, PFDA, PFNA, PFOA, PFHpA and PFPeA) in water samples from the Yangtze River Delta area was summarised in Table 3. PFEtS and long-chain PFCAs (PFTeDA, PFHxDA and PFOcDA), saturated and unsaturated fluorotelomer carboxylate were all below their LOQs.

|
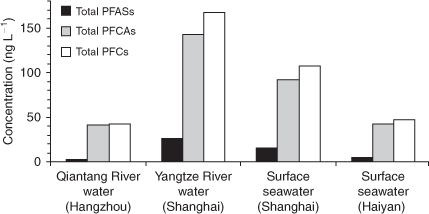
PFCAs were the predominant type of PFCs, 5.4 to 20 times higher than PFASs, in the freshwaters or seawaters (Fig. 5). PFOA was the predominant PFC, ranging from 31.4 to 119 ng L–1 (mean: 65.1 ng L–1), with the maximum occurrence in the Shanghai section of the Yangtze River. In the PFASs, PFOS was the predominant compound in all of the water samples, ranging from 1.1 to 11.9 ng L–1 (mean: 5.84 ng L–1), with the maximum occurrence in the Shanghai section of the Yangtze River. PFBS was the second highest PFAS compound that was detected in 6 of the 8 water samples, ranging from <0.1 to 8.84 ng L–1, with an average value of 5.68 ng L–1, which was in consistence with the report that a considerable amount of PFBS (22.9 to 26.1% of the total of PFCs analysed) was measured in water collected near the Nanjing section of the Yangtze River, thus indicating the presence of potential sources of PFBS in this part of China.[11]
|
River waters
Of the 21 PFC compounds analysed, a total of 13 PFC compounds were detected in the water samples from the Yangtze River Delta area. The mean ∑PFCs in the freshwater in the Yangtze River Delta area was 105 ng L–1.
In the Shanghai section of the Yangtze River water samples, 11 PFC compounds were detected and were the highest compared to those in other water samples tested in this study (Table 3). This observation confirms that Shanghai is one of the most PFC-polluted areas in the Yangtze River Delta.[11] PFOA was the predominant PFC, averaging 116 ng L–1. So et al. reported that generally, PFOS was the dominant PFC found in samples from the Pearl River, whereas PFOA was the predominant PFC in water from the Yangtze River.[11] In the Shanghai section of the Yangtze River waters, different compound contributions to the total PFCs were in the following rank order: PFOA (69.0%) > PFOS (7.6%) > PFNA (5.6%) > PFBS (5.2%) > PFHpA (4.2%) > PFDA (2.1%) ≈ PFPeA (2.0%) > PFUnDA (1.8%) (Fig. 6).

|
In the Hangzhou section of the Qiantang River, the mean ∑PFCs was 42.7 ng L–1. PFOA was the predominant PFC (mean: 31.0 ng L–1), and approximately one third lower than that in the Yangtze River waters. The contributions to the total PFCs were in the following rank order: PFOA (74.5%) > PFPeA (9.1%) > PFHpA (5.1%) > PFNA (3.3%) > PFOS =N-EtFOSAA (2.6%) (Fig. 6). The average concentrations of PFOS and PFOA in the Yangtze River were 10.8 and 3.6 times higher respectively than those in the Qiantang River.
Surface seawaters
The mean ∑PFCs in the surface seawaters was 76.9 ng L–1, significantly lower than that of the freshwaters. The contributions of individual PFC compounds to the total PFCs in the surface seawater from the Shanghai coastal sea were in the following rank order: PFOA (73.2%) > PFOS (6.9%) > PFBS (6.0%) > PFNA (4.4%) > PFHpA (3.0%) (Fig. 6), whereas in the surface seawater from Haiyan coastal sea, Zhejiang Province, the contributions of individual PFC compounds to the total PFCs were in the following rank order: PFOA (74.2%) > PFNA (5.1%) > PFOS = PFHpA (4.8%) > PFBS (4.1%) > PFPeA (3.2%) (Fig. 6). The average concentrations of PFOS (7.33 ng L–1) and PFOA (78.4 ng L–1) in the surface seawater from the Shanghai coastal sea were 3.3 and 2.3 times respectively higher than those in Haiyan coastal sea, Zhejiang Province. The difference in PFC composition profiles between the freshwaters and the seawaters in the Yangtze River Delta was not significant (Fig. 6).
In summary, PFOA was the absolutely predominant PFC compound in the aquatic environment of the Yangtze River Delta area, accounting for 69.0–74.5% of the total PFCs. PFOS was at a relatively low level, accounting for 2.6–7.6% of the total PFCs. This composition profile was in sharp contrast with that in the fish samples in Chongming Island as discussed in the followed section. Table 4 summarises the PFOS and PFOA concentrations in various waters in Shenyang and the Yangtze River Delta areas and in other areas in China reported in literature.[11,12] The PFC pollution in the aquatic environment of Shenyang and the Yangtze River Delta areas was at a low to medium level.

|
Biological samples
In the 22 analysed PFCs in the biota samples from Shenyang area, 9 PFCs were detected (Table 5). The total PFCs (∑PFCs) were calculated based on the sum of 9 PFCs. The mean total PFCs in the fish tissue and poultry samples from the Shenyang area were respectively 6.6 and 1.1 ng g–1 DW (dry weight). For the PFASs, PFOS was detected in all of the biota samples and PFOSA and N-EtFOSAA were detected in the Shenyang fish samples. Among the PFCAs, PFUnDA was the most ubiquitous and detected in all the fish tissue samples (0.89 to 4.94 ng g–1 DW). PFDoDA, PFDA, PFNA, PFPeA and PFOA were partly detected in the biota samples. Although PFHxS, PFHpA and PFHxA had been detected in Chinese blood serum,[8] in our biota samples they were all below their LOQs. PFOS and PFUnDA were the predominant PFCs in Shenyang fish samples, similar to the Gulkowska’s results for seafood from Guangzhou and Zhoushan.[17]

|
In the chicken and duck samples, the sample Chicken-2 serum showed the highest PFOS concentration (1.33 ng mL–1). The average PFOS concentration in Shenyang human blood (79.2 ng mL–1 [8]) was ~60 times higher than that in the chicken blood serum. PFOS concentrations in the duck and chicken blood serum were 0.32 and 0.93 ng mL–1 respectively. PFOS in the duck and chicken livers were 0.84 and 0.32 ng g–1 DW respectively. PFDoDA and PFUnDA of samples Chicken-2, Chicken-3 and Duck-1 (all male) were detected in the blood serum but below the LOQs in the livers. On the contrary, PFDoDA and PFUnDA of samples Duck-2 and Duck-3 (all female) were detected in the livers but bellow the LOQs in the blood serum. Guruge et al. pointed out that the long-chain PFCAs such as PFNA, PFDA, PFUnDA and PFDoDA could be enriched more easily in chicken’s blood serum in comparison with liver.[28] Our results were generally in consistence with that observation.
The PFOS concentrations in chicken and duck blood serum and liver samples were comparable to or relatively lower than those reported in the literature. For example, PFOS concentrations in the whole blood samples of eider duck (Somateria molissima) in Poland were reported as 22 ± 1.4 ng mL–1.[16] The PFOS concentrations in whole blood samples of pintail duck (Anas acuta) in Japan were found to be 84–167 ng mL–1 and in the liver sample of mallard (Anas platyrhynchos) 493 ng g–1 wet weight (WW).[7] The PFOS concentrations in the blood serum of chicken in Japan were reported as 5.8 ng mL–1.[28]
PFOS and PFUnDA were the predominant PFCs in the fish samples from Chongming Island, similar to the results for Shenyang fish samples. The mean PFOS concentration in crucian carp was 2-fold higher than in catfish. High levels of PFOS in fish and shellfish were reported in UK and Canada.[4] The PFOS in Chongming Island fish accounted for 46.1% of the total PFCs, followed by PFUnDA (27.6%), PFDA (11.5%) and PFPeA (11.2%), which were detected in all fish samples in this study. In comparison, the concentrations of PFCs in Shenyang fish samples were in the following rank order: PFOS > PFUnDA > PFDA > PFDoDA > N-EtFOSAA > PFOSA. PFOS was the predominant component of PFCs in Chinese blood samples.[8,9,13]
Although PFOSA in river waters of the Shenyang area and Shanghai section of the Yangtze River were all below the LOQ 0.1 ng L–1, PFOSA was detected in the fish tissue samples from Shenyang, ranging from 0.34 to 0.62 ng g–1 DW, showing fish has certain ability to biological enrichment of PFOSA. Li et al. found that in the fish blood serum samples from Gaobeidian, Beijing, the concentration of PFOSA was 8.64 ng mL–1, and suggested that PFOSA could be accumulated in the fish body as the degradation product of its precursors such as PFOSAA and N-EtFOSA.[19] The PFOSA concentrations in whole fish samples of Cottus cognatus in the Ontario Lake were found to be as high as 150 ± 17 ng g–1 wet weight.[29] Senthikumar et al. found that PFOSA was the main PFC compound in livers of wild-life such as cormorants and eagles in Japan.[29] PFOSA has been detected in human blood serum in the Chinese during an investigation of PFCs in human blood samples from several Chinese cities,[8] among which PFOSA concentrations in male and female residents of Shenyang city were 1.96 and 1.56 ng mL–1 respectively.[8]
Table 6 summarises the PFOS and PFUnDA concentrations in fish samples of this study and compared with the reported data in literature. The PFOS levels in fish samples from Shenyang and the Chongming Island were comparable but significantly lower than the reported values for fish tissues from the Missouri, Mississippi, and Ohio Rivers, USA.[30] The PFUnDA levels in the Chongming Island fish tissue samples were comparable to the reported US fish[30] but significantly higher than that in fish from Shenyang, Guangzhou and Zhoushan.[17]

|
Health risk assessment
The method for human health risk assessment of PFOS and PFOA reported in the scientific literature[17,31] was used, in which human exposures of PFOS and PFOA are compared with the Reference Dose (RfD) for non-cancer health effects[17] in order to evaluate the potential risk to the public health. The RfDs are 25 and 333 ng kg–1 day–1 for PFOS and PFOA respectively.[17] The human health risk via intake of PFOS and PFOA for the human groups in our studied areas was assessed by the hazard ratio (HR), which is the ratio of the acceptable daily intake (ADI) to RfD. An HR value greater than unity indicates that the average exposure level exceeds the benchmark concentration.[32] Assuming that the average bodyweight of the people in the studied areas was 60 kg, the ADI and HR values can be calculated as follows:
Error: Incorrect filename or format (EN10139_E1.gif). Please check out
Error: Incorrect filename or format (EN10139_E2.gif). Please check out
where DI (ng day–1) is the daily intake of dietary meat (g day–1) by PFC concentration in meat (ng g–1).
Based on our survey, the average daily consumption of fish for a Chongming Island citizen was 9 kg year–1. Table 7 presents the ADI and HR values for PFOS and FOA intake through the diet of fish in the studied areas. The results of calculation showed that the HR values for PFOS and PFOA are all less than 1.0 for both the areas, indicating that the health risk for the human groups in these areas through the intake paths was not high. However, it should be noted that PFOS HRs >10% were found for the human group in Chongming Island via fish consumption. According to China Fishery Administration, the annual average consumption of fish was 11.6 kg per capita. People living in the coastal area consumed 40 kg annually per capita, whereas the annual consumption of fish in some inland areas was less than 1.0 kg per capita.[33] Therefore, the potential human health risk should not be ignored when taking into account of possible higher fish consumption for people living in the coastal area than that in other regions of China.
|
Conclusion
PFCs were analysed for water and biota samples from Shenyang and the Yangtze River Delta areas. Distribution characteristics of PFCs in different types of waters were investigated. Evaluations on human risk from intake of PFOS and PFOA via drinking water and a diet of fish and poultry were made. Several conclusions can be made as follows.
-
PFOS and PFOA pollution was ubiquitous in surface waters and groundwater from Shenyang and in river and sea water from the Yangtze River Delta areas. The detection rate of PFOS and PFOA for the surface waters in Shenyang was 100%. PFOA was predominant in PFC compounds in the surface waters, followed by PFOS and PFHpA. The average PFOS concentration in the sewage-enriched Xi River was 2-fold of that in the Hun River, three times higher than that of the Pu River.
-
No correlations were observed between PFOS and PFOA, indicating there were different sources for PFOS and PFOA in the two rivers. The urban area of Shenyang should be one of the PFOS and PFHxS sources for the rivers.
-
PFOS, PFOA, PFUnDA, PFHpA, PFDA, PFNA and PFPeA were detected in all water samples from the Yangtze River Delta area. The ∑PFCs in the freshwater samples were higher than those in seawaters. PFOA was the predominant compound in the waters of the Yangtze River Delta area, accounting for ~70% of the ∑PFCs. In contrast, PFOS levels were low, accounting for ~5% of the ∑PFCs. The average concentrations of PFOS and PFOA in the Yangtze River were much higher than those in the Qiantang River and the average concentrations of PFOS and PFOA in the surface seawater from the Shanghai coastal sea were significantly higher than those in Haiyan coastal sea, Zhejiang Province. These observations confirm that Shanghai is one of the most PFC-polluted areas in the Yangtze River Delta. The difference in PFC composition profiles between the freshwaters and the seawaters in the Yangtze River Delta was not significant.
-
Ten PFC compounds were detected in the biota samples from Shenyang area. N-EtFOSAA, the precursor of PFOS was detected, which could be an important source for PFOS in the human body in Shenyang area. Eleven PFC compounds were detected in the fish tissue samples from Chongming Island. The PFC composition profiles in the fish samples showed a complete reverse trend from the water samples of the Yangtze River Delta. PFOS and PFUnDA were predominant compounds detected in all of the fish samples, whereas PFOA was at a low level.
-
PFOS and PFOA pollution was ubiquitous in our studied aquatic environment and at a lower or medium level compared with reported observations in aquatic environment of other countries. PFC pollution in the fish and poultry samples was also at a low level and therefore the human health risk of PFOS and PFOA intake through a diet of the fish was low, but it is noted that the dietary fish intake route alone in Chongming Island could account for more than 10% of HR values.
Acknowledgements
This research has been supported by the International Co-operation Project under Ministry of Science and Technology of China (project number 2006DFA21280) and Natural Science Foundation of China (project number 40773010) and General Research Funding of National Research Center for Geoanalysis China (project number 201012CSJ05). We thank staff in AIST and City University of Hong Kong for their support.
References
[1] Environmental, health and safety measures relating to perfluorooctanoic acid and its salts (PFOA). US EPA EDocket OPPTS 2003-0012-0007 2003 (US EPA: St Paul, MN).[2] E. Kissa, Fluorinated Surfactants and Repellents 2001 (Marcel Dekker: New York).
[3] J. P. Giesy, K. Kannan, Perfluorochemical surfactants in the environment. Environ. Sci. Technol. 2002, 36, 146A.
| Perfluorochemical surfactants in the environment.Crossref | GoogleScholarGoogle Scholar | 1:CAS:528:DC%2BD38XisFyjsb0%3D&md5=7de13337a19f27825adbe3c5db61153eCAS |
[4] K. Prevedouros, I. T. Cousins, R. C. Buck, S. H. Korzeniowski, Sources, fate and transport of perfluorocarboxylates. Environ. Sci. Technol. 2006, 40, 32.
| Sources, fate and transport of perfluorocarboxylates.Crossref | GoogleScholarGoogle Scholar | 1:CAS:528:DC%2BD2MXht1Gru7zK&md5=14e91a9069cf17a00b47907f105e54b6CAS |
[5] D. A. Ellis, J. W. Martin, A. O. D. Silva, S. A. Mabury, M. D. Hurley, M. P. S. Andersen, T. J. Wallington, Degradation of fluorotelomer alcohols: a likely atmospheric source of perfluorinated carboxylic acids. Environ. Sci. Technol. 2004, 38, 3316.
| Degradation of fluorotelomer alcohols: a likely atmospheric source of perfluorinated carboxylic acids.Crossref | GoogleScholarGoogle Scholar | 1:CAS:528:DC%2BD2cXjvVShsb0%3D&md5=1a2a8158f069618f177c7efa759abbccCAS |
[6] S. A. Tittlemier, K. Pepper, C. Seymour, J. Moisey, R. Bronson, X. L. Cao, R. W. Dabeka, Dietary exposure of Canadians to perfluorinated carboxylates and perfluorooctane sulfonate via consumption of meat, fish, fast foods, and food items prepared in their packaging. J. Agric. Food Chem. 2007, 55, 3203.
| Dietary exposure of Canadians to perfluorinated carboxylates and perfluorooctane sulfonate via consumption of meat, fish, fast foods, and food items prepared in their packaging.Crossref | GoogleScholarGoogle Scholar | 1:CAS:528:DC%2BD2sXjtlCmurs%3D&md5=1734a6c73e02c8496611673bf31c1baaCAS |
[7] S. Taniyasu, K. Kannan, Y. Horii, N. Hanari, N. Yamashita, A survey of perfluorooctane sulfonates and related perfluorinated organic compounds in water, fish, birds, and humans from Japan. Environ. Sci. Technol. 2003, 37, 2634.
| A survey of perfluorooctane sulfonates and related perfluorinated organic compounds in water, fish, birds, and humans from Japan.Crossref | GoogleScholarGoogle Scholar | 1:CAS:528:DC%2BD3sXjs1GgtLo%3D&md5=04882f1e8064d180a05af124f403b4bcCAS |
[8] Long-chain Perfluorinated Chemicals (PFCs) Action Plan Summary 2010, pp. 1–24 (US Environmental Protection Agency). Available at http://www.epa.gov/oppt/existingchemicals/pubs/actionplans/pfcs.html [Verified 26 May 2011].
[9] L. W. Y. Yeung, Y. Miyake, S. Taniyasu, Y. Wang, H. Yu, M. K. So, G. Jiang, Y. Wu, J. Li, J. P. Giesy, N. Yamashita, P. K. S. Lam, Perfluorinated compounds and total and extractable organic fluorine in human blood samples from China. Environ. Sci. Technol. 2008, 42, 8140.
| Perfluorinated compounds and total and extractable organic fluorine in human blood samples from China.Crossref | GoogleScholarGoogle Scholar | 1:CAS:528:DC%2BD1cXhtFOqt7nF&md5=cfcb6d492929a6cb98c37ee6ef4dec04CAS |
[10] Y. Jin, X. Liu, H. Qin, Y. Ma, Y. Fan, Y. Zhang, N. Saito, K. Sasaki, A. Koizumi, The status quo of perfluorooctane sulfonate (PFOS) pollution in tap water and different waters in partial areas of China. China Environ. Sci. 2004, 24, 166..
[11] M. K. So, Y. Miyake, W. Y. Yeung, Y. M. Ho, S. Taniyasu, P. Rostkowski, N. Yamashita, B. S. Zhou, X. J. Shi, J. X. Wang, J. P. Giesy, H. Yu, P. K. S. Lam, Perfluorinated compounds in the Pearl River and Yangtze River of China. Chemosphere 2007, 68, 2085.
| Perfluorinated compounds in the Pearl River and Yangtze River of China.Crossref | GoogleScholarGoogle Scholar | 1:CAS:528:DC%2BD2sXotlWqsb4%3D&md5=ebdfeb7785ced6ecc6438d1f3f662a92CAS |
[12] M. K. So, S. Taniyasu, N. Yamashita, J. P. Giesy, J. Zheng, Z. Fang, S. H. Im, P. K. S. Lam, Perfluorinated compounds in coastal waters of Hong Kong, South China, and Korea. Environ. Sci. Technol. 2004, 38, 4056.
| Perfluorinated compounds in coastal waters of Hong Kong, South China, and Korea.Crossref | GoogleScholarGoogle Scholar | 1:CAS:528:DC%2BD2cXltVOjt7w%3D&md5=789d7fb1289a3018743c1ef60c97654eCAS |
[13] Y. Jin, N. Saito, K. H. Harada, K. Inoue, A. Koizumi, Historical trends in human serum levels of perfluorooctanoate and perfluorooctane sulfonate in Shenyang, China. Tohoku J. Exp. Med. 2007, 212, 63.
| Historical trends in human serum levels of perfluorooctanoate and perfluorooctane sulfonate in Shenyang, China.Crossref | GoogleScholarGoogle Scholar | 1:CAS:528:DC%2BD2sXmtVyktr4%3D&md5=b28f5c44aeb494d010a88cadf79df13eCAS |
[14] J. Liu, J. Li, Y. Luan, Y. Zhao, Y. Wu, Geographical distribution of perfluorinated compounds in human blood from Liaoning Province, China. Environ. Sci. Technol. 2009, 43, 4044.
| Geographical distribution of perfluorinated compounds in human blood from Liaoning Province, China.Crossref | GoogleScholarGoogle Scholar | 1:CAS:528:DC%2BD1MXlt1Sgt7Y%3D&md5=9ed51866a67ed2fe470a95ab956cfdfdCAS |
[15] A. M. Becker, S. Gerstmann, H. Frank, Perfluorooctane surfactants in waste waters, the major source of river pollution. Chemosphere 2008, 72, 115.
| Perfluorooctane surfactants in waste waters, the major source of river pollution.Crossref | GoogleScholarGoogle Scholar | 1:CAS:528:DC%2BD1cXlvVCgsro%3D&md5=c8c56acc183cc835f6484c19d7642cd9CAS |
[16] J. Falandysz, S. Taniyasu, A. Gulkowska, N. Yamashita, U. Schulte-Oehlmann, Is fish a major source of fluorinated surfactants and repellents in humans living on the Baltic coast? Environ. Sci. Technol. 2006, 40, 748.
| Is fish a major source of fluorinated surfactants and repellents in humans living on the Baltic coast?Crossref | GoogleScholarGoogle Scholar | 1:CAS:528:DC%2BD28XlsFei&md5=7716280f053e330200ddcae4377152bcCAS |
[17] A. Gulkowska, Q. Jiang, M. K. So, S. Taniyasu, P. K. S. Lam, N. Yamashita, Persistent perfluorinated acids in seafood collected from two cities of China. Environ. Sci. Technol. 2006, 40, 3736.
| Persistent perfluorinated acids in seafood collected from two cities of China.Crossref | GoogleScholarGoogle Scholar | 1:CAS:528:DC%2BD28XksValt7s%3D&md5=75fd57a9733b29e5f82ed78644cee456CAS |
[18] Y. Wang, L. W. Y. Yeung, N. Yamashita, S. Taniyasu, M. K. So, M. B. Murphy, P. K. S. Lam, Perfluorooctane sulfonate (PFOS) and related fluorochemicals in chicken egg in China. Chin. Sci. Bull. 2008, 53, 501.
| Perfluorooctane sulfonate (PFOS) and related fluorochemicals in chicken egg in China.Crossref | GoogleScholarGoogle Scholar | 1:CAS:528:DC%2BD1cXhs1Gnuro%3D&md5=4b2c232f163a70e5cdd6ebfc224f80a8CAS |
[19] X. Li, L. W. Y. Yeung, M. Xu, S. Taniyasu, P. K. S. Lam, N. Yamashita, J. Dai, Perfluorooctane sulfonate (PFOS) and other fluorochemicals in fish blood collected near the outfall of waste water treatment plant (WWTP) in Beijing. Environ. Pollut. 2008, 156, 1298.
| Perfluorooctane sulfonate (PFOS) and other fluorochemicals in fish blood collected near the outfall of waste water treatment plant (WWTP) in Beijing.Crossref | GoogleScholarGoogle Scholar | 1:CAS:528:DC%2BD1cXhsVSgtLnF&md5=eea2f6ca2b6d525f57a821f42e520444CAS |
[20] S. Taniyasu, K. Kannan, M. K. So, A. Gulkowska, E. Sinclair, T. Okazawa, N. Yamashita, Analysis of fluorotelomer alcohols, fluorotelomer acids, and short- and long-chain perfluorinated acids in water and biota. J. Chromatogr. A 2005, 1093, 89.
| Analysis of fluorotelomer alcohols, fluorotelomer acids, and short- and long-chain perfluorinated acids in water and biota.Crossref | GoogleScholarGoogle Scholar | 1:CAS:528:DC%2BD2MXhtFeiu7zM&md5=99f3f301cdd0d3bf332509a6daac9a1bCAS |
[21] S. Taniyasu, K. Kannan, L. W. Y. Yeung, K. Y. Kwok, P. K. S. Lam, N. Yamashita, Analysis of trifluoroacetic acid and other short-chain perfluorinated acids (C2–C4) in precipitation by liquid chromatography-tandem mass spectrometry: Comparison to patterns of long-chain perfluorinated acids (C5–C18). Anal. Chim. Acta 2008, 619, 221.
| Analysis of trifluoroacetic acid and other short-chain perfluorinated acids (C2–C4) in precipitation by liquid chromatography-tandem mass spectrometry: Comparison to patterns of long-chain perfluorinated acids (C5–C18).Crossref | GoogleScholarGoogle Scholar | 1:CAS:528:DC%2BD1cXnt1Oktrk%3D&md5=55103c4dd3a2f335afe060c066e07723CAS |
[22] Y. Wang, L. W. Y. Yeung, S. Taniyasu, N. Yamashita, J. C. W. Lam, P. K. S. Lam, Perfluorooctane sulfonate and other fluorochemicals in waterbird eggs from South China. Environ. Sci. Technol. 2008, 42, 8146.
| Perfluorooctane sulfonate and other fluorochemicals in waterbird eggs from South China.Crossref | GoogleScholarGoogle Scholar | 1:CAS:528:DC%2BD1cXhtFOqt7nM&md5=ec0c0aa78c7c20e7f221245e134150faCAS |
[23] J. P. Benskin, M. Bataineh, J. W. Martin, Simultaneous characterization of perfluoroalkyl carboxylate, sulfonate, and sulfonamide isomers by liquid chromatography-tandem mass spectrometry. Anal. Chem. 2007, 79, 6455.
| Simultaneous characterization of perfluoroalkyl carboxylate, sulfonate, and sulfonamide isomers by liquid chromatography-tandem mass spectrometry.Crossref | GoogleScholarGoogle Scholar | 1:CAS:528:DC%2BD2sXotlCrtrw%3D&md5=7fb40c610cea642f137d77551ff1866cCAS |
[24] J. P. Giesy, K. Kannan, Global distribution of perfluorooctane sulfonate and related perfluorinated compounds in wildlife. Environ. Sci. Technol. 2001, 35, 1339.
| Global distribution of perfluorooctane sulfonate and related perfluorinated compounds in wildlife.Crossref | GoogleScholarGoogle Scholar | 1:CAS:528:DC%2BD3MXhsVGnurg%3D&md5=e5a5453b4d2a3d83f723af878a2c9adbCAS |
[25] N. Yamashita, K. Kannan, S. Taniyasu, Y. Horii, T. Okazawa, G. Petrick, T. Gamo, Analysis of perfluorinated acids at parts-per-quadrillion levels in seawater using liquid chromatography-tandem mass spectrometry. Environ. Sci. Technol. 2004, 38, 5522.
| Analysis of perfluorinated acids at parts-per-quadrillion levels in seawater using liquid chromatography-tandem mass spectrometry.Crossref | GoogleScholarGoogle Scholar | 1:CAS:528:DC%2BD2cXnvVKltLg%3D&md5=1d4d0332977bf55a841ee58a66da467aCAS |
[26] ISO25101: 2009. Water quality – Determination of perfluorooctanesulfonate (PFOS) and perfluorooctanoate (PFOA) – Method for unfiltered samples using solid phase extraction and liquid chromatography/mass spectrometry 2009 (International Organization for Standardization: Geneva, Switzerland).
[27] W. Liu, G. Dong, Y. Jin, K. Sasaki, N. Saito, I. Sato, S. Tsuda, S. Nakayama, Occurrence of perfluoroalkyl acids in precipitation from Shenyang, China. Chin. Sci. Bull. 2009, 54, 2440.
| Occurrence of perfluoroalkyl acids in precipitation from Shenyang, China.Crossref | GoogleScholarGoogle Scholar | 1:CAS:528:DC%2BD1MXovVSnsr0%3D&md5=a4319ca5d6f466d099ecf11f993cfbb9CAS |
[28] K. S. Guruge, P. M. Manage, N. Yamanaka, S. Miyazaki, S. Taniyasu, N. Yamashita, Species-specific concentrations of perfluoroalkyl contaminants in farm and pet animals in Japan. Chemosphere 2008, 73, S210.
| Species-specific concentrations of perfluoroalkyl contaminants in farm and pet animals in Japan.Crossref | GoogleScholarGoogle Scholar | 1:CAS:528:DC%2BD1cXhtVWitL7O&md5=af723be99c2900754cb82851bbcd0f3bCAS |
[29] K. Senthilkumar, E. Ohi, K. Sajwan, T. Takasuga, K. Kannan, Perfluorinated compounds in river water, river sediment, market fish, and wildlife samples from Japan. Bull. Environ. Contam. Toxicol. 2007, 79, 427.
| Perfluorinated compounds in river water, river sediment, market fish, and wildlife samples from Japan.Crossref | GoogleScholarGoogle Scholar | 1:CAS:528:DC%2BD2sXhtFGgsL%2FF&md5=4cd727e87c2b985f89debc6eb4e7fffaCAS |
[30] X. B. Ye, M. J. Strynar, S. F. Nakayama, J. Varns, L. Helfant, J. Lazorchak, A. B. Lindstrom, Perfluorinated compounds in whole fish homogenates from the Ohio, Missouri, and upper Mississippi Rivers, USA. Environ. Pollut. 2008, 156, 1227.
| Perfluorinated compounds in whole fish homogenates from the Ohio, Missouri, and upper Mississippi Rivers, USA.Crossref | GoogleScholarGoogle Scholar | 1:CAS:528:DC%2BD1cXhsVSgtLnM&md5=eb14c5eb2a174ae1efb2c36f8fa0b46bCAS |
[31] M. K. So, N. Yamashita, S. Taniyasu, Q. Jiang, J. P. Giesy, K. Chen, P. K. S. Lam, Health risks in infants associated with exposure to perfluorinated compounds in human breast milk from Zhoushan, China. Environ. Sci. Technol. 2006, 40, 2924.
| Health risks in infants associated with exposure to perfluorinated compounds in human breast milk from Zhoushan, China.Crossref | GoogleScholarGoogle Scholar | 1:CAS:528:DC%2BD28XjtFSqsrY%3D&md5=cae342c6ba4db75fe1a2c0077b9c9857CAS |
[32] C. P. Dougherty, S. H. Holtz, J. C. Reinert, L. Panyacosit, D. A. Axelrad, T. J. Woodruff, Dietary exposures to food contaminants across the United States. Environ. Res. 2000, 84, 170.
| Dietary exposures to food contaminants across the United States.Crossref | GoogleScholarGoogle Scholar | 1:CAS:528:DC%2BD3cXotF2ksr8%3D&md5=ed8ff88122488dd3f2a6477d9ae2fcceCAS |
[33] China Fishery Administration Investigation and suggestions on development of marine fishery and exploration of food sources. China Soft Science 1998, 4, 40. [In Chinese].