

Perfluorinated compounds in red-throated divers from the German Baltic Sea: new findings from their distribution in 10 different tissues
Janne Rubarth A B E , Annekatrin Dreyer A C , Nils Guse D , Jürgen W. Einax B and Ralf Ebinghaus AA Helmholtz-Zentrum Geesthacht, Max-Planck-Straße 1, D-21502 Geesthacht, Germany.
B Friedrich Schiller University of Jena, Lessingstraße 8, D-07743 Jena, Germany.
C Eurofins GfA GmbH, Air Monitoring, Stenzelring 14b, D-21107 Hamburg, Germany.
D Research and Technology Centre Westcoast (FTZ), University of Kiel, Hafentörn 1, D-25761 Büsum, Germany.
E Corresponding author. Present address: Leibniz Institute for Baltic Sea Research Warnemünde, Seestraße 15, D-18119 Rostock, Germany. Email: janne.rubarth@io-warnemuende.de
Environmental Chemistry 8(4) 419-428 https://doi.org/10.1071/EN10142
Submitted: 23 December 2010 Accepted: 11 April 2011 Published: 19 August 2011
Journal Compilation © CSIRO Publishing 2011 Open Access CC BY-NC-ND
Environmental context. Perfluorinated compounds are commonly used chemicals that are detected globally in all environmental matrices. We investigated the extent of contamination by perfluorinated compounds in the red-throated diver, a marine predatory bird, and observed an unusual distribution of perfluorinated compounds in tissues. The data help us to better understand the behaviour of these contaminants in organisms.
Abstract. Twenty poly- and perfluorinated compounds (PFCs) were investigated in four red-throated divers (Gavia stellata) from the German Baltic Sea sampled in 2005. Concentrations of perfluoroalkyl sulfonates (PFSAs), perfluoroalkyl carboxylates (PFCAs), alkylated perfluoroalkyl sulfonamides, alkylated perfluoroalkyl sulfonamidoethanols and perfluorooctane sulfonamides were determined in blood, brain, fatty tissue, gall bladder, heart, kidney, liver, lung, muscle and spleen by high-performance liquid chromatography tandem mass spectrometry (HPLC-MS/MS). For quantification standard addition was applied. Twelve compounds were detected with average total PFC concentrations ranging from 42 ng g–1 in muscle to 220 ng g–1 in liver samples. Perfluorooctane sulfonate (PFOS) was the major compound in each of the 40 tissue samples. Except for brain, perfluoroundecanoate was the dominant PFCA. In brain samples preferential enrichment of long-chain PFSAs and PFCAs was observed. The total PFC body burden was estimated to 100 ± 39 µg. Multivariate statistical analyses supported the identification of the preferred accumulation ‘location’ of individual PFCs in the birds’ body.
Additional keywords: biota, birds, body burden, tissue distribution.
Introduction
As a result of their remarkable and unique physicochemical properties, poly- and perfluorinated compounds (PFCs) are almost irreplaceable in industry and commerce.[1] The global distribution of ionic PFCs such as perfluoroalkyl sulfonates (PFSAs) and perfluoroalkyl carboxylates (PFCAs) is caused by extensive use and persistence of these substances[2,3] as well as their potential for long-range transport. Depending on the molecule size, perfluorinated acids can be highly soluble in water,[4] which explains their transport in the water phase.[5] However, it is suggested that atmospheric transport of neutral volatile and semi-volatile precursor substances like fluorotelomer alcohols (FTOHs), perfluorinated sulfonamides (FASAs) and perfluorinated sulfonamido ethanols (FASEs) and their degradation to PFSAs and PFCAs is also an important long-range transport pathway.[6–8] PFSAs and PFCAs are persistent, toxic and partly bioaccumulative.[9,10] Their bioaccumulation potential increases with increasing chain lengths of the molecules.[11] Bioaccumulation of PFSAs starts with a chain length of five,[11] for PFCAs with a chain length of seven perfluorinated carbon atoms.[10] As PFSAs and PFCAs biomagnify along the food chain,[12] piscivorous top predators possess the highest contamination in marine wildlife.[2] Substance profiles of PFSAs and PFCAs and their distribution in the body of different mammals are quite similar.[12–14] Perfluorooctane sulfonate (PFOS) is usually the dominating compound followed by perfluorononanoate (PFNA).[12,15] The highest concentrations of PFCs have been detected in liver and kidney tissues.[13,16,17] Investigations concerning seabirds reveal different compositions. The dominating PFCA is perfluoroundecanoate (PFUnDA) or sometimes even perfluorotridecanoate (PFTriDA).[12,18] In northern fulmars and thick-billed murres from Canada, PFCAs presented more than 80 % of the total PFC contamination.[19] Furthermore, this is the only study where PFOS was not observed to be the dominant PFC in biota. Three studies investigated the distribution of PFCs in the body of seabirds.[18,20,21] Each study found a different organ to be the most contaminated one: kidney,[18] blood[20] and spleen.[21] This means that results concerning substance compositions as well as the major compound and the target organs of contamination in birds are rare and inconsistent.
The red-throated diver is a top predator in the marine food web. It is considered to be an opportunistic feeder and it could be shown that the food spectrum of red-throated divers in the Southern Baltic Proper is dominated by zander (in autumn) and herring (in spring) – two fish species that are also part of the human diet.[22] Biomagnification of PFSAs and PFCAs in food webs was established in various studies[12,23] and therefore contamination in red-throated divers is probably related to their diet. In 2005, 21 363 metric tonnes (t) of fish including 16 554 t of herring were caught for human consumption in the fishing grounds of Mecklenburg – West Pomerania in the Southern Baltic Proper.[24] Therefore, PFC concentrations in red-throated divers might indicate a possible contamination source for humans as well.
The objectives of this study were to describe the contamination status of red-throated divers subsisting on herring and zander from the Southern Baltic Proper, a part of the Baltic Sea, as a common fishing ground. Therefore, we determined the concentrations of five PFSAs, 10 PFCAs, perfluorooctane sulfonamide (PFOSA), two FASAs and two FASEs in these birds. Furthermore, we investigated substance profiles and the organ specific distribution of PFCs in red-throated divers to amplify the state of knowledge and to potentially confirm previous results and estimates. Since the approach covers all available tissues, this dataset enabled the most precise estimate of the PFC body burden in seabirds so far. In addition, multivariate statistical analyses were used to discover distribution patterns within the dataset.
Experimental
Chemicals and target analytes
The target analytes investigated in this study are listed in Table A1 in the Accessory publication. All solvents, reagents and standards were of high commercial quality and purity. Details are also listed in the Accessory publication (Tables A1, A2).
Sampling
Red-throated divers (n = 4) were collected near Usedom, Mecklenburg – West Pomerania, Germany in March and April 2005 (Fig. A1). All red-throated divers were bycatch in set net fisheries in the Pomeranian Bight, a small part of the Southern Baltic Proper. The set nets followed the 10-m depth line along the coast of Usedom and were checked two to four times a week. While looking for food, red-throated divers were caught by the nylon nets and drowned. Between collection and dissection in November 2009 the birds were stored at –20 °C at the Research and Technology Centre Westcoast (FTZ). All tissue samples were taken with clean stainless steel instruments and weighed before sub-sampling. Parameters like wing length or nutritional conditions were logged as well. The dissection protocols are listed in the Accessory publication (Table A3). Depending on their size, the whole organs or their parts were stored in polypropylene containers, which had been previously rinsed with acetonitrile, at –20 °C until preparation. Detailed information can be found in Table A3. The investigated tissue samples comprised blood, brain, fatty tissue, gall bladder (without bile), heart, kidney, liver, lung, muscle tissue and spleen. The remaining parts of the birds, e.g. skin, feathers, beak, feet and gastrointestinal tract were not sampled for this study.
Sample preparation
Samples were prepared by a modified method of Powley et al.[25] All stored tissue samples were defrosted and completely homogenised using a disperser (T 25 basic Ultra-Turrax, IKA, Staufen, Germany). To avoid heating while homogenising, tissue samples were cooled in a water bath. Depending on the tissue weight, up to 1 g of the homogenised sample or 2 mL of blood were loaded into a pre-cleaned 15-mL polypropylene centrifuge tube. Five millilitres of acetonitrile were added to the homogenised tissue sample. After careful vortex mixing (REAX top, Heidolph, Schwabach, Germany) for 30 s, the sample was placed in an ultrasonic bath at a temperature of ~30 °C for 30 min. The dispersion was centrifuged at 4116g at room temperature 23 °C (Universal 320, Hettich, Tuttlingen, Germany) for 30 min. The clear supernatant was transferred to another polypropylene centrifuge tube and the extraction was repeated once. As standard addition was used for quantification (see below), the combined supernatants were carefully vortex mixed and separated into three aliquots of 3 mL each. The second and the third aliquot were spiked with 50 and 100 µL of a standard solution containing native PFCs (standard solution 1) respectively. The composition and compound concentrations of standard solution 1 are listed in Table A4 in the Accessory publication. Thirty microlitres of a standard solution containing mass-labelled PFCs only (standard solution 2) were added to the first aliquot to enable the calculation of recovery rates in each sample. Concentrations complied with those of standard solution 1. Each aliquot of tissue extract was concentrated to ~1 mL under a gentle stream of nitrogen (vapotherm mobil, Barkey, Leopoldshöhe, Germany). For clean-up, the extract was transferred to a 1.7-mL polypropylene centrifuge tube filled with 30 mg of activated carbon and 50 µL of glacial acetic acid. After vortex mixing and 20 min of centrifugation at 4116g at room temperature 23 °C the supernatant was transferred to a glass vial. The activated carbon was rinsed with 1 mL of acetonitrile, centrifuged and the second supernatant was combined with the first. Each extract was concentrated to exactly 150 µL under a gentle N2 stream (flowtherm optocontrol, Barkey, Leopoldshöhe, Germany). Finally, the first and third aliquots were transferred to 200-µL high performance liquid chromatography (HPLC) auto sampler vials filled with 20 µL of nanopure water (MilliQ Integral 10 TOC, Millipore, Schwalbach/Taunus, Germany) and 30 µL of methanol. The second aliquot was transferred to a 200-µL HPLC auto sample vial filled with 20 µL of nanopure water and 30 µL of standard solution 2. The contents of each vial were carefully mixed.
Instrumental analysis
Samples were analysed using HPLC (Agilent 1100 Series HP, Agilent, Waldbronn, Germany) coupled to a tandem mass spectrometer (MS/MS; API 3000, Applied Biosystems/MDS Sciex Triple Quadrupol, Darmstadt, Germany) interfaced with an electrospray ionisation source in a negative ionisation mode ((–)ESI). A Phenomenex Synergi, 4-µm packing, Hydro-RP 80A, 150 mm × 2 mm (Phenomenex, Aschaffenburg, Germany) column was used for HPLC. A Phenomenex Synergi, 2.5-µm packing, Hydro-RP Mercury, 20 mm × 2 mm was used as a precolumn. The mobile phase consisted of buffered methanol and nanopure water (10 mM ammonium acetate, each) and started at 70 % methanol. The linear gradient was increased to 90 % methanol at 4 min, to 100 % at 30 min and was maintained for 10 min before changing to rinsing conditions. The rinsing process took 8 min at 30 % methanol. Injection volumes of 10 µL were used, with a flow rate of 0.2 mL min–1 and a column temperature of 30 °C. The precursor ion to fragment transitions for all target analytes are listed in Table A5 in the Accessory publication.
Quantification
As observed previously,[26] the sample matrix may result in alterations of the ionisation efficiency such as signal suppressions. Application of a solvent calibration to quantify a spiked standard mixture in bird extracts confirmed this assumption: all calculated concentrations were much lower than the true values.[27] Thus, this matrix effect-related bias needed to be corrected. However, only 12 mass-labelled internal standards were available for the 20 target analytes. To assure that both substance and mass-labelled standard behave equally during analyses, relative recovery rates (recovery ratios of native substance and corresponding mass-labelled standard) ought to be calculated in each of the 10 different matrices as suggested previously for other matrices.[28] However, because of the small sample quantities involved in the present study, this kind of validation was not feasible. Another quantification option, matrix-assisted calibration, was also limited by the small sample quantities. Furthermore, in preliminary tests the use of a ‘comparable’ matrix (turkey liver) for the matrix-assisted calibration caused bias concentrations of a spiked standard mixture.[27] Therefore, the method of standard additions was used for quantification. According to preliminary findings in red-throated divers, target analytes were classified into three groups with different concentrations (Table A4). Standard addition was performed with two spike levels. The procedure of standard addition complies with the requirements of DIN standards.[29]
Quality assurance and quality control
Sample preparation was performed in a Varipro clean laboratory system (class 10.000, Daldrop+Dr Ing. Huber, Neckartailfingen, Germany). Perfluorinated materials or fluorinated polymers such as Teflon were avoided during sampling, sample preparation and instrumental analysis. The glassware was machine washed, heated at 250 °C for 12 h and washed with acetonitrile before use.
For quality assurance the accuracy, precision and linearity of the instrumental analysis as well as instrumental detection limits (IDLs) and instrumental quantification limits (IQLs) were ascertained. IDLs on the basis of signal to noise (S/N) ratios of 3 were between 3 ng L–1 (perfluorooctanoate (PFOA)) and 22 ng L–1 (perfluoroheptane sulfonate (PFHpS)). IQLs were evaluated on the basis of an S/N ratio of 10. The complete method including extraction and analysis was validated by evaluating linearity, homoscedasticity, precision (including and excluding the quantification), accuracy (estimating the recovery rates of every single step of the sample preparation as well as of the complete method and comparing a calculated concentration of a spiking experiment with the true value (Student t-test)), as well as method detection limits (MDLs) and method quantification limits (MQLs). For the determination of these validation parameters a ‘comparable’ matrix (extract of unpolluted turkey liver samples) was spiked with a solvent-based standard solution. MDLs on the basis of S/N ratios of 3 were between 0.12 µg L–1 (perfluorotetradecanoate (PFTeDA)) and 4.2 µg L–1 (PFOSA). MQLs were evaluated on the basis of an S/N ratio of 10. MDLs and MQLs were calculated for each of the 10 different tissue samples. For each sample, recovery rates of mass-labelled internal standards were calculated. Recovery rates were dependent on the tissue investigated. On average, they were lowest in blood (60 %) and highest in brain samples (102 %). Recovery rates as well as MDLs and MQLs in real samples are listed in the Accessory publication (Tables A6 and A7). Analytes in the real tissue samples were considered as ‘detected’ if the calculated concentration was above the MDL. Concentrations below the MQL were listed with ‘<MQL’ and were not included in further calculations of total PFC concentrations or total body burden, i.e. they were treated as zero. To assure the validity of the standard addition method, the small number of spikes and the unusual times of spiking were carefully evaluated.
A method blank (1 mL of acetonitrile) was extracted with each sample batch consisting of four tissue samples. Method blanks were only sporadically contaminated with traces of PFOS and PFOA. Because concentrations of all analysed PFCs observed in blank samples were below the MQLs, results were not corrected for blank values.
Data treatment and statistical analyses
Datasets were tested for normal distribution (David test), outliers (Grubbs test) and trend (Neumann test). Student t-test and F-test (P = 0.01 or P = 0.05) were used to evaluate if differences between certain parameters were significant. For evaluating the linearity of the standard addition method, the Mandel test was applied. For precision of sample processing and the standard addition method the relative standard deviation was calculated. In addition, the accuracy was evaluated using the Student t-test or by calculating the recovery rates.
Although the small sample size of only four individuals may limit the significance of the results, multivariate statistical analyses were performed. Therefore, only concentrations of 12 compounds that were detected in more than 50 % of all samples were used: perfluorohexane sulfonate (PFHxS), PFHpS, PFOS, perfluorodecane sulfonate (PFDS), PFOA, PFNA, perfluorodecanoate (PFDA), PFUnDA, perfluorododecanoate (PFDoDA), PFTriDA, PFTeDA and PFOSA. Because of the possible decomposition of PFOSA to PFOS,[30] these two variables are not mutually independent. Therefore, they were combined into one parameter. Concentrations below the detection or the quantification limit were calculated using Eqn 1:

where cmod is the modified concentration, cMDL is the concentration of the MDL and rnd is a random number between 0 and 1. Thus, the modified concentrations calculated complied with the MDL ± 5 %. For multivariate analyses concentrations of the completed dataset were standardised using Eqn 2:
where z is the standardised concentration, c is the concentration,  is the mean concentration and s is the standard deviation.
Cluster analysis was performed for concentrations of the tissue samples whereby the tissue samples present the objects and the mean PFC concentrations of each of the 12 selected compounds mentioned above present the variables. Because of the uncertainties concerning PFC contamination in the lungs (see below), lung tissues were excluded from cluster analyses. Thus, the analysis was performed on the basis of 12 mean PFC concentrations (n = 4; 12 variables) of nine tissues (nine objects). Clustering occurred using the Ward agglomeration method and the Euclidean squared distance.
Factor analysis was performed on individual PFC concentrations using the Kaiser criterion so that only Eigenvalues greater than 1 were applied. To facilitate the interpretation of the factors, the varimax rotation was applied.
Results and discussion
Occurrence of the target analytes
Of 20 determined PFCs, 12 were detected (PFHxS, PFHpS, PFOS, PFDS, PFOA, PFNA, PFDA, PFUnDA, PFDoDA, PFTriDA, PFTeDA and PFOSA) in almost each of the 40 tissue samples. Their concentrations and proportions in the different tissues are described below. Two target compounds were rarely detected within the 40 tissue samples (perfluoroheptanoate (PFHpA) in only six samples and perfluorodecahexanoate (PFHxDA) in only eight samples). Six target analytes (perfluorobutane sulfonate (PFBS) and perfluorooctadecanoate (PFOcDA), N-methyl perfluorooctane sulfonamide (N-MeFOSA), N-ethyl perfluorooctane sulfonamide (N-EtFOSA), N-methyl perfluorooctane sulfonamidoethanol (N-MeFOSE) and N-ethyl perfluorooctane sulfonamidoethanol (N-EtFOSE)) were not detected in any of the 40 tissue samples. Because of the expected degradation of N-MeFOSA, N-EtFOSA, N-MeFOSE and N-EtFOSE under environmental and biological conditions,[30,31] the lack of FASAs and FASEs was not surprising. The lack of detection of PFBS and rare detection of PFHpA (only six samples) were probably caused by the non-existent bioaccumulation of these compounds. In nearly all wildlife studies bioaccumulation was observed for PFSAs containing more than four and for PFCAs containing more than six perfluorinated carbon atoms.[10,11] Previous studies have demonstrated increasing PFC bioconcentration factors with increasing chain length.[11] In addition, relatively low bioconcentration factors for PFTeDA suggested a possible limitation of bioaccumulation for long-chain PFCAs.[11] The present study is one of the first to monitor the very long-chain PFCAs PFHxDA and PFOcDA in wildlife. The aforementioned possible limitation of bioaccumulation for long-chain PFCAs was confirmed by the results of this study: PFTeDA was detected in 70 %, PFHxDA in 20 % and PFOcDA in none of the 40 tissue samples.
PFC concentrations
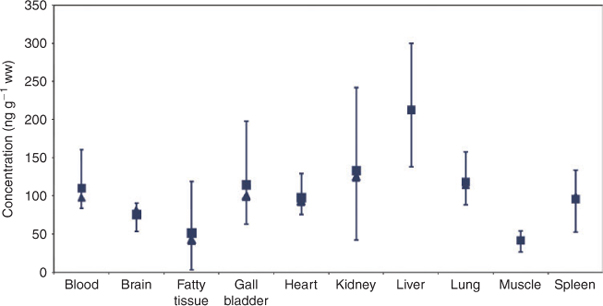
Total PFC concentrations in all of the 10 different tissue samples are presented in Fig. 1. Individual concentrations of each PFC measured and of each of the four red-throated divers as well as standard deviations are listed in Tables A8 and A9 in the Accessory publication. The good congruence of median and mean suggests normally distributed data as well as a lack of outliers. As a result of standard addition as a quantification method as well as concentrations occurring in trace levels, calculated confidence intervals were quite high (up to 300 %). Results of previously conducted validations confirmed the accuracy of the complete method (absolute recovery rates calculated on the basis of a matrix-assisted calibration were between 85 % (PFOcDA) and 115 % (PFHxS)) as well as the high standard deviation (Table A10). Relative standard deviations increased in the order of instrumental detection (1.6 % (PFTeDA) – 4.4 % (PFHxS)) <sample preparation + instrumental detection (1.6 % (PFOSA) –12 % (PFHpS)) < complete method including the quantification using standard additions (29 % (PFOA) – 58 % (PFDS)). The absolute concentrations calculated in the present study are comparable with the results of previous studies determining PFC concentrations and tissue distribution in birds.[18,20,21] However, because of the aforementioned uncertainties the concentrations determined in the present study should be considered as ‘concentration levels’ rather than absolute concentration values with several decimal places.
|
In this study, the most contaminated bird tissue on the ng g–1 basis is liver followed by kidney, lung, gall bladder and blood. As expected, the lowest total PFC concentrations were observed in fatty and muscle tissue. However, the concentrations in fatty tissue were only four-fold lower than in liver samples. This rather untypical proportion of concentrations in fatty tissue and liver was also observed by van de Vijver et al.[13] in seals from the Dutch Wadden Sea (n ≥ 17). Nevertheless, these findings are contradictory to other wildlife studies[16,32] and therefore further research is needed for clarification. Except for the kidney and gall bladder, mean total PFC concentrations in the liver were significantly higher than in the other nine tissue samples (P < 0.05). Previous studies investigating biota samples found liver to be the most highly contaminated tissue in mammals[16,33] whereas in fish[11] and birds[18,20,21] the highest concentrations were observed in plasma/blood, kidney or spleen. In these and in the present study, the lowest concentrations were observed in muscle and fatty tissue.
PFOS concentrations in liver samples of the red-throated divers observed in this study were similar to those detected in black-tailed gulls from South Korea as well as from different seabird species from Europe (Table 1).[14,34] Liver samples from the Canadian Arctic or the North Pacific were less contaminated whereas concentrations in those of brown pelicans from North America were more than two-fold higher.[34]

|
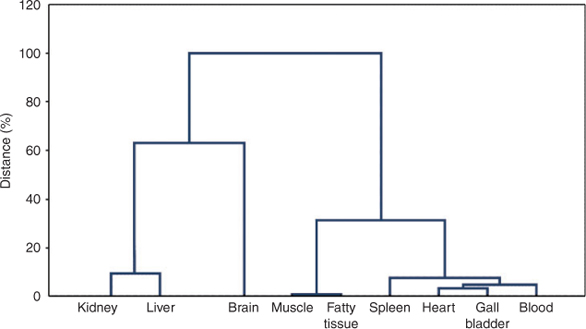
A cluster analysis was performed with the standardised PFC concentrations of the 10 sample tissues (refer to the method section). Results of the cluster analysis are presented in the dendrogram in Fig. 2 and confirm the above mentioned findings. The first clustering divided the objects into two clusters segregating brain, kidney and liver from the other tissues. In both clusters a substructure is obvious forming two sub-clusters each. Kidney and liver, the two tissues of highest PFC contamination of the dataset, form one cluster. Brain contains a medium PFC concentration but reveals the highest concentrations of long-chain molecules (see below) and thus forms a separate sub-cluster. In cluster 2, fatty and muscle tissues are separated from blood, gall bladder, heart and spleen, probably because of their very low PFC concentrations.
|
PFC profiles in tissue samples
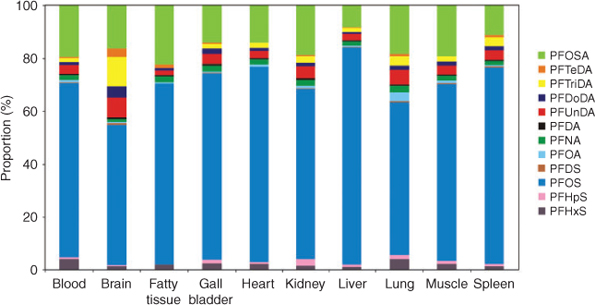
PFC profiles in the 10 different tissue samples are presented in Fig. 3. Average proportions of PFOS and its precursor substance PFOSA accounted for ~90 % of the total PFC amount in 8 of 10 tissues. Except for brain and lung, profiles of the 12 detected PFCs of the eight remaining tissues were quite similar. Previous studies determined similar relative distributions.[13,18,20] Only in one study that sampled seabirds from the Canadian Arctic was the percentage of total PFCAs and total PFSAs reversed.[19]
|
In comparison to other tissues (PFOA contribution ranging from 0.4 % in fatty tissue to 0.9 % in muscle tissue), lung samples were characterised by a rather high PFOA contribution (3.5 %). These results were unexpected as bioaccumulation of PFOA is the lowest within the group of perfluorinated carboxylates.[11] In previous studies PFOA was detected only sporadically and in small concentrations in biota samples including herring samples, the main feed of red-throated divers.[13,18] The exact reason for finding relatively high PFOA concentrations in lung tissue samples of red-throated divers remains unclear. It is not unlikely that these high PFOA concentrations might be associated with the birds’ death by drowning in seawater. Seawater in this part of the Baltic Sea contains PFOA concentrations of ~1 ng L–1[35] Therefore, PFOA-contaminated water may have entered the birds’ lungs. However, as a rough estimate at least 100 L of seawater would have been necessary to reach the contamination level observed in the lung tissue. Another hypothesis may comprise the inhalation of marine aerosols by the red-throated divers. Recently, it was discussed that PFOA concentrations may be up to 80 times higher in aerosols than in the parent water body (ocean water).[36–38] Enriched in marine aerosols, PFOA might have reached the birds’ lungs as a part of the breathable air. After having entered the lungs, PFOA, as a main compound in Baltic Sea water, may preferentially accumulate in the lung tissue, probably as a result of interaction with hydrophobic parts of the lipid shares or with surfactant proteins of the cells.[39] Because of the hypothetical character of these interpretations, we decided to exclude lung samples from statistical discussions.
Except for the kidney, mean proportions of the sum of PFCAs in brain samples were significantly higher than in the other eight tissue samples (P < 0.05). Similarly, the PFSA with the longest chain length determined in this study (PFDS) was observed in elevated concentrations and proportions in brain samples. Hence, the question arises as to whether perfluorinated carboxylates only, or long-chain PFCs including perfluorinated carboxylates as well as sulfonates, accumulate preferentially in the brain. Verreault et al.[20] did not determine a preferential accumulation of PFCAs or long-chain PFCs in general in brain samples.
PFTriDA was the most highly concentrated carboxylate in brain samples whereas PFUnDA was the major PFCA in the nine remaining tissues. This difference may indicate a shift of the concentration maximum within the PFCAs up to long-chain molecules in brain samples. As observed in the present study’s investigated tissues (except for brain), previous studies analysing bird tissue samples discovered PFUnDA as most highly concentrated PFCA, too.[18,20] In contrast to birds, PFNA was the dominating compound among PFCAs found in mammals.[16,40] As far as analysed, PFUnDA and PFTriDA were observed in highest concentrations in fish of other regions[12,34,40] as well as in fish of the Baltic Sea.[41] Therefore, it was supposed that high concentrations of PFUnDA and PFTriDA in tissue samples of piscivorous seabirds may reflect the PFC pattern of their food.[40] As well as in previous studies,[15,40] results of the present study confirmed odd PFCAs (PFNA, PFUnDA, PFTriDA) to be more highly concentrated than even ones (PFDA, PFDoDA, PFTeDA). FTOHs and other fluorotelomer-based compounds were determined as important sources for PFCAs (see Ellis et al.[6]; and Young and Mabury, chapter 4, pp. 66–77[42]). In addition, Ellis et al.[6] confirmed that the previously observed even–odd pattern in biota samples[40] can probably be attributed to the degradation of FTOHs. Presumably the same trends apply to the other fluorotelomer-based compounds (see Young and Mabury, chapter 5, pp. 97–98[42]).
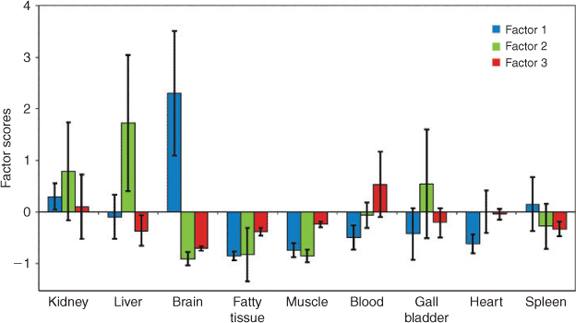
Despite the small sample size of only four individuals and the potential of achieving results of limited significance, factor analysis was performed to further structure the data. Detailed results of the factor analysis are given in Table A11 of the Accessory publication. Results of the factor analysis imply a possible dependence of lipophilicity and the ‘location’ of PFC accumulation. In general, the lipophilicity of PFCs increases with increasing perfluorinated carbon chain length and correlates positively with the bioaccumulation potential. A common criterion for lipophilicity is the octanol/water partition coefficient (KOW). Because the KOW cannot be determined for ionic surfactants[43] and the critical micelle concentration (CMC) is suggested not to be a suitable surrogate for surfactant lipophilicity,[44] the number of perfluorinated carbons was used to estimate the bioaccumulation of PFSAs and PFCAs.[10] Martin et al.[11,44] reported that bioaccumulation factors of PFSAs and PFCAs with an equal number of perfluorinated carbon atoms are higher for PFSAs than for PFCAs. Therefore, they suggested not only the lipophilicity but also the acid function as being responsible for different bioaccumulation potentials.[44] In the present factor analysis, long-chain PFCAs (PFTeDA, PFTriDA and PFDoDA) as well as long-chain PFSA (PFDS) correlated with the first factor. PFCs of a medium chain length (PFDA, PFOS and PFNA) correlated with the second factor. The shortest investigated PFCs (PFOA and PFHxS) correlated with the third factor. This classification, which can be attributed to the molecules’ chain length, is potentially linked to the lipophilicity as well. The factor scores, presented in Fig. 4, reveal the degree of influence induced by the factors and their correlating variables on the objects (tissue samples). Positive factor scores may indicate an influence of the substances correlating with the individual factor on the tissue. Negative factor scores suggest that the substances that correlate with the individual factors do not influence the respective tissue.
|
Confirming the observations on the basis of the substance composition as discussed above, brain samples are mainly influenced by long-chain PFCAs and PFDS. Factor scores of the second factor (including PFOS) were highest for liver samples. This corroborates previous studies reporting liver as the target organ of PFOS accumulation.[45,46] For blood samples, all factor scores of the third factor were positive. This means that the shortest investigated PFCs (PFOA and PFHxS) that correlate with the third factor might have an influence on the birds’ blood. Kidney as an excretory organ was influenced by all investigated substances. Fatty and muscle tissue, gall bladder, heart and spleen revealed no significant presence of any substance groups as factor scores were mainly negative or evenly distributed for all factors. It is well known that lipophilic substances are able to cross the blood–brain barrier.[47] To the best of our knowledge, this is the first time that a preferential accumulation of long-chain PFCAs (dominance of factor 1) in brain has been determined. Austin et al.[45] detected PFOS in rats’ brains and concluded its potential to cross the blood–brain barrier. They suggested that PFOS affects the central and neuroendocrine functions.[45] The effect of PFCAs in the brain is not yet known.
Distribution of PFCs in tissues and whole body burden
By multiplying the organs’ PFC concentrations by the weights of the organs themselves, the absolute PFC amount of each organ was calculated. The relative distribution of total PFC amounts in the 10 tissues as well as the tissue distribution (i.e. the fraction of the individual tissue mass related to the birds’ body mass) is given in Fig. 5. More than 65 % of the seabirds’ total mass is fatty and muscle tissue. Therefore, fatty and muscle tissue contain more than 50 % of the total PFC amount despite their low PFC concentrations. Thus, they do not seem to be insignificant reservoirs of PFCs. Fig. 5 clearly reflects the elevated PFC concentrations in liver samples. Even though the liver accounts for 5 % of the bird’s total body mass only, it contains nearly 20 % of the total PFC amount.

|
To the best of our knowledge only four other studies investigating PFCs in animals (seals) determined the amount of PFCs in several organs including fatty tissue.[13,16,17,32] Three studies estimated the relative distribution of PFC amounts in the investigated tissues,[16,17,32] the fourth study only calculated PFC concentrations of tissue samples.[13] Powley et al.[32] did not observe blubber concentrations above the limit of detection because of the remote habitat of the investigated seals. Sturman et al.[17] found concentrations in seal blubber to be highly variable along the seasons. Although in spring, blubber contained only 1 % of the total PFC amount (n = 10, Nain, Canada), in fall this percentage increased to 10 % (n = 5, Nain, Canada).[17] Therefore, a relation between PFC loadings and blubber contents was suggested.[17] Ahrens et al.[16] analysed PFCs in one- to two-year old harbour seals sampled in winter in the German Wadden Sea. They observed 2 % of the total PFC amount in blubber and 36 % in liver.[16] They found the highest concentrations in liver as well. Compared with a previously published study investigating harbour seals in the Dutch Wadden Sea (n = 17),[13] the PFC liver concentrations calculated by Ahrens et al.[16] were one order of magnitude higher and PFC blubber concentrations were one order of magnitude lower.[16] This may be attributable to differences in species, sampling location, season, age and physical conditions, which hamper direct inter-study comparisons of PFC concentrations as described above. In the present study, fatty tissue contained ~33 % of the total PFC amount with a suggested fat content of the red-throated divers of ~30 % of the whole body mass.[48] However, in the present as well as in the published studies[13,16,17] the total mass of fatty tissue was only estimated on the basis of literature data. Even though the estimated percentage of 33 % of total PFC amount in fatty tissue in the present study is relatively high, it indicates the potential relevance of fatty tissues as PFC reservoirs for species exhibiting high contents of fat. This is contradictory to other wildlife studies where fatty tissue was not identified as an important reservoir for PFCs.[11,46] As mentioned above, seasonal concentration variations in blubber[17] as well as complications during analysis and quantification of PFCs in fatty matrices[27] or limited comparability because of a lack of appropriate data may be responsible for this discrepancy.
The summation of organ-specific PFC amounts enables the estimation of the whole PFC body burden. In the present study ‘whole body’ only includes the 10 sampled tissues. Other organs such as the beak, feet, feathers or skin are not included. Their amount is estimated to be ~15 % of the whole body mass. The total PFC amount of the sampled bird (sum of 10 tissues) is 85 ± 33 µg. This corresponds to a concentration of 67 ±26 µg kg–1. Assuming that the remaining 15 % of the bird’s tissue are equally contaminated,[49] the total PFC body burden can be estimated to be 100 µg or 67 µg kg–1.
Conclusions and outlook
This study corroborates many results of previous investigations for birds. Liver was found to contain the highest PFC concentrations followed by kidney. The similarity of these two organs concerning the degree of PFC contamination was confirmed by the results of a cluster analysis. PFOS represented the major PFC in all of the forty tissue samples and PFOS and PFOSA accounted for ~90 % of total PFC in 8 of 10 tissues. Confirming a previously published characteristic of bird samples, in 9 of 10 tissues PFUnDA was found to be the major PFCA. Fatty tissue was found to potentially be an important PFC reservoir for species having a high fat content. As this option was probably neglected in former studies, further research is needed that includes an increased number of samples. Preferential enrichment of long-chain PFSAs and PFCAs in brain samples was observed and confirmed by results of cluster and factor analysis. Owing to the results of the factor analysis a possible relationship between PFC lipophilicity and their preferred accumulation ‘location’ within the organism was derived, although being somewhat uncertain because of the low sample size of only four individuals. However, all of these assumptions need to be confirmed by additional data of future studies with an increased number of sampled individuals in order to understand resulting consequences. In particular, the potential of several long-chain PFCs to cross the blood–brain barrier needs further investigation, also in terms of toxicological effects of long-chain PFSAs and PFCAs in the brain itself.
Acknowledgements
The authors thank Renate Sturm for her support. Philipp Schwemmer and Ursula Siebert (FTZ Büsum) are acknowledged for providing red-throated diver samples and for assistance concerning biological background information. In addition, the authors thank Kristin Schäfer for her support in performing the multivariate-statistical analyses and Christoph Sauer for assistance in terms of physiological background information.
References
[1] E. Kissa, Fluorinated Surfactants and Repellents 2001 (Marcel Dekker: New York).[2] M. Houde, J. W. Martin, R. J. Letcher, K. R. Solomon, D. C. G. Muir, Biological monitoring of polyfluoroalkyl substances: A review. Environ. Sci. Technol. 2006, 40, 3463.
| Biological monitoring of polyfluoroalkyl substances: A review.Crossref | GoogleScholarGoogle Scholar | 1:CAS:528:DC%2BD28XktVers7w%3D&md5=f4882d1064a287c19c118a9ecfaadc61CAS |
[3] K. Prevedouros, I. T. Cousins, R. C. Buck, S. H. Korzeniowski, Sources, fate and transport of perfluorocarboxylates. Environ. Sci. Technol. 2006, 40, 32.
| Sources, fate and transport of perfluorocarboxylates.Crossref | GoogleScholarGoogle Scholar | 1:CAS:528:DC%2BD2MXht1Gru7zK&md5=14e91a9069cf17a00b47907f105e54b6CAS |
[4] F. M. Hekster, R. W. P. M. Laane, P. de Vogt, Environmental and toxicity effects of perfluoroalkylated substances. Rev. Environ. Contam. Toxicol. 2003, 179, 99.
| Environmental and toxicity effects of perfluoroalkylated substances.Crossref | GoogleScholarGoogle Scholar | 1:CAS:528:DC%2BD3sXnvVGmsrs%3D&md5=02da0e4d98f421a49a529f3e0e6bcafeCAS |
[5] N. Yamashita, S. Taniyasu, G. Petrick, S. Wei, T. Gamo, P. K. S. Lam, K. Kannan, Perfluorinated acids as novel chemical tracers of global circulation of ocean waters. Chemosphere 2008, 70, 1247.
| Perfluorinated acids as novel chemical tracers of global circulation of ocean waters.Crossref | GoogleScholarGoogle Scholar | 1:CAS:528:DC%2BD1cXivVyjsw%3D%3D&md5=19a42dc813df79d65ddf8b9e4bd352c0CAS |
[6] D. A. Ellis, J. W. Martin, A. O. de Silva, S. A. Mabury, M. D. Hurley, M. P. Sulbaek Andersen, T. J. Wallington, Degradation of fluorotelomer alcohols: A likely atmospheric source of perfluorinated carboxylic acids. Environ. Sci. Technol. 2004, 38, 3316.
| Degradation of fluorotelomer alcohols: A likely atmospheric source of perfluorinated carboxylic acids.Crossref | GoogleScholarGoogle Scholar | 1:CAS:528:DC%2BD2cXjvVShsb0%3D&md5=1a2a8158f069618f177c7efa759abbccCAS |
[7] A. Dreyer, I. Weinberg, C. Temme, R. Ebinghaus, Polyfluorinated compounds in the atmosphere of the Atlantic and Southern Oceans: Evidence for a global distribution. Environ. Sci. Technol. 2009, 43, 6507.
| Polyfluorinated compounds in the atmosphere of the Atlantic and Southern Oceans: Evidence for a global distribution.Crossref | GoogleScholarGoogle Scholar | 1:CAS:528:DC%2BD1MXptlSmsLc%3D&md5=46de05fe93f6d53b1f1f97732b79ecceCAS |
[8] J. W. Martin, D. A. Ellis, S. A. Mabury, M. D. Hurley, T. J. Wallington, Atmospheric chemistry of perfluoroalkanesulfonamides: kinetic and product studies of the OH radical and Cl atom initiated oxidation of N-ethyl perfluorobutanesulfonamide. Environ. Sci. Technol. 2006, 40, 864.
| Atmospheric chemistry of perfluoroalkanesulfonamides: kinetic and product studies of the OH radical and Cl atom initiated oxidation of N-ethyl perfluorobutanesulfonamide.Crossref | GoogleScholarGoogle Scholar | 1:CAS:528:DC%2BD2MXhtlekurbM&md5=af7be02670c9dd4f3b823cf408ef1fb9CAS |
[9] C. Lau, K. Anitole, C. Hodes, D. Lai, A. Pfahles-Hutchens, J. Seed, Perfluoroalkyl acids: A review of monitoring and toxicological findings. Toxicol. Sci. 2007, 99, 366.
| Perfluoroalkyl acids: A review of monitoring and toxicological findings.Crossref | GoogleScholarGoogle Scholar | 1:CAS:528:DC%2BD2sXhtFKru7%2FI&md5=688334776fe3d8be0b25ee6dc3769693CAS |
[10] J. M. Conder, R. A. Hoke, W. de Wolf, M. H. Russell, R. C. Buck, Are PFCAs bioaccumulative? A critical review and comparison with regulatory criteria and persistent lipophilic compounds. Environ. Sci. Technol. 2008, 42, 995.
| Are PFCAs bioaccumulative? A critical review and comparison with regulatory criteria and persistent lipophilic compounds.Crossref | GoogleScholarGoogle Scholar | 1:CAS:528:DC%2BD1cXltFWmsw%3D%3D&md5=a5859b58e71eafefd64bade38f26a3c1CAS |
[11] J. W. Martin, S. A. Mabury, K. R. Solomon, D. C. G. Muir, Bioconcentration and tissue distribution of perfluorinated acids in rainbow trout (Oncorhynchus mykiss). Environ. Toxicol. Chem. 2003, 22, 196.
| 1:CAS:528:DC%2BD38XpslCmtrc%3D&md5=89a38a0b3a87fd47c0c171f2ed996a31CAS |
[12] J. W. Martin, D. M. Whittle, D. C. G. Muir, S. A. Mabury, Perfluoroalkyl contaminants in a food web from Lake Ontario. Environ. Sci. Technol. 2004, 38, 5379.
| Perfluoroalkyl contaminants in a food web from Lake Ontario.Crossref | GoogleScholarGoogle Scholar | 1:CAS:528:DC%2BD2cXnsFOgt7Y%3D&md5=7ee71ef50590d74db68683732cd31758CAS |
[13] K. I. van de Vijver, P. Hoff, K. Das, S. Brasseur, W. van Dongen, E. Esmans, P. Reijnders, R. Blust, W. de Coen, Tissue distribution of perfluorinated chemicals in harbor seals (Phoca vitulina) from the Dutch Wadden Sea. Environ. Sci. Technol. 2005, 39, 6978.
| Tissue distribution of perfluorinated chemicals in harbor seals (Phoca vitulina) from the Dutch Wadden Sea.Crossref | GoogleScholarGoogle Scholar | 1:CAS:528:DC%2BD2MXotVSlsL4%3D&md5=abbdf25b5f0ccb4add4f475ea6d97133CAS |
[14] K. Kannan, S. Corsolini, J. Falandysz, G. Oehme, S. Focardi, J. P. Giesy, Perfluorooctanesulfonate and related fluorinatd hydrocarbons in marine mammals, fishes, and birds from coasts of the Baltic and the Mediterranean Seas. Environ. Sci. Technol. 2002, 36, 3210.
| Perfluorooctanesulfonate and related fluorinatd hydrocarbons in marine mammals, fishes, and birds from coasts of the Baltic and the Mediterranean Seas.Crossref | GoogleScholarGoogle Scholar | 1:CAS:528:DC%2BD38Xks1Kktbk%3D&md5=afb1e793c28a61869f7c8a72340bf264CAS |
[15] M. Smithwick, S. A. Mabury, K. R. Solomon, C. Sonne, J. W. Martin, E. W. Born, R. Dietz, A. E. Derocher, R. J. Letcher, T. J. Evans, G. W. Gabrielsen, J. Nagy, I. Stirling, M. K. Taylor, D. C. G. Muir, Circumpolar study of perfluoroalkyl contaminants in polar bears (Ursus maritimus). Environ. Sci. Technol. 2005, 39, 5517.
| Circumpolar study of perfluoroalkyl contaminants in polar bears (Ursus maritimus).Crossref | GoogleScholarGoogle Scholar | 1:CAS:528:DC%2BD2MXltlGns7o%3D&md5=1ca02f41dde91e6a483d8de3a312ab1aCAS |
[16] L. Ahrens, U. Siebert, R. Ebinghaus, Total body burden and tissue distribution of polyfluorinated compounds in harbor seals (Phoca vitulina) from the German Bight. Mar. Pollut. Bull. 2009, 58, 520.
| Total body burden and tissue distribution of polyfluorinated compounds in harbor seals (Phoca vitulina) from the German Bight.Crossref | GoogleScholarGoogle Scholar | 1:CAS:528:DC%2BD1MXktVGqsbs%3D&md5=1369b6e593689cf97fd6de1f1df809d9CAS |
[17] S. Sturman, J. Small, K. R. Solomon, D. C. Muir, Tissue distribution of polyfluorinated compounds from two ringed seal (Phoca hispida) populations in the Canadian Arctic, poster presentation at SETAC Europe 17th Annual Meeting, Porto, Portugal, 20–24 May 2007.
[18] K. E. Holmström, U. Berger, Tissue distribution of perfluorinated surfactants in common guillemot (Uria aalge) from the Baltic Sea. Environ. Sci. Technol. 2008, 42, 5879.
| Tissue distribution of perfluorinated surfactants in common guillemot (Uria aalge) from the Baltic Sea.Crossref | GoogleScholarGoogle Scholar |
[19] C. M. Butt, S. A. Mabury, D. C. G. Muir, B. M. Braune, Prevalence of long-chained perfluorinated carboxylates in seabirds from the Canadian Arctic between 1975 and 2004. Environ. Sci. Technol. 2007, 41, 3521.
| Prevalence of long-chained perfluorinated carboxylates in seabirds from the Canadian Arctic between 1975 and 2004.Crossref | GoogleScholarGoogle Scholar | 1:CAS:528:DC%2BD2sXkt1OrsLc%3D&md5=52c046680c592e80b38ab8f001c2849aCAS |
[20] J. Verreault, M. Houde, G. W. Gabrielsen, U. Berger, M. Haukas, R. J. Letcher, D. C. G. Muir, Perfluorinated alkyl substances in plasma, liver, brain, and eggs of glaucous gulls (Larus hyperboreus) from the Norwegian Arctic. Environ. Sci. Technol. 2005, 39, 7439.
| Perfluorinated alkyl substances in plasma, liver, brain, and eggs of glaucous gulls (Larus hyperboreus) from the Norwegian Arctic.Crossref | GoogleScholarGoogle Scholar | 1:CAS:528:DC%2BD2MXpsFOrtro%3D&md5=58746e1e246615138fceb1e3f12c2eb9CAS |
[21] J. Olivero-Verbel, L. Tao, B. Johnson-Restrepo, J. Guette-Fernandez, R. Baldiris-Avila, I. O’byrne-Hoyos, K. Kannan, Perfluorooctanesulfonate and related fluorochemicals in biological samples from the north coast of Colombia. Environ. Pollut. 2006, 142, 367.
| Perfluorooctanesulfonate and related fluorochemicals in biological samples from the north coast of Colombia.Crossref | GoogleScholarGoogle Scholar | 1:CAS:528:DC%2BD28Xjs1aitrk%3D&md5=74505c9bc9b782e37eb58684676e0bafCAS |
[22] N. Guse, S. Garthe, B. Schirmeister, Diet of red-throated divers Gavia stellata reflects the seasonal availability of Atlantic herring Clupea harengus in the southwestern Baltic Sea. J. Sea Res. 2009, 62, 268.
| Diet of red-throated divers Gavia stellata reflects the seasonal availability of Atlantic herring Clupea harengus in the southwestern Baltic Sea.Crossref | GoogleScholarGoogle Scholar |
[23] M. Houde, T. A. D. Bujas, J. Small, R. S. Wells, P. A. Fair, G. D. Bossart, K. R. Solomon, D. C. G. Muir, Biomagnification of perfluoroalkyl compounds in the Bottlenose Dolphin (Tursiops truncatus) food web. Environ. Sci. Technol. 2006, 40, 4138.
| Biomagnification of perfluoroalkyl compounds in the Bottlenose Dolphin (Tursiops truncatus) food web.Crossref | GoogleScholarGoogle Scholar | 1:CAS:528:DC%2BD28XkvVGgt7s%3D&md5=be22d41b594c050b4985f9bf63a3e429CAS |
[24] State Agency for Agriculture, Food Safety and Fishing, Fangstatistik der Kl. Hochsee- und Küstenfischerei M-V 2005. Fanggebiete: Küstengewässer und Ostsee 2008. Available at http://www.lallf.de/fileadmin/media/PDF/fischer/5_Statistik/Fangstatistik_2005Gebiete.pdf [In German; verified 19 May 2011].
[25] C. R. Powley, S. W. George, T. W. Ryan, R. C. Buck, Matrix effect-free analytical methods for determination of perfluorinated carboxylic acids in environmental matrixes. Anal. Chem. 2005, 77, 6353.
| Matrix effect-free analytical methods for determination of perfluorinated carboxylic acids in environmental matrixes.Crossref | GoogleScholarGoogle Scholar | 1:CAS:528:DC%2BD2MXps1erurk%3D&md5=a834e44fc7884ac680c45d2e65f0962aCAS |
[26] C. P. Higgins, J. A. Field, C. S. Criddle, R. G. Luthy, Quantitative determination of perfluorochemicals in sediments and domestic sludge. Environ. Sci. Technol. 2005, 39, 3946.
| Quantitative determination of perfluorochemicals in sediments and domestic sludge.Crossref | GoogleScholarGoogle Scholar | 1:CAS:528:DC%2BD2MXjsleksL4%3D&md5=1c2455782a49201987e4ed446b8352efCAS |
[27] J. Rubarth, A. Dreyer, J. W. Einax, R. Ebinghaus, Different quantification methods to calculate PFC concentrations in biota samples, poster presentation at SETAC Europe 21st Annual Meeting, Milan, Italy, 15–19 May 2011.
[28] J. W. Washington, J. J. Ellington, T. M. Jenkins, J. J. Evans, Analysis of perfluorinated carboxylic acids in soils: Detection and quantitation issues at low concentrations. J. Chromatogr. A 2007, 1154, 111.
| Analysis of perfluorinated carboxylic acids in soils: Detection and quantitation issues at low concentrations.Crossref | GoogleScholarGoogle Scholar | 1:CAS:528:DC%2BD2sXmtFOjur8%3D&md5=ed0cc595114a07ba1e0de1dc378d272fCAS |
[29] DIN32633 Verfahren der Standardaddition 1998 (Beuth Verlag: Berlin).
[30] G. T. Tomy, S. A. Tittlemier, V. P. Palace, W. R. Budakowski, E. Braekevelt, L. Brinkworth, K. Friesen, Biotransformation of N-ethyl perfluorooctanesulfonamide by rainbow trout (Onchorhynchus mykiss) liver microsomes. Environ. Sci. Technol. 2004, 38, 758.
| Biotransformation of N-ethyl perfluorooctanesulfonamide by rainbow trout (Onchorhynchus mykiss) liver microsomes.Crossref | GoogleScholarGoogle Scholar | 1:CAS:528:DC%2BD3sXptl2mtLY%3D&md5=0b507429f9be7e337a4930864e2bdf14CAS |
[31] Fluorochemical Use, Distribution and Release Overview, AR 226-0550 1999 (3M Company). Available at http://www.chemicalindustryarchives.org/dirtysecrets/scotchgard/pdfs/226-0550.pdf [Verified 19 May 2011].
[32] C. R. Powley, S. W. George, M. H. Russell, R. A. Hoke, R. C. Buck, Polyfluorinated chemicals in a spatially and temporally integrated food web in the Western Arctic. Chemosphere 2008, 70, 664.
| Polyfluorinated chemicals in a spatially and temporally integrated food web in the Western Arctic.Crossref | GoogleScholarGoogle Scholar | 1:CAS:528:DC%2BD2sXhtlGgtbvK&md5=9b23593597e7e4f4dbdea7fffe7f934aCAS |
[33] J. P. Vanden Heuvel, B. I. Kuslikis, M. J. Van Rafelghem, R. E. Peterson, Disposition of perfluorodecanoic acid in male and female rats. Toxicol. Appl. Pharmacol. 1991, 107, 450.
| Disposition of perfluorodecanoic acid in male and female rats.Crossref | GoogleScholarGoogle Scholar | 1:CAS:528:DyaK3MXhsFyktLg%3D&md5=f2fdcdb7ea9e97b7b9226c09e392fd60CAS |
[34] R. Sturm, L. Ahrens, Trends of polyfluoroalkyl compounds in marine biota and in humans. Environ. Chem. 2010, 7, 457.
| Trends of polyfluoroalkyl compounds in marine biota and in humans.Crossref | GoogleScholarGoogle Scholar | 1:CAS:528:DC%2BC3MXhtFGkug%3D%3D&md5=38c58d0ffc0700e8b02daa8df0f967c7CAS |
[35] Development and Validation of a Method for the Determination of Polyfluorinated Organic Substances in Sea Water, Sediments and Biota – Occurrence of these Compounds in the North and Baltic Seas, UBA-FB: 001049 2007 (Federal Environment Agency). Available at http://www.umweltdaten.de/publikationen/fpdf-l/3319.pdf [In German; verified 19 May 2011].
[36] C. J. McMurdo, D. A. Ellis, E. Webster, J. Butler, R. D. Christensen, L. K. Reid, Aerosol enrichment of the surfactant PFO and mediation of the water-air transport of gaseous PFOA. Environ. Sci. Technol. 2008, 42, 3969.
| Aerosol enrichment of the surfactant PFO and mediation of the water-air transport of gaseous PFOA.Crossref | GoogleScholarGoogle Scholar | 1:CAS:528:DC%2BD1cXkvFKhsrg%3D&md5=5662bb6cfadb5d342ee5401a03e8351dCAS |
[37] B. T. Mader, Comment on ‘Aerosol enrichment of the surfactant PFO and mediation of the water-air transport of gaseous PFOA’. Environ. Sci. Technol. 2009, 43, 1232.
| Comment on ‘Aerosol enrichment of the surfactant PFO and mediation of the water-air transport of gaseous PFOA’.Crossref | GoogleScholarGoogle Scholar | 1:CAS:528:DC%2BD1MXotlGnsQ%3D%3D&md5=5df3c72e6c95c9b4834acdea17bc7eadCAS |
[38] D. A. Ellis, E. Webster, Response to comment on ‘Aerosol enrichment of the surfactant PFO and mediation of the water-air transport of gaseous PFOA’. Environ. Sci. Technol. 2009, 43, 1234.
| Response to comment on ‘Aerosol enrichment of the surfactant PFO and mediation of the water-air transport of gaseous PFOA’.Crossref | GoogleScholarGoogle Scholar | 1:CAS:528:DC%2BD1MXotlOgsw%3D%3D&md5=35fe8f9e3b88daff0a47146ef5f76a4aCAS |
[39] M. Ragaller, J. Bleyl, U. Tschö, T. Winkler, M. Regner, S. Rasche, T. Koch, M. Albrecht, Effects of inhalation of perfluorocarbon aerosol on oxygenation and pulmonary function compared to PGI2 inhalation in a sheep model of oleic acid-induced lung injury. Intensive Care Med. 2001, 27, 889.
| Effects of inhalation of perfluorocarbon aerosol on oxygenation and pulmonary function compared to PGI2 inhalation in a sheep model of oleic acid-induced lung injury.Crossref | GoogleScholarGoogle Scholar | 1:STN:280:DC%2BD38%2Fhs1alsg%3D%3D&md5=8e3ff2392ca00a538644680e85280c66CAS |
[40] J. W. Martin, M. M. Smithwick, B. M. Braune, P. F. Hoekstra, D. C. G. Muir, S. A. Mabury, Identification of long-chained perfluorinated acids in biota from the Canadian Arctic. Environ. Sci. Technol. 2004, 38, 373.
| Identification of long-chained perfluorinated acids in biota from the Canadian Arctic.Crossref | GoogleScholarGoogle Scholar | 1:CAS:528:DC%2BD3sXptlOgsr8%3D&md5=31028bc5f8598e0cc849bbfcf6060ae4CAS |
[41] J. Falandysz, S. Taniyasu, A. Gulkowska, N. Yamashita, U. Schulte-Oehlmann, Is fish a major source of fluorinated surfactants and repellents in humans living on the Baltic Coast? Environ. Sci. Technol. 2006, 40, 748.
| Is fish a major source of fluorinated surfactants and repellents in humans living on the Baltic Coast?Crossref | GoogleScholarGoogle Scholar | 1:CAS:528:DC%2BD28XlsFei&md5=7716280f053e330200ddcae4377152bcCAS |
[42] C. J. Young, S. A. Mabury, Atmospheric perfluorinated acid precursors: chemistry, occurrence, and impacts. Rev. Environ. Contam. Toxicol. 2010, 208, 1.
| Atmospheric perfluorinated acid precursors: chemistry, occurrence, and impacts.Crossref | GoogleScholarGoogle Scholar | 1:CAS:528:DC%2BC3cXhtlWjt77K&md5=ebd2280f50b24264cf9d81990aff89e7CAS |
[43] J. Tolls, D. T. H. M. Sijm, A preliminary evaluation of the relationship between bioconcentration and hydrophobicity for surfactants. Environ. Toxicol. Chem. 1995, 14, 1675.
| A preliminary evaluation of the relationship between bioconcentration and hydrophobicity for surfactants.Crossref | GoogleScholarGoogle Scholar | 1:CAS:528:DyaK2MXot1Ortb8%3D&md5=f3c8b6dd06db9d02ab1f6aa7a65fd5adCAS |
[44] J. W. Martin, S. A. Mabury, K. R. Solomon, D. C. G. Muir, Dietary accumulation of perfluorinated acids in juvenile rainbow trout (Oncorhynchus mykiss). Environ. Toxicol. Chem. 2003, 22, 189.
| 1:CAS:528:DC%2BD38XpslCmtrY%3D&md5=a22cd1d95ddada10091f9b500a6298caCAS |
[45] M. E. Austin, B. S. Kasturi, M. Barber, K. Kannan, P. S. MohanKumar, S. M. J. MohanKumar, Neuroendocrine effects of perfluorooctane sulfonate in rats. Environ. Health Perspect. 2003, 111, 1485.
| Neuroendocrine effects of perfluorooctane sulfonate in rats.Crossref | GoogleScholarGoogle Scholar | 1:CAS:528:DC%2BD3sXnvFOhtrc%3D&md5=37f3a93556ce194f679691a801de89d1CAS |
[46] H. Fromme, E. Roscher, D. Twardella, Environmental health relevance of perfluorinated substances. Umweltmedizin in Forschung und Praxis 2008, 13, 97.
| 1:CAS:528:DC%2BD1cXmtleis74%3D&md5=d69070365f183b90e12c467cc2d1d27aCAS |
[47] H. Lüllmann, K. Mohr, L. Hein, Taschenatlas Pharmakologie 2008 (Georg Thieme Verlag KG: Stuttgart).
[48] W. Meissner, A classification scheme for scoring subcutaneous fat depots of shorebirds. J. Field Ornithol. 2009, 80, 289.
| A classification scheme for scoring subcutaneous fat depots of shorebirds.Crossref | GoogleScholarGoogle Scholar |
[49] J. Meyer, V. B. Jaspers, M. Eens, W. de Coen, The relationship between perfluorinated chemicals levels in the feathers and livers of birds from different trophic levels. Sci. Total Environ. 2009, 407, 5894.
| The relationship between perfluorinated chemicals levels in the feathers and livers of birds from different trophic levels.Crossref | GoogleScholarGoogle Scholar | 1:CAS:528:DC%2BD1MXhtFCqu77L&md5=604fdc0bc2f964ab4bc248b1c96e2bb1CAS |