

Water-to-air transfer of perfluorinated carboxylates and sulfonates in a sea spray simulator
Margot Reth A , Urs Berger A , Dag Broman A , Ian T. Cousins A , E. Douglas Nilsson A and Michael S. McLachlan A BA Department of Applied Environmental Science (ITM), Stockholm University, SE-106 91 Stockholm, Sweden.
B Corresonding author. Email: michael.mclachlan@itm.su.se
Environmental Chemistry 8(4) 381-388 https://doi.org/10.1071/EN11007
Submitted: 13 January 2011 Accepted: 27 June 2011 Published: 19 August 2011
Journal Compilation © CSIRO Publishing 2011 Open Access CC BY-NC-ND
Environmental context. Perfluorinated alkyl acids are found in the remotest parts of the world, but it is still not known how they get there. By using a laboratory sea spray simulator, it is shown that these compounds are efficiently transferred from water to air. This indicates that perfluorinated alkyl acids could be transported long distances as a result of breaking waves ejecting them into the atmosphere.
Abstract. One hypothesis for the origin of perfluorinated alkyl acids, their salts and conjugate bases (here collectively termed PFAAs) in the atmosphere is transfer from the surface ocean by sea spray, the mechanistic explanation being that the surface active properties of PFAAs result in their enrichment on the surface of bursting bubbles. The water-to-air transfer of C6–C14 perfluorocarboxylates (PFCAs) and C6, C8 and C10 perfluorosulfonates (PFSAs) was studied in a laboratory scale sea spray simulator containing tap water spiked with PFCAs and PFSAs. The sequestration of the PFAAs out of bulk water and to the air–water surface was shown to increase exponentially with the length of the perfluorinated alkyl chain. Volatilisation of the PFAAs from an aqueous solution in the absence of spray resulted in less than 1 % transfer to the atmosphere during the experiment. In the presence of spray the transfer rate from water to air increased by up to 1360 times. The enhancement was dependent on the PFAA chain length, with the C6 carboxylate showing an enhancement of a factor of 37, the C7 carboxylate an enhancement of 320, whereas for all remaining PFAAs the enhancement exceeded 450 with the exception of the C14 carboxylate (106).
Introduction
Perfluorinated alkyl acids and their salts (PFAAs) have been produced in large quantities worldwide and used in a wide range of commercial applications.[1] The long-chain perfluorinated carboxylic acids (PFCAs) (and their conjugate bases) and perfluorinated sulfonates (PFSAs) have especially been the focus of research. Longer-chain PFCAs and perfluorooctane sulfonate have been detected in Arctic biota (see e.g. review by Houde et al.[2]), which has instigated a debate over how they were transported to remote areas. One hypothesis suggests that PFAAs were released from manufacturing sources to air or water and then transported directly over long distances by air or water currents (the ‘direct hypothesis’).[3–6] An alternative hypothesis is that volatile precursor compounds such as fluorotelomer alcohols and the perfluoroalkyl sulfonamido alcohols were transported by the atmosphere, subsequently reacted to form PFAAs and ultimately deposited in the Arctic (the ‘indirect hypothesis’).[7–9] The relative importance of the ‘direct’ and ‘indirect’ hypotheses for PFCA and PFSA long-range transport remains contested. In this study we investigate another potentially important long-range atmospheric transport mechanism for PFAAs, namely transport in association with marine aerosols generated from sea spray.
Ejection of particles into the atmosphere from bubbles bursting on the ocean surface is a well known aerosol source (see e.g. review by O’Dowd and de Leeuw[10]). Wind-drag on the ocean surface causes waves to break, entraining air into the water. The air forms bubbles which rise to the surface, collecting en-route available dissolved organic molecules and biological material. The traditional conceptual model for the wind driven source of aerosol particles includes mainly two types of droplets; film droplets from the bursting bubble film, and the larger, although less numerous, jet droplets arising from the vertically rising jet of water formed from the collapsing bubble cavity. The resulting sea spray aerosol has been shown to be composed of inorganic and organic matter, and the organic matter has been shown to comprise organic compounds of both biogenic and anthropogenic origin.[11–15] The high organic matter content of sea spray aerosols arises because the bubble film from which they are formed is effective at scavenging surface active organic compounds.[14,16,17] Surface active organic compounds are therefore expected to be especially susceptible to transfer to the atmosphere by sea spray aerosol.
PFCAs and PFSAs, which are strong surfactants, are known to be enriched at the air–water interface[18] and have been shown to be enriched in the sea surface microlayer.[19] Furthermore, laboratory experiments with artificial bubble generators have shown efficient water–air transfer of linear alkylbenzene sulfonates (LAS)[20] and perfluorooctanoic acid (PFOA).[21] It has been hypothesised[3,21,22] that PFAAs in the oceans[23] can be ejected on sea spray aerosols and transported long distances in the atmosphere, but experimental evidence to support this hypothesis is limited to one previous study,[21] which used an artificial bubble generator to study transfer of PFOA.
A first indication of the potential of PFAAs to be long range transported as part of the sea spray aerosol can be obtained from current knowledge of the major sea spray components and their transport. Sea spray (sea salt aerosols) is mixed vertically in high concentrations within the atmospheric boundary layer[24] and in lower concentrations within the free troposphere. Horizontally the transport occurs on the regional scale,[25] although accumulation mode particles that reach the free troposphere could be transported further. Sea spray contributes to aerosol deposition hundreds of kilometres inland.[26] Sea salt is found in Arctic and Antarctic ice cores far from the sea and is used as an ocean tracer when interpreting past climate.[27] If an anthropogenic substance is enriched and transported in sea spray, there is no reason why it should not be transported to the same extent as sea salt.
In this work we provide further experimental evidence to test the hypothesis that sea spray transport is an important mechanism for the long-range transport of PFAAs. A sea spray aerosol generation apparatus was employed to study how effectively a range of PFCA (C6–C12, C14) and PFSA (C6, C8 and C10) homologues are transferred from water to air. An important feature of this work is that the experimental apparatus simulates the aerosol formation process and has been optimised to generate a realistic bubble spectrum similar to that in breaking waves and whitecaps[28] and an aerosol size spectrum characteristic of natural sea spray.[12,29,30] A filtration system was included in the apparatus for the collection of aerosol associated PFAAs generated as a result of bubble bursting. The measured concentrations in the aerosols and in the bulk water enable an estimation of the water-to-air transfer rates of the PFSAs and PFCAs. In this paper we test the suitability of the apparatus for studying the behaviour of PFAAs, assess whether bubbles do result in an increased water-to-air transfer of PFAAs and explore the influence of the PFAAs’ chain length on the transfer effectiveness.
Experimental section
Description of the sea spray aerosol simulator
A sea spray simulator was developed to investigate the transfer of PFAAs. A schematic drawing is shown in Fig. 1. The aerosol generation apparatus consisted of a stainless steel tank (height, 80 cm; radius, 27.25 cm) which was partly filled with water, first described in Hultin et al.[29] There were three ports (internal diameter, 3.3 cm) on the side of the tank at a height of 8.5 cm and three ports in the lid (internal diameter, 2.1, 2.1 and 3.3 cm). Two of the ports on the side of the tank allow the simulator to be operated as an open system with continuous water flow-through (Fig. 1a), but for these experiments the simulator was operated as a closed system (Fig. 1b). For the aerosol generation, water was pumped (Eheim, Germany, water flow rate: 3400 L h–1) from one port through a silicon tube to the middle port in the lid (internal diameter, 3.3 cm), creating a water jet which impinged on the water surface below, forming the aerosols. The other two ports in the lid were used for the inflow and outflow of air. The inflowing air was cleaned by passing it though two polyurethane foam plugs (PUF, diameter, 20 mm; length, 40 mm) and a precombusted borosilicate filter (GF/F; diameter, 293 mm; nominal pore size, 0.7 µm; Whatman International Ltd, England). A 142-mm filter holder (Millipore Corporation, USA) was mounted on the outflowing air port. PFAAs associated with aerosols in the outflowing air were collected on a precombusted borosilicate filter (GF/F; 142 mm; nominal pore size, 0.7 µm; Whatman International Ltd, England). After this filter the air flowed through two polyurethane foam plugs (PUF; diameter, 20 mm; length, 40 mm). The PUF cartridges were connected by a Armovin HNA tube to a high volume air pump followed by a Gallus 2000 G4 gas meter (Flonidan, Denmark) to regulate the flow rate to between 140 and 150 L min–1.
|
Prior to use, all filters (GF/F; 142 and 293 mm) were combusted at 450 °C for 6 h, whereas the PUFs were washed with water at 90 °C (1 h), dried at 50 °C (24 h), Soxhlet extracted in toluene (24 h, Scharlau, Spain) and in acetone (24 h, Merck, Germany) and finally dried under vacuum in a desiccator. The prepared PUFs and precombusted filters were placed in double layered, precombusted aluminium foil envelopes, which were in turn placed in plastic bags and stored in a freezer (–18 °C) until sampling. The collected samples were placed in the same precombusted aluminium foil envelopes and stored in sealed double plastic bags in a freezer (–18 °C) until analysis.
Characterisation of aerosols generated by the sea spray simulator
The sea spray simulator used in this paper had been optimised in previous work so that it generates realistic bubble spectra comparable to those in ocean white caps and aerosol size spectra (0.01–10 µm) characteristic of natural sea spray.[12,28] In the Accessory publication a figure is included showing the median aerosol volume (which will be proportional to mass) size distribution generated from seawater continuously flowing through the aerosol generation apparatus (set up as in Fig. 1a). Based on this experience the size distribution has a maximum in number at 80–300 nm with a rapidly decreasing number count towards super-micrometre sized particles. This is highly comparable to several recent laboratory bubble-bursting experiments using both natural[12,15,28–31] and artificially made surfactant rich seawater.[30,32] It should be noted that tap water, rather than seawater, was used in the experiments to measure the water–air transfer of PFAAs presented in this paper. An advantage of using tap water was that it minimised matrix effects during analysis, contributing to higher analytical precision and accuracy. A disadvantage is that fresh water is known to produce fewer and larger bubbles which generate a different aerosol spectrum than seawater.[33,34]
First experiment: spray simulation
The sea spray simulator was filled with 88 L of tap water. The water cycle was activated for 5 min. A water sample was taken from the lower part of the tank using a 1-L polypropylene (PP) bottle to determine the PFAA concentration in the water before the experiment. A volume of 178 µL of a PFAA mixture (containing 5 ng µL–1 of each PFAA; 890 ng in total) was spiked on top of the water. The apparatus was closed and the water was cycled again for 5 min to allow thorough mixing. The water cycle was switched off again and a second water sample was taken from the side port to assess the bulk water concentration in the tank. The air above the water surface was sampled for 16 h using an air flow of 147 L min–1. The filter was then replaced and a third water sample was taken. Afterwards, the bubble generation was started by activating the water cycle. The air above the water and the generated aerosols were sampled for 16 h (air flow of 144 L min–1). The water cycle was then shut off and a last water sample was taken to determine the amount of PFAAs that remained in the water after 16 h of bubble generation. The volume of water in the tank was determined after 16 h without and with bubble formation by measuring the water level.
Second experiment: PFAA distribution in water
The aerosol generator was filled with 88 L of tap water. A volume of 178 µL of a PFAA mixture (containing 5 ng µL–1 of each PFAA) was spiked on top of the water. The apparatus was closed and the water was cycled for 5 min to allow thorough mixing, after which the pump was switched off again. After 24 h the water surface was sampled by carefully laying a round glass plate of 10-cm diameter on the surface. Water that adhered to the glass plate was sampled drop by drop into two 50-mL PP tubes. Afterwards a bulk water sample was taken from a side port using a 1-L PP bottle. The two water samples were analysed as described below.
Analytical methods
Details of the analytical methods, including the definitions of the abbreviations for the PFCA and PFSA homologues, are provided in the Accessory publication. Briefly, the filters and the PUF disks were extracted in methanol and analysed using high-performance liquid chromatography combined with electrospray tandem mass spectrometry (HPLC/ESI-MS/MS) in the negative ion mode, whereas the water samples were directly analysed by HPLC/ESI-MS/MS after large volume injection and on-line pre-concentration on a trapping column using column switching.[35] The labelled PFAAs that were available at the time of the study (13C4–PFOA, 13C2–PFDA and 18O2–PFOS) were used as internal standards.
Results and discussion
Recovery of the initial addition of PFAAs to water
In the first stage of the experiment, the recoveries of the PFAAs that were spiked into the sea spray simulator were assessed (see Table 1). The initial concentrations before spiking were considerable. Among the PFCAs, the highest concentration was 9 ng L–1 for PFHxA, and the concentrations decreased with increasing chain length. For the PFSAs, concentrations of 1.2 and 2.3 ng L–1 were measured for PFHxS and PFOS respectively. This suggests that there was considerable PFAA contamination of the tap water or the apparatus.
|
Following the spiking of the PFAA solution into the sea spray simulator, the water was circulated by the water jet for 5 min without air through-flow. The recovery of the PFCAs in the water, expressed as the quotient of the final water concentration and the expected concentration (i.e. initial + spiked), was 101 % for PFHxA, but decreased with increasing chain length to <15 % for PFDoA and PFTeDA. A similar behaviour was observed for the PFSAs. One explanation for the poor recovery could be extensive losses of the PFAAs to surfaces in the apparatus. However, the high recovery of the long chain PFAAs in the aerosol fraction during the subsequent spray simulation in the same experiment (see below), indicated that these losses, if present, were only temporary. Instead, the explanation for the poor recovery was enrichment of the long-chained PFAAs at the air–water interface, as described in the following.
Distribution of PFAAs in the apparatus
At this point it is instructive to examine the results of the second experiment, which was conducted to elucidate the reasons for the poor recovery described above. To further explore the distribution of the PFAAs in the apparatus, tap water was added to the sea spray simulator, spiked with PFAAs and allowed to stand for 24 h before water samples were taken from the bulk water and from the surface. In this case, the PFHxA and PFHpA concentrations in the bulk water did not exceed the expected concentration of 10 ng L–1 (see Table 2), which suggests that the contamination of tapwater observed in the first experiment was less significant. Stockholm’s drinking water comes from different surface water sources, and thus variability in its contamination is conceivable. However, the concentrations of the longer chain PFAAs were again <20 % of the expected concentrations, which indicates that the poor recovery of these compounds was repeatable.

|
The PFAA concentrations measured in the surface layer were in all cases greater than the concentrations measured in the bulk water (Table 2). For PFHxA, PFHpA, PFOA and PFHxS, the enrichment factor (EF, quotient of the surface layer and bulk water concentrations) was <2, but for the remaining PFAAs it increased with increasing chain length, exceeding 200 for PFDS. The measured EFs for PFOA and PFOS agree reasonably well with those measured in open seawater by Ju et al.[19] using a similar ‘glass plate dipping’ method. EFs from the Ju et al. study[19] were 1.2–8 for PFOA and 2–109 for PFOS.
The concentration of a chemical in a surface water sample can be approximated as the sum of the concentration of chemical that is freely dissolved in the sample and the concentration of the chemical contributed by partitioning to the surface that was sampled:

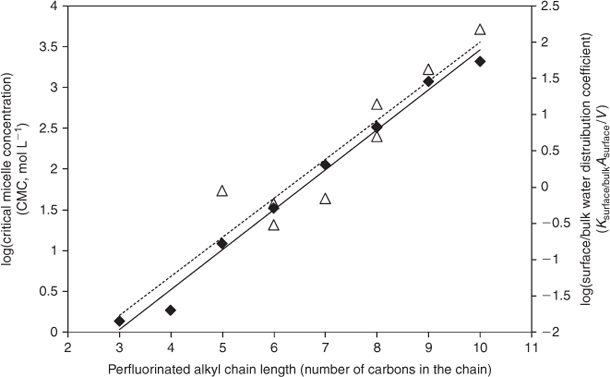
where Csurface is the concentration in the surface water sample (mol m–3), Cbulk is the concentration in the bulk water (mol m–3), Ksurface/bulk is the surface/bulk water partition coefficient (m3 m–2), Asurface is the surface area of the water that was sampled (m2) and V is the volume of the water sample (m3). From Eqn 1 it is clear that the concentration in the surface water sample depends on the surface area-to-volume ratio of the sample. Since this is unknown, Ksurface/bulk cannot be determined from the data. However, since Asurface/V is the same for all analytes, the relative values of Ksurface/bulk can be assessed by calculating:
In Fig. 2 log Ksurface/bulkAsurface/V is plotted versus the length of the perfluorinated alkyl chain. A log-linear relationship is seen, with Ksurface/bulkAsurface/V increasing approximately a half log unit with the addition of one carbon to the perfluorinated alkyl chain. The deviation of the PFHxA from the log-linear relationship can be explained by the high error in estimating Ksurface/bulkAsurface/V (i.e. Csurface and Cbulk were similar).
|
The critical micelle concentration (CMC), the maximum concentration at which surfactants remain freely dissolved in water (i.e. without forming micelles), is used as a physical-chemical indicator of the hydrophobicity of surfactants and thus their tendency to partition out of the bulk phase to accumulate at the air–water interface, sorb to solids or bioconcentrate.[36] The negative log CMC (obtained from the literature) is also plotted in Fig. 2. It shows a log-linear relationship with the length of perfluorinated alkyl chain that is very similar to Ksurface/bulkAsurface/V. Hence the observed distribution behaviour is consistent with the physical-chemical properties of the PFAAs. Together these experiments suggest that the majority of the longer chain PFAAs partition out of the bulk water phase to the air–water interface. This explains the low recovery of the long-chain PFAAs in Table 1 and could be expected to increase their susceptibility to transfer out of the water by sea spray.
Water-to-air transfer in the absence of spray
The insight gained into the distribution of the PFAAs in the apparatus and the explanation for the apparent poor recovery of the spiked analytes are important prerequisites for interpreting the results of the remainder of the first experiment. In the next stage of this experiment, the water-to-air transfer of PFAAs without aerosol formation was explored. The sea spray simulator, filled with the spiked tap water, was operated with air flow but without aerosol generation. The PFCAs and PFSAs in the outflowing air were collected for 16 h on a glass fibre filter and a PUF plug arranged in series. The PFAA quantities on the PUF plug were below the limit of detection (<150 pg). Table 3 shows the mass balance for this experiment, using the initial quantity in the tap water plus the spiked quantity (see Table 1) as the estimate of the initial chemical mass in the system. For all of the PFAAs, less than 1 % of the mass initially present in the system was transferred to the air. This indicates that PFAAs volatilise slowly from water. This observation is in accordance with strong dissociation in water for the PFCAs under the experimental conditions. Tap water with only a few nanograms per litre of spiked PFCAs is above neutral pH, which, given even the highest reported pKa of PFCAs of 3.8,[37] means that PFCAs would be >99 % dissociated. Volatilisation of PFOA has been shown to decrease with increasing pH.[38]

|
Despite the negligible removal of PFAAs from the system with the air, the concentrations of all PFAAs in the bulk water decreased during this stage of the experiment. The decrease ranged from 4 to 27 %; there was no relationship with chain length. This suggests that there was further sequestration out of the bulk water phase during this part of the experiment. It is possible that an equilibrium distribution of the PFAAs between the bulk water and the air–water interface (and other potential sorption sites in the system) had not been established during the five minutes of mixing and the brief interval before the initial water sample was taken for this experiment.
Water-to-air transfer in the presence of spray
In the final stage of the first experiment the water-to-air transfer of PFAAs with aerosol formation was measured. The sea spray simulator was operated as in the previous test, but this time with aerosol generation. Table 4 shows the mass balance, using the initial quantity in the water plus the spiked quantity less the quantity on the filter from the previous stage (see Table 3) as the estimate of the initial chemical mass in the system.

|
The fraction of the initial quantity in the system that was transferred to the filter ranged from 0.9 to 67 %. The PFAA quantities on the PUFs were close to the limit of detection and at least 100 times less than the quantities on the filter. The mass transferred to the filter was 37 to 1360 times greater when spray was being generated compared with when it was not. This shows that spray is potentially an important mechanism for the water-to-air transfer of PFAAs.
A clear dependency on chain length was observed, with the fraction transferred increasing with chain length. This is consistent with the observation of increasing enrichment at the air–water interface with increasing chain length (see above). This supports the underlying hypothesis of this work, namely that strong surface active chemicals will be particularly amenable to transport from water with sea spray.
The loss of water during the spray experiment was 2.1 L, compared with 0.7 L during the volatilisation experiment without spray. This indicates that up to 1.4 L of water left the test system in liquid aerosol form during the spray experiment. This amounts to 1.6 % of the water in the test system. The fact that the fraction of PFHxA transferred out of the system was less than this amount (0.9 %) suggests that there was little or no enhanced transfer of this chemical because of its surface active properties. However, for all other compounds the fraction of chemical transferred greatly exceeded the fraction of liquid water transferred, indicating that their transfer was enhanced and that they were enriched in the aerosol phase.
In contrast to the observations on enrichment at the air–water interface, which showed an exponential increase in the enrichment factor with chain length, the fraction transferred to the filter increased only slightly for PFCAs longer than PFNA and between PFOS and PFDS. It could be hypothesised that this is a consequence of the reservoir of these PFAAs available for transfer having been exhausted. However, this hypothesis is not supported by the observed concentrations in water. For those compounds for which the water concentrations could be reliably measured, the percentage decrease in the water concentration during this stage of the experiment corresponded quite well with the percentage transfer to the filter (see Table 4). At least one-third of the initial amount of each PFAA was still present in the water at the end of the experiment. Further study is needed to elucidate why the transfer of the longer chain PFAAs is similar despite the large differences in their enrichment at the air–water interface. One possible explanation is that the transfer of these surfactants to the aerosol phase is not determined by the enrichment at the air–water interface but by the enrichment at the internal air–water interface inside the rising bubbles. The water in the tank is agitated by the artificial water jet that creates the bubbles. Perhaps the longer chain PFAAs are less efficiently transported down into the bulk water, and hence a comparatively smaller fraction is collected on the internal air–water interfaces of the rising bubbles.
McMurdo and coworkers[21] report that PFOA rapidly partitioned out of sea spray aerosols into the gas phase (t1/2 = 7.2 s) following ejection of the aerosol. In this experiment the residence time of the air in the apparatus was ~30 s, which should have provided ample time for the PFOA to partition to the gas phase. However, all of the PFOA that was lost from the bulk water was recovered on the filter (see Table 4), which could suggest that the PFOA was largely associated with the aerosols. An alternative explanation is that the gaseous PFOA was captured on the filter. Arp and Goss[39] have observed that PFOA can irreversibly sorb to glass fibre filters. During the spray experiment, 258 ng of PFOA was lost from the bulk water, whereas 318 ng of PFOA was recovered on the filter. This mass balance indicates that irreversible sorption to the filter was not a significant problem in our experiment. An elucidation of the gas–particle partitioning was beyond the scope of this study.
Finally, the percentage transfer of the longer chain PFAAs from the system to the filter ranged between 48 and 67 %. This indicates that the very low concentrations of the longer chain PFAAs in the bulk water following spiking of the PFAAs were not a result of losses or irreversible binding in the experimental system. We suggest that the surface active properties of these chemicals are so strong that they will largely partition out of bulk water phases to interfaces in the environment. This implies that different concepts will be needed to understand their environmental fate and bioaccumulation than those applied to other persistent organic contaminants.
This work shows that spray can effectively transfer PFAAs from water to air, and that the transfer efficiency increases with increasing chain length of the molecule. It is conceivable that this process could contribute to the environmental fate and transport of PFAAs, particularly the longer chain chemicals. However, a semiquantitative assessment would be premature. Further research must be conducted to explore the effects of other sea water constituents (e.g. salt, other surfactants) on the transfer efficiency. In addition, efforts should be made to measure this phenomenon in the natural environment to confirm the relevance of the sea spray simulator experiments. If the PFAA emissions can be related to, e.g. sea salt sea spray emissions, this would offer a reliable way to introduce PFAA emissions in global scale atmospheric transport models.
Accessory publication
Includes details of analytical methods, a figure showing median aerosol volume size distribution generated using the sea spray simulator and a table containing literature values for CMCs (see http://www.publish.csiro.au/?act=view_file&file_id=EN11007_AC.pdf).
Acknowledgements
The authors thank the many colleagues who helped to develop, build and run the sea spray simulator, especially Martin Kruså, Costas Prevedouros, Kim Hultin and Zdenek Zencak. Furthermore, they thank the Swiss National Science Foundation (PBBS2–112785) and the Novartis Foundation, formerly the Ciba-Geigy Jubilee Foundation, for funding Margot Reth and the Swedish Research Council for Environment, Agricultural Sciences and Spatial Planning (FORMAS), contract 2004-2047, for providing funding for building and optimising the aerosol generation apparatus.
References
[1] E. Kissa, Fluorinated Surfactants and Repellents, 2nd edn 2001 (Markel Dekker: New York).[2] M. Houde, J. W. Martin, R. J. Letcher, K. R. Solomon, D. C. G. Muir, Biological monitoring of polyfluoroalkyl substances: a review. Environ. Sci. Technol. 2006, 40, 3463.
| Biological monitoring of polyfluoroalkyl substances: a review.Crossref | GoogleScholarGoogle Scholar | 1:CAS:528:DC%2BD28XktVers7w%3D&md5=f4882d1064a287c19c118a9ecfaadc61CAS |
[3] K. Prevedouros, I. T. Cousins, R. C. Buck, S. H. Korzeniowski, Sources, fate and transport of perfluorocarboxylates. Environ. Sci. Technol. 2006, 40, 32.
| Sources, fate and transport of perfluorocarboxylates.Crossref | GoogleScholarGoogle Scholar | 1:CAS:528:DC%2BD2MXht1Gru7zK&md5=14e91a9069cf17a00b47907f105e54b6CAS |
[4] J. Armitage, I. T. Cousins, R. C. Buck, K. Prevedouros, M. H. Russell, M. MacLeod, S. H. Korzeniowski, Modeling global-scale fate and transport of perfluorooctanoate emitted from direct sources. Environ. Sci. Technol. 2006, 40, 6969.
| Modeling global-scale fate and transport of perfluorooctanoate emitted from direct sources.Crossref | GoogleScholarGoogle Scholar | 1:CAS:528:DC%2BD28XhtV2qs7%2FK&md5=69fbd98978a84fd224bc61a80d2900d9CAS |
[5] J. M. Armitage, M. Macleod, I. T. Cousins, Modeling the global fate and transport of perfluorooctanoic acid (PFOA) and perfluorooctanoate (PFO) emitted from direct sources using a multispecies mass balance model. Environ. Sci. Technol. 2009, 43, 1134.
| Modeling the global fate and transport of perfluorooctanoic acid (PFOA) and perfluorooctanoate (PFO) emitted from direct sources using a multispecies mass balance model.Crossref | GoogleScholarGoogle Scholar | 1:CAS:528:DC%2BD1MXotlKmtw%3D%3D&md5=4c35bed062ff033d576453394497278dCAS |
[6] J. M. Armitage, M. MacLeod, I. T. Cousins, Comparative assessment of the global fate and transport pathways of long-chain perfluorocarboxylic acids (PFCAs) and perfluorocarboxylates (PFCs) emitted from direct sources. Environ. Sci. Technol. 2009, 43, 5830.
| Comparative assessment of the global fate and transport pathways of long-chain perfluorocarboxylic acids (PFCAs) and perfluorocarboxylates (PFCs) emitted from direct sources.Crossref | GoogleScholarGoogle Scholar | 1:CAS:528:DC%2BD1MXnsVWhtL0%3D&md5=342e6bd7e649d0dae53831fb3de37fdbCAS |
[7] D. A. Ellis, J. W. Martin, S. A. Mabury, M. D. Hurley, M. P. S. Andersen, T. J. Wallington, Atmospheric lifetime of fluorotelomer alcohols. Environ. Sci. Technol. 2003, 37, 3816.
| Atmospheric lifetime of fluorotelomer alcohols.Crossref | GoogleScholarGoogle Scholar | 1:CAS:528:DC%2BD3sXltlaqt7o%3D&md5=c330276a37dfc8dfb5b8b307b41c2bdfCAS |
[8] D. A. Ellis, J. W. Martin, A. O. De Silva, S. A. Mabury, M. D. Hurley, M. P. S. Andersen, T. J. Wallington, Degradation of fluorotelomer alcohols: a likely atmospheric source of perfluorinated carboxylic acids. Environ. Sci. Technol. 2004, 38, 3316.
| Degradation of fluorotelomer alcohols: a likely atmospheric source of perfluorinated carboxylic acids.Crossref | GoogleScholarGoogle Scholar | 1:CAS:528:DC%2BD2cXjvVShsb0%3D&md5=1a2a8158f069618f177c7efa759abbccCAS |
[9] T. J. Wallington, M. D. Hurley, J. Xia, D. J. Wuebbles, S. Sillman, A. Ito, J. E. Penner, D. A. Ellis, J. Martin, S. A. Mabury, O. J. Nielsen, M. P. S. Andersen, Formation of C7F15COOH (PFOA) and other perfluorocarboxylic acids during the atmospheric oxidation of 8:2 fluorotelomer alcohol. Environ. Sci. Technol. 2006, 40, 924.
| Formation of C7F15COOH (PFOA) and other perfluorocarboxylic acids during the atmospheric oxidation of 8:2 fluorotelomer alcohol.Crossref | GoogleScholarGoogle Scholar | 1:CAS:528:DC%2BD2MXhtlCgsrjO&md5=09301cbe0528631906d1dea7e4414b19CAS |
[10] C. D. O’Dowd, G. de Leeuw, Marine aerosol production: a review of the current knowledge. Philos. Trans. R. Soc. A 2007, 365, 1753.
| Marine aerosol production: a review of the current knowledge.Crossref | GoogleScholarGoogle Scholar | 1:CAS:528:DC%2BD2sXot1Kks7g%3D&md5=0910f6313cfd0cb45b12eb36ee4973bbCAS |
[11] C. D. O’Dowd, B. Langmann, S. Varghese, C. Scannell, D. Ceburnius, M. C. Facchini, A combined organic-inorganic sea-spray source function. Geophys. Res. Lett. 2008, 35, L01801.
| A combined organic-inorganic sea-spray source function.Crossref | GoogleScholarGoogle Scholar |
[12] M. C. Facchini, M. Rinaldi, S. Decesari, C. Carbone, E. Finessi, M. Mircea, S. Fuzzi, D. Ceburnis, R. Flanagan, E. D. Nilsson, G. de Leeuw, M. Martino, J. Woeltjen, C. D. O’Dowd, Primary submicron marine aerosol dominated by insoluble organic colloids and aggregates. Geophys. Res. Lett. 2008, 35, L17814.
| Primary submicron marine aerosol dominated by insoluble organic colloids and aggregates.Crossref | GoogleScholarGoogle Scholar |
[13] A. M. Middlebrook, D. M. Murphy, D. S. Thomson, Observations of organic material in individual marine particles at Cape Grim during First Aerosol Characterization Experiment (ACE-1). Geophys. Res. Lett. 1998, 103, 16475.
| Observations of organic material in individual marine particles at Cape Grim during First Aerosol Characterization Experiment (ACE-1).Crossref | GoogleScholarGoogle Scholar | 1:CAS:528:DyaK1cXltFGlurc%3D&md5=6a025fec69b4a78233a59735c2d4c379CAS |
[14] C. D. O’Dowd, M. C. Facchini, F. Cavalli, D. Ceburnis, M. Mircea, S. Decesari, S. Fuzzi, Y.-J. Yoon, J.-P. Putaud, Biogenically driven organic contribution to marine aerosol. Nature 2004, 431, 676.
| Biogenically driven organic contribution to marine aerosol.Crossref | GoogleScholarGoogle Scholar | 1:CAS:528:DC%2BD2cXotFGrurk%3D&md5=f2e559cf1c894958a3247f1f9a2c317fCAS |
[15] W. C. Keene, H. Maring, J. R. Maben, D. J. Kieber, A. A. P. Pszenny, E. E. Dahl, M. A. Izaguirre, A. J. Davis, M. S. Long, X. Zhou, L. Smoydzin, R. Sander, Chemical and physical characteristics of nascent aerosols produced by bursting bubbles at a model air-sea interface. J. Geophys. Res. 2007, 112, D21202.
| Chemical and physical characteristics of nascent aerosols produced by bursting bubbles at a model air-sea interface.Crossref | GoogleScholarGoogle Scholar |
[16] R. M. Gershey, Characterization of seawater organic matter carried by bubble-generated aerosol. Limnol. Oceanogr. 1983, 28, 309.
| Characterization of seawater organic matter carried by bubble-generated aerosol.Crossref | GoogleScholarGoogle Scholar | 1:CAS:528:DyaL3sXhvVGiurw%3D&md5=205853a85268d71ed3aa44ac25d67931CAS |
[17] M. Mochida, Y. Kitamori, K. Kawamura, Y. Nojiri, K. Suzuki, Fatty acids in the marine atmosphere: factors governing their concentrations and evaluation of organic films on sea-salt particles. J. Geophys. Res. 2002, 107, 4325.
| Fatty acids in the marine atmosphere: factors governing their concentrations and evaluation of organic films on sea-salt particles.Crossref | GoogleScholarGoogle Scholar |
[18] E. Psillakis, J. Cheng, M. R. Hoffmann, A. J. Colussi, Enrichment factors of perfluoroalkyl oxoanions at the air/water interface. J. Phys. Chem. A 2009, 113, 8826.
| Enrichment factors of perfluoroalkyl oxoanions at the air/water interface.Crossref | GoogleScholarGoogle Scholar | 1:CAS:528:DC%2BD1MXmsFGmu7c%3D&md5=fe08472c40af099b10839f53b11c1ebdCAS |
[19] X. D. Ju, Y. H. Jin, K. Sasaki, N. Saito, Perfluorinated surfactants in surface, subsurface water and microlayer from Dalian Coastal waters in China. Environ. Sci. Technol. 2008, 42, 3538.
| Perfluorinated surfactants in surface, subsurface water and microlayer from Dalian Coastal waters in China.Crossref | GoogleScholarGoogle Scholar | 1:CAS:528:DC%2BD1cXksFars7s%3D&md5=214985f8d7ceb4138f9a47002f7ec480CAS |
[20] A. Marcomini, G. Pojana, A. Giacometti, C. Oppo, Aerosolization of an anionic surfactant (LAS) and dissolved organic carbon (DOC) under laboratory conditions. Chemosphere 2001, 44, 257.
| Aerosolization of an anionic surfactant (LAS) and dissolved organic carbon (DOC) under laboratory conditions.Crossref | GoogleScholarGoogle Scholar | 1:CAS:528:DC%2BD3MXktV2hs78%3D&md5=69943d196e075b28b71d1d4ce275530cCAS |
[21] C. J. McMurdo, D. A. Ellis, E. Webster, J. Butler, R. D. Christensen, L. K. Reid, Aerosol enrichment of the surfactant PFO and mediation of the water–air transport of gaseous PFOA. Environ. Sci. Technol. 2008, 42, 3969.
| Aerosol enrichment of the surfactant PFO and mediation of the water–air transport of gaseous PFOA.Crossref | GoogleScholarGoogle Scholar | 1:CAS:528:DC%2BD1cXkvFKhsrg%3D&md5=5662bb6cfadb5d342ee5401a03e8351dCAS |
[22] E. Webster, D. A. Ellis, Potential role of sea spray generation in the atmospheric transport of perfluorocarboxylic acids. Environ. Toxicol. Chem. 2010, 29, 1703.
| Potential role of sea spray generation in the atmospheric transport of perfluorocarboxylic acids.Crossref | GoogleScholarGoogle Scholar | 1:CAS:528:DC%2BC3cXhtlSju7vK&md5=2d6fbbad0de7a6db5ac433ffee308933CAS |
[23] N. Yamashita, K. Kannan, S. Taniyasu, Y. Horii, G. Petrick, T. Gamo, A global survey of perfluorinated acids in oceans. Mar. Pollut. Bull. 2005, 51, 658.
| A global survey of perfluorinated acids in oceans.Crossref | GoogleScholarGoogle Scholar | 1:CAS:528:DC%2BD2MXht1Sjs7vI&md5=f41d0068b593598fe34002e3ebae727fCAS |
[24] Y. Shinozuka, A. D. Clarke, S. G. Howell, V. N. Kapustin, B. J. Huebert, Sea-salt vertical profiles over the Southern and tropical Pacific oceans: microphysics, optical properties, spatial variability, and variations with wind speed. J. Geophys. Res. 2004, 109, D24201.
| Sea-salt vertical profiles over the Southern and tropical Pacific oceans: microphysics, optical properties, spatial variability, and variations with wind speed.Crossref | GoogleScholarGoogle Scholar |
[25] H. Struthers, A. M. L. Ekman, P. Glantz, T. Iversen, A. Kirkevåg, E. M. Mårtensson, Ø. Seland, E. D. Nilsson, The effect of sea ice loss on sea salt aerosol concentrations and the radiative balance in the Arctic. Atmos. Chem. Phys. 2011, 11, 3459.
| The effect of sea ice loss on sea salt aerosol concentrations and the radiative balance in the Arctic.Crossref | GoogleScholarGoogle Scholar | 1:CAS:528:DC%2BC3MXosFWnuro%3D&md5=de123240359f67db8ee22d2e101d2cd6CAS |
[26] S. Benassai, S. Becagli, R. Gragnan, O. Magand, M. Propositi, I. Fattori, R. Traversi, R. Udusti, Sea-spray deposition in Antarctic coastal and plateau areas from ITASE traverses Ann. Glaciol. 2005, 41, 32.
| Sea-spray deposition in Antarctic coastal and plateau areas from ITASE traversesCrossref | GoogleScholarGoogle Scholar | 1:CAS:528:DC%2BD2sXhtlaru7jK&md5=014dcf9dfac7661ad28a2f5d17ca367eCAS |
[27] N. M. Mahowald, J.-F. Lamarque, X. X. Tie, E. Wolff, Sea-salt aerosol response to climate change: last Glacial Maximum, preindustrial, and doubled carbon dioxide climates J. Geophys. Res. 2006, 111, D05303.
| Sea-salt aerosol response to climate change: last Glacial Maximum, preindustrial, and doubled carbon dioxide climatesCrossref | GoogleScholarGoogle Scholar |
[28] K. A. H. Hultin, E. D. Nilsson, R. Krejci, M. E. Mårtensson, M. Ehn, Å. Hagström, G. de Leeuw, In situ laboratory sea spray production during the MAP 2006 cruise on the North East Atlantic. J. Geophys. Res. 2010, 115, D06201.
| In situ laboratory sea spray production during the MAP 2006 cruise on the North East Atlantic.Crossref | GoogleScholarGoogle Scholar |
[29] K. A. H. Hultin, R. Krejci, J. Pinhassi, L. Gomez-Consarnaub, E. M. Mårtensson, Å. Hagström, E. D. Nilsson, Aerosol and bacterial emissions from Baltic Sea water. Atmos. Res. 2011, 99, 1.
| Aerosol and bacterial emissions from Baltic Sea water.Crossref | GoogleScholarGoogle Scholar |
[30] C. A. Tyree, V. M. Hellion, O. A. Alexandrova, J. O. Allen, Foam droplets generated from natural and artificial seawaters. J. Geophys. Res. 2007, 112, D12204.
| Foam droplets generated from natural and artificial seawaters.Crossref | GoogleScholarGoogle Scholar |
[31] E. Fuentes, H. Coe, D. Green, G. de Leeuw, G. McFiggans, Laboratory-generated primary marine aerosol via bubble-bursting and atomization. Atmos. Meas. Technol. 2010, 3, 141.
| Laboratory-generated primary marine aerosol via bubble-bursting and atomization.Crossref | GoogleScholarGoogle Scholar | 1:CAS:528:DC%2BC3cXhtFKqs7%2FO&md5=b81482f1bd3f0b09e76e57d0ad676014CAS |
[32] K. Sellegri, C. D. O’Dowd, Y. J. Yoon, S. G. Jennings, G. de Leeuw, Surfactants and submicron sea spray generation. J. Geophys. Res. 2006, 111, D22215.
| Surfactants and submicron sea spray generation.Crossref | GoogleScholarGoogle Scholar |
[33] E. M. Mårtensson, E. D. Nilsson, G. de Leeuw, L. H. Cohen, H. C. Hansson, Laboratory simulations and parameterization of the primary marine aerosol production. J. Geophys. Res. 2003, 108, 4297.
| Laboratory simulations and parameterization of the primary marine aerosol production.Crossref | GoogleScholarGoogle Scholar |
[34] D. E. Slauenwhite, B. D. Johnson, Bubble shattering: differences in bubble formation in fresh water and seawater. J. Geophys. Res. 1999, 104, 3265.
| Bubble shattering: differences in bubble formation in fresh water and seawater.Crossref | GoogleScholarGoogle Scholar | 1:CAS:528:DyaK1MXhsl2ksbk%3D&md5=0bc35c7b592d57abef58010000afecb6CAS |
[35] A. Holm, S. R. Wilson, P. Molander, E. Lundanes, T. Greibrokk, Determination of perfluorooctane sulfonate and perfluorooctanoic acid in human plasma by large volume injection capillary column switching liquid chromatography coupled to electrospray ionization mass spectrometry. J. Sep. Sci. 2004, 27, 1071.
| Determination of perfluorooctane sulfonate and perfluorooctanoic acid in human plasma by large volume injection capillary column switching liquid chromatography coupled to electrospray ionization mass spectrometry.Crossref | GoogleScholarGoogle Scholar | 1:CAS:528:DC%2BD2cXot1yltLk%3D&md5=932e66d4e7f3df1f9bb2b9f91318e4fcCAS |
[36] J. Tolls, D. T. H. M. Sijm, Estimating the properties of surface-active chemicals, in Handbook of Property Estimation Methods for Chemicals (Eds R. S. Boethling, D. Mackay), 2000, pp. 419–445 (Lewis: Boca Raton).
[37] D. C. Burns, D. A. Ellis, H. Li, C. J. McMurdo, E. Webster, Experimental pKa determination for perfluorooctanoic acid (PFOA) and the potential impact of pKa concentration dependence on laboratory-measured partitioning phenomena and environmental modeling. Environ. Sci. Technol. 2008, 42, 9283.
| Experimental pKa determination for perfluorooctanoic acid (PFOA) and the potential impact of pKa concentration dependence on laboratory-measured partitioning phenomena and environmental modeling.Crossref | GoogleScholarGoogle Scholar | 1:CAS:528:DC%2BD1cXhtlCgtbrP&md5=85727a753ca9f4e71649720238600e37CAS |
[38] M. A. Kaiser, B. J. Dawson, C. A. Barton, M. A. Botelho, Understanding potential exposure sources of perfluorinated carboxylic acids in the workplace. Ann. Occup. Hyg. 2010, 54, 915.
| Understanding potential exposure sources of perfluorinated carboxylic acids in the workplace.Crossref | GoogleScholarGoogle Scholar | 1:CAS:528:DC%2BC3cXhsVOnt73K&md5=c88e30333ce770c5aa20a16d79afd4f3CAS |
[39] H. P. H. Arp, K.-U. Goss, Irreversible sorption of trace concentrations of perfluorocarboxylic acids to fiber filters used for air sampling. Atmos. Environ. 2008, 42, 6869.
| Irreversible sorption of trace concentrations of perfluorocarboxylic acids to fiber filters used for air sampling.Crossref | GoogleScholarGoogle Scholar | 1:CAS:528:DC%2BD1cXhtFSqsbjL&md5=80d2de80b9fd006fd37f630c37b68151CAS |