

Trace metal speciation predictions in natural aquatic systems: incorporation of dissolved organic matter (DOM) spectroscopic quality
Kristin K. Mueller A , Stephen Lofts B , Claude Fortin A and Peter G. C. Campbell A CA INRS Eau Terre et Environnement, Université du Québec, 490 de la Couronne, Québec QC, G1K 9A9, Canada.
B Centre for Ecology and Hydrology, Lancaster Environment Centre, Library Avenue, Bailrigg, Lancaster, LA1 4AP, United Kingdom.
C Corresponding author. Email: peter.campbell@ete.inrs.ca
Environmental Chemistry 9(4) 356-368 https://doi.org/10.1071/EN11156
Submitted: 13 December 2011 Accepted: 5 June 2012 Published: 20 August 2012
Journal Compilation © CSIRO Publishing 2012 Open Access CC BY-NC-ND
Environmental context. To assess the risk posed by environmental contaminants such as metals, one needs to be able to identify the key chemical species that prevail in natural waters. One of the recognised stumbling blocks is the need to quantify the influence of heterogeneous dissolved organic matter (DOM). Here we explore the possibility of using the optical signature of DOM to determine its quality, to alleviate the need to make assumptions about its metal-binding properties and to improve the prediction of trace metal species distributions in natural waters.
Abstract. To calculate metal speciation in natural waters, modellers must choose the proportion of dissolved organic matter (DOM) that is actively involved in metal complexation, defined here as the percentage of active fulvic acid (FA); to be able to estimate this proportion spectroscopically would be very useful. In the present study, we determine the free Cd2+, Cu2+, Ni2+ and Zn2+ concentrations in eight Canadian Shield lakes and compare these measured concentrations to those predicted by the Windermere Humic Aqueous Model (WHAM VI). For seven of the eight lakes, the measured proportions of Cd2+ and Zn2+ fall within the range of values predicted by WHAM; the measured proportion of Cu2+ falls within this range for only half of the lakes sampled, whereas for Ni, WHAM systematically overestimated the proportion of Ni2+. With the aim of ascribing the differences between measured and modelled metal speciation to variations in DOM quality, the percentage of active FA needed to fit modelled and measured free metal concentrations was compared with the lake-to-lake variation in the spectroscopic quality of the DOM, as determined by absorbance and fluorescence measurements. Relationships between the percentage of active FA and DOM quality were apparent for Cd, Cu, Ni and Zn, suggesting the possibility of estimating the percentage of active FA spectroscopically and then using this information to refine model predictions. The relationships for Ni differed markedly from those observed for the other metals, suggesting that the DOM binding sites active in Cd, Cu and Zn complexation are different from those involved in Ni complexation. To our knowledge, this is the first time that such a distinction has been resolved in natural water samples.
Introduction
Knowledge of the speciation of trace metals in natural waters is widely recognised as a key to understanding both their geochemical mobility and their ecotoxicological impacts. In natural freshwater systems, trace metals may interact with a variety of ligands, including common inorganic anions (e.g. OH–, HCO3–, CO32–, Cl–, F– and SO42–), simple monomeric organic molecules of natural or anthropogenic origin (e.g. metabolites such as citrate or glycine, or polycarboxylates such as nitrilotriacetic acid) and dissolved humic substances (fulvic acid (FA) and humic acid (HA)).[1] From a geochemical or ecotoxicological perspective, the key species is the free metal ion (Mz+), which is usually presumed to be in equilibrium with these various dissolved or particulate ligands and with the epithelial or cell surfaces of the resident aquatic organisms; it is the master species from which the concentrations of all other species of interest can in principle be calculated.
Several approaches have been used to determine free metal ion concentrations in natural waters. For example, the equilibrium ion exchange technique (IET) has been employed to determine Cd2+, Ni2+ and Zn2+ concentrations in environmental samples.[2–4] Various electrochemical techniques have also been used, including potentiometry with ion-selective electrodes (ISEs)[5,6] and cathodic stripping voltammetry,[5,7] as has the Donnan membrane technique.[8,9] However, given the complexity of the analytical matrices in which the free metal ion is found, and the often very low ambient metal concentrations, the determination of [Mz+] in natural waters is not a routine measurement.
A complementary approach to such analytical determinations would be the use of chemical equilibrium models to calculate the free metal ion concentration. For simple systems, containing inorganic cations and anions together with simple monomeric ligands, such an approach is reasonably straightforward. However, for waters containing natural dissolved organic matter (DOM), the chemical equilibrium calculations must deal with the challenging presence of FA and HA. These ubiquitous but poorly defined materials behave like multidentate ligands and polyelectrolytes in solution. Dudal and Gérard[10] have reviewed various approaches that have been developed to account for natural organic matter in aqueous chemical equilibrium models, including two that are currently widely used: the Windermere Humic Aqueous Model (WHAM) and the Non-Ideal Competitive Adsorption (NICA)–Donnan model. In addition to FA and HA, DOM also includes biogenic molecules (amino acids, proteins and carbohydrates), the concentrations of which tend to be maintained at very low levels due to their degradation and uptake by heterotrophic microorganisms. As a result, these other components of the DOM pool normally will not affect trace element speciation.[11] In waters affected by wastewater effluents, the DOM may also include strong chelating agents of anthropogenic origin.
Recent comparisons of free metal ion concentrations measured in natural aquatic systems with the concentrations predicted for these systems with the NICA and WHAM speciation models have demonstrated major differences between measured and predicted values for some metals, notably Cu, Ni and Pb.[3,12,13] Lofts and Tipping[14] have discussed possible reasons for these differences, including errors in measuring the free metal ion, errors in measuring the variables that are used as input data for the model and differences between the DOM present in the natural waters and the types of (isolated) FA and HA that have traditionally been used to calibrate or parameterise the chemical equilibrium models. In the present paper we have explored this latter factor.
One of the challenges involved in applying a chemical equilibrium model to a natural water is to estimate the FA and HA content of the water. Current speciation models that include dissolved organic matter (DOM), such as WHAM, incorporate the measured quantity of DOM, but users must define the DOM quality by choosing the percentage of the DOM that is actively involved in metal complexation, and by deciding what proportions of this ‘active’ DOM should be designated FA and HA. To be able to estimate this ‘percentage active’ DOM spectroscopically would be very useful. For example, the specific ultraviolet absorbance of the DOM (SUVA254), a measure of the aromaticity of the organic matter, has been used to estimate the proportion of DOM that is present as HA or FA in solution and that participates in the complexation of Cu in reconstituted natural water samples[15,16] and in the complexation of Cu[17] and Cd[18,19] in soil extracts. A better a priori understanding of the quality of DOM in a given sample would alleviate the need to make assumptions about the activity of DOM and might reduce the discrepancies between predicted and measured free metal concentrations.
The purpose of this paper is thus three-fold: (i) to determine the free Cd2+, Cu2+, Ni2+ and Zn2+ concentrations in a set of lakes located along a metal contamination gradient; (ii) to compare these measured concentrations with the free metal concentrations predicted by WHAM VI and (iii) to explore the use of the optical signature of the DOM in each lake as a means of estimating the proportion of the natural DOM that is active in metal complexation.
Methodology
Study area
Although a detailed description of the study sites can be found in Mueller et al.[20] a brief description is given here. Lake water was collected from lakes in two different regions on the Canadian Shield: near Rouyn-Noranda in north-western Québec and near Sudbury in north-central Ontario. Both study areas have been greatly affected by metal mining and smelting activities, particularly by atmospheric deposition of acid and metals.[21,22] The pH of the lakes tends to decrease and total metal concentrations tend to increase with a decrease in the down-wind distance from the metal smelters, particularly in the Sudbury area.[23] Acid mine drainage from point sources, such as abandoned mines or mineralised outcrops, may also decrease the pH of lake water locally. In each region, lakes were chosen to represent a gradient in water quality (pH, dissolved organic carbon (DOC)) and trace metal concentrations.
Lake water sampling
Lake water samples were taken from four lakes in each of the study areas during July and August 2008. Sampling sites were chosen in the littoral zones of small, well mixed lakes and the sampling sites were considered to be representative of the whole lake epilimnion. The spatial variability of water chemistry (i.e. pH and concentrations of DOC and major cations) is known to be minimal within many of the sampled lakes.[3]
Lake water was collected passively using equilibrium diffusion sampling as described in Fortin et al.[3] and Mueller et al.[20] Briefly, 250-mL polypropylene jars (Nalgene, Nalge Nunc International Corporation, Rochester, NY) topped with custom-made plastic lids fitted with a 0.2-µm filter membrane (HT Tuffryn Membrane, Pall Canada Ltd, Ville St-Laurent, QC, Canada) were filled with Milli-Q (Millipore, EMD Millipore, Billerica, MA) ultrapure water (>18 MΩ cm) and fixed to plastic rods that were anchored to the lake bottom. The samplers were installed at a depth of 1 m from the lake surface and left to equilibrate for 13 to 14 days. Following this equilibration period, the samplers were brought to the surface, the membrane surface rinsed with ultrapure water, the membranes pierced with a clean plastic pipette tip and the custom jar lids replaced with clean polypropylene screw lids. The sample jars were bagged and stored in the dark at 4 °C in field coolers for a maximum of 12 days until they were transported back to the laboratory. Note that lake water pH, conductivity and temperature were measured in the field at the time of sample collection.
Sample analysis
All plastic laboratory and sampling equipment was soaked in 10 % (v/v) nitric acid for at least 24 h and then rinsed a minimum of six times with ultrapure water and dried under a Class 100 laminar flow hood. The only exception was for the polystyrene vials used for storing the subsamples for anion analyses; these vials were rinsed three times with ultrapure water only. All glassware was soaked in a 2 N HCl solution before being rinsed with ultrapure water.
Once the polypropylene jars had arrived in the central laboratory, they were opened in a clean Class 100 laminar flow hood, and subsamples were collected as follows. A 10-mL subsample was transferred to a polypropylene vial and acidified to 2 % (v/v) with concentrated ultra-trace nitric acid (BDH Aristar Ultra, VWR International, Mississauga, ON, Canada) for analysis of major cations (Ca, Mg) by atomic optical emission spectroscopy (ICP-OES, Varian Vista AX CCD, Agilent Technologies Canada Inc., Mississauga, ON) and total metals (Cd, Cu, Ni and Zn) by inductively coupled plasma–mass spectrometry (ICP-MS, Element X Series, Thermo Scientific, Mississauga, ON). A second 10-mL subsample was transferred to a polystyrene vial for the determination of anion concentrations (F–, Cl–, NO3–, SO42– and PO43–) by ion chromatography (Dionex ICS-2000, Thermo Scientific).
Details concerning the quantitative and qualitative characterisation of DOM can be found in Mueller et al.[20] Briefly, 20-mL subsamples were transferred to amber borosilicate vials (I-Chem Brand, Thermo Fisher Scientific, Rockwood, TN) for total organic carbon analysis (TOC-VCPH, Shimadzu Scientific Instruments, Columbia, MD). Subsamples (1 mL) were transferred to 3-mL glass vacutainers (Kendall Monoject, Mansfield, MA) for total inorganic carbon analysis by gas chromatography (Varian 3800 GC, Agilent Technologies Canada Inc.). The absorption (Varian UV-Vis Cary 300 Spectrophotometer, Agilent Technologies Canada Inc.) and fluorescence (Varian Cary Eclipse Fluorescence Spectrophotometer, Agilent Technologies Canada Inc.) spectra of lake water DOM were also measured. The specific UV absorbance (SUVA, L m–1 mg–1 C) was also calculated by dividing the measured absorbance at 254 nm by the concentration of DOC.[24] Excitation–emission matrix (EEM) fluorescence spectra were measured using 1-cm quartz cuvettes at excitation wavelengths from 210 to 400 nm at increments of 5 nm and at emission wavelengths from 300 to 580 nm at increments of 2 nm. The fluorescence index was calculated as the ratio between the fluorescence emission intensity at 470 nm over that at 520 nm for an excitation at 370 nm.[25,26] Finally, the multivariable statistical tool, parallel factor analysis (PARAFAC), was employed to deconvolute the EEM spectra using the procedure outlined by Stedmon and Bro[27] as implemented in a MATLAB environment, using the ‘N-way toolbox for MATLAB’.[28]
Metal speciation measurements
All sub-samples for metal speciation measurements were filtered (0.2-µm polycarbonate filter; AMD Manufacturing Inc., Mississauga, ON) under a laminar flow hood before analysis. A precipitate was observed in a few samples, which prompted a filtration step for all samples just before the metal speciation analyses. WHAM metal speciation simulations were performed using the element concentrations measured on these filtered samples. All calibration solutions were prepared using ultrapure water. Stock solutions of Cd, Cu, Ni and Zn were prepared from ICP-MS standard solutions (4 % HNO3, PlasmaCAL, SPC Science, Baie D’Urfé, QC, Canada). To take into account the variable natural conditions of each lake sampled, e.g. pH, ionic strength and total metal concentrations, a lake-specific limit of quantification (LOQ) was calculated for the measurement of the free metal ion for each lake, based on the standard deviation of triplicate measurements. When the free metal value for a lake fell below its LOQ, it was discarded and the free metal ion concentration or percentage was not reported.
Ion exchange technique (IET)
The concentrations of Cd2+, Ni2+ and Zn2+ were measured following the methods described by Fortin and Campbell[29] and updated by Fortin et al.[3] Briefly, the IET involves the equilibration of the free metal ions in an unknown sample with a cation exchange resin (Dowex 50W-X8, 50-100 mesh, Sigma–Aldrich Canada Ltd, Oakville, ON, Canada) that has been calibrated with standard solutions according to the following reaction:

where M2+ is the free metal ion, RxCat represents the resin with binding sites filled by a mono- or divalent cation (Catx+), x is the charge on the cation and R2M represents the resin with binding sites filled by the metal ion of interest. The conditional equilibrium constant (KIEc) for the above reaction is calculated using the following equation:
Under swamping electrolyte conditions, [Catx+] and [RxCat] are assumed to remain constant and Eqn 2 is rearranged to give the resin distribution coefficient at fixed ionic strength and pH, λo,i,pH (L g–1).
The resin was calibrated with standard solutions with a pH range of 5.3 to 8.9 and with known concentrations of free Cd2+ (0.24 to 42 nM), Ni2+ (13 to 202 nM) and Zn2+ (4.9 to 148 nM) and the resin distribution coefficient (λ) was calculated for each metal before applying the method to the natural unknown samples (see Supplementary material, Fig. S1, see http://www.publish.csiro.au/?act=view_file&file_id=EN11156_AC.pdf).
Experimentally, the resin was pre-equilibrated with a matrix solution that had an ionic strength (Ca(NO3)2 as the swamping electrolyte) and pH similar to the calibrating solution and the natural samples; a sufficient volume from a 25 mM Ca(NO3)2 (99.0 %, Sigma–Aldrich Canada Ltd) stock solution was also added to each natural sample so as to obtain a constant Ca concentration of 0.46 mM in all natural samples. By levelling the ionic strength of the natural samples, we ensured that the time needed to reach equilibrium between the resin and the sample was similar for all samples and that a single metal-specific distribution coefficient could be used. After a steady-state had been reached between the resin and the sample (190 mL), the resin was rinsed with ultra-pure water and eluted with a volume (V, 6 mL) of 10 % (v/v) ultra-trace nitric acid (BDH Aristar Ultra, VWR International). The amount of free metal originally bound to the resin at steady-state ([R2M]) was calculated using the following equation:
where [MEluate] is the concentration of metal measured in the eluate and mr is the mass of the resin used (~7 mg; weighed precisely). Finally, by combining Eqns 3 and 4, the free metal concentration in the sample was calculated using Eqn 5.
Cupric ion selective electrode (Cu ISE)
Because the IET tends to overestimate free Cu2+ when the lake pH is greater than 6.5,[3] we determined Cu2+ in the lake samples using a cupric ion selective electrode (Cu ISE, Orion, Thermo Scientific) following the methods outlined by Rachou et al.[6] The Cu ISE was calibrated daily with a solution containing 0.1-mM copper nitrate (Cu(NO3)2, PlasmaCAL, SPC Science), 1-mM iminodiacetic acid (IDA, Sigma–Aldrich Canada Ltd), 2.5-mM potassium hydrogen phthalate (KHC8H4O4, 99.95 %, Sigma–Aldrich Canada Ltd), 10-mM potassium nitrate (KNO3, 99.995 %, Fluka, Sigma–Aldrich Canada Ltd) and 6-mM sodium hydroxide (NaOH, 98 %, Sigma–Aldrich Canada Ltd). The calibration solution was split into 5 to 11 subsamples with pH values varying from 2 to 11, adjusted by the addition of small known amounts of either HNO3 or NaOH, and allowed to equilibrate overnight. The free Cu2+ concentration calculated ranged from the method detection limit (three times the standard deviation (s.d.) of six replicate blank measurements) of 2.6 × 10⁻¹¹ to 6.3 × 10⁻⁵ M. The calibration subsamples with pH values above 6 were bubbled with N2 gas, to avoid a decrease in pH with the dissolution of atmospheric carbon dioxide, CO2 (aq). The pH and temperature of the samples were respectively monitored using an Orion (Orion, Thermo Scientific) electrode and probe. During Cu ISE measurements, constant stirring and temperature conditions were also maintained. The calibrated response of the Cu ISE electrode was determined from the plot of the measured ISE potential against the calculated pCu for each calibration subsample. For the natural water samples, the concentration of Cu2+ was then calculated using the Cu ISE calibration equation and the measured electrode potential. The natural samples were amended with KNO3 (99.995 %, Fluka, Sigma–Aldrich Canada Ltd; a specific volume of a 1.0-M stock solution was added to achieve a final concentration of 10 mM KNO3) to ensure a constant ionic strength among the natural samples.
Metal speciation calculations
The free Cd2+, Cu2+, Ni2+ and Zn2+ concentrations measured for each lake were compared with values calculated using the WHAM, model version 6.1.[30] Several assumptions were made in the application of the model to the lake water samples. First, we assumed that the DOC-to-DOM ratio was 2,[31] that 65 % of the DOM was active in the complexation of metals[32] and that this active fraction was composed of FAs only. We also assumed that both FeIII and AlIII activities are controlled by the solubility of their hydroxides, as calculated using the respective empirical equations given by Lofts et al.[33] and Tipping.[34] Other measured WHAM input parameters included pH and the total concentrations of Na, Mg, K, Ca, Cr, Co, Ni, Cu, Zn, Cd, Cl, NO3, SO4, CO3 (measured as total inorganic carbon) and F. The measured surface temperature of the lakes sampled (used in the WHAM simulations) varied between 20 and 23 °C. Separate WHAM simulations were run for lake samples analysed using the IET free ion measurement method (for the analysis of free Cd2+, Ni2+ and Zn2+) and for those analysed with the ISE method (for the analysis of free Cu2+); the input data for these simulations corresponded exactly to the composition of the samples used for the free metal ion analyses, thus accounting for the differences in their ionic composition (respective additions of Ca(NO3)2 and KNO3).
Statistical analysis
All statistical analyses were calculated at the α equals 0.05 confidence level using SigmaPlot 11.0 (Systat Software Inc., San Jose, CA). Parametric t-tests and linear and non-linear regression were used when the normality and homogeneity of variances among datasets were confirmed; otherwise, the appropriate non-parametric tests were employed (Mann–Whitney Rank Sum test, in place of the t-test). Note that for the regression equations generated between the WHAM calculated percentage of FA active in metal complexation (%aFAopt) and the relative contribution of PARAFAC fluorescence components 1 and 3 to the overall fluorescence spectrum of lake DOM (see Relationships between %aFAopt and DOM spectroscopic properties below), the assumptions of normality and homogeneity of variance were confirmed. The only exception was for Ni, where the variance among the datasets was not constant (P = 0.01).
Results and discussion
Water quality
The speciation of dissolved metals in freshwater systems is sensitive to the concentration of DOM, which tends to complex free metal ions, but may also be affected by other water quality variables, notably the concentrations of Ca, Mg, Al, Fe and the H+ ion, these being potential competitors for the cation binding sites on the DOM.[35] In addition, for a water of given composition, the total dissolved concentration of the metal may affect its speciation (i.e. a limited number of high affinity binding sites). In the following two subsections we describe how the water chemistry varied among the studied lakes.
Background water chemistry
The water quality (i.e. [major cations], pH) of the lakes was described in Mueller et al.[20] for 2007 and 2008. Only the 2008 data are considered here, since the metal speciation measurements date from that year. Wide ranges in general water chemistry (pH, Ca, Mg and DOC concentrations) were found among the eight lakes sampled (Table 1), reflecting both regional geological differences and local differences at the watershed scale.[20] The lakes in both sampling regions have low concentrations of calcium ([Ca]: 68 to 464 µM) and magnesium ([Mg]: 27 to 274 µM), contributing to generally soft water. Lake Bethel, from the Sudbury region, had the highest pH and the highest Ca and Mg concentrations of all the lakes; for the IET measurements, all other lake water samples were thus adjusted upwards to these Ca concentrations (see Ion exchange technique (IET) above).

|
Lakes from the Rouyn-Noranda region are circumneutral, with a mean pH of 7.25 and a narrow range of values between pH 6.81 and 7.69. The mean pH for the Sudbury lakes (7.07) is slightly lower than that of the Rouyn-Noranda lakes and pH values span a wider range (6.40 to 8.08). Historically, the Rouyn-Noranda lakes were less affected by anthropogenic acidification than were those in the Sudbury area,[36] despite massive SO2 emissions from the Horne smelter; the Rouyn-Noranda lakes are located in the Abitibi clay belt and are effectively better buffered against acid deposition. Although the average circumneutral pH of the lakes in the Sudbury regions is evidence of the recovery of these lakes from historical acidification in recent years,[37] pH values in the lakes of this region spanned a wider range than in the Rouyn-Noranda lakes.
Based on their historical chlorophyll-a concentrations (1–4 µg chl-a L–1; P. G. C. Campbell, unpubl. data), the four studied lakes in the Rouyn-Noranda region are oligotrophic, as are Lakes Raft and Whitson in the Greater Sudbury area (2–3 µg chl-a L–1; http://www.greatersudbury.ca/cms/index.cfm?app=div_lakewaterquality&lang=en&currID=619, accessed 7 August 2012). We were unable to find comparable data for Lake Geneva, which lies outside the Greater Sudbury area, but given the lack of development in its watershed, it is also likely oligotrophic. The only exception is Lake Bethel, which is much more productive (12–24 µg chl-a L–1; http://www.greatersudbury.ca/cms/index.cfm?app=div_lakewaterquality&lang=en&currID=619) and can be classified as eutrophic.
Dissolved organic carbon (DOC)
The mean DOC concentration of the Rouyn-Noranda lakes was higher (6.1 mg C L–1) and spanned a wider range (4.9 to 8.1 mg C L–1) than in the lakes from the Sudbury region (mean of 3.4 mg L–1; range from 2.0 to 4.9 mg L–1). The higher DOC concentration in the lakes in the Rouyn-Noranda region than Sudbury lakes reflects the greater soil cover and the higher watershed-to-lake area ratios for the Rouyn-Noranda lakes. As described in Mueller et al.[20] the quantity and the quality of DOM in the lakes sampled vary as a function of regional watershed characteristics as well as DOM processing within the watershed and within the lake itself.
DOM optical quality (SUVA254 and Fluorescence Index) was found to differ significantly between sampling regions and among lakes (see Table S1 for more details) and is described elsewhere.[20] The authors also used PARAFAC to extract fluorescence components from EEM fluorescence spectra measured for 19 lakes in the Rouyn-Noranda and Sudbury regions, including the eight lakes retained for the present study. Of particular interest were the humic-like fluorescence components of ubiquitous origin (C1) and allochthonous origin (C3). Component C1 corresponds to a reduced quinone fluorophore associated with higher plant matter, whereas C3 corresponds to an oxidised quinone fluorophore.[20] We used the proportion of each of these DOM fluorescence components (relative to the sum of all four PARAFAC fluorescence components, i.e. C1/CT or C3/CT) as measures of the quality of DOM sampled in our lakes, and in particular as proxies for the fraction of DOM active in the complexation of trace elements (see Optimisation of WHAM VI predictions below).
Lake-to-lake variations in metal concentrations and metal speciation
Total dissolved metal ion concentrations
The total dissolved metal concentrations (Cd, Cu, Ni and Zn) varied markedly among the eight lakes sampled (Table 1). For lakes in the Rouyn-Noranda region, the concentration gradient ratios (i.e. the ratio of the maximum metal concentration to the minimum metal concentration, [M]max/[M]min) decreased in the sequence Cd (33) ~ Zn (31) > Cu (7) > Ni (2.5). In the Sudbury region, the [M]max/[M]min ratios decreased in the order Ni (63) > Cd (31) > Cu (16) > Zn (5). Lakes in the Rouyn-Noranda region had significantly higher mean total concentrations of Cd (P = 0.004) and Zn (P = 0.030) than the lakes in the Sudbury area, but lower concentrations of Ni (P < 0.001). No significant difference in total dissolved Cu was found between the sampling regions.
The lake-to-lake variability in the measured total dissolved metal concentrations within a given region is largely due to variations in atmospheric loading from local mining and smelting activities.[21,38] Despite the marked reductions in smelter emissions that have been achieved over the past 30 years, lakes in close proximity to and down-wind from the metal smelters (e.g. Lakes Dufault and Dasserat in the Rouyn-Noranda region, Lakes Raft and Whitson in the Sudbury area) still have considerably higher total dissolved metal concentrations than do those located upwind or far downwind.
Free metal ion concentrations
The free Cd2+, Cu2+, Ni2+ and Zn2+ concentrations also varied among lakes (Table 1). The ratio of [M2+]max/[M2+]min for the Rouyn-Noranda lakes decreased as follows: Zn (121) > Cd (54) > Cu (5.5). Free Ni2+ concentrations were only measurable in one replicate sample from one lake for the Rouyn-Noranda region and, therefore, no concentration gradient ratio was calculated. The ratio of [M2+]max/[M2+]min for the Sudbury lakes decreased in the sequence Ni (136) > Cu (64) > Cd (40) > Zn (22). As anticipated, lakes that had the highest concentrations of dissolved metal also exhibited the highest free metal ion concentrations.
In the present context, where we are comparing measured and predicted metal speciation in different lakes, it is important to consider the relative proportion of the free metal ion in each lake, as this measure takes into account the differences in total dissolved metal concentrations among lakes. As anticipated, copper was much more strongly complexed than the other three metals – the mean percentage of free metal for copper was only 1.3 %, whereas the mean percentages for Cd2+ (54 %), Ni2+ (29 %) and Zn2+ (50 %) were much higher (Table 1). For all four metals, and in both the Rouyn-Noranda and Sudbury regions, the percentage of free metal tended to decrease as the pH increased, pointing to complexation competition by protons as an important factor affecting metal speciation. A general decline in the percentage of free metal was also observed for Cd, Cu and Ni as the DOC concentration increased, presumably reflecting an increase in the ligand-to-metal ratio (see Figs S3, S4 for these pH and DOC relationships).
Comparison of the observed metal speciation with literature values
In comparing metal speciation in different freshwater environments, the reported free metal ion concentrations are not particularly useful, since they will vary according to the metal loadings affecting the water body. Comparisons of free metal ion proportions are a more meaningful way of evaluating how metal speciation varies from one lake or river to another. In Table 2, we have compiled free metal ion percentages that have been reported in the literature for Cd, Cu, Ni and Zn (the recent review paper by Lofts and Tipping[14] was used as a starting point to identify papers where free metal ion concentrations for natural waters had been reported). Table 2 cannot claim to be comprehensive, as the representation of surface waters from Switzerland and Canada is abnormally high, but the compilation does offer some insight into metal-to-metal differences in metal speciation.

|
Copper is the metal for which the Table 2 database is the most extensive and it is also consistently the most strongly complexed metal, followed by Ni > Cd ≥ Zn. For a given metal, however, there are distinct regional differences; the percentage of free metal is virtually always lower in the alkaline Swiss lakes than in the more acidic and more dilute lakes on the Canadian Precambrian Shield. On a relative scale, this difference is particularly notable for Cu2+, where the percentage can be less than 0.001 % in many of the Swiss lakes but consistently above 1 % in the Canadian surface waters. Factors contributing to this trend include the aforementioned differences is pH and alkalinity (carbonate and hydroxide complexation), but also the metal loadings. Total dissolved metal concentrations in the Canadian lakes are much higher than in the Swiss surface waters (Table 2), presumably reflecting inputs from the mining and smelting activities that are prevalent on the Canadian Shield. Higher total metal concentrations, and the resulting higher metal-to-DOM ratios, would be expected to lead to lower degrees of complexation.
Lake-to-lake variations in predicted metal speciation and comparison with measured values
Initial WHAM simulations
Free metal ion concentrations. The WHAM VI chemical equilibrium model has been described in detail by Tipping.[39,40] In comparisons with its predecessor (Model V), Model VI does a better job of simulating metal binding to FA and HA, particularly at low metal concentrations, for low [M]/DOC ratios and for metals that tend to bind to the strong metal-binding sites (putative N and S functional groups) that were expressly introduced into Model VI. In brief, FA and HA are assumed to be rigid spheres of uniform size (radii of 0.8 and 1.7 nm) with two classes of ion-binding groups positioned randomly on their surface: type A sites correspond to monoprotic carboxylic acid groups, whereas type B sites are modelled as weaker (e.g. phenolic) acid groups. Metal ions and their first hydrolysis products (MOH(n–1)+) compete with each other, and with protons, for the type A and type B groups. Bidentate metal-binding sites are generated by combining pairs of proton-binding sites (A–A or A–B combinations). Only proton-binding sites that are sufficiently close to each other are able to form bi-dentate sites (≤0.45 nm apart; estimated statistically). Similar rules are used to generate tridentate metal-binding sites.
When using WHAM to predict the free metal concentrations in the studied lakes, we initially assumed that the components of the DOC pool that participate in metal complexation reactions could be represented entirely by FA (100 % FA, 0 % HA), and that this FA portion corresponds to 65 % of the DOC; these choices were based on the recommendation of Bryan et al.[32] for copper complexation in natural waters. Good agreement was observed between predicted and measured values of [Cd2+] (Fig. 1a), over a 100-fold concentration range (0.01 to 1.1 nM). Agreement for [Zn2+] was also reasonable (Fig. 1d) over a similar 100-fold concentration range but for free Zn2+ concentrations (2 to 280 nM) that were considerably higher than for Cd2+. In the least contaminated lakes (Geneva, Bethel and notably Opasatica), the predicted free Zn2+ concentrations were somewhat higher than the measured values, suggesting that WHAM VI may underestimate Zn complexation at low dissolved Zn-to-DOC molar ratios.
|
At high free Cu2+ concentrations (>0.4 nM) our ISE measurements and the free Cu2+ values predicted by WHAM VI were in very good agreement (Fig. 1b), but below this threshold, in Lakes Vaudray, Geneva, Opasatica and Bethel, our measured values were 4 to 22 times higher than the predicted values. In their study of Cu speciation in three natural waters with similar low total dissolved Cu concentrations (19–30 nM), Unsworth et al.[12] also reported measured values of Cu2+ that exceeded WHAM VI predictions; free Cu2+ concentrations as estimated by two independent techniques (Donnan membrane; Hollow-fibre permeable liquid membrane) were 1 to 3 orders of magnitude higher than the WHAM VI predictions.
The generic constants used in WHAM VI have been generated from laboratory titrations of isolated HA and FA. Copper/DOC ratios in these titrations are very often higher than those encountered in natural water samples, and thus one might have expected calculations with the generic constants to underestimate copper complexation. However, we observe the opposite result (overestimation of Cu complexation, as was the case for Unsworth et al.[12]). Clearly more experiments to determine the conditional equilibrium constants for the complexation of Cu to DOM should be carried out under conditions approaching those found in natural waters (e.g. low Cu/DOC ratios; natural rather than isolated organic matter).
In our experiments, but not in those of Unsworth et al.,[12] there is a second possible explanation of an analytical nature for the discrepancy between measured and modelled free Cu2+ concentrations. In the four lakes with low total Cu concentrations, the total dissolved Cu concentration may be below that which is necessary to properly measure the free Cu2+ concentration using an ISE (~10–7 M) in a partially buffered system.[6,31,41] In such systems, if the buffering capacity is insufficient, Cu contamination from the electrode during the potentiometric measurement may artificially increase the apparent [Cu2+] value. However, if this were the case, all four lakes might be expected to exhibit similar Cu2+ concentrations, which is not the case. Note too that in all our lakes, the free Cu2+ concentration is buffered by the DOM naturally present in the samples.
Finally, WHAM VI consistently over-predicted the free Ni2+ concentration in all the lakes where the ambient concentration was above the method detection limit (Fig. 1c), i.e. the opposite result from that with Cu, suggesting that the default equilibrium constants for the complexation of Ni to natural DOM are too low for the environmental conditions found in our lakes. Van Laer et al.[42] came to a similar conclusion in their study of the complexation of Ni by the DOM present in six Belgian surface waters. At their background Ni concentrations (40 to 80 nM), the measured free-ion fraction, as measured using the Donnan membrane technique, varied from 4 to 45 %; WHAM VI overestimated the free-ion proportion more than two-fold, even if it was assumed that all the DOM was present as FA and actively participating in Ni complexation.
Free metal ion percentages. A comparison was also made between measured and modelled ‘percentage free metal’ values to take into account differences in the total metal concentrations specific to each lake (Fig. 2). A lake-specific percentage free metal limit of quantification (LOQ) was calculated for each lake based on three times the standard deviations of triplicate measurements of both the free metal and total metal concentrations measured for each lake. Any percentage free metal value calculated for a lake that yielded a value below its LOQ was discarded.
|
In addition to using the default assumption that 65 % of the DOM is present as FA and is active in metal complexation, we also calculated a range of model percentage free metal predictions by arbitrarily halving (33 %) and doubling (130 %) this value. It should be noted that increasing the %aFA to a value higher than 100 % simply increases the number of FA binding sites involved to a value that exceeds the complexation capacity (µmol binding sites per unit carbon) of the default FA. In the presentation of the results of these simulations (Fig. 2), the calculated percentage free metal is depicted as an envelope of values for each lake: the middle value corresponds to the default value obtained with the assumption of 65 % aFA, whereas the upper and lower values correspond to the percentage free metal calculated with 33 and 130 % as the proportions of DOM active in metal complexation. The bracket of upper and lower percentage free metal values included the measured percentage free metal values for both Cd and Zn in most lakes (7 of 8). The lakes for which the measured value fell outside the predicted envelope were those with the lowest total and free metal concentrations. Even with the assumption of only 33 % aFA, i.e. minimum complexation, WHAM VI still predicted a lower percentage free Cu2+ than the measured value for the lakes with the lowest total Cu concentrations (4 of 8). Similarly, even with the assumption of 130 % aFA, i.e. maximum complexation, the measured values of percentage free Ni2+ all fell below the minimum predicted value.
Optimisation of WHAM VI predictions
The chemical equilibrium simulations discussed to this point were run with WHAM VI in its default mode, using the assumptions that were outlined earlier. Among the adjustable WHAM input parameters are (i) the user-defined proportion of DOM active in metal complexation and (ii) the relative proportions of FA and HA making up the DOM that is active in metal complexation. The latter parameter varies as a function of the type of organic matter, e.g. whether it is derived from soil water, peat water or lake water.[32] The proportion of DOM that is active in metal complexation is usually unknown and must be estimated by the user of WHAM.
At this point, we retained the assumption that the DOM actively involved in metal complexation could be represented as FA, but we removed any constraint on the ‘percentage active FA’ and ran multiple simulations for each lake and each metal, individually. The optimal percentage of FA actively involved in metal complexation (%aFAopt) required to exactly predict the measured free metal ion was calculated by repeatedly running WHAM Model VI, adjusting the FA concentration until the predicted free metal ion concentration equalled the observed value. A computer code was used to automatically run WHAM and optimise the values of %aFA. The %aFAopt was calculated in this manner for each metal and for each lake as:
where [FA]opt is the optimised FA concentration (mg L–1) and [DOC] is the DOC concentration (mg L–1). In a given lake and for a particular metal, an optimal %aFA for each of the triplicate samples was calculated by finding the FA concentration that best described all the measured free ion concentrations for each sample simultaneously (Table 3). This was done by adjusting the model FA concentration, as before, and minimising the error term.
|
where [M]obs,i and [M]calc,i are the observed and calculated free ion concentrations for metal i.
By increasing or decreasing the %aFA, the number of FA binding sites involved in metal complexation is either increased or decreased, whereas the intrinsic metal binding affinities at these binding sites remain constant. In other words, the ligand concentration is adjusted. As can be seen in Table 3, the optimal %aFA values obtained in this manner varied from lake to lake, presumably reflecting inter-lake differences in the quality of the DOM. For Cu2+ the %aFAopt values all fell in the 8 to 90 % range, but for Cd2+, Zn2+ and particularly Ni2+, the values were all much higher, often exceeding the notional limit of 100 %: 61 to 250 % for Cd2+; 65 to 410 % for Zn2+ and 440 to 1900 % for Ni.
Possible reasons for the divergence between WHAM calculations and measured metal speciation
Although increasing the %aFA, and thus augmenting the number of binding sites on the FA (as described in the preceding section), is an acceptable adjustment, increasing this value up to three orders of magnitude higher than the default value is clearly unrealistic. This result suggests that in addition to adjusting the binding capacity of the FA, it will likely also be necessary to adjust metal binding affinities (KMA)[39] for Cd, Zn and especially Ni. There may well be natural ligands present in the lake water that have a higher affinity for Ni than does FA. Further experiments to determine the binding constants of these metals with natural DOM, at environmentally realistic metal concentrations, are clearly needed.
Discrepancies between WHAM predictions and measured free-metal ion concentrations could also arise if ligands other than FA and HA were involved in metal complexation. For example, Baken et al.[43] detected amino-polycarboxylate anions in some urban Belgian surface waters and suggested that these ligands of anthropogenic origin were responsible for the greater than expected metal complexation in these samples (as seen here for Ni). However, such an explanation seems unlikely in the present case, given the remote location of our lakes and the absence of urban wastewater inputs.
Relationships between %aFAopt and DOM spectroscopic properties
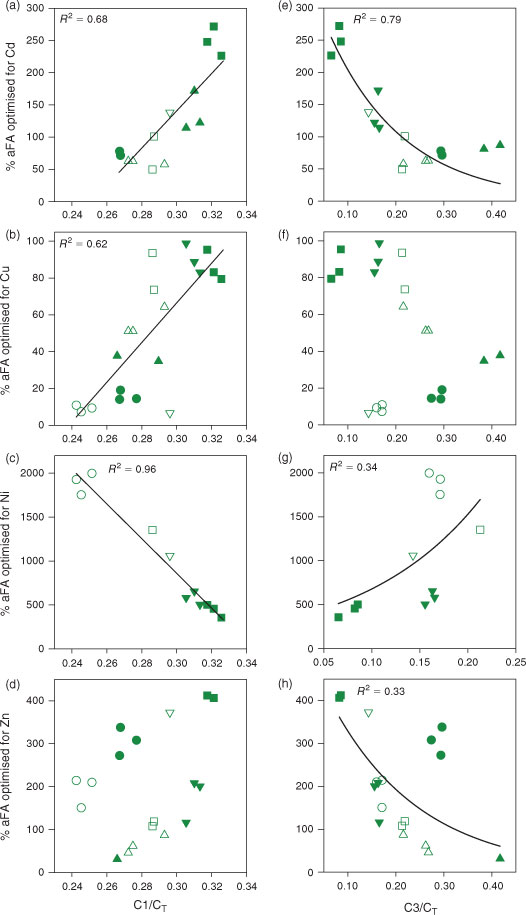
Given the marked lake-to-lake differences in %aFAopt, we explored possible relationships between this value and the optical properties of the DOM in the original lake water samples. Initially we looked for relationships with SUVA254 values, given the promising results obtained by soil scientists working on Cu and Cd speciation in soil solutions.[17,18] However, plots of %aFAopt against SUVA254 or the fluorescence index failed to yield useful relationships (see Figs S5, S6). Our interest then turned to the fluorescence spectrum, to determine if it could be used to estimate the proportion of DOM that is active in metal complexation. We plotted the relative fluorescence of each of the four PARAFAC fluorescence components against the %aFA needed to force the WHAM-calculated free metal concentration to equal the measured free metal ion concentration (%aFAopt) (see Figs S7, S8). The most statistically significant relationships with %aFAopt for the four metals emerged for C1/CT and C3/CT (Fig. 3). In seeking such relationships, we are using the fluorescence EEM as a ‘proxy’ for the composition of the DOM. Although spectrofluorimetry does not necessarily probe the functional groups or the exact sites involved in metal complexation by the DOM, it is nevertheless a useful and easy way to track changes in the quality of DOM in natural aquatic samples.[20,44]
|
For Cd, the strongest (R2 = 0.79) and most statistically significant (P < 0.0001) relationship (y = 380e(–6.4x)) emerged between %FAopt and the relative proportion of C3 (Fig. 3e). A statistically significant (P < 0.001) positive linear relationship (y = 1100x – 260; R2 = 0.62) was found between Cu and C1/CT (Fig. 3b). For Ni a strong (R2 = 0.96) and significant (P < 0.001) linear relationship (y = –20 000x + 6800) was observed with C1/CT (Fig. 3c). Finally, a weak (R2 = 0.33), but statistically significant (P = 0.01) decreasing exponential relationship (y = 560e(–5.3x)) was found between Zn and C3/CT (Fig. 3h).
In terms of the ubiquitous humic-like DOM fluorescence component (C1), the positive linear relationships between %aFAopt and C1/CT for Cd and Cu (Fig. 3a, b) suggest that with an increase in the relative contribution of this component in the lakewater samples, the proportion of the DOM that is involved in Cd and Cu complexation increases. In contrast, a negative linear relationship was found for Ni (Fig. 3c), indicating a decrease in the binding capacity of the DOM for Ni. With respect to the allochthonous-like DOM component (C3), the negative exponential relationships between %aFAopt and C3/CT for Cd and Zn (Fig. 3e, h) suggest that with an increase in the allochthonous signature of the DOM in the lakewater samples, the proportion of the DOM that is involved in Cd and Zn complexation decreases. In contrast, a weak but positive relationship with the C3/CT ratio was found for Ni – as the allochthonous signature of the DOM in the lake samples decreases, the binding activity of the DOM for Ni increases. This singular behaviour of Ni, as demonstrated by the contrast between Fig. 3c and 3g and the comparable plots for the other metals, suggests that the DOM binding sites active in Cd, Cu and Zn complexation are different from those involved in Ni complexation. To our knowledge, this is the first time that such a distinction has been resolved in natural water samples.
Admittedly the relationships shown in Fig. 3 will have to be explored over a wider range of DOM samples, but they do support our original idea that the proportion of DOM active in metal complexation could be estimated on the basis of its fluorescence signature and then introduced into chemical equilibrium models such as WHAM. To test this idea, we incorporated each lake’s optimised %aFA value, as calculated from the relationship between %aFA optimised and C1/CT or C3/CT for each metal and lake (i.e. the regressions shown in Fig. 3), into WHAM and re-ran the chemical equilibrium simulations to predict the free M2+ concentrations; this was done for each metal, since the optimised %aFA value is metal-specific. Fig. 4 depicts the comparison between these ‘improved’ WHAM calculations of free M2+ and the measured free M2+ concentrations. Compared with the results presented in Fig. 1, the greatest improvement using the C1/CT ratio was found for nickel, for which the modelled free Ni2+ decreased to within at most a factor of 1.3 difference from the measured free Ni2+ concentrations. For Cd2+ and Zn2+, metals for which the original WHAM predictions were already good, no improvement was noted (indeed the agreement was slightly worse than with the arbitrary value of 65 % active FA). Although the WHAM calculation of free Ni2+ in our lakes was improved by estimating the proportion of FAs active in Ni complexation from the spectroscopic quality of DOM, the estimated %aFA was still unrealistically high, as mentioned earlier. Nevertheless, the idea of using the spectroscopic quality of DOM as a proxy for the proportion of DOM that is active in metal complexation remains promising.
|
Conclusions
The main goal of this study was to explore the possibility of incorporating a measure of the quality of DOM into chemical speciation models, such as WHAM, to improve their predictions of trace metal speciation in natural aquatic systems. For Cd, Cu, Ni and Zn, we have shown that such an approach is feasible, using simple fluorescence measurements on lakewater DOM to estimate the proportion of DOM that is actively involved in metal complexation (as was done in generating Fig. 4). However, our results have also indicated that in addition to adjustments to the metal-binding capacity of the DOM, it may also be necessary to adjust the affinity constants that are used by WHAM to calculate the speciation of some metals, especially Ni; the possibility of using the spectroscopic properties of DOM to predict its metal-binding affinity should be explored. The possible involvement of ligands other than FA and HA in metal complexation should also be considered, particularly for samples with low total trace metal concentrations. Improved trace metal speciation predictions, especially at low, environmentally significant metal concentrations, will be important not only for geochemical studies, but also for the prediction of chronic toxicity in natural aquatic systems (e.g. as part of models such as the Biotic Ligand Model or BLM[45]).
Acknowledgements
The authors acknowledge the technical assistance provided by M. G. Bordeleau, S. Duval, P. Fournier and J. Perreault in the laboratory and P. Girard and A. Crémazy in the field. Sampling was greatly facilitated by the personnel of the Laurentian University Cooperative Freshwater Ecology Unit, led by J. Gunn, in the Sudbury area and by L. Jourdain of the Ministère des Ressources naturelles et de la Faune du Québec in the Rouyn-Noranda area. Access to limnological data for the Sudbury area lakes was provided by Stephen Monet of the City of Greater Sudbury. Financial support was provided by the Natural Sciences and Engineering Research Council of Canada and by the Metals in the Human Environment Research Network (www.mithe-rn.org). P. G. C. Campbell and C. Fortin are supported by the Canada Research Chair Program. S. Lofts acknowledges the support of the UK Natural Environment Research Council.
References
[1] G. E. Batley, S. C. Apte, J. L. Stauber, Speciation and bioavailability of trace metals in water: progress since 1982. Aust. J. Chem. 2004, 57, 903.| Speciation and bioavailability of trace metals in water: progress since 1982.Crossref | GoogleScholarGoogle Scholar | 1:CAS:528:DC%2BD2cXps1Sjsr8%3D&md5=0277b0b4c91ae78217c7428ca63725ceCAS |
[2] L. E. Doig, K. Liber, Nickel speciation in the presence of different sources and fractions of dissolved organic matter. Ecotoxicol. Environ. Saf. 2007, 66, 169.
| Nickel speciation in the presence of different sources and fractions of dissolved organic matter.Crossref | GoogleScholarGoogle Scholar | 1:CAS:528:DC%2BD28Xht1KltLzO&md5=5684fc8aa83f4938b9a455302e4448c4CAS |
[3] C. Fortin, Y. Couillard, B. Vigneault, P. G. C. Campbell, Determination of free Cd, Cu and Zn concentrations in lake waters by in situ diffusion followed by column equilibration ion-exchange. Aquat. Geochem. 2010, 16, 151.
| Determination of free Cd, Cu and Zn concentrations in lake waters by in situ diffusion followed by column equilibration ion-exchange.Crossref | GoogleScholarGoogle Scholar | 1:CAS:528:DC%2BD1MXhsFyjt7rN&md5=790ca97c9d49d13c4bca46bdc788f8d3CAS |
[4] I. A. M. Worms, K. J. Wilkinson, Determination of Ni2+ using an equilibrium ion exchange technique: Important chemical factors and applicability to environmental samples. Anal. Chim. Acta 2008, 616, 95.
| Determination of Ni2+ using an equilibrium ion exchange technique: Important chemical factors and applicability to environmental samples.Crossref | GoogleScholarGoogle Scholar | 1:CAS:528:DC%2BD1cXlvVWjur8%3D&md5=b3cabce9c72ef8262641d8cd8faa5255CAS |
[5] H. B. Xue, W. G. Sunda, Comparison of [Cu2+] measurements in lake water determined by ligand exchange and cathodic stripping voltammetry and by ion-selective electrode. Environ. Sci. Technol. 1997, 31, 1902.
| Comparison of [Cu2+] measurements in lake water determined by ligand exchange and cathodic stripping voltammetry and by ion-selective electrode.Crossref | GoogleScholarGoogle Scholar | 1:CAS:528:DyaK2sXjsVSltLc%3D&md5=f24f70f8cf055b573d713a4674c1520dCAS |
[6] J. Rachou, C. Gagnon, S. Sauvé, Use of an ion-selective electrode for free copper measurements in low salinity and low ionic strength matrices. Environ. Chem. 2007, 4, 90.
| Use of an ion-selective electrode for free copper measurements in low salinity and low ionic strength matrices.Crossref | GoogleScholarGoogle Scholar | 1:CAS:528:DC%2BD2sXkt1entb8%3D&md5=501303f99a10d5decfacc31d0c7fbc44CAS |
[7] H. B. Xue, L. Sigg, Free cupric ion concentration and CuII speciation in a eutrophic lake. Limnol. Oceanogr. 1993, 38, 1200.
| Free cupric ion concentration and CuII speciation in a eutrophic lake.Crossref | GoogleScholarGoogle Scholar | 1:CAS:528:DyaK2cXit1Kiu7s%3D&md5=980af40b305e9c5a32f9e704fb983b78CAS |
[8] L. Sigg, F. Black, J. Buffle, J. Cao, R. Cleven, W. Davison, J. Galceran, P. Gunkel, E. Kalis, D. Kistler, M. Martin, S. Noel, Y. Nur, N. Odzak, J. Puy, W. Van Riemsdijk, E. Temminghoff, M. L. Tercier-Waeber, S. Toepperwien, R. M. Town, E. Unsworth, K. W. Warnken, L. P. Weng, H. B. Xue, H. Zhang, Comparison of analytical techniques for dynamic trace metal speciation in natural freshwaters. Environ. Sci. Technol. 2006, 40, 1934.
| Comparison of analytical techniques for dynamic trace metal speciation in natural freshwaters.Crossref | GoogleScholarGoogle Scholar | 1:CAS:528:DC%2BD28Xht1yhsLk%3D&md5=a2f0df1b475e20000d4d274ad0c46b1bCAS |
[9] L. Weng, F. Alonso Vega, W. H. Van Riemsdijk, Strategies in the application of the Donnan membrane technique. Environ. Chem. 2011, 8, 466.
| Strategies in the application of the Donnan membrane technique.Crossref | GoogleScholarGoogle Scholar | 1:CAS:528:DC%2BC3MXhtlykt7zL&md5=35a795ff71716de43142527e61cbe5adCAS |
[10] Y. Dudal, F. Gérard, Accounting for natural organic matter in aqueous chemical equilibrium models: a review of the theories and applications. Earth Sci. Rev. 2004, 66, 199.
| Accounting for natural organic matter in aqueous chemical equilibrium models: a review of the theories and applications.Crossref | GoogleScholarGoogle Scholar | 1:CAS:528:DC%2BD2cXmtVagt7g%3D&md5=251389b0422cbf462a02a8109726326eCAS |
[11] F. M. M. Morel, J. G. Hering, Complexation, in Principles and Applications of Aquatic Chemistry 1993, pp. 358–395 (Wiley: New York).
[12] E. R. Unsworth, K. W. Warnken, H. Zhang, W. Davison, F. Black, J. Buffle, J. Cao, R. Cleven, J. Galceran, P. Gunkel, E. Kalis, D. Kistler, H. P. van Leeuwen, M. Martin, S. Noel, Y. Nur, O. Odzak, J. Puy, W. Van Riemsdijk, L. Sigg, E. Temminghoff, M. L. Tercier-Waeber, S. Toepperwein, R. M. Town, L. Weng, H. Xue, Model predictions of metal speciation in freshwaters compared to measurements by in situ techniques. Environ. Sci. Technol. 2006, 40, 1942.
| Model predictions of metal speciation in freshwaters compared to measurements by in situ techniques.Crossref | GoogleScholarGoogle Scholar | 1:CAS:528:DC%2BD28XhtlSku7o%3D&md5=f1372c913c38a7567823d9613a4bb5f1CAS |
[13] J. W. Guthrie, N. M. Hassan, M. S. A. Salam, I. I. Fasfous, C. A. Murimboh, J. Murimboh, C. L. Chakrabarti, D. C. Grégoire, Complexation of Ni, Cu, Zn, and Cd by DOC in some metal-impacted freshwater lakes: a comparison of approaches using electrochemical determination of free-metal-ion and labile complexes and a computer speciation model, WHAM V and VI. Anal. Chim. Acta 2005, 528, 205.
| Complexation of Ni, Cu, Zn, and Cd by DOC in some metal-impacted freshwater lakes: a comparison of approaches using electrochemical determination of free-metal-ion and labile complexes and a computer speciation model, WHAM V and VI.Crossref | GoogleScholarGoogle Scholar | 1:CAS:528:DC%2BD2MXkslyhsg%3D%3D&md5=56b7b6cdf476a2c55fba3482ac78ea2eCAS |
[14] S. Lofts, E. Tipping, Assessing WHAM/Model VII against field measurements of free metal ion concentrations: model performance and the role of uncertainty in parameters and inputs. Environ. Chem. 2011, 8, 501.
| Assessing WHAM/Model VII against field measurements of free metal ion concentrations: model performance and the role of uncertainty in parameters and inputs.Crossref | GoogleScholarGoogle Scholar | 1:CAS:528:DC%2BC3MXhtlykt73J&md5=eab116143df2f4e68a9a47f9c7355c7fCAS |
[15] J. G. Richards, P. J. Curtis, B. K. Burnison, R. C. Playle, Effects of natural organic matter source on reducing metal toxicity to rainbow trout (Oncorhynchus mykiss) and on metal binding to their gills. Environ. Toxicol. Chem. 2001, 20, 1159.
| 1:CAS:528:DC%2BD3MXls1Sgtrk%3D&md5=504d4852751ee27900177506f4261801CAS |
[16] C. D. Luider, J. Crusius, R. C. Playle, P. J. Curtis, Influence of natural organic matter source on copper speciation as demonstrated by Cu binding to fish gills, by ion selective electrode, and by DGT gel sampler. Environ. Sci. Technol. 2004, 38, 2865.
| Influence of natural organic matter source on copper speciation as demonstrated by Cu binding to fish gills, by ion selective electrode, and by DGT gel sampler.Crossref | GoogleScholarGoogle Scholar | 1:CAS:528:DC%2BD2cXjt1ajt74%3D&md5=90994dee1df6d19381d8eb4c80649fd1CAS |
[17] F. Amery, F. Degryse, K. Cheyns, I. De Troyer, J. Mertens, R. Merckx, E. Smolders, The UV-absorbance of dissolved organic matter predicts the fivefold variation in its affinity for mobilizing Cu in an agricultural soil horizon. Eur. J. Soil Sci. 2008, 59, 1087.
| The UV-absorbance of dissolved organic matter predicts the fivefold variation in its affinity for mobilizing Cu in an agricultural soil horizon.Crossref | GoogleScholarGoogle Scholar | 1:CAS:528:DC%2BD1MXmvV2luw%3D%3D&md5=38c0aa825649d7c4fe403915d5bf0fb0CAS |
[18] J. Y. Cornu, A. Schneider, K. Jezequel, L. Denaix, Modelling the complexation of Cd in soil solution at different temperatures using the UV-absorbance of dissolved organic matter. Geoderma 2011, 162, 65.
| Modelling the complexation of Cd in soil solution at different temperatures using the UV-absorbance of dissolved organic matter.Crossref | GoogleScholarGoogle Scholar | 1:CAS:528:DC%2BC3MXjsFyrsbs%3D&md5=e7b0d05bbd7315cd2754d98ef56d1c41CAS |
[19] J. Y. Cornu, C. Parat, A. Schneider, L. Authier, M. Dauthieu, V. Sappin-Didier, L. Denaix, Cadmium speciation assessed by voltammetry, ion exchange and geochemical calculation in soil solutions collected after soil rewetting. Chemosphere 2009, 76, 502.
| Cadmium speciation assessed by voltammetry, ion exchange and geochemical calculation in soil solutions collected after soil rewetting.Crossref | GoogleScholarGoogle Scholar | 1:CAS:528:DC%2BD1MXmsVSjtrs%3D&md5=773c2f2ae84912f73fc4e7b6aeed23beCAS |
[20] K. K. Mueller, C. Fortin, P. G. C. Campbell, Spatial variation in the optical properties of dissolved organic matter (DOM) in lakes on the Canadian Precambrian shield and links to watershed characteristics. Aquat. Geochem. 2012, 18, 21.
| Spatial variation in the optical properties of dissolved organic matter (DOM) in lakes on the Canadian Precambrian shield and links to watershed characteristics.Crossref | GoogleScholarGoogle Scholar | 1:CAS:528:DC%2BC3MXhsFKkurjP&md5=50babe44ef0da65a64fe2369bd9eba22CAS |
[21] U. Borgmann, T. B. Reynoldson, F. Rosa, W. P. Norwood, Final report on the effects of atmospheric deposition of metals from the Sudbury smelters on aquatic ecosystems. Report number 01-023 1998 (Environment Canada: Burlington, ON, Canada).
[22] A. S. Dixit, S. Alpay, S. S. Dixit, J. P. Smol, Paleolimnological reconstructions of Rouyn-Noranda lakes within the zone of influence of the Horne Smelter, Quebec, Canada. J. Paleolimnol. 2007, 38, 209.
| Paleolimnological reconstructions of Rouyn-Noranda lakes within the zone of influence of the Horne Smelter, Quebec, Canada.Crossref | GoogleScholarGoogle Scholar |
[23] N. D. Yan, G. E. Miller, Effects of deposition of acids and metals on chemistry and biology of lakes near Sudbury, Ontario, in Environmental Impacts of Smelters (Ed. J. O. Nriagu) 1984, pp. 243–282 (Wiley: New York).
[24] J. L. Weishaar, G. R. Aiken, B. A. Bergamaschi, M. S. Fram, R. Fujii, K. Mopper, Evaluation of specific ultraviolet absorbance as an indicator of the chemical composition and reactivity of dissolved organic carbon. Environ. Sci. Technol. 2003, 37, 4702.
| Evaluation of specific ultraviolet absorbance as an indicator of the chemical composition and reactivity of dissolved organic carbon.Crossref | GoogleScholarGoogle Scholar | 1:CAS:528:DC%2BD3sXotFCgtLY%3D&md5=58bd455466851062a59f45487baf88c4CAS |
[25] R. M. Cory, M. P. Miller, D. M. McKnight, J. J. Guerard, P. L. Miller, Effect of instrument-specific response on the analysis of fulvic acid fluorescence spectra. Limnol. Oceanogr. Methods 2010, 8, 67.
| Effect of instrument-specific response on the analysis of fulvic acid fluorescence spectra.Crossref | GoogleScholarGoogle Scholar | 1:CAS:528:DC%2BC3MXjt1WmtLs%3D&md5=a88814e7896ee14fef6075003ae88901CAS |
[26] D. McKnight, M. E. W. Boyer, P. K. Westerhoff, P. T. Doran, T. Kulbe, D. T. Andersen, Spectrofluorometric characterization of dissolved organic matter for identification of precursor organic material and aromaticity. Limnol. Oceanogr. 2001, 46, 38.
| Spectrofluorometric characterization of dissolved organic matter for identification of precursor organic material and aromaticity.Crossref | GoogleScholarGoogle Scholar | 1:CAS:528:DC%2BD3MXhtFKjtrk%3D&md5=e9344fced0215bcbe11eb012b55cfac8CAS |
[27] C. A. Stedmon, R. Bro, Characterizing dissolved organic matter fluorescence with parallel factor analysis: a tutorial. Limnol. Oceanogr. Methods 2008, 6, 572.
| Characterizing dissolved organic matter fluorescence with parallel factor analysis: a tutorial.Crossref | GoogleScholarGoogle Scholar | 1:CAS:528:DC%2BD1MXhtVWqsL%2FL&md5=2e23d75cd51ac3eb285524972010c901CAS |
[28] C. A. Andersson, R. Bro, The N-way Toolbox for MATLAB. Chemom. Intell. Lab. Syst. 2000, 52, 1.
| The N-way Toolbox for MATLAB.Crossref | GoogleScholarGoogle Scholar | 1:CAS:528:DC%2BD3cXlt1yqtrc%3D&md5=e55cbcd09d13b90f38fbe759188c751dCAS |
[29] C. Fortin, P. G. C. Campbell, An ion-exchange technique for free-metal ion measurements (Cd2+, Zn2+): applications to complex aqueous media. Int. J. Environ. Anal. Chem. 1998, 72, 173.
| An ion-exchange technique for free-metal ion measurements (Cd2+, Zn2+): applications to complex aqueous media.Crossref | GoogleScholarGoogle Scholar | 1:CAS:528:DC%2BD3cXis12gtLY%3D&md5=06b1e1af80875ff376ebd1ffdafa1207CAS |
[30] E. Tipping, Humic ion-binding Model VI: an improved description of the interactions of protons and metal ions with humic substances. Aquat. Geochem. 1998, 4, 3.
| Humic ion-binding Model VI: an improved description of the interactions of protons and metal ions with humic substances.Crossref | GoogleScholarGoogle Scholar | 1:CAS:528:DyaK1cXntlSjuro%3D&md5=bf2a0d3b7e8f4f604d20a53fa9cf3001CAS |
[31] J. Buffle, Complexation Reactions in Aquatic Systems: An Analytical Approach 1988 (Ellis Horwood Ltd: Chichester, UK).
[32] S. E. Bryan, E. Tipping, J. Hamilton-Taylor, Comparison of measured and modelled copper binding by natural organic matter in freshwaters. Comp. Biochem. Physiol. C: Toxicol. Pharmacol. 2002, 133, 37.
| Comparison of measured and modelled copper binding by natural organic matter in freshwaters.Crossref | GoogleScholarGoogle Scholar | 1:STN:280:DC%2BD38nmsFGhtA%3D%3D&md5=60eeaebbda445ed29a4366edc6c781c8CAS |
[33] S. Lofts, E. Tipping, J. Hamilton-Taylor, The chemical speciation of FeIII in freshwaters. Aquat. Geochem. 2008, 14, 337.
| The chemical speciation of FeIII in freshwaters.Crossref | GoogleScholarGoogle Scholar | 1:CAS:528:DC%2BD1cXht12gtLzN&md5=f89c1fc5138a6678b60a7da8e58a12eeCAS |
[34] E. Tipping, Modelling Al competition for heavy metal binding by dissolved organic matter in soil and surface waters of acid and neutral pH. Geoderma 2005, 127, 293.
| Modelling Al competition for heavy metal binding by dissolved organic matter in soil and surface waters of acid and neutral pH.Crossref | GoogleScholarGoogle Scholar | 1:CAS:528:DC%2BD2MXls1yhsr4%3D&md5=36040b75a63564bb9743a643f0e9aa58CAS |
[35] E. Tipping, C. Rey-Castro, S. E. Bryan, J. Hamilton-Taylor, AlIII and FeIII binding by humic substances in freshwaters, and implications for trace metal speciation. Geochim. Cosmochim. Acta 2002, 66, 3211.
| AlIII and FeIII binding by humic substances in freshwaters, and implications for trace metal speciation.Crossref | GoogleScholarGoogle Scholar | 1:CAS:528:DC%2BD38XmslKktbk%3D&md5=805da80962df84e014033404c314d664CAS |
[36] J. Dupont, Quebec lake survey: II. Origin and extent of acidification. Water Air Soil Pollut. 1992, 61, 125.
| Quebec lake survey: II. Origin and extent of acidification.Crossref | GoogleScholarGoogle Scholar | 1:CAS:528:DyaK38XhtlGrtr8%3D&md5=1da5af42cb78c5e24f9f4ef5aed6a514CAS |
[37] W. Keller, N. Yan, J. Gunn, J. Heneberry, Recovery of acidified lakes: lessons from Sudbury, Ontario, Canada. Water Air Soil Pollut. Focus 2007, 7, 317.
| Recovery of acidified lakes: lessons from Sudbury, Ontario, Canada.Crossref | GoogleScholarGoogle Scholar | 1:CAS:528:DC%2BD2sXks1CqtLw%3D&md5=bc87933687dd231cf4c7b656c488c17bCAS |
[38] Y. Couillard, M. Courcelles, A. Cattaneo, S. Wunsam, A test of the integrity of metal records in sediment cores based on the documented history of metal contamination in Lac Dufault (Québec, Canada). J. Paleolimnol. 2004, 32, 149.
| A test of the integrity of metal records in sediment cores based on the documented history of metal contamination in Lac Dufault (Québec, Canada).Crossref | GoogleScholarGoogle Scholar |
[39] E. Tipping, Cation Binding by Humic Substances 2002 (Cambridge University Press: Cambridge, UK).
[40] E. Tipping, S. Lofts, J. E. Sonke, Humic Ion-Binding Model VII: a revised parameterisation of cation-binding by humic substances. Environ. Chem. 2011, 8, 225.
| Humic Ion-Binding Model VII: a revised parameterisation of cation-binding by humic substances.Crossref | GoogleScholarGoogle Scholar | 1:CAS:528:DC%2BC3MXptVWrsL0%3D&md5=dc5bbdc3aa7c8b3678f6540c7c09481fCAS |
[41] A. M. Mota, M. M. Correia Dos Santos, Trace metal speciation of labile chemical species: Electrochemical methods, in Metal Speciation and Bioavailability in Aquatic Systems (Eds A. Tessier, D. Turner) 1995, pp. 205–57 (Wiley: Chichester, UK).
[42] L. Van Laer, E. Smolders, F. Degryse, C. Janssen, K. A. C. De Schamphelaere, Speciation of nickel in surface waters measured with the Donnan membrane technique. Anal. Chim. Acta 2006, 578, 195.
| Speciation of nickel in surface waters measured with the Donnan membrane technique.Crossref | GoogleScholarGoogle Scholar | 1:CAS:528:DC%2BD28XhtVSitrjJ&md5=41d39fddef0386842968df2b9278f807CAS |
[43] S. Baken, F. Degryse, L. Verheyen, R. Merckx, E. Smolders, Metal complexation properties of freshwater dissolved organic matter are explained by its aromaticity and by anthropogenic ligands. Environ. Sci. Technol. 2011, 45, 2584.
| Metal complexation properties of freshwater dissolved organic matter are explained by its aromaticity and by anthropogenic ligands.Crossref | GoogleScholarGoogle Scholar | 1:CAS:528:DC%2BC3MXjtFKqtbo%3D&md5=c0bbc4e382f0d516bbdf129a93b4e2e6CAS |
[44] J. B. Fellman, E. Hood, R. G. M. Spencer, Fluorescence spectroscopy opens new windows into dissolved organic matter dynamics in freshwater ecosystems: a review. Limnol. Oceanogr. 2010, 55, 2452.
| Fluorescence spectroscopy opens new windows into dissolved organic matter dynamics in freshwater ecosystems: a review.Crossref | GoogleScholarGoogle Scholar | 1:CAS:528:DC%2BC3cXhs1emtL3E&md5=33fe78e1d3d465aeb734723b3905ff52CAS |
[45] V. I. Slaveykova, K. J. Wilkinson, Predicting the bioavailability of metals and metal complexes: critical review of the Biotic Ligand Model. Environ. Chem. 2005, 2, 9.
| Predicting the bioavailability of metals and metal complexes: critical review of the Biotic Ligand Model.Crossref | GoogleScholarGoogle Scholar | 1:CAS:528:DC%2BD2MXisV2it7Y%3D&md5=01b01c9c451cf6f59545763443cc5783CAS |
[46] E. J. J. Kalis, L. P. Weng, F. Dousma, E. J. M. Temminghoff, W. H. Van Riemsdijk, Measuring free metal ion concentrations in situ in natural waters using the Donnan Membrane Technique. Environ. Sci. Technol. 2006, 40, 955.
| Measuring free metal ion concentrations in situ in natural waters using the Donnan Membrane Technique.Crossref | GoogleScholarGoogle Scholar | 1:CAS:528:DC%2BD2MXhtlars7rK&md5=cebb0b651ebb12a50f6d132239309993CAS |
[47] Y. Gopalapillai, I. I. Fasfous, J. D. Murimboh, T. Yapici, P. Chakraborty, C. L. Chakrabarti, Determination of free nickel ion concentrations using the ion exchange technique: application to aqueous mining and municipal effluents. Aquat. Geochem. 2008, 14, 99.
| Determination of free nickel ion concentrations using the ion exchange technique: application to aqueous mining and municipal effluents.Crossref | GoogleScholarGoogle Scholar | 1:CAS:528:DC%2BD1cXltFeiur0%3D&md5=b5a5eb56f2dafd033113e5f6947081f4CAS |
[48] H. B. Xue, A. Oestreich, D. Kistler, L. Sigg, Free cupric ion concentrations and Cu complexation in selected Swiss lakes and rivers. Aquat. Sci. 1996, 58, 69.
| Free cupric ion concentrations and Cu complexation in selected Swiss lakes and rivers.Crossref | GoogleScholarGoogle Scholar |
[49] H. B. Xue, L. Sigg, Zinc speciation in lake waters and its determination by ligand exchange with EDTA and differential pulse anodic stripping voltammetry. Anal. Chim. Acta 1994, 284, 505.
| Zinc speciation in lake waters and its determination by ligand exchange with EDTA and differential pulse anodic stripping voltammetry.Crossref | GoogleScholarGoogle Scholar |