

Revising upper-ocean sulfur dynamics near Bermuda: new lessons from 3 years of concentration and rate measurements
Naomi M. Levine A B F , Dierdre A. Toole A , Aimee Neeley C , Nicholas R. Bates D , Scott C. Doney A and John W. H. Dacey EA Marine Chemistry and Geochemistry, Woods Hole Oceanographic Institution, 266 Woods Hole Road, Woods Hole, MA 02543, USA.
B Department of Biological Sciences, University of Southern California, 3616 Trousdale Parkway, Los Angeles, CA 90089, USA.
C Science Systems and Applications, Inc., 10210 Greenbelt Road, Suite 600, Lanham, MD 20706, USA.
D Bermuda Institute of Ocean Sciences, 17 Biological Station, Ferry Reach, St George’s, GE 01, Bermuda.
E Biology, Woods Hole Oceanographic Institution, 266 Woods Hole Road, Woods Hole, MA 02543, USA.
F Corresponding author. Email: n.levine@usc.edu
Environmental Chemistry 13(2) 302-313 https://doi.org/10.1071/EN15045
Submitted: 2 March 2015 Accepted: 13 July 2015 Published: 10 November 2015
Journal Compilation © CSIRO Publishing 2016 Open Access CC BY-NC-ND
Environmental context. Microscopic marine organisms have the potential to influence the global climate through the production of a trace gas, dimethylsulfide, which contributes to cloud formation. Using 3 years of observations, we investigated the environmental drivers behind the production and degradation of dimethylsulfide and its precursor dimethylsulfoniopropionate. Our results highlight the important role of the microbial community in rapidly cycling these compounds and provide an important dataset for future modelling studies.
Abstract. Oceanic biogeochemical cycling of dimethylsulfide (DMS), and its precursor dimethylsulfoniopropionate (DMSP), has gained considerable attention over the past three decades because of the potential role of DMS in climate mediation. Here we report 3 years of monthly vertical profiles of organic sulfur cycle concentrations (DMS, particulate DMSP (DMSPp) and dissolved DMSP (DMSPd)) and rates (DMSPd consumption, biological DMS consumption and DMS photolysis) from the Bermuda Atlantic Time-series Study (BATS) site taken between 2005 and 2008. Concentrations confirm the summer paradox with mixed layer DMS peaking ~90 days after peak DMSPp and ~50 days after peak DMSPp : Chl. A small decline in mixed layer DMS was observed relative to those measured during a previous study at BATS (1992–1994), potentially driven by long-term climate shifts at the site. On average, DMS cycling occurred on longer timescales than DMSPd (0.43 ± 0.35 v. 1.39 ± 0.76 day–1) with DMSPd consumption rates remaining elevated throughout the year despite significant seasonal variability in the bacterial DMSP degrader community. DMSPp was estimated to account for 4–5 % of mixed layer primary production and turned over at a significantly slower rate (~0.2 day–1). Photolysis drove DMS loss in the mixed layer during the summer, whereas biological consumption of DMS was the dominant loss process in the winter and at depth. These findings offer new insight into the underlying mechanisms driving DMS(P) cycling in the oligotrophic ocean, provide an extended dataset for future model evaluation and hypothesis testing and highlight the need for a reexamination of past modelling results and conclusions drawn from data collected with old methodologies.
Introduction
The global climate system consists of an intricate network of interactions and feedbacks. Understanding the underlying mechanisms that determine how these dynamics might change in response to perturbation is necessary for predicting how global temperature and other climate variables might change in the future. The upper ocean sulfur cycle has gained considerable attention because of its potential to generate a negative climate feedback in response to warming. In 1987, Charlson, Lovelock, Andreae and Warren[1] proposed the CLAW hypothesis, which suggested that phytoplankton may be able to mediate the climate through the production of the climatically relevant gas dimethylsulfide (DMS). As a reduced sulfur compound, once ventilated to the atmosphere, DMS is oxidised to sulfate aerosols and other products, many of which act as cloud condensation nuclei (CCN). Changes in the abundance and characteristics of aerosols, CCN and clouds alter the radiative heat balance of the Earth and therefore affect temperatures and radiation (both ultraviolet (UV) and photosynthetically active) at the Earth’s surface. Charlson et al. hypothesise that, if the production of DMS is enhanced by increased temperatures, the upper ocean sulfur cycle may contribute a substantial negative feedback on the climate system through the increase in sulfate aerosols and CCN and subsequent decrease in surface radiation and temperature.
Over the subsequent three decades since the proposal of the CLAW hypothesis, much has been learned about upper ocean sulfur cycling dynamics. The primary precursor of DMS is dimethylsulfoniopropionate (DMSP), which is synthesised by phytoplankton in surface waters. Suggested physiological functions for DMSP range from an osmolyte,[2,3] to an anti-oxidant,[4] to a strategy for coping with unbalanced growth (carbon over-flow).[5] DMSP is then either enzymatically cleaved to DMS directly by phytoplankton or is released into the water column through cell senescence, viral lysis and grazing. The majority of phytoplankton DMSP (particulate DMSP, DMSPp) enters the dissolved phase (DMSPd) either directly or indirectly[6] and is rapidly cycled by the portion of the heterotrophic community that degrade DMSP. This occurs via two enzymatically mediated pathways: the demethylation pathway that excludes DMS as a product,[7] and the cleavage pathway that produces DMS and a three carbon compound (e.g. 3-hydroypropionate or acrylate).[8] Recent molecular genetics work has shown that the capacity to degrade DMSP is widespread with up to 60 % of bacterioplankton possessing DMSP degradation genes.[9] DMS is then lost from the water column through photolysis, bacterial consumption and ventilation to the atmosphere.[10] Although only a small fraction (<5 %) of DMSP synthesised by phytoplankton is believed to be ventilated to the atmosphere as DMS,[6,11] recent work estimates that DMS constitutes a flux of 28.1 Tg S year–1 to the atmosphere[12] contributing 18–42 % of the contemporary global atmospheric sulfate aerosol mass (see Woodhouse et al.,[13] and references therein). Despite an improved understanding of DMS and DMSP (DMS(P)) cycling, the mechanisms driving variations in the production and consumption of DMS(P) remain uncertain. Specifically, better constraints on the environmental drivers behind shifts in DMS(P) production and loss processes are necessary in order to accurately predict how the system may respond to climate perturbations.
By repeatedly sampling a single regime under varying environmental conditions, time-series datasets provide powerful insight into mechanism and allow for the development and testing of hypotheses directly from in situ data. The Bermuda Atlantic Time-series Study (BATS) site, and its companion site Hydrostation S, provide one of the longest oceanographic time-series datasets and have been instrumental in improving our understanding of oligotrophic ocean physics, chemistry and biology. In 1998, Dacey et al.,[14] hereafter referred to as D98, published a 2-year dataset of monthly DMS, DMSPp and DMSPd concentrations measurements from the BATS and Hydrostation S sites made between 1992 and 1993. This keystone work has been used extensively for hypothesis generation, most notably the classic DMS(P) ‘summer paradox’ hypothesis,[15] and model validation. This dataset has remained a valuable resource because of its temporal and vertical resolution and length (extended to a total of 3 years from 1992 to 1994). Recently, Levine et al.[16] presented an in-depth analysis of seasonal variations in the heterotrophic DMSP degrader community and changes in potential DMSP lyase enzyme activity at the site (February to November 2008). Here we present 3 years of monthly DMS(P) data from BATS collected from 2005 to 2008, 15 years after the original D98 measurements. With the use of improved methodologies and the addition of critical rate measurements, this study builds on the previous findings and provides new insight into the mechanisms behind DMS(P) cycling in the oligotrophic ocean.
Methods
Sample collection
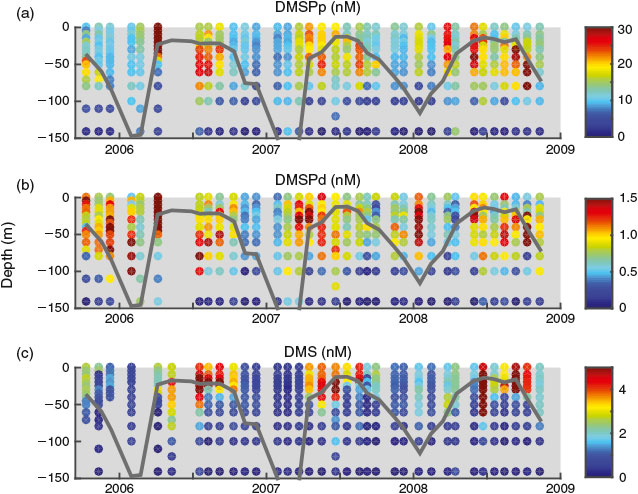
The BATS site is located in the Sargasso Sea (31°40′N, 64°10′W) at a water depth of 4680 m and has been sampled monthly since 1988. This site is characterised by deep winter mixing followed by stratified, oligotrophic conditions during the summer months (Fig. 1). A second site, Hydrostation S, is located 60 km north-west of BATS closer to the island of Bermuda (32°10′N, 64°30′W) and has been sampled biweekly since 1954. This study was conducted entirely at the BATS site while D98 was conducted primarily at Hydrostation S with some sampling at BATS. A comparison of the two sites shows very similar seasonal dynamics in physical and chemical properties with some small differences, most notably BATS displays a slightly stronger seasonal cycle in temperature and salinity.[17]
|
Our 3-year organic sulfur time-series was conducted at BATS from November 2005 to November 2008. Monthly samples were collected from the upper 140 m for DMS and DMSP concentrations (12 depths: 0, 10, 15, 20, 25, 30, 40, 50, 60, 80, 100 and 140 m) and rate measurements (6 depths: 0, 10, 20, 40, 60 and 100 m). All samples were collected before dawn, generally between 0500 and 0700 hours local time, from a dedicated cast. In addition, a full suite of ancillary measurements were made by BATS scientists including temperature, salinity, oxygen concentrations, nutrient concentrations, dissolved inorganic and organic carbon concentrations, chlorophyll-a (Chl) concentrations, cell counts, bacterial carbon demand and phytoplankton primary production (http://bats.bios.edu, accessed July 2013[18,19]). Mixed layer depth (MLD) was calculated as the minimum depth where the potential density (σθ) was greater than the potential density calculated using surface water salinity and surface temperature minus 0.2 °C.[20]
Monthly vertical profiles of spectral downwelling irradiance for 10 wavelengths (324–683 nm) were taken using a Satlantic SeaWiFS Profiling Multichannel Radiometer (SPMR) coupled to a continuously sampling SeaWiFS Multichannel Surface Reference (SMSR). The data were collected and processed by the University of California, Santa Barbara (UCSB) Bermuda Bio-Optics Project.[21] Daily average and cruise average surface radiation doses were calculated from integrated SMSR data. Gaps in the data were interpolated using the best fit of a solar radiation approximation equation.[22] The downwelling spectral diffuse attenuation coefficient (Kd(λ)) was calculated using the best fit to SPMR profiles in the log-linear range.
Duplicate samples for DMS(P) concentration measurements were collected directly from the Niskin bottles using acid washed silicon tubing. DMS concentrations were sampled first and collected in 250-mL, 10 % HCl acid washed glass Qorpak bottles using gentle laminar flow. The bottles were rinsed gently 4–5 times and then filled allowing the bottle to overflow 2–3 volumes to ensure no bubbles or headspace were present. Samples were stored in the dark at in situ temperatures until analysis, which was done immediately after sampling. For DMSPt, 50 mL of whole seawater was collected in 50-mL sterile polypropylene centrifuge tubes containing 175 μL of 50 % H2SO4. Samples for DMSPd analysis were collected following the small volume drip filtration method described by Kiene and Slezak.[23] Briefly, the first 3.5 mL of filtrate was collected via gravity filtration of ~30 mL through a 25-mm GF/F filter (Whatman) into 15-mL sterile polypropylene centrifuge tubes containing 50 μL of 50 % H2SO4. Care was taken to ensure that the filter towers and filters were completely dry before sampling to prevent osmotic shock and that the filters were never allowed to run dry during sample collection. DMSPt and DMSPd samples were shaken immediately after collection to fully acidify the samples and were stored in the dark for >24 h to allow for the oxidation of DMS before analysis. DMSPp was calculated as the difference between DMSPt and DMSPd.
Our sampling protocols followed the current best practices[23–25] and differ significantly from those used by D98, which used the best practices at that time and are described briefly below. For DMSPd quantification, D98 collected samples using gravity filtration of 1 L of whole seawater through a 47-mm GF/F filter (Whatman). The bottle and a graduated cylinder used for sampling were first rinsed three times with the filtrate before a 100-mL sample was collected. The DMSPd samples were then sparged for 30 min at 200 mL min–1 to remove DMS. An additional ~900 mL (total of 1 L) were then filtered through the GF/F filter using low-vacuum pressure. The filters were stored in 10 mL of methanol for DMSPp analysis. Both studies used the same protocol for DMS samples, described above.
DMS(P) concentration analyses
DMSP was converted into DMS through alkaline hydrolysis using 1 mL of 5 N NaOH added to 1 mL of sample for DMSPt and 3 mL of sample for DMSPd in a 10-mL muffled glass serum vial. Samples were immediately crimped following the addition of NaOH and were quantified after a 15-min incubation to allow for complete conversion of DMSP into DMS. DMS concentrations were determined using a purge and trap method after Zemmelink et al.[26] and Kiene and Service.[27] Briefly, DMS was sparged from 4 (DMS and DMSPd) or 2-mL (DMSPt) samples using air or N2 gas and trapped using a Carbopack-X trap in Sulfinert-treated 1/8″ (~0.32 cm) outer diameter (OD) stainless steel tubing. The trapped gases were analysed on a gas chromatograph (GC) using an Alltech AT-Sulfur capillary 0.32-mm internal diameter (ID) column with an OI Corp. pulsed flame photometric detector (PFPD). The average analytical and methodological error for DMSPp, DMSPd and DMS samples was 9, 15 and 12 % respectively (due to elevated percentage errors for samples near the background levels, these errors were calculated using samples above 0.4 nM).
Rate measurements
The turnover rates of DMSPd and DMS were quantified using additions of 35S-DMSP and 35S-DMS at six depths following the protocols of Kiene and Linn.[28] All samples were run in duplicate and quantified using a EcoLume scintillation cocktail (Cardinal Health) and a Packard Tri-Carb 2000CA Liquid Scintillation Analyzer. Specifically, DMSPd consumption was determined by quantifying the disappearance of 35S-DMSP from the dissolved pool. Teflon bottles (33 mL) were gently rinsed three times and filled with ~25 mL of whole seawater using laminar flow to minimise gas exchange and disruption of cells. A trace amount of 35S-DMSP (<0.05 nM) was added to each sample for a final concentration of ~1000 decays per minute (DPM) mL–1. Samples were then incubated in the dark at in situ surface temperatures for 5 h. An initial 1-mL subsample was taken immediately after the tracer was added to quantify the initial 35S-DMSP concentration. At five time-points during the incubation (0, 30, 60, 180 and 300 min), a 5-mL sub-sample was filtered through a 0.2-μm nylon filter using gentle vacuum and 3.5-mL of the filtrate was added to a plastic acidification vial containing 50 μL of 50 % H2SO4. After >24 h of incubation, 200 μL of 5 N NaOH was added to 3 mL of the acidified sample and the resulting 35S-DMS was trapped onto AE glass fibre filters soaked with 200 μL of 3 % H2O2. To ensure complete trapping of 35S-DMS, samples were incubated on a rotary shaker (100 rpm) for >6 h. The filters were then added to EcoLume and counted after a 24-h incubation. DMSPd consumption rates were calculated as:
where kDMSP is the DMSPd loss rate constant calculated as the slope of the best linear fit to the natural log of the change in 35S-DMSP with time. kDMSP is the average of duplicate samples and had a range of 0.02–4.4 day–1 with an average error of 23.4 % for samples significantly above zero. An additional set of experiments were conducted to determine bacterial production of DMS from DMSPd using the conversion of 35S-DMSP into 35S-DMS. However, due to concerns of methodological error, we are not presenting the results from these analyses (see the DMS yield measurements section and Fig. S1 of the Supplementary material).
Bacterial DMS consumption was quantified through the uptake of 35S-DMS. Whole seawater was collected directly from the Niskin bottles into 33-mL Teflon bottles using gentle laminar flow and then carefully transferred to muffled glass serum vials (10 mL). 35S-DMS was then added for a final concentration of ~1000 DPM mL–1. Samples were incubated in the dark at in situ surface temperatures for 6 h. The conversion of 35S-DMS into the non-volatile (particulate or oxidised sulfur) pool over the incubation period was quantified by determining the activity of a 1-mL sub-sample relative to that of a 1-mL sub-sample sparged for 12 min with N2 gas at 100 mL min–1. Control samples using water from 60 m were carried out following the above protocol but with the addition of dimethyl disulfide (DMDS) to a final concentration ~0.3 μM, to inhibit the uptake of DMS.[29] Biological consumption of DMS was calculated as:
where the rate constant k is calculated as:
where 35Sinit is the sample’s initial 35S-DMS activity, 35Sfinal is the sample’s final 35S-DMS activity after sparging and tincubation is the incubation time. kDMS is the average loss rate constant of duplicate samples and was calculated as kDMS = k – kctr, where k is the total loss rate constant and kctr is the dark abiotic loss rate constant. k had a range of 0.1–1.8 day–1 with an average error of 11 % (samples significantly above zero). kctr had an average value of 0.16 ± 0.06 day–1 with an average error of 14 % and showed very little variation with season. Although some fraction of kctr may be attributed to incomplete inhibition of DMS consumption by DMDS, assuming 90 % inhibition by DMDS,[29] this contribution can be estimated to be 0.09 ± 0.04 day–1 over the entire time-series or approximately half the observed kctr. In addition, kctr showed no correlation with k60 m (R2 = 0.008, P = 0.65) suggesting that it is unlikely to be purely a measure of incomplete inhibition. As such, kDMS is a conservative estimate of the biological DMS consumption rate constant and might be slightly biased towards lower values because of an overestimate of the abiotic loss rate constant (see the DMS biological consumption abiotic control section and Fig. S2 of the Supplementary material).
DMS loss through photolysis was quantified through the addition of 35S-DMS to 15 mL of 0.2-μm gravity filtered water for a final concentration of ~1000 DPM mL–1. Samples were incubated in quartz tubes at in situ surface temperatures and radiation for 6 h. The loss of 35S-DMS from the volatile pool was quantified by determining the activity of a 1-mL sub-sample relative to that of a 1-mL sub-sample sparged for 10 min with N2 gas at 100 mL min–1. DMS photolysis was calculated from 35S-DMS loss and UV dose as:

where
and
where kp has units of metres squared moles per photon (m2 mol photon–1), Ed(z) (mol photons m–2 day–1) is the depth-dependent UV dose per day, kincubation (day–1) is the loss rate constant over the incubation period calculated using Eqn 3, tincubation (day) is the incubation period, and Eincubation (mol photons m–2) is the integrated UV dose over the incubation period. Downward irradiance was converted to scalar using a constant factor of 1.2[30] and an average daily surface reflectance of 4 % was assumed.[31] When the integrated daily surface irradiance was not available for the sample day, the average daily surface irradiance for the cruise was used. kpEd(z) is the average of duplicate samples and had a range of 0.06–0.7 day–1 with an average error of 20 %.
Although UV-A (320–400 nm) radiation is the primary contributor to DMS photolysis, UV-B (280–320 nm) contributes 20–30 % to total photolysis with peak photolysis rates occurring at 320 nm.[30] As the SPMR and SMSR sensors do not capture UV-B wavelengths, DMS photolysis rates with depth were determined using the integrated daily UV-A dose (324–412 nm) calculated from surface irradiance data and the 324 nm attenuation depth profile (Kd(λ324)). We acknowledge that not accounting for UV-B wavelengths will result in an underestimate of photolysis rates and a slightly deeper profile. However, as this is a constant offset, it does not change the overall photolysis patterns presented here nor does it affect the conclusions of this manuscript.
Statistical analysis
The average seasonal cycle for mixed layer DMS(P) concentrations was calculated using the depth integrated average concentrations for the mixed layer (∫MLD0mDMS(P)/MLD) over the 3-year time-series. In addition, an average seasonal cycle over the upper 140 m was calculated from the 3-year time-series data for all DMS(P) concentration and rate measurements. Each year was normalised to the date of the end of the deep winter mixing period, defined as the month prior to the MLD shoaling above 50 m. A running monthly weighted average was then calculated for each depth and a complete annual cycle was determined using a spline fit. Although actual mixed layer depths were used for all calculations, for plotting purposes an average MLD was determined using a spline fit to the monthly MLD data.
To synthesise the relationships between DMS(P) cycling and other physical, chemical and biological parameters measured at BATS, a non-metric multidimensional scaling (MDS) analysis was conducted using R’s Vegan package.[32] DMSPp concentration, DMSPd concentration, DMS concentration, DMSPd consumption rate constant, DMS biological consumption rate constant and DMS photolysis rate constant were used as input variables. All input data were normalised as a fraction of the highest value and the Bray–Curtis method was used to calculate dissimilarity indices. Four dimensions were chosen as additional dimensions resulted in minimal increases in the goodness of fit, calculated as Kruskal’s Stress (formula I). For each axis of variability, the MDS analysis yielded sample scores for each sample and the projection or weighting of each input variable on that axis (variable score). In addition, five environmental variables were projected onto the MDS axes using the Vegan envfit function: UV radiation dose, temperature, salinity, dissolved oxygen concentration and chlorophyll-a concentration. A second analysis was done using rates instead of rate constants.
Results
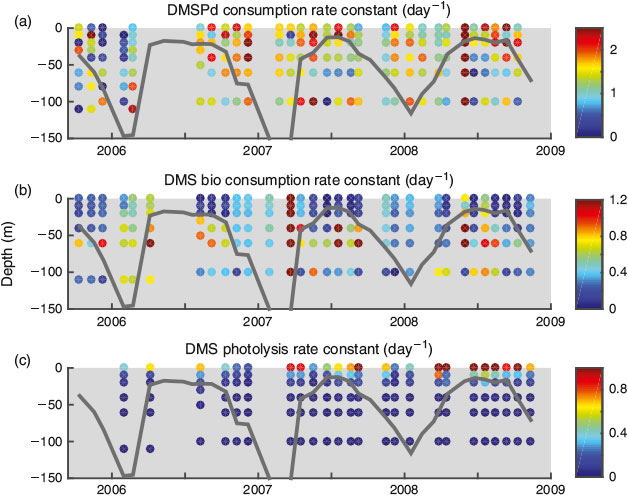
The BATS site exhibits strong seasonality with winter months characterised by deep mixing (100–300 m) followed by rapid stratification during the spring.[19] Shallow summertime mixed layer depths (~20 m), with the corresponding stratified water column and warm surface temperatures, are eroded by autumn storms leading back into winter. This seasonality in physical dynamics drives a similar seasonality in many of the chemical and biological characteristics of the site,[33] including the upper ocean sulfur cycle. DMSPp concentrations were low during the period of deep winter mixing and increased with the shoaling of the mixed layer (Fig. 1a). Concentrations remained elevated within the upper 80 m during the summer until the deepening of the mixed layer in autumn. Peak DMSPp concentrations (~25 nM) occurred near the base of the mixed layer at ~30 m approximately 60 days after the end of deep winter mixing, concurrent with the shoaling of the mixed layer, and right before the onset of stratification (MLD < 20 m). A second maximum (~25 nM) occurred below the mixed layer (between 25 and 80 m) ~170 days after the end of winter mixing. Peak DMSPp concentrations were typically co-located with the oxygen maximum and near, or slightly above, the deep chlorophyll maximum. DMSPp concentrations throughout the upper 140 m were positively correlated with primary production (R2 = 0.24, P < 0.001) and oxygen concentration (R2 = 0.25, P < 0.001). No relationship was observed between DMSPp and Chl. DMSPd concentrations were on average 6.3 ± 5.6 % of total DMSP concentrations and, despite being significantly correlated with DMSPp (R2 = 0.57, P < 0.001), displayed only a weak seasonal cycle (Fig. 1b).
DMS also showed a strong seasonal cycle at BATS with negligible DMS during the winter months and elevated DMS in the upper 40 m during the spring and summer (Fig. 1c). DMS concentrations peaked at ~3.5 nM right below the mixed layer (~25 m) approximately 100 days after the end of deep winter mixing and ~20 days after the onset of stratification (MLD < 20 m). A second peak of slightly larger magnitude (~4 nM) started ~150 days after deep winter mixing and lasted for approximately one and a half months until the onset of autumn mixing and the deepening of the mixed layer. DMS in the upper 140 m was positively correlated with DMSPp (R2 = 0.15, P < 0.001), negatively correlated with Chl (R2 = 0.18, P < 0.001) and weakly correlated with DMSPd (R2 = 0.07, P < 0.001). A weak positive relationship was observed between DMS and primary production (R2 = 0.08, P < 0.001).
Although mixed layer DMSPp and DMS concentrations were correlated (R2 = 0.59, P < 0.001), the classic decoupling between peak DMSPp and DMS concentrations (the ‘summer paradox’[15]) was observed with mixed layer DMS concentrations peaking ~90 days after peak DMSPp concentrations (Fig. 2). Normalising mixed layer DMSPp to Chl concentrations (DMSPp : Chl) reduced this offset to ~50 days and resulted in a higher correlation between mixed layer DMSPp : Chl and DMS (R2 = 0.89, P < 0.001) relative to that of DMSPp v. DMS.
|
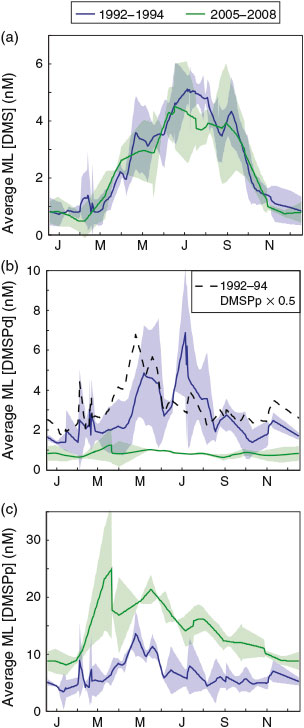
Mixed layer DMS concentrations in 2005–2008 showed the same seasonality as the 1992–1994 data (D98) (Fig. 3a). A slight, but significant, decrease in summertime and wintertime mean mixed layer DMS of 0.5 (11 %) and 0.23 nM (25 %) respectively was observed. On average, mixed layer DMSPd was 1.8 nM lower (3.2-fold decrease) in 2005–2008 relative to 1992–1994 (Figs 3b and S3 of the Supplementary material). We attribute this to methodological differences. Although D98 used the best practices for the time, and did not use vacuum or syringe filtration for DMSPd sampling, the large volume filtration method used by D98 was later shown to significantly overestimate DMSPd concentrations as a result of cell lysis, which transfers DMSP from the particulate to the dissolved pool.[23] Mixed layer DMSPd concentrations were on average 47 ± 33 % of DMSPp concentrations in the D98 dataset (Fig. 3b) as compared to 6.3 ± 5.6 % in the current study, further indicating that cell lysis during filtration significantly affected the D98 DMSPd values. It is also important to note that these results highlight general issues associated with filtration and indicate that potential biases may exist for other measurements of dissolved compounds made on filtrates.
|
Mixed layer DMSPp was on average 7.7 nM higher (2.3-fold increase) in 2005–2008 relative to 1992–1994 (Fig. 3c). This difference is most likely attributable to the combined effect of methodological improvements and ecosystem changes driven by large-scale forcings (see Discussion below). A direct comparison of previous best practices for DMSPp and DMSPd sampling (D98) to the updated methodologies (this study) was made on Sargasso Sea water samples in July of 2004 (J. Stefels, pers. comm.). This analysis followed the two sampling methodologies described above and indicated that the method used by D98 could result in a >50 % decrease in DMSPp concentrations relative to the concentrations determined using the updated method followed by this study. This difference is consistent with the change observed between the 1992–1994 and 2005–2008 time-series measurements. This decrease was most likely a result of lysing of cells during filtration in the D98 study, resulting in an underestimate of particulate DMSP concentrations. However, as the effect of filtering is anticipated to vary with phytoplankton community composition, we expect the methodological differences to vary seasonally and with depth. This suggests that, while some increase in mixed layer DMSPp concentrations between the two time periods might be real, it is not possible to correct the D98 data for methodological error and so we are unable to estimate the change in DMSPp over this interval. In addition, DMSPt (DMSPp + DMSPd) concentrations are not comparable between the two datasets as D98 sampled DMSPp and DMSPd using two different methods (vacuum filtration and gravity filtration respectively). As a result of different loss rates due to cell lysis in these two methods, the errors do not cancel and we expect D98 DMSPt to be an underestimate. In fact, D98 estimates of DMSPt were consistently lower than our estimates with an average difference of –37 ± 15 %.
Biological DMSPd consumption had an average rate constant (kDMSP, Eqn 1) of 1.46 ± 0.67 day–1 in the upper 100 m (range 0.02–4.4 day–1). These values are consistent with previously reported rate constants for open ocean sites of 0.7–4.1 day–1 in the NW Atlantic (surface, May–October),[34] 0.8–6.3 day–1 in the Mediterranean (surface, 18-month time-series),[35] 0.2–3.4 day–1 in the Arctic (surface, October),[36] 1.9–6.7 day–1 in the North Pacific (0–125 m, August–October),[37] 2.3 day–1 in the North Sea (surface, June)[38] and 2.1 day–1 in the NE subarctic Pacific (surface, May–June).[39] The values observed at the oligotrophic BATS site were significantly lower than the turnover rates observed in coastal, high iron rich waters (22.1 day–1)[39] and in an enriched mesocosm experiment (~20 day–1).[40]
Although slightly lower values were observed below the mixed layer in the summer, kDMSP did not have a defined seasonal cycle, in contrast to DMSPp and, to a lesser extent, DMSPd (Figs 4, 5). In addition, no relationship was observed between kDMSP and [DMSPd], [DMSPp] or bacterial production rates, nor was there a correlation between dDMSPd/dt and bacterial production (Fig. S4 of the Supplementary material). This suggests that the heterotrophic bacterial community had the capacity to degrade DMSP year round and was not being primed by available substrate. This lack of seasonality was surprising given the seasonal dynamics of both the bacterial community composition at BATS[41] and the abundance and expression of DMSP degradation genes.[16] Due to the lack of seasonality in kDMSP, the seasonal pattern of DMSPd consumption (dDMSPd/dt) was driven by DMSPd concentrations (Fig. 5).
|

|
On average, the biological DMS consumption rate constant (kDMS) was 0.43 ± 0.35 day–1 with the highest rate constants observed in the summer below the MLD between 40 and 80 m (max. 1.68 day–1). These rate constants are consistent with previous estimates of ~0.05–0.6 day–1 at BATS (0–60 m, July),[42] 0.4 day–1 in the North Sea (surface, June),[38] 0.12–0.96 day–1 in the western Atlantic (dark rate constants, 0–100 m, April)[43] and consistent with the range of 0.25–2.0 day–1 seen across a set of coastal and open ocean sites from the Gulf of Mexico to the Greenland Current to the Sargasso Sea.[28] Similar to the DMSPd consumption rate constants, the values measured at BATS were lower than those seen in more productive regions. For example, kDMS values of 0–3.0 day–1 were measured in the Ross Sea (70–700 m, January),[44] and kDMS values of 1.9–6.5 day–1 were observed in enriched microcosms (rates were ~0.2 day–1 in the control microcosms).[40] A weak seasonal cycle was observed in kDMS with elevated rates measured during the spring and summer below the mixed layer (Fig. 5). An inverse relationship was observed between kDMS and DMS concentrations with the highest kDMS values occurring when DMS concentrations were below 1 nM. No relationship was observed between kDMS and kDMSP suggesting DMS and DMSP were being consumed by different populations of heterotrophic bacteria, as has been shown previously.[45,46]
The dose independent DMS photolysis rate constant (kincubation) typically increased with depth because of increasing chromophoric dissolved organic matter (CDOM) concentrations. The DMS photolysis loss rate constant (kpEd(z), Eqn 5) was highest in the surface (average 0.93 day–1) and decreased exponentially with depth to an average rate constant of 0.02 day–1 by 40 m (Fig. 4). These values are consistent with the DMS photolysis loss rate constants estimated for oceanic stations in the western North Atlantic (0.36–0.70 day–1, 0–100 m in April).[43] Although slightly lower values were observed during the late autumn, there was not a strong seasonality in the DMS photolysis loss rate constant. As a result, the strong seasonality in DMS photolysis rates was driven primarily by changes in DMS concentrations, whereas the sharp vertical gradients were driven by changes in the loss rate constant due to the attenuation of UV radiation with depth (Fig. 5). The depth patterns of the DMS biological consumption rate constant and the DMS photolysis rate constant were inversely related in the upper 60 m such that the sum of the two (kpEd(z) + kDMS) showed little pattern with depth. The average total DMS loss rate constant (kpEd(z) + kDMS) was 0.62 day–1.
Discussion
A small but statistically significant decrease in mixed layer DMS was observed in 2005–2008 relative to 1992–1994. This decrease was still significant when July 2008 was excluded from the dataset due to the impact of Hurricane Bertha before and during that month’s sampling (see Levine et al.[16] for a complete discussion of the hurricane’s impact). As there was no significant change in DMS collection and quantification methodologies between the two datasets, we believe this decrease was attributable to changes in DMS(P) cycling in the region over the time period. Specifically, springtime nutrient drawdown, primary production, total Chl and grazing were all shown to have increased at BATS between the late 1990s and 2007.[47] In addition, a decrease in diatom abundance and an increase in Synechococcus abundance over this period were observed, while the absolute abundance of haptophytes (taxa with typically high DMSP production) did not appear to have changed. These changes, which have been attributed to a switch in the North Atlantic Oscillation from positive or neutral to negative,[47] all could have affected DMS production and resulted in the observed decrease in mixed layer DMS. Unfortunately, owing to methodological problems in the earlier time-series, we are unable to assess changes in DMSP over this period and so can only speculate that changes in DMS may have been driven by changes in heterotrophic processes (DMSP and DMS consumption rates and heterotrophic DMS production) rather than phototrophic dynamics (DMSP production and direct cleavage to DMS). Even though the decrease in mixed layer DMS was small (11–25 %), atmospheric aerosol–chemistry–climate general circulation models have suggested that small changes in oligotrophic fluxes of DMS have the potential to significantly affect CCN production because of the large surface area of the oligotrophic gyres and atmospheric circulation patterns.[48]
Although a full mass balance for the site is not possible, as we do not have a direct estimate of DMS production rates, we can estimate DMSPp turnover using the assumption of steady-state (a reasonable assumption given the turnover time-scales), the absolute turnover rates (nM day–1) and the DMS(P) standing stocks (nM). We calculate the average DMSPp turnover as:
where dDMSair–sea/dt is calculated using winds estimated from climatological relationships,[49] an experimentally determined diffusion coefficient,[50] and mixed layer DMS concentrations. Q is defined as the fraction of DMS production contributed by heterotrophic bacteria, such that 1 – Q is the fraction of DMS production contributed by phytoplankton. We used the simple linear model of Levine et al.,[16] which predicted mixed layer DMS concentrations using potential DMS production (phytoplankton DMSP lyase enzyme activity and bacterial lyase enzyme activity × DMSPd) and DMS consumption (DMS biological consumption and photolysis), to estimate the fraction of DMS production derived from the heterotrophic community (Q). This model, which does a reasonable job accounting for the variability in mixed layer DMS at BATS, predicts that Q ranges from 0–53 % depending on season and depth with the highest rates seen in the late summer and early autumn. Using this constraint on Q, we estimated DMSPp turnover rates in the mixed layer to range from an average of 0.15 day–1 (Q = 0.53) to an average of 0.22 day–1 (Q = 0), with a best estimate of 0.18 day–1 (seasonally variable Q). Even with the conservative estimate of no bacterial DMS production (Q = 0), this suggests that DMSPp turnover was significantly lower than the turnover rate constants for both the dissolved DMSP and DMS pools (biological consumption + photolysis + air–sea exchange), which had average mixed layer rate constants of 1.53 and 0.67 day–1 respectively. These turnover rates resulted in an average mixed layer DMSPp, DMSPd and DMS loss or consumption rate of 2.5, 1.3 and 1.6 nM day–1 respectively. The flux of sulfur out of the mixed layer DMSPp pool was highest ~150 days after the end of deep winter mixing when the turnover rate constant for DMSPp was ~0.25 day–1 and the mass flux was ~3.5 nM day–1 (seasonally variable Q). These maximum loss rates occurred >2 months after peak DMSPp and DMSPp : Chl concentrations and were significantly positively correlated with mixed layer DMS concentrations (R2 = 0.41, P < 0.001) and mixed layer UV-A dose (R2 = 0.36, P = 0.015). UV-A dose was only included indirectly in the DMSPp turnover calculations through the photolysis term. This simple model suggests that UV-A dose might be an important driver for increased mixed layer DMSPp turnover. This period with increased DMSPp turnover rates corresponded with increased production of DMS directly by the phytoplankton and by the increased prevalence of the DMSP lyase pathway relative to the demethylation pathway in the heterotrophic community. These findings provide in situ support for the anti-oxidant and ‘summer paradox’ hypotheses.
Using 14C estimates of primary production, we estimated the amount of photosynthesis that must have been devoted to DMSP synthesis in order to account for this turnover. For the mixed layer, this translates into DMSP accounting for 4.0, 4.9 and 4.6 % of mixed layer primary production for Q = 0.53, Q = 0 and seasonally variable Q respectively. This indicates that, even in the oligotrophic gyres, DMSP producing phytoplankton (which constitute only a fraction of the community) are devoting a significant amount of fixed carbon to DMSP synthesis.
Heterotrophic bacteria are important players in driving the upper ocean sulfur cycle at BATS using DMSP as both a carbon source (through both the demethylation and cleavage pathways) and as a sulfur source (through the demethylation pathway). The fraction of bacterial carbon and sulfur demand that can be accounted for by DMSP consumption was calculated using DMSPd turnover rates (nM day–1), bacterial carbon demand estimated from thymidine incorporation (pM day–1), a thymidine incorporation conversion factor of 1.63 × 10¹⁸ cell mol–1 [41] and an average cell carbon content of 20 fg C cell–1.[51] Using an average bacterial growth efficiency for the Sargasso Sea of 0.14,[41] we estimate that DMSP accounted for an annual average of 8 % of the daily bacterial carbon demand (0–118 %) and 13 % of the bacterial carbon demand in the summertime mixed layer (Fig. S5). Bacterial growth efficiencies are known to vary seasonally and have been observed to be as low as 0.01 in the Sargasso.[52] Using a conservative value of 0.05 for average bacterial growth efficiency results in a lower bound estimate of DMSP accounting for an annual average of 3 % of the bacterial carbon demand. These values are consistent with previous estimates by Simó et al.[6] for the subpolar North Atlantic and by Kiene and Linn[53] for the Gulf of Mexico of DMSP accounting for 8–15 and 3 % of bacterial carbon demand respectively. An estimate of the fraction of the bacterial sulfur demand that can be accounted for by DMSP consumption requires an estimate of the average C : S of heterotrophic cells, estimates of which range from 32[54] to 248.[55] Based on this uncertainty in heterotrophic C : S, we estimate that DMSP accounted for 52 to 400 % of total bacterial sulfur demand (bacterial growth efficiency = 0.14).
The majority of DMS consumption is attributed to heterotrophic activity, presumably by a specialised group of methylotrophs,[56] with DMS biological consumption accounting for 73.7 % of total DMS loss during the winter (0–100 m) when mixed layers were typically deeper than 100 m. During the summer, stratification and shallow mixed layers increased photolysis rates within the mixed layer; however, 80.1 % of DMS loss below the MLD during the summer was attributed to biological consumption. In addition, nearly all elevated kDMS values occurred at low light (below the mixed layer or during periods of deeper mixing) providing supporting evidence that light might inhibit the consumption of DMS by heterotrophs, as has been previously reported.[43]
Although a strong seasonality was not observed in overall DMSPd consumption rates, significant seasonal variability in the DMSP degradation pathways and in the bacterial DMSP degrader community was seen at this site during 2008.[16] This, combined with the rapid turnover rates (up to 4.4 day–1) and small standing stocks of DMSPd (0.80 ± 0.45 nM), suggests that DMSP is such a highly labile compound that a decrease in the activity of one group of DMSP degraders was compensated by an increase in the activity of another. This resulted in only small seasonal changes to net consumption rates albeit with potentially significant differences in pathway and thus end products, as suggested by significant seasonal variations in DMSP degradation pathway gene abundance, expression and potential enzyme activity.[16] Also of note, a comparison of biological DMSPd consumption rate constants measured globally under non-bloom conditions showed remarkable consistency despite sampling sites ranging from coastal to open ocean and from eutrophic to oligotrophic (DMSPp and DMSPd at these sites ranged from <5 to 100 nM and <0.01 to 8 nM respectively). This suggests that the observation at BATS that the DMSP degrader community was not being primed by the availability of DMSP may be true for much of the global ocean, with the exception of large blooms of DMSP producers such as in the Ross Sea.
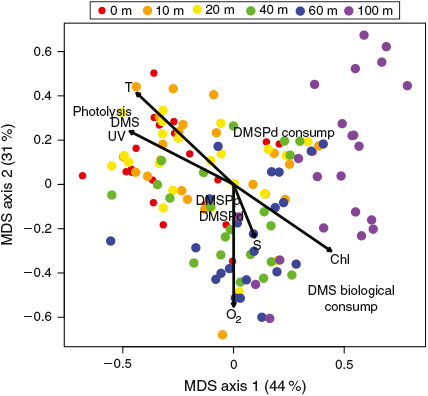
To synthesise the relationships between DMS(P) cycling and other physical, chemical and biological parameters measured at BATS, a non-metric multidimensional scaling (MDS) analysis was conducted (Fig. 6). This analysis clusters samples with similar properties, as defined by the input variables, and provides a prediction as to how input variables might co-vary. The projection of environmental variables onto the MDS axes indicates samples that are most highly correlated with the environmental variables. When DMSPd, DMS and photolysis rate constants were used (kDMSP, kDMS, kp), clear patterns emerged consistent with those seen from the analysis of vertical and seasonal variations in these parameters. Specifically, DMS concentrations and photolysis rate constants were highest in surface waters where temperature and UV dose were highest while DMS biological consumption rate constants were highest at depth close to the deep Chl maximum. DMSPp and DMSPd concentrations were highest in the subsurface at depths close to the O2 maximum, which was slightly shallower than the deep Chl maximum. When the MDS analysis was repeated using biological DMSPd and DMS consumption rates, and DMS photolysis rates instead of rate constants, many of these patterns were lost (Fig. S6 of the Supplementary material). As discussed above, the amplitude of seasonal changes in standing stocks was often greater than that of consumption rate constants. As a result, much of the valuable mechanistic insights that can be gained from analysing changes in rate constants could not be obtained from analysing changes in rates alone. As the upper ocean sulfur cycle is characterised by rapid turnover rates and low standing stocks, analysing changes in both rates and rate constants, and the relationship between these changes and environmental parameters, provides a more complete picture as to the primary mechanisms driving DMS(P) cycling.
|
Conclusions
Here we present an updated 3-year time-series of organic sulfur cycling in surface waters at BATS. We show that the sulfur pools were rapidly cycling throughout the year in the surface ocean with average turnover rates for DMSPd and DMS of up to 4.4 and 1.68 day–1 respectively. This suggests that the small standing stocks for these compounds are the small residual of large production and loss rates and confirms the critical role of heterotrophic bacteria in driving the seasonal dynamics of DMS and DMSP at BATS. Even with a conservative approximation of no bacterial DMS production (Q = 0), DMSPp turnover was estimated to be nearly an order of magnitude slower than DMSPd. However, this turnover still suggests that DMSP production accounts for 4–5 % of total mixed layer primary production in terms of carbon and indicates that DMSP synthesis accounts for a significant fraction of primary production in high DMSP producing species.
The general patterns of the seasonal cycle observed in this study (2005–2008) are consistent with those reported by D98 (1992–1994). Specifically, the classic ‘summer paradox’ was observed with mixed layer DMSPp concentrations peaking ~90 days before peak mixed layer DMS concentrations. A small, but significant, decrease in mixed layer DMS was observed, which may be due to ecosystem changes driven by large-scale forcing. We suggest that mixed layer DMSPd might be overestimated by up to 3-fold in the original D98 dataset because of methodological issues and that DMSPp might be significantly underestimated. This has important implications for sulfur cycle models that have extensively used the D98 dataset for model development and validation. The combination of rate measurements and improved estimates of DMSPp and DMSPd standing stocks presented here, in addition to the temporal and spatial resolution of this dataset, provides a comprehensive picture of upper ocean sulfur cycling and the necessary data to revisit and improve previous modelling efforts.
Acknowledgements
The authors acknowledge funding from the National Science Foundation (NSF) (OCE-0425166) and the Center for Microbial Oceanography Research and Education (CMORE) a NSF Science and Technology Center (EF-0424599). They thank N. Nemcek and D. Percy for all of their contributions to this dataset, D. Siegel, N. Nelson and D. Court for assistance with the solar radiation data, J. Stefels for sharing her methodological comparison data, the staff at the Bermuda Institute of Ocean Sciences and the captain and crew of the R/V Atlantic Explorer.
References
[1] R. J. Charlson, J. E. Lovelock, M. O. Andreae, S. G. Warren, Oceanic phytoplankton, atmospheric sulfur, cloud albedo and climate. Nature 1987, 326, 655.| Oceanic phytoplankton, atmospheric sulfur, cloud albedo and climate.Crossref | GoogleScholarGoogle Scholar | 1:CAS:528:DyaL2sXitVWgsb8%3D&md5=24299dba1956a59c2726d9e91321070cCAS |
[2] G. O. Kirst, Osmotic adjustment in phytoplankton and macroalgae in Biological and Environmental Chemistry of DMSP and Related Sulfonium Compounds (Eds R. Kiene, P. Visscher, M. Keller, G. Kirst) 1996, pp. 121–9 (Springer; New York)
[3] J. W. H. Dacey, G. M. King, S. G. Wakeham, Factors controling emission of dimethylfulfide from salt marshes. Nature 1987, 330, 643.
| Factors controling emission of dimethylfulfide from salt marshes.Crossref | GoogleScholarGoogle Scholar | 1:CAS:528:DyaL1cXhsVOhsLc%3D&md5=b2f5d67a0c540d256b30a88d119687bdCAS |
[4] W. Sunda, D. J. Kieber, R. P. Kiene, S. Huntsman, An antioxidant function for DMSP and DMS in marine algae. Nature 2002, 418, 317.
| An antioxidant function for DMSP and DMS in marine algae.Crossref | GoogleScholarGoogle Scholar | 1:CAS:528:DC%2BD38XltlGms7k%3D&md5=1bcaa8d9ca44d13d4f343901c31cbed2CAS | 12124622PubMed |
[5] J. Stefels, Physiological aspects of the production and conversion of DMSP in marine algae and higher plants. J. Sea Res. 2000, 43, 183.
| Physiological aspects of the production and conversion of DMSP in marine algae and higher plants.Crossref | GoogleScholarGoogle Scholar | 1:CAS:528:DC%2BD3cXms1Wrtb4%3D&md5=23897818cf9950bd364d15554611ea98CAS |
[6] R. Simó, S. D. Archer, C. Pedrós-Alió, L. Gilpin, C. E. Stelfox-Widdicombe, Coupled dynamics of dimethylsulfoniopropionate and dimethylsulfide cycling and the microbial food web in surface waters of the North Atlantic. Limnol. Oceanogr. 2002, 47, 53.
| Coupled dynamics of dimethylsulfoniopropionate and dimethylsulfide cycling and the microbial food web in surface waters of the North Atlantic.Crossref | GoogleScholarGoogle Scholar |
[7] R. P. Kiene, B. F. Taylor, Demethylation of dimethylsulfoniopropionate and production of thiols in anoxic marine-sediments. Appl. Environ. Microbiol. 1988, 54, 2208.
| 1:CAS:528:DyaL1cXlvFKls7k%3D&md5=a6336844ff32beb6f6328aef000232c6CAS | 16347732PubMed |
[8] G. L. Cantoni, D. G. Anderson, Enzymatic cleavage of dimethylpropiothetin by polysiphonia lansoa. J. Biol. Chem. 1956, 222, 171.
| 1:CAS:528:DyaG28XptVehtw%3D%3D&md5=7ba621a81612fd00625b5da0aacca748CAS | 13366990PubMed |
[9] E. C. Howard, S. L. Sun, E. J. Biers, M. A. Moran, Abundant and diverse bacteria involved in DMSP degradation in marine surface waters. Environ. Microbiol. 2008, 10, 2397.
| Abundant and diverse bacteria involved in DMSP degradation in marine surface waters.Crossref | GoogleScholarGoogle Scholar | 1:CAS:528:DC%2BD1cXhtFSksLvF&md5=b75790dff33d6b97cfc65d9c4ae98f90CAS | 18510552PubMed |
[10] R. P. Kiene, L. J. Linn, J. A. Bruton, New and important roles for DMSP in marine microbial communities. J. Sea Res. 2000, 43, 209.
| New and important roles for DMSP in marine microbial communities.Crossref | GoogleScholarGoogle Scholar | 1:CAS:528:DC%2BD3cXms1Wrtbw%3D&md5=789cb96d8406d5bbead908e442a540f1CAS |
[11] T. S. Bates, R. P. Kiene, G. V. Wolfe, P. A. Matrai, F. P. Chavez, K. R. Buck, B. W. Blomquist, R. L. Cuhel, The cycling of sulfur in surface seawater of the Northeast Pacific. J. Geophys. Res. – Oceans 1994, 99, 7835.
| The cycling of sulfur in surface seawater of the Northeast Pacific.Crossref | GoogleScholarGoogle Scholar | 1:CAS:528:DyaK2cXltFKqsbs%3D&md5=122f0c16df7069f35dcc915d711c9883CAS |
[12] A. Lana, R. Simó, S. M. Vallina, J. Dachs, Re-examination of global emerging patterns of ocean DMS concentration. Biogeochemistry 2012, 110, 173.
| Re-examination of global emerging patterns of ocean DMS concentration.Crossref | GoogleScholarGoogle Scholar | 1:CAS:528:DC%2BC38XhsVCjt7bO&md5=a5d392deacb7e7da955d807e806d558fCAS |
[13] M. T. Woodhouse, K. S. Carslaw, G. W. Mann, S. M. Vallina, M. Vogt, P. R. Halloran, O. Boucher, Low sensitivity of cloud condensation nuclei to changes in the sea-air flux of dimethyl-sulphide. Atmos. Chem. Phys. 2010, 10, 7545.
| Low sensitivity of cloud condensation nuclei to changes in the sea-air flux of dimethyl-sulphide.Crossref | GoogleScholarGoogle Scholar | 1:CAS:528:DC%2BC3cXhtlWls7vM&md5=7b62e33daa012cde393fb915521edf07CAS |
[14] J. W. H. Dacey, F. A. Howse, A. F. Michaels, S. G. Wakeham, Temporal variability of dimethylsulfide and dimethylsulfoniopropionate in the Sargasso Sea. Deep Sea Res. I Oceanogr. Res. Pap. 1998, 45, 2085.
| Temporal variability of dimethylsulfide and dimethylsulfoniopropionate in the Sargasso Sea.Crossref | GoogleScholarGoogle Scholar | 1:CAS:528:DyaK1MXmvFyjtg%3D%3D&md5=2b6f731fece8163c3026294a4fe21309CAS |
[15] R. Simó, C. Pedrós-Alió, Role of vertical mixing in controlling the oceanic production of dimethyl sulphide. Nature 1999, 402, 396.
| Role of vertical mixing in controlling the oceanic production of dimethyl sulphide.Crossref | GoogleScholarGoogle Scholar |
[16] N. M. Levine, V. A. Varaljay, D. A. Toole, J. W. H. Dacey, S. C. Doney, M. A. Moran, Environmental, biochemical and genetic drivers of DMSP degradation and DMS production in the Sargasso Sea. Environ. Microbiol. 2012, 14, 1210.
| Environmental, biochemical and genetic drivers of DMSP degradation and DMS production in the Sargasso Sea.Crossref | GoogleScholarGoogle Scholar | 1:CAS:528:DC%2BC38XhtVantL7N&md5=60d4a6a2a8f37d615653e74f7ed944aeCAS | 22324779PubMed |
[17] A. F. Michaels, A. H. Knap, Overview of the US JGOFS Bermuda Atlantic Time-series Study and the Hydrostation S program. Deep Sea Res. II Top. Stud. Oceanogr. 1996, 43, 157.
| Overview of the US JGOFS Bermuda Atlantic Time-series Study and the Hydrostation S program.Crossref | GoogleScholarGoogle Scholar | 1:CAS:528:DyaK28Xjs1eqsbo%3D&md5=06454564679770df458f457a50e1bc63CAS |
[18] A. H. Knap, A. F. Michaels, D. K. Steinberg, F. Bahr, N. R. Bates, S. Bell, P. Countway, A. Close, A. Doyle, F. A. Howse, K. Gundersen, R. J. Johnson, R. Little, K. Orcutt, R. Parsons, C. Rathbun, M. Sanderson, S. Stone, Bermuda Atlantic Time-series Study Methods Manual Version 4 1997 (US JGOFS Planning Office: Woods Hole, MA, USA).
[19] D. K. Steinberg, C. A. Carlson, N. R. Bates, R. J. Johnson, A. F. Michaels, A. H. Knap, Overview of the US JGOFS Bermuda Atlantic Time-series Study (BATS): a decade-scale look at ocean biology and biogeochemistry. Deep Sea Res. II Top. Stud. Oceanogr. 2001, 48, 1405.
| Overview of the US JGOFS Bermuda Atlantic Time-series Study (BATS): a decade-scale look at ocean biology and biogeochemistry.Crossref | GoogleScholarGoogle Scholar | 1:CAS:528:DC%2BD3MXkt1CrurY%3D&md5=d53283f7e1e9ba0f6fdf44abaedbd6b5CAS |
[20] J. Sprintall, M. Tomczak, Evidence of the barrier layer in the surface-layer of the tropics. J. Geophys. Res. – Oceans 1992, 97, 7305.
| Evidence of the barrier layer in the surface-layer of the tropics.Crossref | GoogleScholarGoogle Scholar |
[21] D. A. Siegel, T. K. Westberry, M. C. O’brien, N. B. Nelson, A. F. Michaels, J. R. Morrison, A. Scott, E. A. Caporelli, J. C. Sorensen, S. Maritorena, S. A. Garver, E. A. Brody, J. Ubante, M. A. Hammer, Bio-optical modeling of primary production on regional scales: the Bermuda BioOptics project. Deep Sea Res. II Top. Stud. Oceanogr 2001, 48, 1865.
| Bio-optical modeling of primary production on regional scales: the Bermuda BioOptics project.Crossref | GoogleScholarGoogle Scholar |
[22] R. B. Stull, Boundary conditions and surface forcings, in An Introduction to Boundary Layer Meteorology. Atmospheric and Oceanographic Sciences Library, vol. 13 (Ed. L. A. Mysak) 1988, pp. 251–294 (Kluwer Academic Publishers: Boston, MA, USA).
[23] R. P. Kiene, D. Slezak, Low dissolved DMSP concentrations in seawater revealed by small-volume gravity filtration and dialysis sampling. Limnol. Oceanogr. Methods 2006, 4, 80.
| Low dissolved DMSP concentrations in seawater revealed by small-volume gravity filtration and dialysis sampling.Crossref | GoogleScholarGoogle Scholar | 1:CAS:528:DC%2BD28XmtlWnt70%3D&md5=d76bee9995b6021df822bbc9b36611e1CAS |
[24] J. Stefels, Chapt. 11. Determination of DMS, DMSP, and DMSO in seawater, in Practical Guidelines for the Analysis of Seawater (Ed. O. Wurl) 2009, pp. 223–234 (CRC Press, Taylor & Francis Group: Boca Raton, FL, USA).
[25] T. G. Bell, G. Malin, G. A. Lee, J. Stefels, S. Archer, M. Steinke, P. Matrai, Global oceanic DMS data inter-comparability. Biogeochemistry 2012, 110, 147.
| Global oceanic DMS data inter-comparability.Crossref | GoogleScholarGoogle Scholar | 1:CAS:528:DC%2BC38XhsVCjt7fJ&md5=b22637fb0c888538d6264eebf5efc343CAS |
[26] H. J. Zemmelink, L. Houghton, N. M. Frew, J. W. H. Dacey, Dimethylsulfide and major sulfur compounds in a stratified coastal salt pond. Limnol. Oceanogr. 2006, 51, 271.
| Dimethylsulfide and major sulfur compounds in a stratified coastal salt pond.Crossref | GoogleScholarGoogle Scholar | 1:CAS:528:DC%2BD28XhsFaqtLg%3D&md5=b7ec777b93b10f0b88f9d12a28464764CAS |
[27] R. P. Kiene, S. K. Service, Decomposition of dissolved DMSP and DMS in estuarine waters – dependence on temperature and substrate concentration. Mar. Ecol. Prog. Ser. 1991, 76, 1.
| Decomposition of dissolved DMSP and DMS in estuarine waters – dependence on temperature and substrate concentration.Crossref | GoogleScholarGoogle Scholar | 1:CAS:528:DyaK38XltlyjsQ%3D%3D&md5=38533c6df3fed1c0ac8a7a69a5eeef5dCAS |
[28] R. P. Kiene, L. J. Linn, The fate of dissolved dimethylsulfoniopropionate (DMSP) in seawater: Tracer studies using S-35-DMSP. Geochim. Cosmochim. Acta 2000, 64, 2797.
| The fate of dissolved dimethylsulfoniopropionate (DMSP) in seawater: Tracer studies using S-35-DMSP.Crossref | GoogleScholarGoogle Scholar | 1:CAS:528:DC%2BD3cXlsVKktL8%3D&md5=0187e2eab0851b1bf8fc20c33d7c3f4bCAS |
[29] G. V. Wolfe, R. P. Kiene, Effects of methylated, organic, and inorganic substrates on microbial consumption of dimethyl sulfide in estuarine waters. Appl. Environ. Microbiol. 1993, 59, 2723.
| 1:CAS:528:DyaK3sXmt1WgtLY%3D&md5=afe23fc7824a22fc9b8b5fb513d71973CAS | 16349026PubMed |
[30] D. A. Toole, D. J. Kieber, R. P. Kiene, D. A. Siegel, N. B. Nelson, Photolysis and the dimethylsulfide (DMS) summer paradox in the Sargasso Sea. Limnol. Oceanogr. 2003, 48, 1088.
| Photolysis and the dimethylsulfide (DMS) summer paradox in the Sargasso Sea.Crossref | GoogleScholarGoogle Scholar | 1:CAS:528:DC%2BD3sXksFOlt7c%3D&md5=70b07bdac1779302cbd418efcb855393CAS |
[31] K. E. Bailey, D. A. Toole, B. Blomquist, R. G. Najjar, B. Huebert, D. J. Kieber, R. P. Kiene, R. Matrai, G. R. Westby, D. A. del Valle, Dimethylsulfide production in Sargasso Sea eddies. Deep Sea Res. II Top. Stud. Oceanogr. 2008, 55, 1491.
| Dimethylsulfide production in Sargasso Sea eddies.Crossref | GoogleScholarGoogle Scholar |
[32] J. Oksanen, F. G. Blanchet, R. Kindt, P. Legendre, R. B. O’hara, G. L. Simpson, P. Solymos, M. H. H. Stevens, H. Wagner, Vegan: Community Ecology Package. R package version 2.0-10 2013. Available at http://CRAN.R-project.org/package-vegan [Verified 5 September 2015].
[33] A. F. Michaels, A. H. Knap, R. L. Dow, K. Gundersen, R. J. Johnson, J. Sorensen, A. Close, G. A. Knauer, S. E. Lohrenz, V. A. Asper, M. Tuel, R. Bidigare, Seasonal patterns of ocean biogeochemistry at the United States JGOFS Bermuda Atlantic Time-series Study site. Deep Sea Res. I Oceanogr. Res. Pap 1994, 41, 1013.
| Seasonal patterns of ocean biogeochemistry at the United States JGOFS Bermuda Atlantic Time-series Study site.Crossref | GoogleScholarGoogle Scholar | 1:CAS:528:DyaK2MXhvVKqs70%3D&md5=5dc1c0c31d82a73f5d33b2fb64f9ffb1CAS |
[34] M. Lizotte, M. Levasseur, S. Michaud, M. G. Scarratt, A. Merzouk, M. Gosselin, J. Pommier, R. B. Rivkin, R. P. Kiene, Macroscale patterns of the biological cycling of dimethylsulfoniopropionate (DMSP) and dimethylsulfide (DMS) in the Northwest Atlantic. Biogeochemistry 2012, 110, 183.
| Macroscale patterns of the biological cycling of dimethylsulfoniopropionate (DMSP) and dimethylsulfide (DMS) in the Northwest Atlantic.Crossref | GoogleScholarGoogle Scholar | 1:CAS:528:DC%2BC38XhsVCjt7jF&md5=c381e7d6b7c085a0333ec91e2499c0b0CAS |
[35] M. Vila-Costa, R. P. Kiene, R. Simó, Seasonal variability of the dynamics of dimethylated sulfur compounds in a coastal northwest Mediterranean site. Limnol. Oceanogr. 2008, 53, 198.
| Seasonal variability of the dynamics of dimethylated sulfur compounds in a coastal northwest Mediterranean site.Crossref | GoogleScholarGoogle Scholar | 1:CAS:528:DC%2BD1cXhvVGjs7g%3D&md5=500934abaea61df6f1b0b44b61a0ecbeCAS |
[36] M. Luce, M. Levasseur, M. G. Scarratt, S. Michaud, S.-J. Royer, R. Kiene, C. Lovejoy, M. Gosselin, M. Poulin, Y. Gratton, M. Lizotte, Distribution and microbial metabolism of dimethylsulfoniopropionate and dimethylsulfide during the 2007 Arctic ice minimum. J. Geophys. Res. – Oceans 2011, 116, C00G06.
| Distribution and microbial metabolism of dimethylsulfoniopropionate and dimethylsulfide during the 2007 Arctic ice minimum.Crossref | GoogleScholarGoogle Scholar |
[37] D. A. del Valle, R. P. Kiene, D. M. Karl, Effect of visible light on dimethylsulfoniopropionate assimilation and conversion to dimethylsulfide in the North Pacific Subtropical Gyre. Aquat. Microb. Ecol. 2012, 66, 47.
| Effect of visible light on dimethylsulfoniopropionate assimilation and conversion to dimethylsulfide in the North Pacific Subtropical Gyre.Crossref | GoogleScholarGoogle Scholar |
[38] M. V. Zubkov, B. M. Fuchs, S. D. Archer, R. P. Kiene, R. Amann, P. H. Burkill, Rapid turnover of dissolved DMS and DMSP by defined bacterioplankton communities in the stratified euphotic zone of the North Sea. Deep Sea Res. II Top. Stud. Oceanogr. 2002, 49, 3017.
| Rapid turnover of dissolved DMS and DMSP by defined bacterioplankton communities in the stratified euphotic zone of the North Sea.Crossref | GoogleScholarGoogle Scholar | 1:CAS:528:DC%2BD38XktlKntLg%3D&md5=e13228fcf9fe3b6647e298fc03fdd23bCAS |
[39] S.-J. Royer, M. Levasseur, M. Lizotte, M. Arychuk, M. G. Scarratt, C. S. Wong, C. Lovejoy, M. Robert, K. Johnson, A. Pena, S. Michaud, R. P. Kiene, Microbial dimethylsulfoniopropionate (DMSP) dynamics along a natural iron gradient in the northeast subarctic Pacific. Limnol. Oceanogr. 2010, 55, 1614.
| Microbial dimethylsulfoniopropionate (DMSP) dynamics along a natural iron gradient in the northeast subarctic Pacific.Crossref | GoogleScholarGoogle Scholar | 1:CAS:528:DC%2BC3cXhtVOmurnO&md5=e087dcc46e585d0f5d8d36ef191cccccCAS |
[40] J. Pinhassi, R. Simó, J. M. Gonzalez, M. Vila, L. Alonso-Saez, R. P. Kiene, M. A. Moran, C. Pedrós-Alió, Dimethylsulfoniopropionate turnover is linked to the composition and dynamics of the bacterioplankton assemblage during a microcosm phytoplankton bloom. Appl. Environ. Microbiol. 2005, 71, 7650.
| Dimethylsulfoniopropionate turnover is linked to the composition and dynamics of the bacterioplankton assemblage during a microcosm phytoplankton bloom.Crossref | GoogleScholarGoogle Scholar | 1:CAS:528:DC%2BD2MXhtlehtL3I&md5=2e3b362564c875206655496feed9db66CAS | 16332737PubMed |
[41] C. A. Carlson, H. W. Ducklow, T. D. Sleeter, Stocks and dynamics of bacterioplankton in the northwestern Sargasso Sea. Deep Sea Res. II Top. Stud. Oceanogr. 1996, 43, 491.
| Stocks and dynamics of bacterioplankton in the northwestern Sargasso Sea.Crossref | GoogleScholarGoogle Scholar | 1:CAS:528:DyaK28Xjs1eqtrs%3D&md5=7fb04b78befa6d2f46c48731a601a207CAS |
[42] D. A. del Valle, D. J. Kieber, R. P. Kiene, Depth-dependent fate of biologically consumed dimethylsulfide in the Sargasso Sea. Mar. Chem. 2007, 103, 197.
| Depth-dependent fate of biologically consumed dimethylsulfide in the Sargasso Sea.Crossref | GoogleScholarGoogle Scholar | 1:CAS:528:DC%2BD28XhtlWqu7bM&md5=01050d3acaa6e6f446386eb91dce022dCAS |
[43] D. A. Toole, D. Slezak, R. P. Kiene, D. J. Kieber, D. A. Siegel, Effects of solar radiation on dimethylsulfide cycling in the western Atlantic Ocean. Deep Sea Res. I Oceanogr. Res. Pap. 2006, 53, 136.
| Effects of solar radiation on dimethylsulfide cycling in the western Atlantic Ocean.Crossref | GoogleScholarGoogle Scholar | 1:CAS:528:DC%2BD28XhsFansQ%3D%3D&md5=7f0747867bf13c045c25156e79177ac9CAS |
[44] A. N. Rellinger, R. P. Kiene, D. A. del Valle, D. J. Kieber, D. Slezak, H. Harada, J. Bisgrove, J. Brinkley, Occurrence and turnover of DMSP and DMS in deep waters of the Ross Sea, Antarctica. Deep Sea Res. I Oceanogr. Res. Pap. 2009, 56, 686.
| Occurrence and turnover of DMSP and DMS in deep waters of the Ross Sea, Antarctica.Crossref | GoogleScholarGoogle Scholar | 1:CAS:528:DC%2BD1MXksVCnsb8%3D&md5=d4d26f8b58b307fa86716c84ed5c3bf7CAS |
[45] B. F. Taylor, D. C. Gilchrist, New routes for aerobic biodegradation of dimethylsulfoniopropionate. Appl. Environ. Microbiol. 1991, 57, 3581.
| 1:CAS:528:DyaK38XlsFejtQ%3D%3D&md5=c13eceeda5797e14ff6e39ba4902aa24CAS | 16348607PubMed |
[46] P. T. Visscher, M. R. Diaz, B. F. Taylor, Enumeration of bacteria which cleave or demethylate dimethylsulfoniopropionate in the Caribbean Sea. Mar. Ecol. Prog. Ser. 1992, 89, 293.
| Enumeration of bacteria which cleave or demethylate dimethylsulfoniopropionate in the Caribbean Sea.Crossref | GoogleScholarGoogle Scholar |
[47] M. W. Lomas, D. K. Steinberg, T. Dickey, C. A. Carlson, N. B. Nelson, R. H. Condon, N. R. Bates, Increased ocean carbon export in the Sargasso Sea linked to climate variability is countered by its enhanced mesopelagic attenuation. Biogeosciences 2010, 7, 57.
| Increased ocean carbon export in the Sargasso Sea linked to climate variability is countered by its enhanced mesopelagic attenuation.Crossref | GoogleScholarGoogle Scholar | 1:CAS:528:DC%2BC3cXktVOitLg%3D&md5=8de1556a0793e3d2dd73b652a376613cCAS |
[48] A. S. Mahajan, S. Fadnavis, M. A. Thomas, L. Pozzoli, S. Gupta, S.-J. Royer, A. Saiz-Lopez, R. Simó, Quantifying the impacts of an updated global dimethylsulfide (DMS) climatology on cloud microphysics and aerosol radiative forcing. J. Geophys. Res. – Atmospheres 2015, 120, 2524.
| Quantifying the impacts of an updated global dimethylsulfide (DMS) climatology on cloud microphysics and aerosol radiative forcing.Crossref | GoogleScholarGoogle Scholar | 1:CAS:528:DC%2BC2MXmsVentL0%3D&md5=e5e5d6d90ad900bd9c702595b1bdd167CAS |
[49] E. Kalnay, M. Kanamitsu, R. Kistler, W. Collins, D. Deaven, L. Gandin, M. Iredell, S. Saha, G. White, J. Woollen, Y. Zhu, M. Chelliah, W. Ebisuzaki, W. Higgins, J. Janowiak, K. C. Mo, C. Ropelewski, J. Wang, A. Leetmaa, R. Reynolds, R. Jenne, D. Joseph, The NCEP/NCAR 40-year reanalysis project. Bull. Am. Meteorol. Soc. 1996, 77, 437.
| The NCEP/NCAR 40-year reanalysis project.Crossref | GoogleScholarGoogle Scholar |
[50] E. S. Saltzman, D. B. King, K. Holmen, C. Leck, Experimental determination of the diffusion coefficient of dimethylsulfide in water. J. Geophys. Res. – Oceans 1993, 98, 16 481.
| Experimental determination of the diffusion coefficient of dimethylsulfide in water.Crossref | GoogleScholarGoogle Scholar |
[51] S. Lee, J. A. Fuhrman, Relationships between biovolume and biomass of naturally derived marine bacterioplankton. Appl. Environ. Microbiol. 1987, 53, 1298.
| 1:CAS:528:DyaL2sXksVGrtr4%3D&md5=449fba67df8ea76026abcda45b175a77CAS | 16347362PubMed |
[52] C. A. Carlson, H. W. Ducklow, Growth of bacterioplankton and consumption of dissolved organic carbon in the Sargasso Sea. Aquat. Microb. Ecol. 1996, 10, 69.
| Growth of bacterioplankton and consumption of dissolved organic carbon in the Sargasso Sea.Crossref | GoogleScholarGoogle Scholar |
[53] R. P. Kiene, L. J. Linn, Distribution and turnover of dissolved DMSP and its relationship with bacterial production and dimethylsulfide in the Gulf of Mexico. Limnol. Oceanogr. 2000, 45, 849.
| Distribution and turnover of dissolved DMSP and its relationship with bacterial production and dimethylsulfide in the Gulf of Mexico.Crossref | GoogleScholarGoogle Scholar | 1:CAS:528:DC%2BD3cXkslerurw%3D&md5=2c4c9a097c6fe991fcea8b2ab530dfc4CAS |
[54] K. M. Fagerbakke, M. Heldal, S. Norland, Content of carbon, nitrogen, oxygen, sulfur and phosphorus in native aquatic and cultured bacteria. Aquat. Microb. Ecol. 1996, 10, 15.
| Content of carbon, nitrogen, oxygen, sulfur and phosphorus in native aquatic and cultured bacteria.Crossref | GoogleScholarGoogle Scholar |
[55] R. L. Cuhel, C. D. Taylor, H. W. Jannasch, Assimilatory sulfur metabolism in marine microorganisms – sulfur metabolism, protein-synthesis, and growth of pseudomonas-halodurans and alteromonas-luteo-violaceus during unperturbed batch growth. Arch. Microbiol. 1981, 130, 8.
| Assimilatory sulfur metabolism in marine microorganisms – sulfur metabolism, protein-synthesis, and growth of pseudomonas-halodurans and alteromonas-luteo-violaceus during unperturbed batch growth.Crossref | GoogleScholarGoogle Scholar | 1:CAS:528:DyaL3MXls1Ggu7g%3D&md5=1681e0935bd7bac0b0a4e90493181fb4CAS |
[56] M. Vila-Costa, D. A. del Valle, J. M. González, D. Slezak, R. P. Kiene, O. Sánchez, R. Simó, Phylogenetic identification and metabolism of marine dimethylsulfide-consuming bacteria. Environ. Microbiol. 2006, 8, 2189.
| Phylogenetic identification and metabolism of marine dimethylsulfide-consuming bacteria.Crossref | GoogleScholarGoogle Scholar | 1:CAS:528:DC%2BD2sXisl2gtQ%3D%3D&md5=04367748b7ccc098fc08215b57135567CAS | 17107560PubMed |