

The Brigalow Catchment Study: V*. Clearing and burning brigalow (Acacia harpophylla) in Queensland, Australia, temporarily increases surface soil fertility prior to nutrient decline under cropping or grazing
C. M. Thornton A B and K. Shrestha A
A Department of Natural Resources, Mines and Energy, PO Box 1762, Rockhampton, Qld 4700, Australia.
B Corresponding author. Email: Craig.Thornton@dnrme.qld.gov.au
Soil Research - https://doi.org/10.1071/SR20088
Submitted: 31 March 2020 Accepted: 9 September 2020 Published online: 6 November 2020
Journal Compilation © CSIRO 2020 Open Access CC BY
Abstract
In the Brigalow Belt bioregion of Australia, clearing of brigalow (Acacia harpophylla) scrub vegetation for agriculture has altered nutrient cycling over millions of hectares. In order to quantify the effect of this vegetation clearing and land use change on soil fertility, the Brigalow Catchment Study commenced in 1965. Initial clearing and burning of brigalow scrub resulted in a temporary increase of mineral nitrogen, total and available phosphorus, total and exchangeable potassium and total sulfur in the surface soil (0–0.1 m) as a result of soil heating and the ash bed effect. Soil pH also increased, but did not peak immediately after burning. Soil fertility declined significantly over the subsequent 32 years. Under cropping, organic carbon declined by 46%, total nitrogen by 55%, total phosphorus by 29%, bicarbonate-extractable phosphorus by 54%, acid-extractable phosphorus by 59%, total sulfur by 49%, total potassium by 9% and exchangeable potassium by 63% from post-burn, pre-cropping concentrations. Fertility also declined under grazing but in a different pattern to that observed under cropping. Organic carbon showed clear fluctuation but it was not until the natural variation in soil fertility over time was separated from the anthropogenic effects of land use change that a significant decline was observed. Total nitrogen declined by 22%. Total phosphorus declined by 14%, equating to only half of the decline under cropping. Bicarbonate-extractable phosphorus declined by 64% and acid-extractable phosphorus by 66%; both greater than the decline observed under cropping. Total sulfur declined by 23%; less than half of the decline under cropping. A similar decline in total potassium was observed under both land uses, with a 10% decline under grazing. Exchangeable potassium declined by 59%. The primary mechanism of nutrient loss depended on the specific land use and nutrient in question.
Keywords: catchment management, cropping systems, dryland agriculture, tree clearing.
Introduction
Soil fertility decline, soil structural decline and erosion are all considered to be consequences of changing land use from virgin forest to cropping and grazing. Traditionally, nutrient cycling in undisturbed virgin ecological systems was considered a steady-state closed system, where soil nutrients are consumed by the growing plants and then released back to the soil via leaf litter, wood debris and roots (Moody 1998). In contrast, cropping and grazing systems disturb this cycle by removing nutrients in harvested products and animals (Radford et al. 2007), via increased surface runoff (Thornton et al. 2007; Elledge and Thornton 2017), increased leaching (Silburn et al. 2009) and increased gaseous losses from soil and animals (Huth et al. 2010; Dalal et al. 2013). Disturbance of nutrient cycles and increased losses of soil nutrients affect the viability and sustainability of farming systems. Increased nutrient loads lost to the environment impacts ecosystem health, resulting in substantial investment in harm minimisation and remediation programs worldwide (Carroll et al. 2012). Contemporary nutrient cycling research suggests that disturbance and nutrient loss on a local scale have ramifications on a global scale. This is demonstrated by feedback mechanisms between increasing temperature, increasing atmospheric carbon dioxide and nitrogen concentrations, and fluxes of soil organic matter as a result of concomitant change in soil carbon and nitrogen concentrations (Crowther et al. 2016; Tipping et al. 2017; Schulte-Uebbing and de Vries 2018).
In the Brigalow Belt bioregion of Australia, clearing of brigalow (Acacia harpophylla) scrub and land use change has substantially altered nutrient cycling over a large area. The bioregion occupies 36.7 million hectares of Queensland and New South Wales, stretching from Dubbo in the south to Townsville in the north of Australia. Since European settlement, 58% of this bioregion has been cleared. The bioregion contains Queensland’s largest catchment, the Fitzroy Basin, which drains directly into the Great Barrier Reef lagoon. In 1962, the Brigalow Land Development Fitzroy Basin Scheme commenced, resulting in the government-sponsored clearing of 4.5 million hectares for cropping and grazing. This clearing represents 21% of all clearing in the bioregion and 32% of the Fitzroy Basin area (Thornton et al. 2007). Broad-scale land clearing continued in the basin until 2006 (McGrath 2007). In the preceding decade, rates of land clearing in Queensland were among the highest in the world, with estimates of 425 000–446 000 ha cleared per year (Wilson et al. 2002; Lindenmayer and Burgman 2005; Reside et al. 2017). More than 60% of this clearing, or ~261 000 ha/year, was undertaken in the Brigalow Belt (Wilson et al. 2002; Cogger et al. 2003). It is estimated that up to 93% of brigalow scrub has been cleared since European settlement (Butler and Fairfax 2003; Cogger et al. 2003; Tulloch et al. 2016).
In order to quantify the effect of this scale of vegetation clearing and land use change on soil fertility, the Brigalow Catchment Study (BCS) commenced in 1965. The objective of this study was to evaluate whether clearing of brigalow scrub for cropping or grazing would alter the dynamics of soil organic carbon (OC), nitrogen, phosphorus, sulfur and potassium over time. It was hypothesised that land development for cropping would lead to a significant decline in soil fertility while less or no change was expected with land development for grazing. It was also expected that the trends noted by Radford et al. (2007), i.e. unchanged concentrations of soil OC and total nitrogen (TN) under brigalow scrub and grazing land uses but significant decline under cropping, would continue; however, the planting of legume ley pasture may enhance nutrient status in soil under the cropping land use.
As resourcing pressures limit the commencement and continuation of long-term studies there is an increasing trend towards modelling. This study facilitates modelling by numerically describing the starting condition of the landscape and mathematically defining fertility trends over time. Discussion on the mechanisms of change further informs process-based models, assisting in moving forward from traditional empirical black box models. The BCS continues today having adapted to answer new research questions, and having answered questions unanticipated at its inception more than five decades ago.
Materials and methods
The BCS is described in detail by Cowie et al. (2007); changes in runoff volume and peak runoff rate are given in Thornton et al. (2007) and Thornton and Yu (2016); agronomic and soil fertility results are given in Radford et al. (2007); the deep drainage component of the water balance is given in Silburn et al. (2009); and changes in water quality are given in Thornton and Elledge (2016) and Elledge and Thornton (2017).
Site location and climate
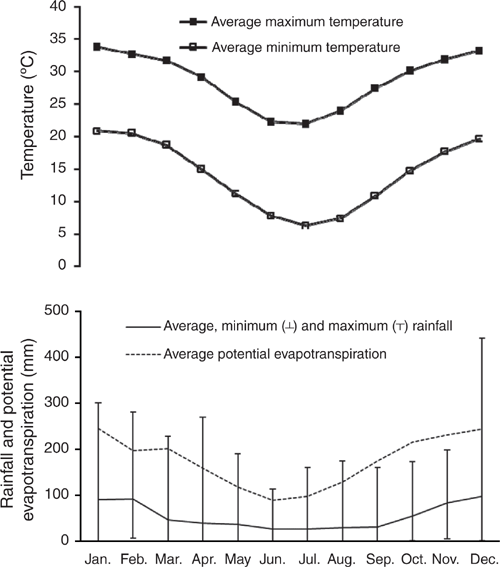
The study site is located at 24.81°S, 149.80°E at an altitude of 151 m above sea level, located within the Dawson subcatchment of the Fitzroy Basin, central Queensland, Australia. A locality map is presented in Cowie et al. (2007). The region has a semiarid, subtropical climate. Summers are wet, with 70% of the annual average (1964–2014) hydrological year (October–September) rainfall of 661 mm falling during October–March, and winter rainfall is low (Fig. 1). Average monthly temperature ranges from a minimum of 6.3°C in July to a maximum of 33.8°C in January (Fig. 1).
|
Experimental design
The BCS is a paired, calibrated catchment study consisting of three small catchments, C1, C2 and C3, ranging from 11.7 to 16.8 ha in size. Within each catchment, three permanent monitoring sites were established to monitor soil fertility. A map showing the location of the monitoring sites within the catchments is presented in Cowie et al. (2007). Establishment of the 20 m × 20 m sites was done using double stratification. Initial stratification was based on soil type and slope position with a monitoring site allocated to both an upper- and lower-slope position on Vertosols, and the third on a Sodosol irrespective of slope position. Secondary stratification was by way of 10 subunits, each 4 m × 10 m, within each monitoring site.
Soil types
Soil types were typically characterised by fine-textured dark cracking clays (Black and Grey Vertosols), noncracking clays (Black and Grey Dermosols) and thin layered dark and brown sodic soils (Black and Brown Sodosols) (Isbell 1996; Cowie et al. 2007). Approximately 70% of C1 and C2 and 58% of C3 comprised Vertosols and Dermosols (clay soils); the remaining area in each catchment was occupied by Sodosols. The plant-available water holding capacity of these soils ranged from 130 to 200 mm in the surface 1.4 m of the soil profile (Cowie et al. 2007). Average slope of the catchments is 2.5%. The catchments consisted of good quality agricultural land, all equally suitable for cropping or grazing (Cowie et al. 2007). The physiochemical characteristics of an upper-slope Vertosol, and a Sodosol, both within C1, are given in Table 1 (adapted from Cowie et al. 2007). These sites were sampled in 1981 with sampling and sample handling procedures described in subsequent sections. Values for pH, electrical conductivity (EC) and Cl were determined using 1 : 5 suspensions in water (Hunter and Cowie 1989). Total carbon, TN and total OC were determined by Dumas high-temperature combustion as described in methods 6B2a, 7A5 and 6B5 respectively, in Rayment and Lyons (2011). Walkley and Black OC was determined according to method 6A1 in Rayment and Higginson (1992). Nitrate-nitrogen (NO3-N) was determined by the potassium chloride extraction method described in method 7C2 in Rayment and Higginson (1992). Cation exchange capacity and exchangeable cations were determined by extraction with alcoholic one molar ammonium chloride at pH 8.5 as described in method 15C1 in Rayment and Higginson (1992). Clay content was determined by drink mixer physical dispersion (Bouyoucos 1951) followed by fine-fraction determination by hydrometer (Thorburn and Shaw 1987; Hunter and Cowie 1989).

|
Vegetation
Vegetation was typical of the Brigalow Belt bioregion, dominated by brigalow (Acacia harpophylla), as described in detail by Cowie et al. (2007). In their native ‘brigalow’ state, the catchments were composed of three major vegetation communities, identified by their most common canopy species: brigalow (Acacia harpophylla), brigalow–belah (Casuarina cristata) and brigalow–Dawson gum (Eucalyptus cambageana). Understoreys of all major communities were characterised by Geijera sp. either exclusively, or in association with Eremophila sp. or Myoporum sp.
Site history and management
The study has had four experimental stages (Table 2). Stage I, the calibration phase, monitored rainfall and runoff from the catchments, allowing an empirical hydrological calibration between catchments to be developed. The permanent monitoring sites were established in each catchment during this stage. Baseline measurements of soil fertility were taken in 1981 (Cowie et al. 2007; Radford et al. 2007).

|
Stage II, the land development phase, commenced in March 1982 when vegetation in C2 and C3 was developed by clearing with traditional bulldozer and chain methods. Catchment 1 was retained as an uncleared, undisturbed control. In C2 and C3, the fallen timber was burnt in situ in October 1982. Following burning, residual unburnt timber in C2 was raked to the contour for secondary burning. Narrow-based contour banks were then constructed at 1.5 m vertical spacing. A grassed waterway was established to carry runoff water from the contour channels to the catchment outlet. In C3, residual unburnt timber was left in place, and in November 1982 the catchment was sown to buffel grass (Cenchrus ciliaris cv. Biloela). The second soil fertility assessment was undertaken in December 1982, soon after burning.
Stage III, the land use comparison phase, commenced in 1984. In C2, the first crop sown was sorghum (Sorghum bicolor) (September 1984), followed by annual wheat (Triticum aestivum) for nine years. Fallows were initially managed using mechanical tillage (disc and chisel ploughs), which resulted in significant soil disturbance and low soil cover. In 1992, a minimum tillage philosophy was introduced and in 1995 opportunity cropping commenced with summer (sorghum) or winter (wheat, barley (Hordeum vulgare) and chickpea (Cicer arietinum) crops sown when soil water content was adequate. No nutrient inputs were used. In C3, the buffel grass pasture established well with >5 plants/m2 and 96% groundcover achieved before cattle grazing commenced in December 1983. Stocking rate was 0.3–0.7 head/ha (each stock typically 0.8 adult equivalent), adjusted to maintain pasture dry matter levels >1000 kg/ha without nutrient inputs, feed or nutrient supplementation. The catchment was continuously stocked until December 1996 at which point irregular pasture spelling commenced when pasture dry matter was likely to decline below 1000 kg/ha with further grazing.
Stage IV, the adaptive land management phase, commenced in 2010. To sustain productive agricultural systems representative of commercial enterprises in the Brigalow Belt bioregion, management strategies to maintain or enhance soil fertility were implemented. In C2, the legume butterfly pea (Clitoria ternatea) was planted as a ley pasture in January 2010. The butterfly pea was left ungrazed to establish and set seed until March 2011 when grazing commenced. In September 2011, cattle were removed from both C2 and C3 to allow spelling of the pastures over the 2011/12 and 2012/13 wet seasons. Grazing recommenced in December 2013 when the catchments were ‘crash grazed’ with high stocking rates of 0.5 adult equivalents/ha in C2 and 1.4 adult equivalents/ha in C3 for 45 days to reduce rank pasture growth. Subsequently, grazing continued at conservative stocking rates of ~0.3 adult equivalents/ha with regular periods of pasture spelling.
Soil sampling
Soil water in the surface 0.1 m of the soil profile was determined gravimetrically according to the methods of Cowie et al. (2007).
Soil samples for fertility analysis were collected from the surface 0.1 m of the soil profile at each monitoring site using manual coring tubes of 0.05 m diameter; samples were typically a composite of eight 0.05 m cores. The eight cores were comprised of two cores sampled adjacent to each of four fixed locations within each subunit. More intensive sampling was undertaken pre-clearing in 1981, and in 2008 and 2014. In these years, samples were a composite of 20 cores, with five cores sampled adjacent to each of the four fixed locations. Soil samples were collected annually from pre-clearing in 1981 to 1987 and then in 1990, 1994, 1997, 2000, 2003, 2008 and 2014, with samples retained after analysis in a long-term storage archive.
Measurements of agricultural productivity, nutrient removal and nutrient inputs
In the cropped catchment, grain yield and nitrogen and phosphorus contents were measured according to the methods of Radford et al. (2007). Grain sulfur content was estimated as grain nitrogen multiplied by 10% (Byers et al. 1987; Győri 2005). Grain potassium content was estimated as 0.46% of grain yield (Mengel and Kirby 1982).
In the grazed catchment, cattle liveweight gain was measured according to the method of Radford et al. (2007). Nutrient export in beef was estimated as liveweight gain multiplied by 2.4% for nitrogen (Radford et al. 2007), 0.71% for phosphorus (Gibson et al. 2002), 0.16% for sulfur (National Research Council 2003) and 0.2% for potassium (Whitehead 2000). Nitrogen volatilisation loss from cattle urine and faeces was estimated as nitrogen intake multiplied by 19.77% (Laubach et al. 2013). Nitrogen intake was estimated as dietary biomass intake multiplied by dietary nitrogen content. Daily dietary biomass intake was estimated as fasted animal liveweight at entry to the catchment multiplied by 2% per day of grazing (Minson and McDonald 1987). Dietary nitrogen content was determined using the FNIRS technique of Dixon and Coates (2010).
Estimates of nutrient input from rainfall were obtained using the data of Packett (2017) multiplied by the annual average rainfall of the BCS. An average of rainfall chemistry values for Rockhampton and Emerald (mean values) were used given both sites are a similar distance from the BCS.
Soil physical and chemical analyses
Soil bulk density was measured pre-clearing in 1981, then post-clearing in 1984, 1987, 1994, 1997, 2000 and 2014, using the soil samples collected for fertility analysis. The tip diameter of the coring tubes was measured in the field with the external wall of the tube marked at 0.1 m to indicate the depth of sampling. Intact soil cores not contaminated by rocks or organic matter >2 mm were dried at 40°C then weighed and subsampled, with the subsamples then dried at 105°C to a constant weight. Bulk density was calculated from the total sample mass corrected to the equivalent mass of 105°C oven-dry soil, per volume of core sampled.
Chemical analyses were performed by the Queensland Government soil laboratory network. Prior to analyses, soil samples were dried at 40°C and ground to pass through a 2 mm sieve. Samples were then analysed for soil pH, OC, TN, mineral nitrogen (ammonium-nitrogen (NH4-N) and NO3-N), total phosphorus (TP), available phosphorus (bicarbonate- and acid-extractable phosphorus; P(B) and P(A) respectively), total sulfur (TS), total potassium (TK) and exchangeable potassium. Soil pH in a 1 : 5 soil/water suspension (pH(w)) was determined according to the method of Tucker and Beatty (1974) from 1981 to 1983, in 1985 and from 1987 to 1997. In all other years, pH(w) was determined according to method 4A1 in Rayment and Higginson (1992). Soil pH in a 1 : 5 soil/calcium chloride suspension (pH(Ca)) was determined according to the method of White (1969) from 1981 to 1983, in 1985 and in 1987. In all other years, pH(Ca) was determined according to method 4B1 in Rayment and Higginson (1992). For laboratory convenience, method 4B2 has been used interchangeably with 4A1, as there is no significant difference in the results obtained from either method (Rayment and Higginson 1992). Where pH values have been averaged, they are presented as a true average pH, not an arithmetic average (Rayment and Lyons 2011). Soil OC was determined by the dichromate oxidation method of Walkley and Black (1934), followed by titration. Post-1997, the titrimetric component of the procedure was replaced with a colourimetric procedure (Sims and Haby 1971) as described in method 6A1 in Rayment and Higginson (1992); these methods are well correlated (coefficient of determination (R2) = 0.96) (Cowie et al. 2002). Soil TN was determined by macro-Kjeldahl digestion (Bremner 1965). Mineral nitrogen was determined by the potassium chloride extraction method described in method 7C2 in Rayment and Higginson (1992). Results less than the practical quantitation level of 2 mg/kg were set to a value of 0.5 mg/kg. Soil TP was determined using the X-ray fluorescence (XRF) method described in method 9A1 in Rayment and Higginson (1992). Soil P(B) was determined using a modification of the Colwell (1963) method described in method 9B2 in Rayment and Higginson (1992), while P(A) was determined using a modification of the Kerr and von Stieglitz (1938) method described in method 9G2 in Rayment and Higginson (1992). Soil TS and TK were determined using the XRF method described in methods 10 A1 and 17A1 respectively in Rayment and Higginson (1992). Exchangeable potassium (Exch. K) was determined by extraction with alcoholic one molar ammonium chloride at pH 8.5 as described in method 15C1 in Rayment and Higginson (1992).
The full suite of chemical analyses was typically performed soon after soil sampling. When this had not occurred, analyses were performed as required on the archived samples. Cowie et al. (2007) presented chemical data from C1 in 1981 for most of the analytes reported in this study. However, with the exception of mineral nitrogen and Exch. K, repeat analyses in this study did not reflect the previously reported values, which were typically lower despite having been conducted according to the same method and utilising best practice of the day. Where this occurred, the results of the repeat analysis have been accepted for use in this study.
The number of samples analysed varied between soil samplings (Table 3). At a minimum, a composite sample comprised of a subsample of each of the 10 subunits in a monitoring site was generated for analysis. This composite sample was representative of at least 80 soil cores from within a monitoring site. Alternatively, a sample from each of the subunits in a monitoring site was generated for analysis. This resulted in 10 samples, with each being representative of at least eight soil cores.

|
Approaches for assessing fertility decline
Comparison of observed soil fertility data
The observed soil fertility of a catchment was calculated as the average of the analytical results for all composite samples from the three monitoring sites within the catchment at the time of sampling. Changes in soil fertility over time since burning were assessed using both linear, exponential, double exponential and quadratic regression analysis tools in the statistical software package Genstat (VSN International 2016).
Calibrating to account for natural fertility change
The paired catchment design of the experiment allowed for the natural variation in soil fertility over time to be separated from the anthropogenic effects of land use change. This was done by dividing the observed soil fertility of C2 and C3 by the observed soil fertility of the control catchment C1. Analysis of these ratios accounts for likely change in the soil fertility of C2 and C3 had they remained uncleared and provides a more accurate estimation of change rather than simply comparing the observed fertility over time to pre-clearing levels. As for the observed data, changes in soil fertility over time since burning were assessed using regression analysis.
Results
Grain and beef production and associated nutrient removal
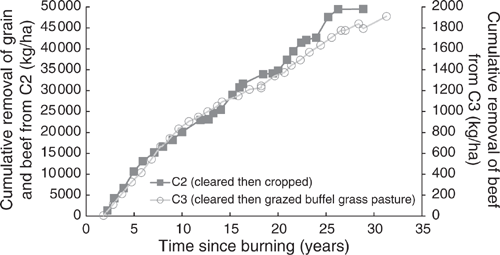
Grain production in C2 yielded 49 460 kg/ha of grain over 30 years (Fig. 2). This removed 958 kg/ha of nitrogen, 130 kg/ha of phosphorus, 96 kg/ha of sulfur and 228 kg/ha of potassium from the catchment. Removal of grain (P < 0.001, R2 = 99%) (Eqn 1), nitrogen (P < 0.001, R2 = 99%) (Eqn 2) and phosphorus (P < 0.001, R2 = 99%) (Eqn 3) over time since the first crop was planted all showed exponential trends. Grazing of ley pasture in C2 at a stocking rate of 0.33 adult equivalent animals per hectare for 173 days produced 46 kg/ha of beef. This removed 1.1 kg/ha of nitrogen, 0.3 kg/ha of phosphorus, 0.07 kg/ha of sulfur and 0.1 kg/ha of potassium from the catchment. This grazing period was 47 days longer than the average crop length from planting to harvest; however, nitrogen, phosphorus, sulfur and potassium removal in beef was only 3%, 6.5%, 2% and 1% respectively of that removed in an average crop:
|


where x is years since the first crop was planted.
Beef production in C3 yielded 1910 kg/ha of beef over 31 years (Fig. 2). This removed 46 kg/ha of nitrogen, 14 kg/ha of phosphorus, 3 kg/ha of sulfur and 4 kg/ha of potassium from the catchment. A further 71 kg/ha of nitrogen was removed via volatilisation from urine and faeces. Removal of beef over time since grazing commenced showed an exponential trend (P < 0.001, R2 = 99%) (Eqn 4) (Fig. 2). Because the nitrogen and phosphorus contents of beef were estimated based on a percentage of liveweight gain, the response curve for their removal from the catchment over time mirrored that of total beef removal:

where x is years since grazing commenced.
Trends in bulk density
Pre-clearing oven-dry bulk density for the three catchments in 1981 averaged 1.15 g/cm3 (range 1.1–1.22 g/cm3). Over the following 32 years there was no significant linear or exponential change in bulk density in C1 (P = 0.498 and P = 0.773 respectively). Clearing and burning followed by 30 years of cropping resulted in a significant linear increase in bulk density (P = 0.062, R2 = 44%). Fitting an exponential curve maintained the significance of the regression but improved R2 (P = 0.06, R2 = 63%). Ratios of C2/C1 bulk density showed no significant linear or exponential change (P = 0.136 and P = 0.292 respectively). Clearing and burning followed by 31 years of grazing resulted in a linear increase in bulk density (P = 0.097, R2 = 35%); no significant exponential change was detected (P = 0.14). Ratios of C3/C1 bulk density mirrored both the linear and exponential results of the observed data (P = 0.053, R2 = 47% and P = 0.132 respectively).
Observed bulk density in C2 and C3 post-clearing and burning was consistently higher than it was pre-clearing. Average bulk density post-clearing and burning was 116% of pre-clearing bulk density in C2 and 118% in C3. In the same period, bulk density in C1 declined to 98% of 1981 levels. Ratios of C2/C1 and C3/C1 bulk density were also higher post-clearing and burning, increasing to 119% and 120% of their respective pre-clearing ratios. As the average increase in bulk density in C2 and C3 equated to an additional 192 tonnes of soil in the surface 0.1 m of the soil profile, soil nutrient loss in kg/ha post-clearing and burning was calculated using the average bulk density of a catchment in that period, being 1.30 g/cm3 in C2 and 1.34 g/cm3 in C3.
In 1984 and 1987, soil water content was measured within two weeks of soil sampling occurring. In 1984, available soil water and bulk density at time of sampling was 5 mm and 1.18 g/cm3 respectively in C1; 14 mm and 1.26 g/cm3 in C2; and 17 mm and 1.30 g/cm3 in C3. In 1987, available soil water and bulk density at time of sampling was 4 mm and 1.21 g/cm3 respectively in C1; 23 mm and 1.21 g/cm3 in C2; and 12 mm and 1.33 g/cm3 in C3.
Trends in soil pH
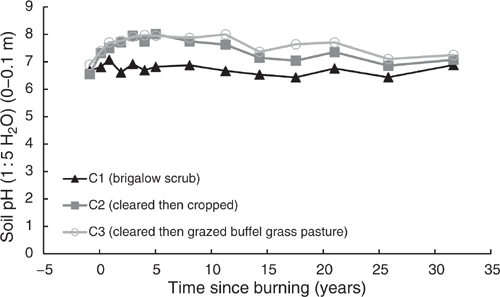
Pre-clearing, pH(w) in the three catchments averaged 6.7 (range 6.6–6.9). From 1981 to 2014, pH(w) in C1 averaged 6.7 with no significant linear or exponential trend (P = 0.237 and P = 0.36 respectively) (Fig. 3). Clearing and burning C2 and C3 in 1982 increased pH(w) in both catchments (Fig. 3). Visually, pH(w) continued to increase until 5 years post-burning in C2 and 11 years post-burning in C3. However, pH(w) had peaked within 2 years of burning, with no significant linear change in either catchment from 1.92 to 11.3 years post-burning (P = 0.355 and P = 0.256 respectively). The maximum pH(w) in both C2 and C3 was 8. Thirty-two years after burning, pH(w) in C2 was 7.1 and pH(w) in C3 was 7.3, both greater than their pre-clearing pH(w) of 6.6 and 6.9 respectively. The exponential rise in pH(w) post-burning, followed by a long-term linear decline was significant in both C2 (P < 0.001, R2 = 79%) (Eqn 1 in Table 4) and C3 (P < 0.001, R2 = 78%) when fitted with a double exponential curve (Eqn 2 in Table 4).
|

|
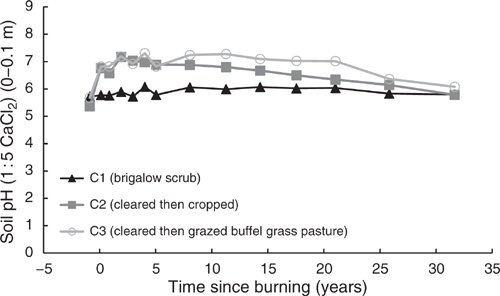
The behaviour of pH(w) in all catchments was mirrored by pH(Ca) (Fig. 4). From 1981 to 2014, pH(Ca) in C1 averaged 5.9 with no significant linear or exponential trend (P = 0.357 and P = 0.069 respectively). The exponential rise in pH(Ca) post-burning, followed by a long-term linear decline was significant in both C2 (P < 0.001, R2 = 93%) (Eqn 3 in Table 4) and C3 (P < 0.001, R2 = 72%) (Eqn 4 in Table 4). Values of pH(Ca) were 0.3–1.3 pH units less than pH(w).
|
Trends in observed soil fertility data
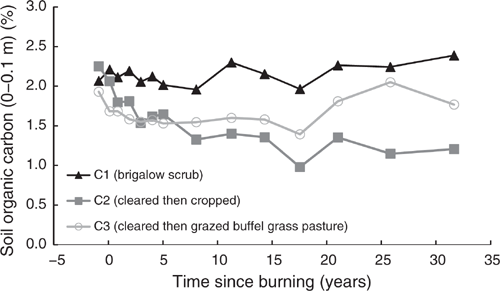
Organic carbon
Pre-clearing, OC concentrations in the three catchments averaged 2.08% (range 1.93–2.25%). From 1981 to 2014, OC in C1 averaged 2.15% with no significant linear or exponential trend (P = 0.061 and P = 0.066 respectively) (Fig. 5). Unlike C1, OC in C2 showed a significant exponential decline of 46% from 2.25% in 1981 to 1.21% in 2014 (P < 0.001, R2 = 88%) (Eqn 5 in Table 4) (Fig. 5). In C3, OC showed no significant linear or exponential trends from 1981 to 2014 (P = 0.293 and P = 0.343 respectively) (Fig. 5). However, this analysis masks a significant exponential decline of 28% from 1.93% in 1981 to 1.39% in 2000 (P < 0.001, R2 = 79%) (Eqn 6 in Table 4) (Fig. 5) followed by an increase from 2000 to 2014.
|
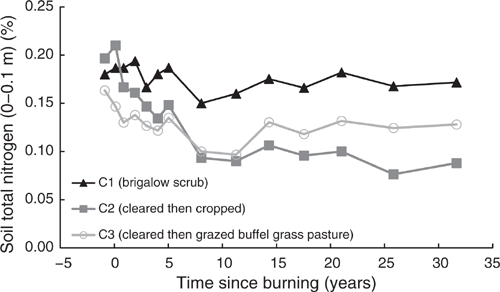
Total nitrogen
Pre-clearing, TN concentrations in the three catchments averaged 0.18% (range 0.163–0.197%). From 1981 to 2014, TN in C1 averaged 1.75% with no significant linear or exponential trend (P = 0.191 and P = 0.161 respectively) (Fig. 6). Unlike C1, TN in C2 showed a significant exponential decline of 55%, or 1050 kg/ha, from 0.197% in 1981 to 0.088% in 2014 (P < 0.001, R2 = 91%) (Eqn 7 in Table 4) (Fig. 6). Similar to C2, C3 showed a significant exponential decline of 22%, or 143 kg/ha, from 0.163% in 1981 to 0.128% in 2014 (P = 0.01, R2 = 49%) (Eqn 8 in Table 4) (Fig. 6).
|
These declines were exceeded when considering only the period 1981–2008, before the commencement of the adaptive land management phase to enhance soil fertility. In this period, TN in C2 showed a significant exponential decline of 61% or 1201 kg/ha, while TN in C3 showed a significant exponential decline of 24% or 192 kg/ha. From 2010 to 2014, the adaptive land management phase, TN in C1 and C3 had similar increases of 2.4% and 2.9% respectively; however, TN in C2 increased by 15.3% or 151 kg/ha.
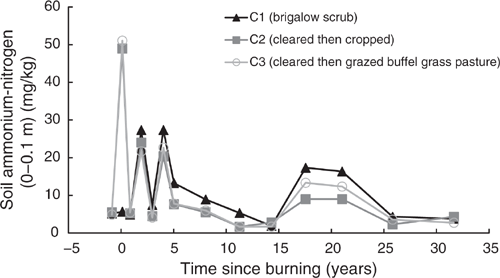
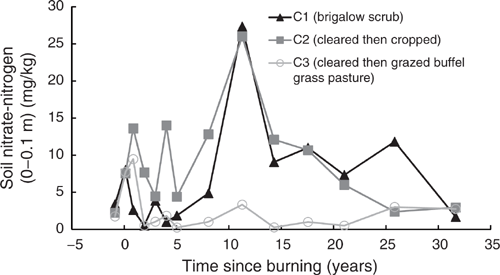
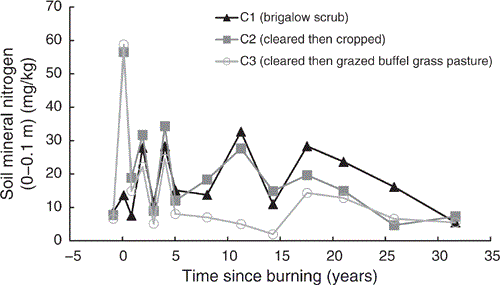
Mineral nitrogen
Pre-clearing, NH4-N concentrations in the three catchments averaged 5.19 mg/kg (range 4.87–5.5 mg/kg) and NO3-N averaged 2.46 mg/kg (range 1.74–3.4 mg/kg). Average mineral nitrogen, being the sum of NH4- and NO3-N, was 7.65 mg/kg (range 6.61–8.58 mg/kg) (Figs 7–9). In the first sampling post-burning, NH4-N in C2 and C3 spiked to an average of 8.9 times their pre-clearing concentrations when adjusted for the natural increase in NH4-N observed in C1 (Fig. 7). This spike was short lived and by the following sampling, less than one year post-burning, NH4-N concentrations in C2 and C3 declined back to that of C1. The NH4-N concentrations fluctuated at all subsequent samplings, with C1 typically having highest concentrations and C2 and C3 having similar lower concentrations.
|
|
|
The NO3-N in C2 and C3 had a similar spike post-clearing, increasing to an average of 7.5 times pre-clearing concentrations when adjusted for the natural decline in NO3-N observed in C1 (Fig. 8). The spike was observed after the NH4-N spike had declined back to pre-clearing concentrations. Elevated NO3-N concentrations were observed in C2 for at least eight years post-burning, after which concentrations and fluctuations were similar to those observed in C1. Elevated NO3-N concentrations in C3 declined within two years of burning and typically remained less than those observed in C1 with substantially less fluctuation.
Total mineral nitrogen showed a post-burning spike in C2 and C3 of 5.1 times their pre-clearing mineral nitrogen when adjusted for the natural increase in mineral nitrogen observed in C1 (Fig. 9). These increases declined substantially within one year post-burning and fluctuated similarly to mineral nitrogen concentrations in C1 up to five years post-burning. From this point mineral nitrogen in C1 and C2 had similar concentrations and fluctuations; however, concentrations in C3 were typically lower with less fluctuation.
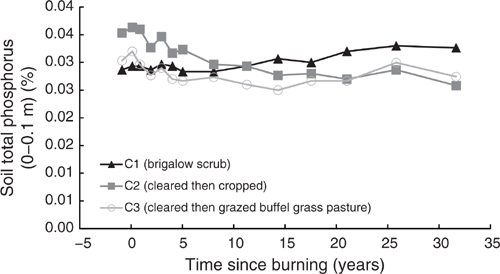
Total phosphorus
Pre-clearing, TP concentrations in the three catchments averaged 0.031% (range 0.029–0.035%). In C1, TP showed a significant linear and exponential (Eqn 9 in Table 4) increase of 14% from 0.029% in 1981 to 0.033% in 2014 (P < 0.001, R2 = 76% and P < 0.001, R2 = 77% respectively) (Fig. 10). This increase was not constant over time, with no significant linear or exponential trend occurring before 2003 (P = 0.082 and P = 0.15 respectively).
|
Clearing and burning C2 and C3 increased TP by an average of 4%. Post-burning, TP in C2 showed a significant exponential decline of 29%, or 131 kg/ha, from 0.036% in 1982 to 0.027% in 2014 (P < 0.001, R2 = 91%) (Eqn 10 in Table 4) (Fig. 10). Similarly, TP in C3 showed a significant exponential decline of 14% or 59 kg/ha, from 0.032% in 1982 to 0.027% in 2014 (P = 0.009, R2 = 53%) (Eqn 11 in Table 4) (Fig. 10). Visually, the decline in C3 was most prevalent from 1982 to 1997 followed by an increase from 2000 to 2014. This is supported by linear regression showing increasing P-values and decreasing R2 with each successive sampling from 1997 onwards. Fitting an exponential curve showed similar results with R2 declining from 81% at 2003 to 52% at 2008.
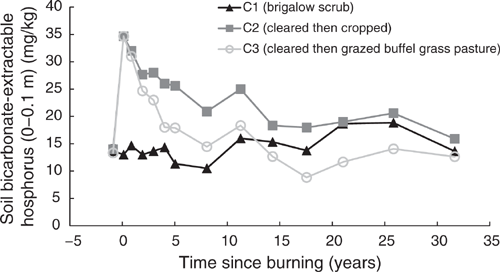
Bicarbonate-extractable phosphorus
Pre-clearing, P(B) concentrations in the three catchments averaged 13.67 mg/kg (range 13.3–14 mg/kg). From 1981 to 2014, P(B) in C1 averaged 14.31 mg/kg and showed no significant linear or exponential trend (P = 0.063 and P = 0.18 respectively) (Fig. 11). Clearing and burning C2 and C3 increased P(B) by an average of 2.5 times pre-clearing concentrations. After this initial increase a significant exponential decline occurred from 1982 to 2014 in both C2 (P < 0.001, R2 = 88%) (Eqn 12 in Table 4) and C3 (P < 0.001, R2 = 92%) (Eqn 13 in Table 4) (Fig. 11). Thirty-two years after the increase in P(B) concentrations as a result of burning, P(B) concentrations in C2 had declined to 15.9 mg/kg, equal to 114% of its pre-clearing concentration; P(B) concentrations in C3 had declined to 12.63 mg/kg, equal to 95% of its pre-clearing concentration. On a kg/ha basis, this was a decline of 18 kg/ha in C2 and 23 kg/ha in C3. During this 32-year period there was no significant correlation between P(B) and pH(w) in either C2 (P = 0.087) or C3 (P = 0.706).
|
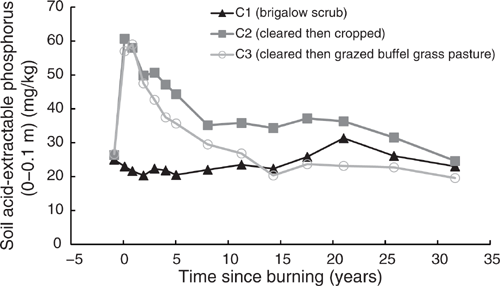
Acid-extractable phosphorus
The behaviour of P(A) in all three catchments mirrored that of P(B). Pre-clearing, P(A) concentrations in the three catchments averaged 26 mg/kg (range 25–26.3 mg/kg). From 1981 to 2014, C1 P(A) averaged 23.48 mg/kg and showed no significant linear or exponential trend (P = 0.063 and P = 0.18 respectively) (Fig. 12). Clearing and burning C2 and C3 increased P(A) by an average of 2.2 times pre-clearing concentrations. After this initial increase a significant exponential decline occurred from 1982 to 2014 in both in C2 (P < 0.001, R2 = 91%) (Eqn 14 in Table 4) and C3 (P < 0.001, R2 = 97%) (Eqn 15 in Table 4) (Fig. 12). At 32 years post-burning, P(A) concentrations in C2 had declined to 24.63 mg/kg, equal to 94% of its pre-clearing concentration; P(A) concentrations in C3 had declined to 19.57 mg/kg, equal to 73% of its pre-clearing concentration. On a kg/ha basis, this was a decline of 36 kg/ha in C2 and 39 kg/ha in C3. During this 32-year period there was no significant correlation between P(A) and pH(w) in either C2 (P = 0.108) or C3 (P = 0.391).
|
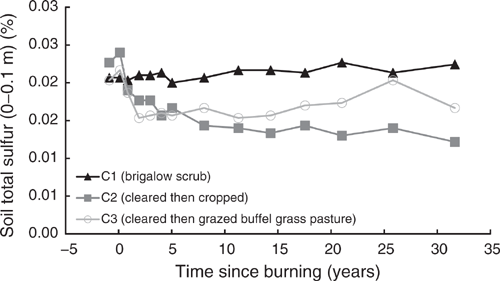
Total sulfur
Pre-clearing, TS concentrations in the three catchments averaged 0.021% (range 0.02–0.023%). In C1, TS showed a significant linear and exponential (Eqn 16 in Table 4) increase of 9% from 0.021% in 1981 to 0.022% in 2014 (P = 0.002, R2 = 55% and P = 0.008, R2 = 51% respectively) (Fig. 13). As for TP, this increase was not constant over time with no significant linear trend occurring before 2000 (P = 0.058) or exponential trend before 2003 (P = 0.145).
|
Clearing and burning C2 and C3 increased TS by an average of 6%. Post-burning, TS in C2 showed a significant exponential decline of 49%, or 153 kg/ha, from 0.024% in 1982 to 0.012% in 2014 (P < 0.001, R2 = 90%) (Eqn 17 in Table 4) (Fig. 13). Data from C3 did not meet the assumptions for valid statistical testing so no statement of significance can be made about trends over the entire 32-year post-burning period. However, the calculated loss of TS was 23%, or 67 kg/ha, from 0.022% in 1982 to 0.017% in 2014. Visually, the increase in TS associated with clearing and burning declined rapidly from 1982 to 1984 followed by a gradual increase with a substantial spike in 2008 (Fig. 13). The initial decline during 1982–1987 was exponential (P = 0.009, R2 = 93%). An exponential curve could be fitted to the data up to 2003 (P = 0.001, R2 = 80%); however, inclusion of the 2008 data resulted in a nonsignificant regression (P = 0.286). No significant linear trend occurred from 1984 to 2000 (P = 0.211); however, incremental inclusion of data for 2003–2014 showed significant increases in TS (P = 0.005 to 0.037, R2 = 35% to 60%).
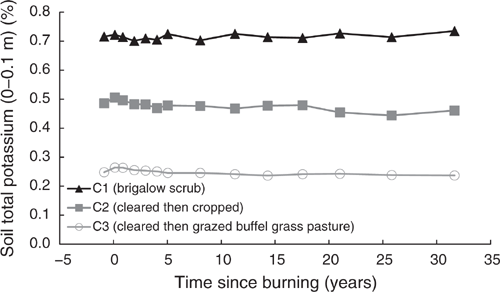
Total potassium
Pre-clearing, TK concentrations in the three catchments averaged 0.483% (range 0.248–0.716%). In C1, TK averaged 0.716% and showed no significant linear or exponential trend from 1981 to 2014 (P = 0.084 and P = 0.119 respectively) (Fig. 14).
|
Clearing and burning C2 and C3 increased TK by an average of 5%. Post-burning, TK in C2 showed a significant exponential decline of 9% or 579 kg/ha, from 0.506% in 1982 to 0.461% in 2014 (P = 0.004, R2 = 61%) (Eqn 18 in Table 4). Post-burning, TK in C3 showed a significant exponential decline of 10% or 364 kg/ha, from 0.264% in 1982 to 0.237% in 2014 (P < 0.001, R2 = 94%) (Eqn 19 in Table 4) (Fig. 14). At 32 years post-burning, TK concentrations in C2 had declined to 0.461%, equal to 95% of its pre-clearing concentration; TK concentrations in C3 had declined to 0.237%, equal to 96% of its pre-clearing concentration.
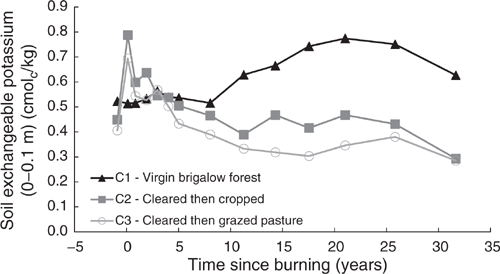
Exchangeable potassium
Pre-clearing, Exch. K concentrations in the three catchments averaged 0.46 cmolc/kg (range 0.41–0.52 cmolc/kg). From 1981 to 1990, Exch. K in C1 averaged 0.53 cmolc/kg with no significant linear or exponential trend (P = 0.729 and P = 0.731 respectively) (Fig. 15). From 1990 to 2003, Exch. K increased, peaking at 0.77 cmolc/kg, before declining to 0.63 cmolc/kg in 2014 (Fig. 15). The Exch. K trend for the whole 32-year period was best described by a quadratic-by-quadratic curve (P < 0.001, R2 = 94%) (Eqn 20 in Table 4).
|
Clearing and burning C2 and C3 increased Exch. K by an average of 1.7 times pre-clearing concentrations. After this initial increase a significant exponential decline occurred from 1982 to 2014 in both C2 (P < 0.001, R2 = 80%) (Eqn 21 in Table 4) and C3 (P < 0.001, R2 = 89%) (Eqn 22 in Table 4) (Fig. 15). Thirty-two years after the increase in Exch. K concentrations as a result of burning, Exch. K concentrations in C2 had declined to 0.29 cmolc/kg, equal to 65% of its pre-clearing concentration; Exch. K concentrations in C3 had declined to 0.28 cmolc/kg, equal to 70% of its pre-clearing concentration.
Trends after accounting for natural fertility change
Organic carbon
Similar to the observed C2 OC data, the C2/C1 OC ratio also showed a significant exponential decline from 1981 to 2014 (P < 0.001, R2 = 91%) (Eqn 1 in Table 5). However, the 54% decline in the ratio was greater than the 46% decline in the observed C2 OC data. In contrast to the observed C3 OC data, the C3/C1 OC ratio showed a significant exponential decline of 21% (P = 0.05, R2 = 32%) from 1981 to 2014 (Eqn 2 in Table 5). The exponential decline of 24% (P = 0.002, R2 = 74%) in the C3/C1 OC ratio from 1981 to 2000 was similar to the observed data.

|
Total nitrogen
The C2/C1 TN ratio behaved similarly to the observed C2 TN data. The ratio showed a significant exponential decline of 53% from 1981 to 2014 (P < 0.001, R2 = 93%) (Eqn 3 in Table 5). Prior to the commencement of the adaptive land management phase the ratio showed a significant exponential decline of 58% from 1981 to 2014 (P < 0.001, R2 = 92%). From 2010 to 2014, the adaptive land management phase, the ratio increased by 13%. The C3/C1 TN data also behaved similarly to the observed C3 TN data. The ratio showed a significant exponential decline of 18% from 1981 to 2014 (P = 0.004, R2 = 57%) (Eqn 4 in Table 5). From 2010 to 2014, the adaptive land management phase, the ratio increased by 1%.
Total phosphorus
Compared with the observed TP data, both C2/C1 and C3/C1 TP ratios showed smaller increases with clearing and burning, averaging 2%, but greater declines over time. In C2, the C2/C1 TP ratio showed a significant exponential decline of 36% from 1982 to 2014 (P < 0.001, R2 = 95%) (Eqn 5 in Table 5). In C3, the C3/C1 TP ratio showed a significant exponential decline of 23% from 1982 to 2014 (P < 0.001, R2 = 75%) (Eqn 6 in Table 5).
Bicarbonate-extractable phosphorus
Compared with the observed P(B) data, both C2/C1 and C3/C1 P(B) ratios showed greater increases with clearing and burning, averaging 2.7 times the pre-clearing ratio, but similar declines over time from 1984 to 2014. The significant exponential decline in the C2/C1 ratio (P < 0.001, R2 = 86%) (Eqn 7 in Table 5) to 114% of its pre-clearing ratio over 32 years post-burning, equalled the change in the observed data. The significant exponential decline in the C3/C1 ratio (P < 0.001, R2 = 91%) (Eqn 8 in Table 5) to 95% of its pre-clearing ratio also equalled the change in the observed data.
Acid-extractable phosphorus
As for the P(B) ratios, both C2/C1 and C3/C1 P(A) ratios showed greater increases with clearing and burning compared with the observed P(A) data, averaging 2.4 times the pre-clearing ratio. However, over the 32 years post-burning, the P(A) ratios showed a smaller decline than the observed data. From 1982 to 2014, the C2/C1 P(A) ratio had a significant exponential decline (P < 0.001, R2 = 97%) (Eqn 9 in Table 5) to 102% of its pre-clearing ratio while the C3/C1 P(A) ratio had a significant exponential decline (P < 0.001, R2 = 97%) (Eqn 10 in Table 5) to 80% of its pre-clearing ratio.
Total sulfur
Clearing and burning C2 and C3 increased ratios of C2/C1 and C3/C1 TS by an average of 6%, equalling the average increase in the observed data. Post-burning, the C2/C1 TS ratio showed a significant exponential decline of 53% from 1982 to 2014 (P < 0.001, R2 = 87%) (Eqn 11 in Table 5), similar to the observed data. In contrast to the observed C3 TS data, which did not meet the assumptions for valid statistical testing, the C3/C1 TS ratio could be fitted with a significant exponential decline curve (P = 0.009, R2 = 53%) for the whole post-burning period (Eqn 12 in Table 5). The decline in the C3/C1 TS ratio from 1982 to 2014 was 29%.
Total potassium
Clearing and burning C2 and C3 increased ratios of C2/C1 and C3/C1 TK by an average of 4%, similar to the observed data. Post-burning, the ratios for both catchments showed significant exponential declines, similar to the observed data. From 1982 to 2014, the C2/C1 TK ratio declined by 10% (P = 0.001, R2 = 68%) (Eqn 13 in Table 5) and the C3/C1 TK ratio declined by 12% (P < 0.001, R2 = 85%) (Eqn 14 in Table 5).
Exchangeable potassium
Compared with the observed Exch. K data, both C2/C1 and C3/C1 Exch. K ratios showed greater increases with clearing and burning, averaging 1.8 times the pre-clearing ratio. The significant exponential decline in the C2/C1 ratio (P < 0.001, R2 = 91%) (Eqn 15 in Table 5) to 55% of its pre-clearing ratio over 32 years post-burning, was greater than the decline in the observed data. The significant exponential decline in the C3/C1 ratio (P < 0.001, R2 = 94%) (Eqn 16 in Table 5) to 59% of its pre-clearing ratio was also greater than the decline in the observed data.
Comparison of approaches for assessing fertility decline
All of the significant declines in observed soil fertility post-burning in both C2 and C3 (Table 4) were confirmed by the ratio analysis (Table 5). When the observed soil fertility data from C2 was adjusted for the natural variation in soil fertility in the control catchment, the R2 of the exponential decline curves increased by an average of 3% with a maximum change of 12%. When this adjustment was made for C3, the R2 of the exponential decline curves increased by an average of 9%; however, the maximum change was 42%. While observed C3 OC and TS data showed no significant change in the 32 years post-burning, adjusting for the natural variation in soil fertility in the control catchment revealed a significant decline, similar to C2.
Correlations between soil nitrogen and phosphorus decline and removal in produce
The sum of total nitrogen removed from C2 in grain between soil samplings showed an exponential relationship with soil TN (P = 0.061, R2 = 54%) (Eqn 5). The sum of total phosphorus removed showed an exponential relationship with TP (P = 0.014, R2 = 75%) (Eqn 6), P(A) (P = 0.01, R2 = 78%) (Eqn 7) and P(B) (P = 0.061, R2 = 54%) (Eqn 8).


The sum of total nitrogen and total phosphorus removed from C3 in beef showed no significant correlation with soil TN (P = 0.907) and soil TP (P = 0.702) respectively. The sum of total phosphorus removed showed an exponential relationship with P(A) (P < 0.001, R2 = 97%) (Eqn 9) and P(B) (P = 0.002, R2 = 75%) (Eqn 10).


Discussion
Nutrient cycling in natural ecosystems was traditionally considered a steady-state, closed system, with nutrients being taken up from the soil by plant roots and being recycled back to the soil through leaf and litter fall and root decay (Murty et al. 2002; Radford et al. 2007). Under this hypothesis it is expected that no change in soil fertility would occur under brigalow scrub. This was generally supported by the study data, with no significant change in OC, TN, P(B), P(A) and TK. Radford et al.’s (2007) study of OC and TN at this site from 1981 to 2003 also supports the hypothesis. However, as rainfall patterns fluctuate over time, extended wet periods are likely to result in increased nutrient uptake from deeper down the soil profile by the extending root systems of actively growing plants, followed by increased leaf and litter fall and root decay. This may lead to measurable nutrient redistribution at particular timescales within an otherwise steady-state ecosystem. This redistribution may account for the increases noted in TP and TS. Alternative mechanisms for redistribution include the ability of plants to move water through the soil profile via hydraulic lift and downward siphoning, allowing access to nutrients otherwise unavailable due to inadequate soil moisture (Sardans and Peñuelas 2014). Rainfall also provides nutrient inputs. The rainfall nutrient concentrations reported by Packett (2017) indicate that from 1981 to 2014, an estimated 60 kg/ha of dissolved nitrogen, 0.5 kg/ha of dissolved phosphorus (in the form of phosphate) and 1070 kg/ha of dissolved sulfur (in the form of sulfate) have been supplied in rainfall. The magnitude of these inputs has increased over time as a result of anthropogenic activity which, for example, has increased atmospheric concentrations of carbon dioxide and nitrogen (Tipping et al. 2017; Schulte-Uebbing and de Vries 2018). These inputs are a counter to the natural loss of nutrients in runoff and may also explain fluctuations within what was traditionally considered a steady-state ecosystem. Feedback cycles between increasing deposition of carbon and nitrogen and increasing temperature may also contribute to fertility changes (Crowther et al. 2016; Tipping et al. 2017), which would affect all land uses, but would likely be easiest to detect in virgin ecosystems where no other treatment effects are present.
Irrespective of the analysis methodology, two distinct trends in soil fertility were observed as a result of land development and land use change. The first trend was for clearing and burning to release a flush of nutrients which subsequently declined over time to near, or below, pre-clearing concentrations. The clearest display of this trend was in mineral nitrogen and available phosphorus, with smaller increases in TP, TS and TK. The second trend was an ongoing decline in fertility commencing at clearing. This was observed in OC and TN. Both of these trends reflect predictions that clearing brigalow followed by subsequent exploitative land use would result in declining nutrient availability and landscape productivity (Dowling et al. 1986).
The effect of land clearing and burning on soil bulk density
Worldwide, an increase in bulk density as a result of land development and long-term cropping or grazing is commonplace (Dalal and Mayer 1986b; Murty et al. 2002; Dalal et al. 2005). The primary mechanism for increase is physical compaction by machinery and animal hoof traffic, and the degradation of soil structure and loss of organic matter in tilled soil. Conceptually, land use change followed by more than 30 years of either cropping or grazing should have increased bulk density in both the cropped and grazed catchments of this study. Although the significance of trends identified via regression analysis varied, all comparisons of pre-clearing bulk density with long-term averages under cropping and grazing showed an increase with land development. In the same period, bulk density under brigalow remained constant. Changes in the ratios of bulk density between the developed catchments and the control catchment also suggested an increase with land development.
Determining change in bulk density was confounded due to it only being measured in seven of the 14 sampling events. In addition to limited data, other confounding issues include differing soil water content between samplings and the corresponding shrinking and swelling characteristics of Vertosols; and the ability of the chosen core diameter to obtain representative samples, particularly in heavily cracked dry soils, in wet soils prone to compaction or distortion and in soils prone to shattering (Berndt and Coughlan 1977; Coughlan et al. 1987; Al-Shammary et al. 2018).
Coughlan et al. (1987) stress the influence of soil water content on bulk density and note that the swelling of Vertosols with increasing soil water and the resultant reduction in bulk density complicates the comparison of measurements over time. On two occasions soil water was measured within two weeks of a soil sampling event that had measured bulk density. In both instances, soil water under cropping and grazing was substantially greater than under brigalow. However, despite likely reductions in observed bulk density due to increased soil water storage, bulk densities of the agricultural catchments continued to be similar or higher than that of the brigalow catchment. This provides additional evidence that an increase in bulk density has occurred with land development and long-term cropping or grazing. Other than variations in soil water content, the primary limitation to measuring bulk density in this study is likely to be sampling error associated with loss of sample and inaccurate core trimming in friable soils or due to shattering of dry soil during coring.
The effect of land clearing and burning on soil pH
Globally, the burning of forests as a result of land use change and the burning of crop residues in agricultural systems both result in increased soil pH (Ellis and Graley 1983; Roder et al. 1993; Guinto et al. 2001; Herpin et al. 2002; Fraser and Scott 2011). The mechanism of this increase has been attributed to the deposition of ash which releases basic cations (Raison 1979; Guinto et al. 2001; Castelli and Lazzari 2002; Herpin et al. 2002). Upon wetting, these cations hydrolyse to form alkaline residues which convert to hydroxides or carbonates (Fraser and Scott 2011). Increases in soil pH as a result of burning have been shown to persist for decades (Herpin et al. 2002; Fraser and Scott 2011).
The increases in soil pH as a result of clearing and burning brigalow scrub in this study, the mechanism of increase and the persistence of increased pH, clearly follow typical global responses. For example, Hunter and Cowie (1989) attributed the initial increase in soil pH at this site to soil heating and the release of basic cations as a result of organic matter combustion. Alkaline salts were then likely leached from strongly alkaline ash deposits, which had an average pH of 12.5 (Hunter and Cowie 1989), further raising soil pH. Thirty-two years after burning, soil pH in both agricultural catchments was greater than it was pre-clearing.
The effect of raised soil pH on nutrient availability
Changes in soil pH can have implications for nutrient availability. The preferred range of soil pH(w) for plant growth is 6 (slightly acid) to 8 (slightly or mildly alkaline), with nutrient availability optimised in the range 6–7 (Rayment and Lyons 2011). For example, maximum phosphorus availability is considered to occur near pH 6.5 (Penn and Camberato 2019). Pre-clearing, soil pH(w) in C1 and C2 was classified as neutral, while C3 was classified as slightly or mildly alkaline (Bruce and Rayment 1982; Rayment and Lyons 2011). As such, the pH of the surface soil in its pre-cleared state is unlikely to limit nutrient availability. The increases in soil pH as a result of clearing and burning at this site were not great enough to raise the soil pH classifications of the catchments, with C2 remaining neutral and C3 remaining slightly or mildly alkaline; both still within the preferred range for plant growth. Despite being above the optimum range for nutrient availability, average soil pH(w) in C2 and C3 post-clearing and burning was below the threshold of 7.9 where plant availability of nutrients such as phosphorus may be restricted (Rayment and Lyons 2011).
About 36% of Queensland soils have a neutral or alkaline surface pH. Within the Brigalow Belt bioregion these neutral or alkaline soils are dominated by Black and Grey Vertosols (Ahern et al. 1994). The Vertosols of the BCS are representative of these soils, with average soil pH(w) values within the range reported for other Vertosols developed for cropping and grazing within the bioregion (Dalal and Mayer 1986b; Allen et al. 2016).The limited field data in the literature suggest that the pH of these well-buffered Vertosols (Ahern et al. 1994; Page et al. 2018) is not easily changed, much less raised to a level likely to limit plant growth. For example, additions of gypsum to a moderately alkaline Vertosol had no significant effect on pH (Hulugalle et al. 2010). Similarly, the addition of biochar, a product of organic matter combustion, to a neutral Vertosol had no significant effect on pH or crop productivity (Macdonald et al. 2014). Land use change was reported to increase soil pH(w) and limit nutrient availability for plant growth on a grazed Vertosol (Sangha et al. 2005). However, the natural variability in soil pH(w) reported for the three catchments in this study before clearing and burning equalled many of the increases in soil pH(w) that Sangha et al.(2005) attributed to land use change. This suggests that Sangha et al. (2005) found limited evidence of pH increase and resultant decline in nutrient availability.
Additionally, declines in available nutrients have been reported in the neutral or alkaline Vertosols of the Brigalow Belt bioregion in the absence of soil pH change. For example, significant declines in available phosphorus were observed over seven years of cropping with no significant change in pH (Standley et al. 1990). Similarly, significant declines in available phosphorus occurred in this study during a nine-year period with no significant change in soil pH. Over the entire experimental period, there was no significant correlation of soil pH(w) with P(B) and P(A) under cropping or grazing. Subsoil acidity, and to a lesser extent alkalinity (Dang et al. 2006a, 2006b, 2008; Page et al. 2018), is a much greater concern to agricultural production on the neutral or alkaline Vertosols of the Brigalow Belt bioregion than any unlikely reduction in nutrient availability as a result of fire-induced increases in surface soil pH.
The effect of land clearing and burning on soil fertility
Increases in mineral nitrogen, TP, available phosphorus, TS and TK as a result of burning vegetation on the soil surface, as observed in this study, are well documented in both the Australian and international literature (Ellis and Graley 1983; Kyuma et al. 1985; Carreira and Niell 1995; Castelli and Lazzari 2002; Brennan et al. 2004; Fraser and Scott 2011; Butler et al. 2017; MacDermott et al. 2017). The increase has been attributed to nutrient release from plant material and deposition in ash, and is often referred to as the ash bed effect (Raison 1979; Kyuma et al. 1985; Roder et al. 1993; Castelli and Lazzari 2002; Herpin et al. 2002; May and Attiwill 2003; Cowie et al. 2007). These increases are typically restricted to the surface few centimetres of the soil profile and often persist for only one to two years (Raison 1979; Ellis and Graley 1983; Kyuma et al. 1985; Castelli and Lazzari 2002).
Decreases in soil OC and TN as a result of burning are also well documented in Australian and international literature (May and Attiwill 2003; Oyedeji et al. 2016). However, some studies, including a meta-analysis, have shown no change in TN as a result of burning (Guinto et al. 2001; Wan et al. 2001). Initial soil nitrogen level, soil clay content and fire intensity can account for these contrasting observations. Firstly, low-fertility soils may have already lost their most fire-susceptible nitrogen fractions. Secondly, clay particles within soil assist in physically protecting organic matter from the effects of fire, therefore soils with varying clay content are likely to display different responses to burning (Guinto et al. 2001). Finally, low-intensity fires have been shown to increase TN whereas high-intensity fires decrease TN (Raison 1979). The fire intensity resulting from the burning of pulled brigalow scrub would be similar to that of slash fires and wildfires, providing intense heat for long periods (Johnson 1964). The loss of TN with burning observed in this study is consistent with that recorded from other sites subjected to high-intensity fires (Raison 1979).
The effect of land use change on soil OC
The decline in OC when brigalow scrub was developed for cropping supports the earlier findings of Radford et al. (2007) at this site, and mirrors the response of other pre-clearing Australian and international landscapes developed for, and managed as, long-term cropping (Murty et al. 2002; Collard and Zammit 2006). The decline is typically restricted to the surface soil layers no deeper than 1 m (Dalal et al. 2005). The mechanism is usually attributed to the removal of nutrients in harvested grain, reduced carbon inputs and the impacts of tillage on soil structure, chemical and biological processes including shattering, redistribution, oxidation and decomposition (Murty et al. 2002).
The finding of no significant change in observed OC when brigalow scrub was developed for grazing is in agreement with the findings of other studies conducted at this site (Radford et al. 2007; Dalal et al. 2011, 2013). The international review of Murty et al. (2002) concluded that on average, the conversion of forest to uncultivated grazing does not lead to a loss of OC; however, this does not hold for all specific sites. Within Australia, Harms et al. (2005) reported OC losses from coarse-textured soils such as Kandosols as a result of changing land use from native vegetation to grazing, but found no change in Sodosols and Vertosols, which reflect the soil types of this study. However, although no decline in OC was observed after clearing brigalow followed by grazing for 31 years, a significant decline was evident during the first 17 years of grazing – the period of continuous stocking before irregular spelling. When the observed OC data were adjusted for the natural variation in soil fertility in the control catchment, a statistically significant decline in the OC ratios between the catchments was found for the entire study period. These alternative approaches suggest that a decline in OC has occurred.
Change in OC cycling under grazing at this site is apparent in the observation that OC derived from the original brigalow vegetation comprised only 58% of measured OC while buffel grass-derived OC contributed the remaining 42% (Dalal et al. 2011). Without this replacement of carbon by buffel grass, a greater decline in total OC would have occurred. For example, declines in soil OC have been found at sites with low inputs of root biomass (Li et al. 2018), which is expected given that root biomass is the main source of carbon input to soil OC (Rasse et al. 2005). Indeed, long-term bare fallow sites with nil inputs of organic matter have been found to lose between 21% and 65% of initial soil OC over 36 and 80 years respectively (Barré et al. 2010). This may explain the observed increase in OC after the commencement of irregular spelling in 1996, undertaken specifically for the purpose of allowing regeneration of the buffel grass pasture. If grazing management over the 32 years since development had resulted in continual overgrazing, it is likely that the ability of the buffel grass pasture to sequester carbon and buffer fertility decline would have been reduced or negated (Conant and Paustian 2002).
Buffel grass growth is also highly responsive to seasonal rainfall trends, hence variation in the observed OC data could indicate changes in carbon inputs and nutrient redistribution within a steady-state ecosystem, as hypothesised could occur under brigalow scrub. The literature also shows that there is potential for increased OC sequestration with low precipitation and decreased sequestration with high precipitation. McSherry and Ritchie (2013) attribute this to greater, more active microbial biomass carbon and more labile organic matter pools in wetter environments, which may increase carbon turnover under grazing. This suggests that carbon sequestration at the study site is likely to vary temporally due to the variable semiarid climate, further explaining fluctuations in observed OC.
The effect of land use change on soil TN
As for OC, the decline in TN when brigalow scrub was developed for cropping supports the earlier findings of Radford et al. (2007) at this site. Significant loss of TN following the conversion of forest to cropping or multiple years of cultivated cropping alone was also found in other long-term studies (Dalal and Mayer 1986b; Dalal et al. 2005; Anaya and Huber-Sannwald 2015) and international reviews (Murty et al. 2002). Removal of nitrogen in grain has been identified as the primary mechanism of TN loss (Dalal and Mayer 1986a; Dalal et al. 2005) and was shown by Radford et al. (2007) to account for 39% of the TN lost from the surface 0.3 m of the soil profile at this site from 1981 to 2003. In agreement with these findings, regression analysis showed nitrogen removed from the cropped catchment as grain accounted for 54% of the variation in TN from 1981 to 2014. On a kg/ha basis, nitrogen removed from the catchment in grain accounted for 80% of the TN lost from the surface 0.1 m of the soil profile before planting of the legume ley pasture. In contrast, the equivalent of 8% of soil TN decline was lost in runoff (Elledge and Thornton 2017).
The increase in TN from 2008 to 2014 may be attributed to nitrogen fixation by the butterfly pea legume ley pasture planted in 2010. The ley pasture was planted in order to arrest the declining TN that was limiting the productivity of dryland farming in the catchment (Radford et al. 2007; Huth et al. 2010). The ability of butterfly pea to increase TN in a grazed ley pasture system is well documented in central Queensland (Collins and Grundy 2005). However, despite the addition of legumes into the cropping system, modelling suggests that fertility decline will continue (Huth et al. 2010).
With no pasture legumes to maintain fertility, developing brigalow scrub for grazing resulted in ongoing TN decline from 1981 to 2014. This supports the findings of Dalal et al. (2013), who found significant decline in TN at this site 23 years after clearing brigalow scrub for grazing. However, both of these studies contrast with the findings of Radford et al. (2007). This is likely due to differences in sampling strategies, analytical methods and the specific comparisons made. This current study reports the longest period of record, used the most intensive sampling strategy, consistent analytical methodology and compared each catchment to its starting soil fertility, and so should be considered the most robust. Globally, the conversion of forest to uncultivated grazing generally does not lead to a loss of TN; however, this does not hold for all specific sites (Murty et al. 2002). This is reflected in the contrasting conclusions of Australian studies. For example, a single paired-site study by Dalal et al. (2005) found a decrease in TN when mulga forest was developed for grazed pasture, with the majority of loss occurring from the surface 0.1 m of the soil profile. Removal of TN in beef accounted for less than half of this loss, with additional potential losses via deep drainage. In contrast, Harms et al. (2005) found no significant loss of TN across multiple paired-sites encompassing the same soil and vegetation. Similar to Dalal et al. (2005), Pringle et al. (2016) found a 19% decline in TN where fire had been used to clear native vegetation for grazing across 11 locations in the Brigalow Belt bioregion. The similarity of the 11 locations with the monitoring sites of the BCS is undisputable, extending to having been historically subjected to the same land use change and similar subsequent management regime (Allen et al. 2016). This clearly demonstrates that the decline in TN observed when brigalow scrub was developed for grazing in this study is representative of decline processes under grazing in the wider Brigalow Belt bioregion. It is also likely representative of fertility decline across most of the extensively grazed landscapes of northern Australia, which can halve the productive capacity of the pasture (Peck et al. 2011). The incorporation of legumes, particularly leucaena, into grazing systems within the Brigalow Belt bioregion has been shown to increase both soil fertility and enterprise profitability (Bowen and Chudleigh 2017). However, broad-scale adoption within the grazing industry is still evolving (Burgis 2016).
In this study there was no significant correlation between the decline in TN and the amount of nitrogen removed in beef. However, removal of nitrogen in beef accounted for 32% of the TN lost from the surface 0.1 m of the soil profile. This is comparable to the equivalent of 25% of soil TN decline lost in runoff (Elledge and Thornton 2017). Losses of nitrogen through volatilisation from urine and faeces was estimated to remove 71 kg/ha of nitrogen, equivalent to 49% of TN loss. Annual buffel grass yields have been shown to be in the order of 3000 kg/ha (Myers and Robbins 1991). Previous work at this site has shown the standing aboveground biomass of buffel grass was 4601 kg/ha and contained the equivalent of 27.6 kg/ha of nitrogen, equivalent to 19% of TN loss (Thornton and Elledge 2013). Annual root growth biomass estimations at this site are similar to aboveground biomass (Dalal et al. 2013) and are likely to have similar nitrogen contents (Robertson et al. 1993), potentially accounting for a similar proportion of TN loss. The work of Graham et al. (1985), on similar vegetation and soil associations elsewhere within the Fitzroy Basin, suggests that this is likely an underestimation having measured 207 kg/ha of nitrogen in buffel grass roots to 0.3 m. The combination of annual aboveground and belowground plant growth and litter deposition over 32 years likely accounts for the majority of TN decline and immobilisation in plant biomass under grazing although substantial losses occur via removal in beef, volatilisation and runoff.
The effect of land use change on soil mineral nitrogen
The immediate, short-term increase in NH4-N post-burning in C2 and C3, followed by a delayed and longer-lived increase in NO3-N, clearly demonstrates the generalised pattern of available nitrogen response to fire, as documented in the meta-analyses of Boerner et al. (2009) and Wan et al. (2001). The mechanism of increase is attributed to NH4-N liberation from organic matter followed by its nitrification to NO3-N. This is supported by previous work at this site attributing many of the changes in soil chemistry after burning to the effects of soil heating (Hunter and Cowie 1989). Subsequent declines over time were attributed to runoff losses, plant uptake and microbial immobilisation (Hunter and Cowie 1989).
The extended period of elevated NO3-N under cropping is likely to reflect the stimulating influence of fallow tillage on nitrogen mineralisation as described by Dalal and Mayer (1986b). This is supported by the observed decline in mineral nitrogen around 15 years post-burning that corresponds to a change in cropping management practices to minimum tillage and opportunity cropping. These practices reduce tillage and shorten fallows, leading to reduced mineralisation combined with increased nitrogen uptake due to increased cropping frequency. Declining TN is also likely to result in declining mineral nitrogen under continuous cropping. This is demonstrated elsewhere within the Dawson subcatchment of the Fitzroy Basin where mineral nitrogen levels of Vertosols after more than 30 years of cropping were 82% lower than adjacent Vertosols still supporting native brigalow scrub (Shrestha et al. 2015).
The rapid decline of NO3-N in C3 is likely due to uptake by the newly planted buffel grass pasture. Similar pastures in central Queensland have been shown to be highly productive in the first two years after planting due to high levels of available nitrogen, with productivity declining over time as available nitrogen declines and nitrogen immobilisation occurs (Myers and Robbins 1991). Decline and immobilisation in the grazed catchment at this site is demonstrated after the first two to three years in the ongoing low concentrations and minimal fluctuation of TN and mineral nitrogen compared with that under cropping and brigalow. It is further demonstrated by the decline in pasture productivity and cattle liveweight gain over time at this site as described by Radford et al. (2007).
The effect of land use change on soil TP
Although the enrichment of surface soil with phosphorus as a result of burning was clear, in the absence of fertilisation, phosphorus depletion commenced immediately. Within four years, TP was depleted to near or below pre-clearing concentrations. Removal of phosphorus in grain was equivalent to 95% of TP lost under cropping; however, removal of phosphorus in beef was only equivalent to 22% of the loss of TP under grazing. Removal of TP in runoff was equivalent to 12% of the total decline under cropping and 11% of the total decline under grazing (Elledge and Thornton 2017). Extraction of phosphorus from the soil profile below 0.1 m is clearly occurring under cropping given that TP removal in grain and runoff exceeded the measured TP decline in the top 0.1 m of the soil profile.
Other Queensland and international studies have also reported declines in TP under cropping (Bowman et al. 1990; Standley et al. 1990; Zhang et al. 2006; Song et al. 2011; Wang et al. 2012). Typically, the decline could be almost entirely accounted for in crop removal (Dalal 1997). However, changes in TP under grazing are typically less pronounced and the mechanism for change less obvious. Erosion and leaching losses are acknowledged to play some role in TP decline under grazing, but they are unlikely to be a key decline mechanism, particularly in flat landscapes with high clay content soils such as Vertosols (Townsend et al. 2002). Internationally, the removal of phosphorus in beef was poorly correlated with TP decline and hence was unlikely to be a key decline mechanism (McGrath et al. 2001; Townsend et al. 2002). These observations led Townsend et al. (2002) to conclude that the bulk of TP decline must be occurring by other mechanisms.
Previous work has shown the aboveground biomass of buffel grass in the grazed catchment contained the equivalent of 5.8 kg/ha of phosphorus (Thornton and Elledge 2013). Assuming the soil contribution to phosphorus in aboveground biomass is equal to one-third of the phosphorus content of the biomass grown each season, this transfer over 32 years is equivalent to the amount of TP removed from the soil. The cycling of phosphorus from soil to plant to animal waste is also likely to account for some of the phosphorus lost, given that phosphorus in dung can exceed that contained within both the aboveground plant and litter biomass (Dubeux et al. 2007), and its deposition on the soil surface increases its susceptibility to loss in runoff (McGrath et al. 2001). The key mechanisms of decline in TP under grazing in this study is likely to be redistribution into plant biomass and litter with additional smaller losses through runoff and removal in beef.
The effect of land use change on soil available phosphorus
Similar to TP, the enrichment of surface soil with available phosphorus as a result of burning was clear; and in the absence of fertilisation, depletion commenced immediately. Under cropping, P(B) was still above pre-clearing concentrations at 32 years post-burning while P(A) had declined below pre-clearing concentrations. Under grazing, both P(A) and P(B) declined below pre-clearing concentrations within 14 years post-burning.
Other long-term Queensland studies conducted at Chinchilla and Mt. Murchison on Vertosols that originally supported brigalow vegetation associations, also found declines in available phosphorus as a result of cropping (Thomas et al. 1990; Dalal 1997). The declines were attributed to removal of phosphorus in grain, transformation within soil, and runoff and erosion processes. However, at Mt. Murchison, it was noted that phosphorus removal by the crop and stubble could not be accounted for simply in terms of P(A) and P(B) (Thomas et al. 1990). Greater retention of P(B) in treatments with higher soil biomass and the replacement of depleted P(B) with phosphorus from other pools (Standley et al. 1990) further indicates that land use change alters the speciation and cycling of phosphorus in soil. Similar declines in available phosphorus are noted internationally (Nancy Mungai et al. 2011; Song et al. 2011). They are also attributed to cultivation and erosion-induced declines in soil structure leading to reductions in soil organic matter, promoting microbial cycling of available phosphorus (Zhang et al. 2006). Harvest losses were also noted as a decline mechanism. In this study, phosphorus removal in grain was better correlated with TP than with either measure of available phosphorus. Because TP accounts for losses from the organic pool, this suggests that both the inorganic and organic phosphorus pools are depleted by grain removal. The key mechanism of decline in available phosphorus under cropping in this study is likely to be removal in grain combined with cycling into other phosphorus pools.
The levels of phosphorus enrichment and decline following land use change for grazing in this study exceed that reported by Sangha et al. (2005) for grazing systems developed on similar vegetation and soil associations elsewhere within the Fitzroy Basin. Their study found no difference in P(B) under uncleared brigalow compared with sites cleared for grazing five, 12 and 33 years previously. This lack of difference in P(B) is likely due to the space-for-time paired site approach, which fails to guarantee the same starting condition for each pair; the impacts of grazing on the uncleared control plots; and the P(B) levels of their uncleared control being only 56% of the BCS brigalow scrub control in this study.
Internationally, changing land use from virgin forest to grazing has also resulted in an initial flush of available phosphorus followed by a decline (McGrath et al. 2001; Townsend et al. 2002). Pasture growth and aboveground biomass accounted for some of the decline; however, beef production was poorly correlated. While removal of phosphorus in beef showed no correlation with TP in this study, it explained 97% of the decline in P(A) and 75% of the decline in P(B). This suggests that any loss of phosphorus from the organic pool is likely being replaced from the inorganic pool (Garcia-Montiel et al. 2000; McGrath et al. 2001; Townsend et al. 2002; Fonte et al. 2014). The key mechanism of decline in available phosphorus under grazing in this study is likely to be removal in beef combined with cycling into other phosphorus pools. Additional losses are likely through the cycling of phosphorus from soil to plant to animal waste with smaller losses in runoff.
The effect of land use change on soil TS
As for phosphorus, surface soil was enriched with sulfur as a result of burning and, in the absence of fertilisation, depletion commenced immediately. Other studies, both in the Brigalow Belt bioregion and internationally, attribute sulfur decline under cropping to mineralisation associated with cultivation (Dalal and Mayer 1986b; Wang et al. 2006; Kopittke et al. 2016). Decline under grazing has also been attributed to accelerated mineralisation with additional declines as a result of reduced inputs of plant residues, particularly in arid, low-fertility landscapes, and losses in runoff and leaching (Steffens et al. 2008; Wiesmeier et al. 2009).
Sulfur is a constituent of organic matter and has similar responses under agriculture as nitrogen (Williams 1962; Kopittke et al. 2016). The rapid decline in sulfur within two years of burning mirrors that of total and mineral nitrogen, suggesting its removal from soil by actively growing crops and pasture in response to the ash bed effect. Leaching losses are also likely during this time given deep drainage through the soil profile increased from <1 mm/year pre-clearing to 59 mm/year under development for cropping and 32 mm/year under development for grazing (Silburn et al. 2009). Some ongoing loss of easily leached sulfur fractions may have occurred under cropping where deep drainage averaged 19.8 mm/year; however, leaching losses under grazing are unlikely with deep drainage returning to near pre-clearing rates of <1 mm/year.
Although some of the continued sulfur decline under cropping can certainly be attributed to mineralisation associated with tillage, estimates of grain sulfur content combined with measured yield data indicate that 63% of the lost sulfur can be accounted for in crop removal. In contrast, estimates of the sulfur content of beef combined with measured liveweight gain data indicate that only 5% of the lost sulfur can be accounted for in beef removal. This is supported by the observed sulfur data showing continued decline under cropping but little change under grazing after the initial decline in the ash bed effect. Thus, removal of sulfur in agricultural products is a major pathway under cropping but is negligible under grazing.
The effect of land use change on soil TK
As for phosphorus and sulfur, surface soil was enriched with potassium as a result of burning, and in the absence of fertilisation, depletion commenced immediately. Both cropping and grazing land uses lost similar amounts of potassium over the 32 years post-burning. Potassium decline has been noted in cropping systems worldwide, particularly where crop residue removal was practiced in addition to grain removal (Chen et al. 2006; Karlen et al. 2013; Rezapour et al. 2013). Decline has also been noted under grazing systems, typically with erosion as the primary loss mechanism, while reafforestation of grazing lands has been shown to increase surface soil potassium (Sangha et al. 2005; Liu et al. 2010; Huth et al. 2012; Cheng et al. 2016).
Although some potassium is removed in grain, potassium in crop residues greatly exceeds that removed in grain (Chen et al. 2006). This implies that removal of potassium in beef is greatly exceeded by the potassium retained in pasture and litter. Despite similar percentage declines in potassium under both cropping and grazing, potassium removal in grain accounted for 39% of the total decline under cropping while removal in beef accounted for only 1% of the decline under grazing. This suggests that removal of potassium in agricultural produce is not the primary loss mechanism.
Potassium is relatively immobile in soil and prone to surface stratification, but can be leached slowly and lost in runoff (Drew and Saker 1980; Bertol et al. 2007). The return of crop residues and buffel grass litter to the soil surface promotes stratification in both the cropping and grazing systems of this study, leaving nutrients vulnerable to loss in runoff. Given that changing land use from brigalow scrub to cropping or grazing doubled runoff (Thornton et al. 2007), and similar potassium losses were found under both cropping and grazing, it is likely that loss in runoff is the primary loss mechanism at this site. Loss in runoff as a primary loss mechanism is supported by earlier analyses of study data and has been noted as a loss mechanism internationally (Hunter and Cowie 1989; Kayser and Isselstein 2005). Drainage is unlikely to be a primary loss mechanism given drainage under the two systems is two orders of magnitude apart and does not reflect the similar potassium losses from the surface soil of each system.
Natural fluctuations in soil exchangeable potassium
According to the criteria of Bruce and Rayment (1982), average exchangeable potassium concentrations in the catchments pre-clearing were medium. Fluctuations in exchangeable potassium concentrations in C1 are likely due to feedback mechanisms between variable climate cycles and biological processes, including uptake, recycling, maintenance of soil potassium pool equilibrium and the respective lags of each process. Comparison of exchangeable potassium concentrations with a five-year moving average of annual rainfall (Thornton et al. 2007) shows a general trend of lower exchangeable potassium in above-average rainfall periods and higher exchangeable potassium in below-average rainfall periods. Increased plant growth during wet periods could result in greater exchangeable potassium uptake than in dry periods, resulting in lower measured soil exchangeable potassium. This process is responsible for the low-rainfall and drought-induced accumulation of NO3 (Liebig et al. 2014; Chen et al. 2015; Segoli et al. 2015) and is a likely driver of exchangeable potassium dynamics in this study. Increased return of potassium to the soil surface as a result of leaf drop (Tripler et al. 2006) in subsequent dry periods, combined with the requirement of the soil potassium pools to remain in equilibrium (Moody and Bell 2006), could then result in higher measured soil exchangeable potassium. Fluctuations in exchangeable potassium concentrations have been noted in other long-term studies of native forest, which concluded that the changes are real, informative of natural processes and should not be treated simply as statistical noise (Johnson et al. 2008).
The effect of land use change on soil exchangeable potassium
Post-burning, exchangeable potassium concentrations in C2 and C3 increased from medium to high. This increase may be attributed to soil biomass breakdown due to heating (Hunter and Cowie 1989), to exfoliation of mica from disturbed regolith (CSIRO 2006) or illite clay minerals in the soil profile exposing potassium in formerly contracted interlayers and to removal of organic coatings (Scott and Smith 1968; Smith and Scott 1974; Sharpley and Smith 1988). In the absence of fertilisation, depletion commenced immediately, similar to the behaviour of available phosphorus. After 32 years of cropping or grazing, the concentrations of exchangeable potassium that had increased from medium to high with burning, declined to low.
Declines in exchangeable potassium over time under cropping have been reported both elsewhere in Australia and internationally, and are typically attributed to plant uptake followed by removal in harvested grain and stubble (Cope 1981; Sharpley and Smith 1988; Bell et al. 1995; Litvinovich et al. 2006; Curtin et al. 2015). Declines in exchangeable potassium over time under grazing have also been reported both elsewhere in Australia and internationally, with the primary loss occurring during potassium cycling, particularly from urine patches, which account for ~80% of the potassium cycled through the animal (Cox 1973; Williams and Haynes 1990; Haynes and Williams 1992; Prober et al. 2002; Kayser and Isselstein 2005; Sangha et al. 2005). Preferential flow of water-soluble urine potassium, which is deposited in concentrated patches, to beneath 0.1 m of the soil profile may also account for some of the measured decline in exchangeable potassium (Kayser and Isselstein 2005). Leaching of exchangeable potassium, particularly urine potassium, is often cited as a loss mechanism (Kayser and Isselstein 2005). However, as for TK, the similar decline in exchangeable potassium under both cropping and grazing at this site, despite the drainage under the two systems being two orders of magnitude apart, indicate that drainage is unlikely to be a primary loss mechanism. In addition, the feedback mechanisms between variable climate cycles and biological processes that drive exchangeable potassium fluctuations in native forests will also influence dynamics in agricultural systems. This will occur in parallel to loss via removal in agricultural products and loss from cycling pathways specific to either cropping or grazing.
Conclusion
Development of brigalow scrub for cropping or grazing significantly altered soil nutrient balances. Initial clearing and burning resulted in a temporary increase, or flush, of mineral nitrogen, total and available phosphorus, total potassium and total sulfur in the surface soil (0–0.1 m) as a result of soil heating and the ash bed effect. Bulk density was consistently higher post-clearing and burning than it was pre-clearing. Soil pH also increased, but did not peak immediately after burning. Increases in soil pH were unlikely to limit nutrient availability and plant growth.
Over the 32 years since changing land use from brigalow scrub to cropping, surface soil fertility has declined significantly. Specifically, organic carbon has declined by 46%, total nitrogen by 55%, total phosphorus by 29%, bicarbonate extractable phosphorus by 54%, acid extractable phosphorus by 59%, total sulfur by 49%, total potassium by 9% and exchangeable potassium by 63% from post-burn, pre-cropping concentrations. This decline in fertility has limited crop yields and would have had an economic impact on a commercial cropping enterprise. However, the planting and maintenance of a butterfly pea legume ley pasture increased total nitrogen by 15% within five years, consistent with other studies in the region. Nutrient removal from the catchment as beef following 173 days of grazing the ley pasture was substantially less than that removed in an average crop. Beef production would have provided some economic benefit to offset the foregone cropping opportunities.
Surface soil fertility has also declined under grazing over the same period but in a different pattern to that observed under cropping. Organic carbon showed clear fluctuation but it was not until the natural variation in soil fertility over time was separated from the anthropogenic effects of land use change that a significant decline was observed. Total nitrogen declined by 22% and in the absence of a legume in the pasture, no fertility restoration occurred. Total phosphorus declined by 14%, equating to only half of the decline under cropping. Bicarbonate extractable phosphorus declined by 64% and acid extractable phosphorus declined by 66%; both greater than the decline observed under cropping, possibly due to immobilisation as organic phosphorus. Total sulfur declined by 23%; less than half of the decline under cropping. A similar decline in total potassium was observed under both land uses, with a 10% decline under grazing. Exchangeable potassium declined by 59%. As for cropping, this fertility decline has limited pasture production and hence beef production. Despite these production limitations, the grazing system is representative of much of the extensive grazing undertaken in northern Australia. The incorporation of legumes into grazing systems within the Brigalow Belt bioregion has been shown to increase both soil fertility and enterprise profitability; however, broad-scale adoption within the grazing industry is still evolving.
The primary mechanism of nutrient loss depended on the land use and nutrient in question but included removal in grain and beef, mineralisation and oxidation, redistribution and stratification within the soil profile and nutrient pools due to plant growth and litter recycling, uptake and storage in above ground biomass, and loss in runoff and leaching. The addition of legumes into both the cropping and grazing systems would assist in fertility restoration; however, particularly in the case of cropping, may not enable continued production without fertility decline. In contrast to the fertility decline of the agricultural land uses, surface soil fertility of the brigalow scrub remained in relative equilibrium.
Conflicts of interest
The authors declare no conflicts of interest.
Acknowledgements
Many staff have contributed to the design and execution of the Brigalow Catchment Study. We thank H Pauli, J Rosser, A Webb, P Lawrence, R Bryant, A Dowling, H Hunter, N Cocaris, J Kalnins, R Scarborough, R Pushmann, R Gillespie, D Sinclair, B Kitchen, A Key, P Hansen, G Thomas, E Anderson, P Back, D Miles, W Burrows, M Nasser, A Lloyd, A Barnes, M Jeffery, T James, N Purvis-Smith, B Radford, B Cowie, D Reid and A Elledge, staff of the Department of Environment and Science Chemistry Centre and staff of the former Department of Primary Industries Brigalow Research Station. Thank you to D Allen, R Dalal, P Moody and B Yu for reviewing the draft manuscript. The study was funded by the Queensland Department of Natural Resources, Mines and Energy.
References
Ahern CR, Weinand MMG, Isbell RF (1994) Surface soil-pH map of Queensland. Australian Journal of Soil Research 32, 212–228.| Surface soil-pH map of Queensland.Crossref | GoogleScholarGoogle Scholar |
Al-Shammary AAG, Kouzani AZ, Kaynak A, Khoo SY, Norton M, Gates W (2018) Soil bulk density estimation methods: a review. Pedosphere 28, 581–596.
| Soil bulk density estimation methods: a review.Crossref | GoogleScholarGoogle Scholar |
Allen DE, Pringle MJ, Butler DW, Henry BK, Bishop TFA, Bray SG, Orton TG, Dalal RC (2016) Effects of land-use change and management on soil carbon and nitrogen in the Brigalow Belt, Australia: I. Overview and inventory. The Rangeland Journal 38, 443–452.
| Effects of land-use change and management on soil carbon and nitrogen in the Brigalow Belt, Australia: I. Overview and inventory.Crossref | GoogleScholarGoogle Scholar |
Anaya CA, Huber-Sannwald E (2015) Long-term soil organic carbon and nitrogen dynamics after conversion of tropical forest to traditional sugarcane agriculture in East Mexico. Soil & Tillage Research 147, 20–29.
| Long-term soil organic carbon and nitrogen dynamics after conversion of tropical forest to traditional sugarcane agriculture in East Mexico.Crossref | GoogleScholarGoogle Scholar |
Barré P, Eglin T, Christensen BT, Ciais P, Houot S, Kätterer T, van Oort F, Peylin P, Poulton PR, Romanenkov V, Chenu C (2010) Quantifying and isolating stable soil organic carbon using long-term bare fallow experiments. Biogeosciences 7, 3839–3850.
| Quantifying and isolating stable soil organic carbon using long-term bare fallow experiments.Crossref | GoogleScholarGoogle Scholar |
Bell MJ, Harch GR, Bridge BJ (1995) Effects of continuous cultivation on Ferrosols in subtropical southeast Queensland. I. Site characterization, crop yields and soil chemical status. Australian Journal of Agricultural Research 46, 237–253.
| Effects of continuous cultivation on Ferrosols in subtropical southeast Queensland. I. Site characterization, crop yields and soil chemical status.Crossref | GoogleScholarGoogle Scholar |
Berndt RD, Coughlan KJ (1977) The nature of changes in bulk density with water content in a cracking clay. Australian Journal of Soil Research 15, 27–37.
| The nature of changes in bulk density with water content in a cracking clay.Crossref | GoogleScholarGoogle Scholar |
Bertol I, Engel FL, Mafra AL, Bertol OJ, Ritter SR (2007) Phosphorus, potassium and organic carbon concentrations in runoff water and sediments under different soil tillage systems during soybean growth. Soil & Tillage Research 94, 142–150.
| Phosphorus, potassium and organic carbon concentrations in runoff water and sediments under different soil tillage systems during soybean growth.Crossref | GoogleScholarGoogle Scholar |
Boerner REJ, Huang J, Hart SC (2009) Impacts of fire and fire surrogate treatments on forest soil properties: a meta-analytical approach. Ecological Applications 19, 338–358.
| Impacts of fire and fire surrogate treatments on forest soil properties: a meta-analytical approach.Crossref | GoogleScholarGoogle Scholar |
Bouyoucos GJ (1951) A recalibration of the hydrometer method for making mechanical analysis of soils. Agronomy Journal 43, 434–438.
| A recalibration of the hydrometer method for making mechanical analysis of soils.Crossref | GoogleScholarGoogle Scholar |
Bowen MK, Chudleigh F (2017) ‘Productivity and profitability of a range of alternative steer growth paths resulting from manipulating the pasture feed base in central Queensland – a modelling approach.’ (Department of Agriculture and Fisheries, Brisbane)
Bowman RA, Reeder JD, Lober RW (1990) Changes in soil properties in a central plains rangeland soil after 3, 20, and 60 years of cultivation. Soil Science 150, 851–857.
| Changes in soil properties in a central plains rangeland soil after 3, 20, and 60 years of cultivation.Crossref | GoogleScholarGoogle Scholar |
Bremner JM (1965) Total nitrogen. In ‘Methods of soil analysis. Part 2. Chemical and microbiological properties.’ (Ed. AG Norman) pp. 1149–1178. (American Society of Agronomy, Soil Science Society of America: Madison, WI)
Brennan RF, Bolland MDA, Bowden JW (2004) Potassium deficiency, and molybdenum deficiency and aluminium toxicity due to soil acidification, have become problems for cropping sandy soils in south-western Australia. Australian Journal of Experimental Agriculture 44, 1031–1039.
| Potassium deficiency, and molybdenum deficiency and aluminium toxicity due to soil acidification, have become problems for cropping sandy soils in south-western Australia.Crossref | GoogleScholarGoogle Scholar |
Bruce RC, Rayment GE (1982) ‘Analytical methods and interpretations used by the agricultural chemistry branch for soil and land use surveys’. (Queensland Department of Primary Industries, Brisbane)
Burgis MT (2016) ‘Accelerating uptake of leucaena-based pastures’. (Meat and Livestock Australia Limited)
Butler BDW, Fairfax RJ (2003) Buffel grass and fire in a gidgee and brigalow woodland: a case study from central Queensland. Ecological Management & Restoration 4, 120–125.
| Buffel grass and fire in a gidgee and brigalow woodland: a case study from central Queensland.Crossref | GoogleScholarGoogle Scholar |
Butler OM, Lewis T, Chen C (2017) Prescribed fire alters foliar stoichiometry and nutrient resorption in the understorey of a subtropical eucalypt forest. Plant and Soil 410, 181–191.
| Prescribed fire alters foliar stoichiometry and nutrient resorption in the understorey of a subtropical eucalypt forest.Crossref | GoogleScholarGoogle Scholar |
Byers M, McGrath SP, Webster R (1987) A survey of the sulphur content of wheat grown in Britain. Journal of the Science of Food and Agriculture 38, 151–166.
| A survey of the sulphur content of wheat grown in Britain.Crossref | GoogleScholarGoogle Scholar |
Carreira JA, Niell FX (1995) Mobilization of nutrients by fire in a semiarid gorse‐scrubland ecosystem of Southern Spain. Arid Soil Research and Rehabilitation 9, 73–89.
| Mobilization of nutrients by fire in a semiarid gorse‐scrubland ecosystem of Southern Spain.Crossref | GoogleScholarGoogle Scholar |
Carroll C, Waters D, Vardy S, Silburn DM, Attard S, Thorburn PJ, Davis AM, Halpin N, Schmidt M, Wilson B, Clark A (2012) A paddock to reef monitoring and modelling framework for the Great Barrier Reef: paddock and catchment component. Marine Pollution Bulletin 65, 136–149.
| A paddock to reef monitoring and modelling framework for the Great Barrier Reef: paddock and catchment component.Crossref | GoogleScholarGoogle Scholar | 22277580PubMed |
Castelli LM, Lazzari MA (2002) Impact of fire on soil nutrients in central semiarid Argentina. Arid Land Research and Management 16, 349–364.
| Impact of fire on soil nutrients in central semiarid Argentina.Crossref | GoogleScholarGoogle Scholar |
Chen J, Yu Z, Ouyang J, van Mensvoort MEF (2006) Factors affecting soil quality changes in the North China Plain: A case study of Quzhou County. Agricultural Systems 91, 171–188.
| Factors affecting soil quality changes in the North China Plain: A case study of Quzhou County.Crossref | GoogleScholarGoogle Scholar |
Chen D, Wang S, Xiong B, Cao B, Deng X (2015) Carbon/nitrogen imbalance associated with drought-induced leaf senescence in Sorghum bicolor. PLoS One 10, e0137026
| Carbon/nitrogen imbalance associated with drought-induced leaf senescence in Sorghum bicolor.Crossref | GoogleScholarGoogle Scholar | 26720722PubMed |
Cheng J, Jing G, Wei L, Jing Z (2016) Long-term grazing exclusion effects on vegetation characteristics, soil properties and bacterial communities in the semi-arid grasslands of China. Ecological Engineering 97, 170–178.
| Long-term grazing exclusion effects on vegetation characteristics, soil properties and bacterial communities in the semi-arid grasslands of China.Crossref | GoogleScholarGoogle Scholar |
Cogger H, Ford H, Johnson C, Holman J, Butler D (2003) ‘Impacts of land clearing on Australian wildlife in Queensland’. (World Wide Fund for Nature Australia: Sydney)
Collard SJ, Zammit C (2006) Effects of land-use intensification on soil carbon and ecosystem services in Brigalow (Acacia harpophylla) landscapes of southeast Queensland, Australia. Agriculture, Ecosystems & Environment 117, 185–194.
| Effects of land-use intensification on soil carbon and ecosystem services in Brigalow (Acacia harpophylla) landscapes of southeast Queensland, Australia.Crossref | GoogleScholarGoogle Scholar |
Collins R, Grundy T (2005) ‘The butterfly pea book: a guide to establishing and managing butterfly pea pastures in central Queensland’. (Department of Primary Industries and Fisheries: Brisbane)
Colwell JD (1963) The estimation of the phosphorus fertilizer requirements of wheat in southern New South Wales by soil analysis. Australian Journal of Experimental Agriculture 3, 190–197.
Conant RT, Paustian K (2002) Potential soil carbon sequestration in overgrazed grassland ecosystems. Global Biogeochemical Cycles 16, 90–1–90–9.
Cope JT (1981) Effects of 50 Years of Fertilization with Phosphorus and Potassium on Soil Test Levels and Yields at Six Locations. Soil Science Society of America Journal 45, 342–347.
| Effects of 50 Years of Fertilization with Phosphorus and Potassium on Soil Test Levels and Yields at Six Locations.Crossref | GoogleScholarGoogle Scholar |
Coughlan KJ, McGarry D, Smith GD (1987) The physical and mechanical characterisation of Vertisols. In ‘Management of Vertisols under semi-arid conditions, Proceedings of the First Regional Seminar on the Management of Vertisols under Semi-arid Conditions’, 1–6 December 1986, Nairobi, Kenya. (Eds M Lathan, P Ahn) pp. 89–106. (International Board for Soil Research and Management Inc.)
Cowie BA, Radford BJ, Thornton CM (2002) The Brigalow Catchment Study. In ‘Brigalow Research Station: Technical Report 2000–2001.’ (Ed. I Loxton) pp. 37–44. (Department of Primary Industries: Brisbane)
Cowie BA, Thornton CM, Radford BJ (2007) The Brigalow Catchment Study: I. Overview of a 40-year study of the effects of land clearing in the brigalow bioregion of Australia. Australian Journal of Soil Research 45, 479–495.
| The Brigalow Catchment Study: I. Overview of a 40-year study of the effects of land clearing in the brigalow bioregion of Australia.Crossref | GoogleScholarGoogle Scholar |
Cox WJ (1973) Potassium for pastures. Journal of the Department of Agriculture, Western Australia, Series 4 14, 215–219.
Crowther TW, Todd-Brown KEO, Rowe CW, Wieder WR, Carey JC, Machmuller MB, Snoek BL, Fang S, Zhou G, Allison SD, Blair JM, Bridgham SD, Burton AJ, Carrillo Y, Reich PB, Clark JS, Classen AT, Dijkstra FA, Elberling B, Emmett BA, Estiarte M, Frey SD, Guo J, Harte J, Jiang L, Johnson BR, Kröel-Dulay G, Larsen KS, Laudon H, Lavallee JM, Luo Y, Lupascu M, Ma LN, Marhan S, Michelsen A, Mohan J, Niu S, Pendall E, Peñuelas J, Pfeifer-Meister L, Poll C, Reinsch S, Reynolds LL, Schmidt IK, Sistla S, Sokol NW, Templer PH, Treseder KK, Welker JM, Bradford MA (2016) Quantifying global soil carbon losses in response to warming. Nature 540, 104–108.
| Quantifying global soil carbon losses in response to warming.Crossref | GoogleScholarGoogle Scholar | 27905442PubMed |
CSIRO (2006) ASRIS Queensland Key Reference Sites. Key Reference Site 2: Brigalow Catchment Study- cropping site. Available at http://www.asris.csiro.au/mapping/hyperdocs/QLD/QKRS_2.pdf [verified 13 September 2019].
Curtin D, Fraser PM, Beare MH (2015) Loss of soil organic matter following cultivation of long-term pasture: effects on major exchangeable cations and cation exchange capacity. Soil Research 53, 377–385.
| Loss of soil organic matter following cultivation of long-term pasture: effects on major exchangeable cations and cation exchange capacity.Crossref | GoogleScholarGoogle Scholar |
Dalal RC (1997) Long-term phosphorus trends in Vertisols under continuous cereal cropping. Australian Journal of Soil Research 35, 327–339.
| Long-term phosphorus trends in Vertisols under continuous cereal cropping.Crossref | GoogleScholarGoogle Scholar |
Dalal RC, Mayer RJ (1986a) Long term trends in fertility of soils under continuous cultivation and cereal cropping in southern Queensland. V. Rate of loss of total nitrogen from the soil profile and changes in carbon: nitrogen ratios. Soil Research 24, 493–504.
| Long term trends in fertility of soils under continuous cultivation and cereal cropping in southern Queensland. V. Rate of loss of total nitrogen from the soil profile and changes in carbon: nitrogen ratios.Crossref | GoogleScholarGoogle Scholar |
Dalal RC, Mayer RJ (1986b) Long term trends in fertility of soils under continuous cultivation and cereal cropping in southern Queensland. I. Overall changes in soil properties and trends in winter cereal yields. Soil Research 24, 265–279.
| Long term trends in fertility of soils under continuous cultivation and cereal cropping in southern Queensland. I. Overall changes in soil properties and trends in winter cereal yields.Crossref | GoogleScholarGoogle Scholar |
Dalal RC, Harms BP, Krull E, Wang WJ (2005) Total soil organic matter and its labile pools following mulga (Acacia aneura) clearing for pasture development and cropping 1. Total and labile carbon. Australian Journal of Soil Research 43, 13–20.
| Total soil organic matter and its labile pools following mulga (Acacia aneura) clearing for pasture development and cropping 1. Total and labile carbon.Crossref | GoogleScholarGoogle Scholar |
Dalal RC, Cowie BA, Allen DE, Yo SA (2011) Assessing carbon lability of particulate organic matter from δ13C changes following land-use change from C3 native vegetation to C4 pasture. Soil Research 49, 98–103.
| Assessing carbon lability of particulate organic matter from δ13C changes following land-use change from C3 native vegetation to C4 pasture.Crossref | GoogleScholarGoogle Scholar |
Dalal RC, Thornton CM, Cowie BA (2013) Turnover of organic carbon and nitrogen in soil assessed from δ13C and δ15N changes under pasture and cropping practices and estimates of greenhouse gas emissions. The Science of the Total Environment 465, 26–35.
| Turnover of organic carbon and nitrogen in soil assessed from δ13C and δ15N changes under pasture and cropping practices and estimates of greenhouse gas emissions.Crossref | GoogleScholarGoogle Scholar | 23721610PubMed |
Dang YP, Dalal RC, Routley R, Schwenke GD, Daniells I (2006a) Subsoil constraints to grain production in the cropping soils of the north-eastern region of Australia: An overview. Australian Journal of Experimental Agriculture 46, 19–35.
| Subsoil constraints to grain production in the cropping soils of the north-eastern region of Australia: An overview.Crossref | GoogleScholarGoogle Scholar |
Dang YP, Routley R, McDonald M, Dalal RC, Singh DK, Orange D, Mann M (2006b) Subsoil constraints in Vertosols: Crop water use, nutrient concentration, and grain yields of bread wheat, durum wheat, barley, chickpea, and canola. Australian Journal of Agricultural Research 57, 983–998.
| Subsoil constraints in Vertosols: Crop water use, nutrient concentration, and grain yields of bread wheat, durum wheat, barley, chickpea, and canola.Crossref | GoogleScholarGoogle Scholar |
Dang YP, Dalal RC, Mayer DG, McDonald M, Routley R, Schwenke GD, Buck SR, Daniells IG, Singh DK, Manning W, Ferguson N (2008) High subsoil chloride concentrations reduce soil water extraction and crop yield on Vertosols in north-eastern Australia. Australian Journal of Agricultural Research 59, 321–330.
| High subsoil chloride concentrations reduce soil water extraction and crop yield on Vertosols in north-eastern Australia.Crossref | GoogleScholarGoogle Scholar |
Dixon RM, Coates DB (2010) Diet quality estimated with faecal near infrared reflectance spectroscopy and responses to N supplementation by cattle grazing buffel grass pastures. Animal Feed Science and Technology 158, 115–125.
| Diet quality estimated with faecal near infrared reflectance spectroscopy and responses to N supplementation by cattle grazing buffel grass pastures.Crossref | GoogleScholarGoogle Scholar |
Dowling AJ, Webb AA, Scanlan JC (1986) Surface soil chemical and physical patterns in a brigalow- Dawson gum forest, central Queensland. Australian Journal of Ecology 11, 155–162.
| Surface soil chemical and physical patterns in a brigalow- Dawson gum forest, central Queensland.Crossref | GoogleScholarGoogle Scholar |
Drew MC, Saker LR (1980) Direct drilling and ploughing: their effects on the distribution of extractable phosphorus and potassium, and of roots, in the upper horizons of two clay soils under winter wheat and spring barley. The Journal of Agricultural Science 94, 411–423.
| Direct drilling and ploughing: their effects on the distribution of extractable phosphorus and potassium, and of roots, in the upper horizons of two clay soils under winter wheat and spring barley.Crossref | GoogleScholarGoogle Scholar |
Dubeux JCB, Sollenberger LE, Mathews BW, Scholberg JM, Santos HQ (2007) Nutrient cycling in warm-climate grasslands. Crop Science 47, 915–928.
| Nutrient cycling in warm-climate grasslands.Crossref | GoogleScholarGoogle Scholar |
Elledge A, Thornton C (2017) Effect of changing land use from virgin brigalow (Acacia harpophylla) woodland to a crop or pasture system on sediment, nitrogen and phosphorus in runoff over 25 years in subtropical Australia. Agriculture, Ecosystems & Environment 239, 119–131.
| Effect of changing land use from virgin brigalow (Acacia harpophylla) woodland to a crop or pasture system on sediment, nitrogen and phosphorus in runoff over 25 years in subtropical Australia.Crossref | GoogleScholarGoogle Scholar |
Ellis RC, Graley AM (1983) Gains and losses in soil nutrients associated with harvesting and burning eucalypt rainforest. Plant and Soil 74, 437–450.
| Gains and losses in soil nutrients associated with harvesting and burning eucalypt rainforest.Crossref | GoogleScholarGoogle Scholar |
Fonte SJ, Nesper M, Hegglin D, Velásquez JE, Ramirez B, Rao IM, Bernasconi SM, Bünemann EK, Frossard E, Oberson A (2014) Pasture degradation impacts soil phosphorus storage via changes to aggregate-associated soil organic matter in highly weathered tropical soils. Soil Biology & Biochemistry 68, 150–157.
| Pasture degradation impacts soil phosphorus storage via changes to aggregate-associated soil organic matter in highly weathered tropical soils.Crossref | GoogleScholarGoogle Scholar |
Fraser MA, Scott BJ (2011) Variability of acidity in agricultural soils—the impact of timber burning at land clearing. Soil Research 49, 223–230.
| Variability of acidity in agricultural soils—the impact of timber burning at land clearing.Crossref | GoogleScholarGoogle Scholar |
Garcia-Montiel DC, Neill C, Melillo J, Thomas S, Steudler PA, Cerri CC (2000) Soil phosphorus transformations following forest clearing for pasture in the Brazilian Amazon. Soil Science Society of America Journal 64, 1792–1804.
| Soil phosphorus transformations following forest clearing for pasture in the Brazilian Amazon.Crossref | GoogleScholarGoogle Scholar |
Gibson CP, Horn GW, Krehbiel CR (2002) Soil phosphorus removal by stocker cattle grazing winter wheat. Oklahoma Agricultural Experiment Station 2002 Research Reports. Oklahoma State University, Oklahoma.
Graham TWG, Myers RJK, Doran JW, Catchpoole VR, Robbins GB (1985) Pasture renovation: the effect of cultivation on the productivity and nitrogen cycling of a buffel grass (Cenchrus ciliaris) pasture. In ‘Proceedings of the XV International Grassland Congress’, August 24–31 1985, Kyoto. pp. 640–642.
Guinto DF, Xu ZH, House APN, Saffigna PG (2001) Soil chemical properties and forest floor nutrients under repeated prescribed burning in eucalypt forests of south-east Queensland, Australia. New Zealand Journal of Forestry Science 31, 170–187.
Győri Z (2005) Sulphur content of winter wheat grain in long term field experiments. Communications in Soil Science and Plant Analysis 36, 373–382.
| Sulphur content of winter wheat grain in long term field experiments.Crossref | GoogleScholarGoogle Scholar |
Harms BP, Dalal RC, Cramp AP (2005) Changes in soil carbon and soil nitrogen after tree clearing in the semi-arid rangelands of Queensland. Australian Journal of Botany 53, 639–650.
| Changes in soil carbon and soil nitrogen after tree clearing in the semi-arid rangelands of Queensland.Crossref | GoogleScholarGoogle Scholar |
Haynes RJ, Williams PH (1992) Long-term effect of superphosphate on accumulation of soil phosphorus and exchangeable cations on a grazed, irrigated pasture site. Plant and Soil 142, 123–133.
| Long-term effect of superphosphate on accumulation of soil phosphorus and exchangeable cations on a grazed, irrigated pasture site.Crossref | GoogleScholarGoogle Scholar |
Herpin U, Cerri CC, Conceição Santana Carvalho M, Markert B, Enzweiler J, Friese K, Breulmann G (2002) Biogeochemical dynamics following land use change from forest to pasture in a humid tropical area (Rondônia, Brazil): a multi-element approach by means of XRF-spectroscopy. The Science of the Total Environment 286, 97–109.
| Biogeochemical dynamics following land use change from forest to pasture in a humid tropical area (Rondônia, Brazil): a multi-element approach by means of XRF-spectroscopy.Crossref | GoogleScholarGoogle Scholar | 11886102PubMed |
Hulugalle NR, McCorkell BE, Weaver TB, Finlay LA (2010) Managing sodicity and exchangeable K in a dryland Vertisol in Australia with deep tillage, cattle manure, and gypsum. Arid Land Research and Management 24, 181–195.
| Managing sodicity and exchangeable K in a dryland Vertisol in Australia with deep tillage, cattle manure, and gypsum.Crossref | GoogleScholarGoogle Scholar |
Hunter HM, Cowie BA (1989) Soil fertility and salinity. In ‘Hydrology, soil fertility and productivity of brigalow catchments following clearing.’ (Eds PA Lawrence, PJ Thorburn) pp. 3.1–3.52. (Department of Primary Industries: Queensland)
Huth NI, Thorburn PJ, Radford BJ, Thornton CM (2010) Impacts of fertilisers and legumes on N2O and CO2 emissions from soils in subtropical agricultural systems: a simulation study. Agriculture, Ecosystems & Environment 136, 351–357.
| Impacts of fertilisers and legumes on N2O and CO2 emissions from soils in subtropical agricultural systems: a simulation study.Crossref | GoogleScholarGoogle Scholar |
Huth T, Porder S, Chaves J, Whiteside JH (2012) Soil carbon and nutrient changes associated with deforestation for pasture in southern Costa Rica. Biotropica 44, 661–667.
| Soil carbon and nutrient changes associated with deforestation for pasture in southern Costa Rica.Crossref | GoogleScholarGoogle Scholar |
Isbell RF (1996) ‘The Australian soil classification.’ (CSIRO Publishing: Collingwood, Victoria)
Johnson RW (1964) ‘Ecology and control of brigalow in Queensland.’ (Queensland Department of Primary Industries)
Johnson DW, Todd DE, Trettin CC, Mulholland PJ (2008) Decadal changes in potassium, calcium, and magnesium in a deciduous forest soil. Soil Science Society of America Journal 72, 1795–1805.
| Decadal changes in potassium, calcium, and magnesium in a deciduous forest soil.Crossref | GoogleScholarGoogle Scholar |
Karlen DL, Kovar JL, Cambardella CA, Colvin TS (2013) Thirty-year tillage effects on crop yield and soil fertility indicators. Soil & Tillage Research 130, 24–41.
| Thirty-year tillage effects on crop yield and soil fertility indicators.Crossref | GoogleScholarGoogle Scholar |
Kayser M, Isselstein J (2005) Potassium cycling and losses in grassland systems: a review. Grass and Forage Science 60, 213–224.
| Potassium cycling and losses in grassland systems: a review.Crossref | GoogleScholarGoogle Scholar |
Kerr HW, von Stieglitz CR (1938) The laboratory determination of soil fertility. Technical Communication No. 9. Bureau of Sugar Experimental Stations, Queensland.
Kopittke PM, Dalal RC, Menzies NW (2016) Sulfur dynamics in sub-tropical soils of Australia as influenced by long-term cultivation. Plant and Soil 402, 211–219.
| Sulfur dynamics in sub-tropical soils of Australia as influenced by long-term cultivation.Crossref | GoogleScholarGoogle Scholar |
Kyuma K, Tulaphitak T, Pairintra C (1985) Changes in soil fertility and tilth under shifting cultivation. Soil Science and Plant Nutrition 31, 227–238.
| Changes in soil fertility and tilth under shifting cultivation.Crossref | GoogleScholarGoogle Scholar |
Laubach J, Taghizadeh-Toosi A, Gibbs SJ, Sherlock RR, Kelliher FM, Grover SPP (2013) Ammonia emissions from cattle urine and dung excreted on pasture. Biogeosciences 10, 327–338.
| Ammonia emissions from cattle urine and dung excreted on pasture.Crossref | GoogleScholarGoogle Scholar |
Li G, Zhang Z, Shi L, Zhou Y, Yang M, Cao J, Wu S, Lei G (2018) Effects of different grazing intensities on soil C, N, and P in an alpine meadow on the Qinghai-Tibetan Plateau, China. International Journal of Environmental Research and Public Health 15, 2584
| Effects of different grazing intensities on soil C, N, and P in an alpine meadow on the Qinghai-Tibetan Plateau, China.Crossref | GoogleScholarGoogle Scholar |
Liebig MA, Kronberg SL, Hendrickson JR, Gross JR (2014) Grazing management, season, and drought contributions to near-surface soil property dynamics in semiarid rangeland. Rangeland Ecology and Management 67, 266–274.
| Grazing management, season, and drought contributions to near-surface soil property dynamics in semiarid rangeland.Crossref | GoogleScholarGoogle Scholar |
Lindenmayer D, Burgman MA (2005) ‘Practical conservation biology.’ (CSIRO Publishing: Victoria, Australia)
Litvinovich AV, Pavolva OY, Maslova AI, Chernov DV (2006) The potassium status of sandy gleyic soddy-podzolic soils under forest, cropland, and fallow. Eurasian Soil Science 39, 785–791.
| The potassium status of sandy gleyic soddy-podzolic soils under forest, cropland, and fallow.Crossref | GoogleScholarGoogle Scholar |
Liu X, Zhang W, Liu Z, Qu F, Song W (2010) Impacts of land cover changes on soil chemical properties in Taihang Mountain, China. Journal of Food Agriculture and Environment 8, 985–990.
MacDermott HJ, Fensham RJ, Hua Q, Bowman DMJS (2017) Vegetation, fire and soil feedbacks of dynamic boundaries between rainforest, savanna and grassland. Austral Ecology 42, 154–164.
| Vegetation, fire and soil feedbacks of dynamic boundaries between rainforest, savanna and grassland.Crossref | GoogleScholarGoogle Scholar |
Macdonald LM, Farrell M, Zwieten LV, Krull ES (2014) Plant growth responses to biochar addition: an Australian soils perspective. Biology and Fertility of Soils 50, 1035–1045.
| Plant growth responses to biochar addition: an Australian soils perspective.Crossref | GoogleScholarGoogle Scholar |
May BM, Attiwill PM (2003) Nitrogen-fixation by Acacia dealbata and changes in soil properties 5 years after mechanical disturbance or slash-burning following timber harvest. Forest Ecology and Management 181, 339–355.
| Nitrogen-fixation by Acacia dealbata and changes in soil properties 5 years after mechanical disturbance or slash-burning following timber harvest.Crossref | GoogleScholarGoogle Scholar |
McGrath C (2007) End of broadscale clearing in Queensland. Environmental and Planning Law Journal 24, 5–13.
McGrath DA, Smith CK, Gholz HL, Oliveira FDA (2001) Effects of land-use change on soil nutrient dynamics in Amazônia. Ecosystems 4, 625–645.
| Effects of land-use change on soil nutrient dynamics in Amazônia.Crossref | GoogleScholarGoogle Scholar |
McSherry ME, Ritchie ME (2013) Effects of grazing on grassland soil carbon: A global review. Global Change Biology 19, 1347–1357.
| Effects of grazing on grassland soil carbon: A global review.Crossref | GoogleScholarGoogle Scholar |
Mengel K, Kirby EA (1982) ‘Principles of plant nutrition.’(International Potash Institute: Bern, Switzerland)
Minson DJ, McDonald CK (1987) Estimating forage intake from the growth of beef cattle. Tropical Grasslands 21, 116–122.
Moody PW (1998) Soil fertility change. In ‘Determining sustainable soil management for the 21st century. Final report.’ (Eds P Truong, N Diatloff) pp. 118. (Queensland Department of Natural Resources, Resource Sciences Centre: Brisbane)
Moody PW, Bell MJ (2006) Availability of soil potassium and diagnostic soil tests. Soil Research 44, 265–275.
| Availability of soil potassium and diagnostic soil tests.Crossref | GoogleScholarGoogle Scholar |
Murty D, Kirschbaum MUF, McMurtrie RE, McGilvray H (2002) Does conversion of forest to agricultural land change soil carbon and nitrogen? a review of the literature. Global Change Biology 8, 105–123.
| Does conversion of forest to agricultural land change soil carbon and nitrogen? a review of the literature.Crossref | GoogleScholarGoogle Scholar |
Myers RJK, Robbins GB (1991) Sustaining productive pastures in the tropics 5. Maintaining productive sown grass pastures. Tropical Grasslands 25, 104–110.
Nancy Mungai W, Njue AM, Abaya SG, Said AHV, Ibembe JD (2011) Periodic flooding and land use effects on soil properties in Lake Victoria basin. African Journal of Agricultural Research 6, 4613–4623.
National Research Council (2003) ‘Air emissions from animal feeding operations: current knowledge, future needs’. (The National Academies Press: Washington, D.C.)
Oyedeji S, Onuche FJ, Animasaun DA, Ogunkunle CO, Agboola OO, Isichei AO (2016) Short-term effects of early-season fire on herbaceous composition, dry matter production and soil fertility in Guinea savanna, Nigeria. Archives of Biological Sciences 68, 7–16.
| Short-term effects of early-season fire on herbaceous composition, dry matter production and soil fertility in Guinea savanna, Nigeria.Crossref | GoogleScholarGoogle Scholar |
Packett R (2017) Rainfall contributes ~ 30% of the dissolved inorganic nitrogen exported from a southern Great Barrier Reef river basin. Marine Pollution Bulletin 121, 16–31.
| Rainfall contributes ~ 30% of the dissolved inorganic nitrogen exported from a southern Great Barrier Reef river basin.Crossref | GoogleScholarGoogle Scholar | 28521935PubMed |
Page KL, Dalal RC, Wehr JB, Dang YP, Kopittke PM, Kirchhof G, Fujinuma R, Menzies NW (2018) Management of the major chemical soil constraints affecting yields in the grain growing region of Queensland and New South Wales, Australia-a review. Soil Research 56, 765–779.
| Management of the major chemical soil constraints affecting yields in the grain growing region of Queensland and New South Wales, Australia-a review.Crossref | GoogleScholarGoogle Scholar |
Peck G, Buck S, Hoffman A, Holloway C, Johnson B, Lawrence D, Paton C (2011) ‘Review of productivity decline in sown grass pastures.’ (Meat and Livestock Australia Limited)
Penn CJ, Camberato JJ (2019) A critical review on soil chemical processes that control how soil pH affects phosphorus availability to plants. Agriculture (Switzerland) 9, 120
| A critical review on soil chemical processes that control how soil pH affects phosphorus availability to plants.Crossref | GoogleScholarGoogle Scholar |
Pringle MJ, Allen DE, Orton TG, Bishop TFA, Butler DW, Henry BK, Dalal RC (2016) Effects of land-use change and management on soil carbon and nitrogen in the Brigalow Belt, Australia: II. Statistical models to unravel the climate-soil-management interaction. The Rangeland Journal 38, 453–466.
| Effects of land-use change and management on soil carbon and nitrogen in the Brigalow Belt, Australia: II. Statistical models to unravel the climate-soil-management interaction.Crossref | GoogleScholarGoogle Scholar |
Prober SM, Lunt ID, Thiele KR (2002) Determining reference conditions for management and restoration of temperate grassy woodlands: relationships among trees, topsoils and understorey flora in little-grazed remnants. Australian Journal of Botany 50, 687–697.
| Determining reference conditions for management and restoration of temperate grassy woodlands: relationships among trees, topsoils and understorey flora in little-grazed remnants.Crossref | GoogleScholarGoogle Scholar |
Radford BJ, Thornton CM, Cowie BA, Stephens ML (2007) The Brigalow Catchment Study: III. Productivity changes on brigalow land cleared for long-term cropping and for grazing. Australian Journal of Soil Research 45, 512–523.
| The Brigalow Catchment Study: III. Productivity changes on brigalow land cleared for long-term cropping and for grazing.Crossref | GoogleScholarGoogle Scholar |
Raison RJ (1979) Modification of the soil environment by vegetation fires, with particular reference to nitrogen transformations: a review. Plant and Soil 51, 73–108.
| Modification of the soil environment by vegetation fires, with particular reference to nitrogen transformations: a review.Crossref | GoogleScholarGoogle Scholar |
Rasse DP, Rumpel C, Dignac M-F (2005) Is soil carbon mostly root carbon? Mechanisms for a specific stabilisation. Plant and Soil 269, 341–356.
| Is soil carbon mostly root carbon? Mechanisms for a specific stabilisation.Crossref | GoogleScholarGoogle Scholar |
Rayment GE, Higginson FR (1992) ‘Australian laboratory handbook of soil and water chemical methods.’ (Inkata Press)
Rayment GE, Lyons DJ (2011) ‘Soil chemical methods - Australasia.’ (CSIRO: Collingwood, Australia)
Reside AE, Beher J, Cosgrove AJ, Evans MC, Seabrook L, Silcock JL, Wenger AS, Maron M (2017) Ecological consequences of land clearing and policy reform in Queensland. Pacific Conservation Biology 23, 219–230.
| Ecological consequences of land clearing and policy reform in Queensland.Crossref | GoogleScholarGoogle Scholar |
Rezapour S, Taghipour A, Samadi A (2013) Modifications in selected soil attributes as influenced by long-term continuous cropping in a calcareous semiarid environment. Natural Hazards 69, 1951–1966.
| Modifications in selected soil attributes as influenced by long-term continuous cropping in a calcareous semiarid environment.Crossref | GoogleScholarGoogle Scholar |
Robertson FA, Myers RJK, Saffigna PG (1993) Distribution of carbon and nitrogen in a long-term cropping system and permanent pasture system. Australian Journal of Agricultural Research 44, 1323–1336.
| Distribution of carbon and nitrogen in a long-term cropping system and permanent pasture system.Crossref | GoogleScholarGoogle Scholar |
Roder W, Calvert O, Dorji Y (1993) Effect of burning on selected soil parameters in a grass fallow shifting cultivation system in Bhutan. Plant and Soil 149, 51–58.
| Effect of burning on selected soil parameters in a grass fallow shifting cultivation system in Bhutan.Crossref | GoogleScholarGoogle Scholar |
Sangha KK, Jalota RK, Midmore DJ (2005) Impact of tree clearing on soil pH and nutrient availability in grazing systems of central Queensland, Australia. Australian Journal of Soil Research 43, 51–60.
| Impact of tree clearing on soil pH and nutrient availability in grazing systems of central Queensland, Australia.Crossref | GoogleScholarGoogle Scholar |
Sardans J, Peñuelas J (2014) Hydraulic redistribution by plants and nutrient stoichiometry: shifts under global change. Ecohydrology 7, 1–20.
| Hydraulic redistribution by plants and nutrient stoichiometry: shifts under global change.Crossref | GoogleScholarGoogle Scholar |
Schulte-Uebbing L, de Vries W (2018) Global-scale impacts of nitrogen deposition on tree carbon sequestration in tropical, temperate, and boreal forests: a meta-analysis. Global Change Biology 24, e416–e431.
| Global-scale impacts of nitrogen deposition on tree carbon sequestration in tropical, temperate, and boreal forests: a meta-analysis.Crossref | GoogleScholarGoogle Scholar | 29034987PubMed |
Scott AD, Smith SJ (1968) Mechanism for soil potassium release by drying. Soil Science Society of America Journal 32, 443–444.
| Mechanism for soil potassium release by drying.Crossref | GoogleScholarGoogle Scholar |
Segoli M, Bray S, Allen D, Dalal R, Watson I, Ash A, O’Reagain P (2015) Managing cattle grazing intensity: effects on soil organic matter and soil nitrogen. Soil Research 53, 677–682.
| Managing cattle grazing intensity: effects on soil organic matter and soil nitrogen.Crossref | GoogleScholarGoogle Scholar |
Sharpley AN, Smith SJ (1988) Distribution of potassium forms in virgin and cultivated soils of the U.S.A. Geoderma 42, 317–329.
| Distribution of potassium forms in virgin and cultivated soils of the U.S.A.Crossref | GoogleScholarGoogle Scholar |
Shrestha K, Stevens S, Shrestha P, Adetutu EM, Walsh KB, Ball AS, Midmore DJ (2015) Characterisation of the soil microbial community of cultivated and uncultivated Vertisol in Australia under several management regimes. Agriculture, Ecosystems & Environment 199, 418–427.
| Characterisation of the soil microbial community of cultivated and uncultivated Vertisol in Australia under several management regimes.Crossref | GoogleScholarGoogle Scholar |
Silburn DM, Cowie BA, Thornton CM (2009) The Brigalow Catchment Study revisited: effects of land development on deep drainage determined from non-steady chloride profiles. Journal of Hydrology 373, 487–498.
| The Brigalow Catchment Study revisited: effects of land development on deep drainage determined from non-steady chloride profiles.Crossref | GoogleScholarGoogle Scholar |
Sims JR, Haby VA (1971) Simplified colorimetric determination of soil organic matter. Soil Science 112, 137–141.
| Simplified colorimetric determination of soil organic matter.Crossref | GoogleScholarGoogle Scholar |
Smith SJ, Scott AD (1974) Exchangeability of potassium in heated fine-grained micaceous minerals. Clays and Clay Minerals 22, 263–270.
| Exchangeability of potassium in heated fine-grained micaceous minerals.Crossref | GoogleScholarGoogle Scholar |
Song C, Wang E, Han X, Stirzaker R (2011) Crop production, soil carbon and nutrient balances as affected by fertilisation in a Mollisol agroecosystem. Nutrient Cycling in Agroecosystems 89, 363–374.
| Crop production, soil carbon and nutrient balances as affected by fertilisation in a Mollisol agroecosystem.Crossref | GoogleScholarGoogle Scholar |
Standley J, Hunter HM, Thomas GA, Blight GW, Webb AA (1990) Tillage and crop residue management affect Vertisol properties and grain sorghum growth over seven years in the semi-arid sub-tropics. 2. Changes in soil properties. Soil & Tillage Research 18, 367–388.
| Tillage and crop residue management affect Vertisol properties and grain sorghum growth over seven years in the semi-arid sub-tropics. 2. Changes in soil properties.Crossref | GoogleScholarGoogle Scholar |
Steffens M, Kölbl A, Totsche KU, Kögel-Knabner I (2008) Grazing effects on soil chemical and physical properties in a semiarid steppe of Inner Mongolia (P.R. China). Geoderma 143, 63–72.
| Grazing effects on soil chemical and physical properties in a semiarid steppe of Inner Mongolia (P.R. China).Crossref | GoogleScholarGoogle Scholar |
Thomas GA, Standley J, Hunter HM, Blight GW, Webb AA (1990) Tillage and crop residue management affect Vertisol properties and grain sorghum growth over seven years in the semi-arid sub-tropics. 3. Crop growth, water use and nutrient balance. Soil & Tillage Research 18, 389–407.
| Tillage and crop residue management affect Vertisol properties and grain sorghum growth over seven years in the semi-arid sub-tropics. 3. Crop growth, water use and nutrient balance.Crossref | GoogleScholarGoogle Scholar |
Thorburn P, Shaw R (1987) Effects of different dispersion and fine fraction determination methods on the results of routine particle size analysis. Soil Research 25, 347–360.
| Effects of different dispersion and fine fraction determination methods on the results of routine particle size analysis.Crossref | GoogleScholarGoogle Scholar |
Thornton CM, Elledge AE (2013) Runoff nitrogen, phosphorus and sediment generation rates from pasture legumes: an enhancement to reef catchment modelling. Report to the Reef Rescue Water Quality Research and Development Program. Reef and Rainforest Research Centre Limited, Cairns.
Thornton CM, Elledge AE (2016) Tebuthiuron movement via leaching and runoff from grazed Vertisol and Alfisol soils in the Brigalow Belt bioregion of central Queensland, Australia. Journal of Agricultural and Food Chemistry 64, 3949–3959.
| Tebuthiuron movement via leaching and runoff from grazed Vertisol and Alfisol soils in the Brigalow Belt bioregion of central Queensland, Australia.Crossref | GoogleScholarGoogle Scholar | 26881916PubMed |
Thornton CM, Yu B (2016) The Brigalow Catchment Study: IV. Clearing brigalow (Acacia harpophylla) for cropping or grazing increases peak runoff rate. Soil Research 54, 749–759.
| The Brigalow Catchment Study: IV. Clearing brigalow (Acacia harpophylla) for cropping or grazing increases peak runoff rate.Crossref | GoogleScholarGoogle Scholar |
Thornton CM, Cowie BA, Freebairn DM, Playford CL (2007) The Brigalow Catchment Study: II. Clearing brigalow (Acacia harpophylla) for cropping or pasture increases runoff. Australian Journal of Soil Research 45, 496–511.
| The Brigalow Catchment Study: II. Clearing brigalow (Acacia harpophylla) for cropping or pasture increases runoff.Crossref | GoogleScholarGoogle Scholar |
Tipping E, Davies JAC, Henrys PA, Kirk GJD, Lilly A, Dragosits U, Carnell EJ, Dore AJ, Sutton MA, Tomlinson SJ (2017) Long-term increases in soil carbon due to ecosystem fertilization by atmospheric nitrogen deposition demonstrated by regional-scale modelling and observations. Scientific Reports 7, 1890
| Long-term increases in soil carbon due to ecosystem fertilization by atmospheric nitrogen deposition demonstrated by regional-scale modelling and observations.Crossref | GoogleScholarGoogle Scholar | 28507306PubMed |
Townsend AR, Asner GP, Cleveland CC, Lefer ME, Bustamante MMC (2002) Unexpected changes in soil phosphorus dynamics along pasture chronosequences in the humid tropics. Journal of Geophysical Research Atmospheres 107, 8067
| Unexpected changes in soil phosphorus dynamics along pasture chronosequences in the humid tropics.Crossref | GoogleScholarGoogle Scholar |
Tripler CE, Kaushal SS, Likens GE, Todd Walter M (2006) Patterns in potassium dynamics in forest ecosystems. Ecology Letters 9, 451–466.
| Patterns in potassium dynamics in forest ecosystems.Crossref | GoogleScholarGoogle Scholar | 16623731PubMed |
Tucker BM, Beatty HJ (1974) pH, conductivity and chlorides. In ‘Methods for analysis of irrigated soils.’ (Ed. J Loveday) pp. 118–130. (Commonwealth Bureau of Soils)
Tulloch AIT, Barnes MD, Ringma J, Fuller RA, Watson JEM (2016) Understanding the importance of small patches of habitat for conservation. Journal of Applied Ecology 53, 418–429.
| Understanding the importance of small patches of habitat for conservation.Crossref | GoogleScholarGoogle Scholar |
VSN International (2016) Genstat V18.2. Available at https://www.vsni.co.uk/software/genstat/ [verified 26 November 2018].
Walkley A, Black IA (1934) An examination of the Degtjareff method for determining soil organic matter, and a proposed modification of the chromic acid titration method. Soil Science 37, 29–38.
| An examination of the Degtjareff method for determining soil organic matter, and a proposed modification of the chromic acid titration method.Crossref | GoogleScholarGoogle Scholar |
Wan S, Hui D, Luo Y (2001) Fire effects on nitrogen pools and dynamics in terrestrial ecosystems: a meta-analysis. Ecological Applications 11, 1349–1365.
| Fire effects on nitrogen pools and dynamics in terrestrial ecosystems: a meta-analysis.Crossref | GoogleScholarGoogle Scholar |
Wang J, Solomon D, Lehmann J, Zhang X, Amelung W (2006) Soil organic sulfur forms and dynamics in the Great Plains of North America as influenced by long-term cultivation and climate. Geoderma 133, 160–172.
| Soil organic sulfur forms and dynamics in the Great Plains of North America as influenced by long-term cultivation and climate.Crossref | GoogleScholarGoogle Scholar |
Wang Y, Liu JS, Wang JD, Sun CY (2012) Effects of wetland reclamation on soil nutrient losses and reserves in Sanjiang Plain, Northeast China. Journal of Integrative Agriculture 11, 512–520.
| Effects of wetland reclamation on soil nutrient losses and reserves in Sanjiang Plain, Northeast China.Crossref | GoogleScholarGoogle Scholar |
White RE (1969) On the measurement of soil pH. Journal of the Australian Institute of Agricultural Science 35, 3–14.
Whitehead D (2000) ‘Nutrient elements in grassland. Soil-plant-animal relationships.’ (CABI Publishing: Wallingford, UK)
Wiesmeier M, Steffens M, Kölbl A, Kögel-Knabner I (2009) Degradation and small-scale spatial homogenization of topsoils in intensively-grazed steppes of Northern China. Soil & Tillage Research 104, 299–310.
| Degradation and small-scale spatial homogenization of topsoils in intensively-grazed steppes of Northern China.Crossref | GoogleScholarGoogle Scholar |
Williams CH (1962) Changes in nutrient availability in Australian soils as a result of biological activity. Journal of the Australian Institute of Agricultural Science 28, 196–205.
Williams PH, Haynes RJ (1990) Influence of improved pastures and grazing animals on nutrient cycling within New Zealand Soils. New Zealand Journal of Ecology 14, 49–57.
Wilson BA, Neldner VJ, Accad A (2002) The extent and status of remnant vegetation in Queensland and its implications for statewide vegetation management and legislation. The Rangeland Journal 24, 6–35.
| The extent and status of remnant vegetation in Queensland and its implications for statewide vegetation management and legislation.Crossref | GoogleScholarGoogle Scholar |
Zhang P, Li L, Pan G, Ren J (2006) Soil quality changes in land degradation as indicated by soil chemical, biochemical and microbiological properties in a karst area of southwest Guizhou, China. Environmental Geology 51, 609–619.
| Soil quality changes in land degradation as indicated by soil chemical, biochemical and microbiological properties in a karst area of southwest Guizhou, China.Crossref | GoogleScholarGoogle Scholar |
* Parts I, II and III, Aust. J. Soil Res. 45(7), 479–495; 496–511; 512–523. Part IV, Soil Res. 54(6), 749–759.