

Prioritising interventions for the reduction of erosion in classical gullies: a modelling study
Matthew J. Prentice A B , Mark W. Waud C , Samille C. Loch-Wilkinson C , David P. Hamilton A and Melanie E. Roberts A D *
A
B
C
D
Abstract
Gully erosion is a significant socioeconomic and environmental issue that affects agricultural productivity, infrastructure, and water quality of receiving waters. Despite a variety of interventions to prevent gully formation and rehabilitate existing gullies, cost-effective interventions are specific to individual gullies.
The aim of this study was to assess the performance of a suite of gully management interventions across three different classical gullies.
A one-dimensional process-based model, MERGE (modelling erosion resistance for gully erosion), was used to quantify the sediment yield exiting the gullies, in response to various management interventions.
The net decrease in sediment yield was 2.5–57.4% for each of four interventions applied in isolation and 51.2–78.7% in combination. Reductions in sediment yield for each intervention varied markedly among sites, by a factor of 2.6–78.3 in absolute terms. This resulted in a unique ranking of the interventions by their effectiveness for a given site. Overall, interventions applied in combination were most effective, outperforming those applied in isolation by a factor of 1.24–1.37, but the effect of applying interventions in combination was not additive.
This study demonstrates the ability of the gully erosion model MERGE to be a useful tool to identify and tailor effective intervention strategies for individual gullies, and be a useful guide for decision making for erosion management.
Analysis of expected benefits of gully remediation using tools such as MERGE is important for assessing options at gully sites due to their widely varying response.
Keywords: environmental restoration, gully erosion, management, mathematical modelling, MERGE, permanent gully, process-based model, water quality.
Introduction
Gully erosion is a significant socioeconomic and environmental issue (Yitbarek et al. 2010; Bartley et al. 2020; Frankl et al. 2021). The socioeconomic implications of gully erosion include loss of agricultural productivity, and the destabilisation of landscapes, housing, and other essential infrastructure (Valentin et al. 2005). The environmental implications of gully erosion are largely related to the export of sediment and nutrients to the riverine, lacustrine, and marine environments (Streeter et al. 2021). The resulting sediment and nutrient loads impair water quality through stimulating eutrophication and algal blooms, and causing loss of water clarity (Hamilton et al. 2016). In many cases gullies occupy <5% of the landscape but generate 10–95% of the total sediment lost at the catchment scale (Poesen et al. 2003), with gully erosion hot spots identified across every continent (Castillo and Gómez 2016). Gully erosion is a major contributor to annual costs of US$231 billion (i.e. 0.41% of the global GDP) resulting from soil erosion and land degradation (Nkonya et al. 2016). Management and mitigation of gully erosion is therefore critical for environmental protection on a global scale.
The detrimental impacts of gully erosion have motivated extensive efforts to prevent gullying and rehabilitate existing gullies (Yitbarek et al. 2010; Haregeweyn et al. 2015; Hartman et al. 2016; Bartley et al. 2020; Frankl et al. 2021). Approaches to reduce gully erosion and improve downstream water quality include interventions that primarily function by (1) reducing the volume or velocity of runoff entering and/or travelling through a gully, (2) increasing the erosion resistance of the soil, and (3) capturing eroded sediment off-site to prevent downstream impacts. Interventions based primarily on reducing the volume (or velocity) of the flow entering the gully head include diverting flow (Frankl et al. 2021), increasing in-catchment vegetation cover (Gomez et al. 2003), and improving in-catchment livestock management (Hunt et al. 2014). Interventions based primarily on reducing the velocity of flow within the gully include vegetating the gully head and/or channel (Rey 2003), installing in-catchment livestock exclusion fencing (Koci et al. 2021), battering/reshaping of the gully head or channel to reduce channel slope (Rust and Star 2017), and the installation of in-channel structures (e.g. porous check dam, leaky weir, and silt trap weir) (Wilkinson et al. 2019; Koci et al. 2021). Interventions based primarily on increasing resistance to erosion in the gully include vegetating the head or channel, and installing protective barriers, e.g. bamboo sheeting, and rock check dams (Langendoen et al. 2014; Koci et al. 2021). Downstream solutions to trap sediment include natural and constructed wetlands (Adame et al. 2019; Kavehei et al. 2021), and dams or reservoirs (Lewis et al. 2013). Such interventions have been applied to control gullies, with varying success. For example, vegetation control reduced erodability indices by 2–24% in two studies in the Loess Plateau, China (Guo et al. 2018; Zhang et al. 2019); and bank stabilisation (with vegetation and/or bamboo sheeting), and re-shaping and rocking gully heads reduced sediment load after 1 year by 87% in the Birr watershed, Ethiopia (Addisie et al. 2016). Further, Bartley et al. (2020) reported reductions in sediment yield due to gully erosion management of 12–94% in a global review of 37 studies.
Reasons for the observed variation in outcome are complex, and include climatological regimes [e.g. rainfall intensity (Chen and Cai 2006)], geological regimes [e.g. catchment slope and soil-type (Wilkinson et al. 2019)], and intervention benefits sometimes taking several years before they are fully realised [e.g. changes in catchment vegetation cover (Gomez et al. 2003)] or being short-lived [e.g. check dams in certain situations, <30 years (Quiñonero-Rubio et al. 2016)]. Gully erosion interventions vary markedly in both efficacy and cost-effectiveness, with many of the most efficacious interventions involving extensive costly engineering works (e.g. installing a rock chute at the gully head) or high maintenance costs, while many of the cheaper interventions (e.g. increasing vegetation cover) may be less effective (Wilkinson et al. 2019). Thus, choosing the most appropriate intervention or interventions to ensure a cost-effective treatment that meets the restoration objectives is both a non-trivial and critical matter for land managers.
Various gully models have been developed to predict growth, quantify the effects on water quality of receiving water bodies, and support and inform gully rehabilitation efforts (Roberts et al. 2022). Such models are becoming increasingly applied, and provide a complementary tool to prior studies (e.g. Frankl et al. 2021), best practice guidelines (e.g. Wilkinson et al. 2019; Calero et al. 2021), and expert knowledge in informing gully management. The benefits of changed gully management practice has been modelled at the catchment scale, for example using the ‘management factor’ in the Dynamic SedNet gully erosion model (Ellis 2018), and at the individual gully scale (Hancock et al. 2000; Langendoen et al. 2014; Prentice et al. 2021; Roberts 2022; Roberts and Roots 2023). Gullies have been modelled through the application of erosion models targeted to other systems into the gully space (e.g. BSTEM and CONCEPTS) (Langendoen et al. 2014), and with models developed specifically for ephemeral or classical (permanent) gullies. These models vary in their (1) formulation (process-based vs data driven), (2) prescribed output (change in gully morphology/landscape vs sediment yield), (3) spatial scale (gully vs catchment or continent), and (4) temporal scale. Most gully erosion models are empirical; however, the lack of data has limited the application of these approaches to gully management and rehabilitation. The few available process-based gully erosion models, by contrast, are well equipped to handle analysis of the potential costs and benefits of different interventions owing to their formulation being based on the underlying physical processes (Roberts et al. 2022). Consequently, process-based models have been identified as necessary to support gully rehabilitation efforts (Prosser 2018), and provide options for landscape restoration under global change scenarios (Cuddington et al. 2013).
The development of process-based models has been motivated by increasing interest in the contribution of gullies to ecosystem health, but uptake and application for management purposes is still in its infancy. The classical gully erosion specific process-based models available [e.g. GULTEM (Sidorchuk 1999), Plunge Pool Model (Alonso et al. 2002), ‘Unnamed model’ (Rose et al. 2014), and MERGE (Roberts 2020)] are primarily based on conservation of mass in a water column subject to entrainment (source) and deposition (sink). These models vary markedly in their prescribed output, including gully growth (Alonso et al. 2002), gully morphology (Sidorchuk 1999), and gully sediment yield (Rose et al. 2014; Roberts 2020). Of these models, MERGE is best suited to directly modelling interventions to support management for individual gullies (Roberts et al. 2022, fig. 7).
The aim of this study was to assess the performance of a suite of gully erosion management interventions across three vastly different classical gullies to inform their on-site management. This aim was addressed using MERGE to quantify the change in the sediment delivery due to selected management actions. Gully sediment yields were determined in three morphometrically different gullies in response to four interventions applied in isolation and in combination with one another (as commonly applied in practice). Interventions applied were (1) reducing the flow entering the gully head (representing catchment works, e.g. constructing diversion banks, installing exclusion fencing, and vegetating the catchment), (2) battering and vegetating the structure and slope of the gully head, (3) installing a rock chute at the gully head, and (4) installing rock check dams within the gully channel. To ensure a fair evaluation of the usefulness of MERGE to support gully management activities, input data were restricted to those routinely collected by Healthy Land and Water, a natural resource management organisation for south-east Queensland, or that could readily be included in their site studies.
Material and methods
Study area and gully descriptions
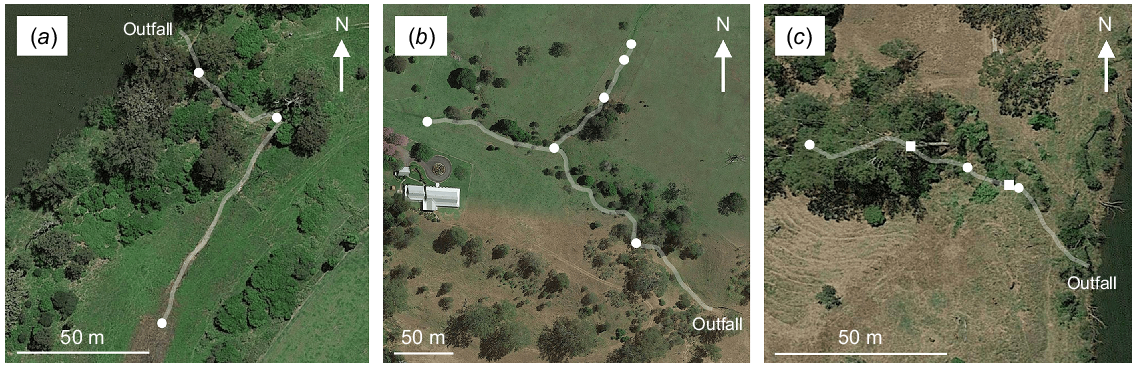
Fernvale Gully (27°26′31″S; 152°37′53″E), Riverside-North Gully (27°31′22″S; 152°45′34″E), and Riverside-South Gully (27°32′13″S; 152°44′37″E) are classical gullies located in south-east Queensland, Australia. The climate of the region is subtropical, with monthly mean rainfall of 110 mm in summer and 30 mm in winter (Bureau of Meterology 2022). Each gully has a catchment largely comprising pasture, with stretches of gully that are both grazed and non-grazed. Fernvale and Riverside-North gullies are linear in structure, measuring 150 and 106 m in length, respectively (Fig. 1a, c). Riverside-South Gully is dendritic (branching) in structure with two separate 146 and 112 m stretches of gully entering another 212 m stretch of gully (Fig. 1b). Each gully includes multiple erosion heads between channel sections, which vary in their width, depth, slope, and Manning’s roughness coefficient (Table 1). Riverside-South Gully also includes two natural leaky weirs, comprising branches and other detrital material. The outfall of the three gullies is into the Mid-Brisbane River, which feeds the Mount Crosby Water Treatment Plant (and thus the potable water supply of Brisbane and Ipswich), and subsequently Moreton Bay, which includes an internationally important (Ramsar) wetland. Consequently, management and mitigation of water quality in the Mid-Brisbane River is a significant economic and environmental issue for the surrounding region.
(a) Fernvale Gully, (b) Riverside-North Gully, and (c) Riverside-South Gully study sites, showing each gully’s sections, heads (circles), natural leaky weirs (squares), and outfall (source: GoogleEarth).
| Gully | # | Type | L (m) | W (m) | D0 (m) | S (unitless) | n (S/m1/3) | BC (#) | |
|---|---|---|---|---|---|---|---|---|---|
| Fernvale | 1 | Head | 2.00 | 3.00 | 1.00 | 0.007 | 0.027 | – | |
| 2 | Channel | 93.00 | 3.50 | 1.00 | 0.007 | 0.027 | 1 | ||
| 3 | Head | 6.00 | 4.00 | 2.50 | 0.061 | 0.027 | 2 | ||
| 4 | Channel | 32.00 | 3.50 | 2.50 | 0.061 | 0.027 | 3 | ||
| 5 | Head | 9.00 | 3.25 | 1.50 | 0.082 | 0.045 | 4 | ||
| 6 | Channel | 8.00 | 4.00 | 1.50 | 0.082 | 0.045 | 5 | ||
| Riverside-North | 1 | Head | 1.50 | 1.00 | 0.40 | 0.055 | 0.027 | – | |
| 2 | Channel | 144.50 | 1.25 | 0.40 | 0.055 | 0.027 | 1 | ||
| 3 | Head | 1.25 | 1.50 | 0.35 | 0.047 | 0.060 | – | ||
| 4 | Channel | 15.75 | 1.50 | 0.35 | 0.047 | 0.060 | 3 | ||
| 5 | Head | 2.00 | 1.50 | 0.60 | 0.033 | 0.055 | 4 | ||
| 6 | Channel | 34.00 | 2.75 | 0.60 | 0.033 | 0.055 | 5 | ||
| 7 | Head | 3.50 | 4.00 | 1.20 | 0.042 | 0.048 | 6 | ||
| 8 | Channel | 55.50 | 3.00 | 1.20 | 0.042 | 0.048 | 7 | ||
| 9 | Head | 2.00 | 2.00 | 0.80 | 0.021 | 0.050 | 2 and 8 | ||
| 10 | Channel | 117.00 | 2.50 | 0.80 | 0.021 | 0.050 | 9 | ||
| 11 | Head | 3.00 | 3.00 | 0.40 | 0.022 | 0.050 | 10 | ||
| 12 | Channel | 90.00 | 3.00 | 0.40 | 0.022 | 0.050 | 11 | ||
| Riverside-South | 1 | Head | 3.50 | 2.50 | 1.20 | 0.085 | 0.035 | – | |
| 2 | Channel | 55.50 | 2.25 | 1.20 | 0.085 | 0.035 | 1 | ||
| 3 | Head | 1.00 | 2.00 | 0.40 | 0.113 | 0.025 | 2 | ||
| 4 | Channel | 17.50 | 2.25 | 0.40 | 0.113 | 0.025 | 3 | ||
| 5 | Head | 3.50 | 2.50 | 1.80 | 0.067 | 0.025 | 4 | ||
| 6 | Channel | 25.00 | 2.50 | 1.80 | 0.067 | 0.025 | 5 |
The gullies are segmented into head and channel sections of length (L) with assumed homogeneous width (W), depth (D0), slope (S), and Manning’s roughness coefficient (n) (expressed as the post cattle grazing scenario, which is the lowest value modelled at each site). The concentration boundary condition (BC) is the outflow of the up-gully section joining the given section.
Data and data sources
We restricted our study to data typically available to management agencies from preliminary site assessments, trivially measured in the field, or available within the literature. Gully slope and length were determined using GoogleEarth, and width, depth, and Manning’s roughness coefficient were provided by Healthy Land and Water. Gully geometry and Manning’s roughness were determined for each head and gully section. For grazed sections, the Manning’s roughness coefficient may vary markedly based on recent cattle grazing, within 0.025–0.030 s/m1∕3 for recently grazed and 0.035–0.060 s/m1∕3 for not-recently or ungrazed. Fernvale Gully has three head and three channel sections, width of 3.0–4.0 m, depth of 1.0–2.5 m, slope of 0.007–0.082, and Manning’s roughness of 0.027–0.045 s/m1∕3. Riverside-North Gully has six head and six channel sections, width of 1.0–4.0 m, depth of 0.35–1.20 m, slope of 0.022–0.047, and Manning’s roughness of 0.027–0.065 s/m1∕3. Riverside-South Gully has three heads and three channel sections (and two natural leaky weirs within the channel sections 1 and 2), width of 2.0–2.5 m, depth of 0.4–2.0 m, slope of 0.067–0.118, and Manning’s roughness of 0.035–0.060 s/m1∕3. A 5% annual exceedence probability event, equivalent to a 1-in-20-year event, was selected for this study in line with Healthy Land and Water’s standard design principles. The events modelled have fluxes of 5.08, 0.78, and 3.02 m3/s for Fernvale, Riverside North, and Riverside South gullies, respectively (values supplied, Healthy Land and Water). Site-specific soil samples were not available. A particle size of 16 μm was selected to focus on finer particles, and a density of 1330 kg/m3 due to the dominance of Dermosols in the region.
Model description
MERGE is an event-based one-dimensional model for gully erosion that is designed to capture the physical interactions of erosion events in classical gullies and explore the benefits of different interventions for their potential implementation in situ (Roberts 2020). MERGE uses conservation of mass within the water column subject to the entrainment (source) and deposition (sink) of sediment to calculate the flux of sediment exiting a gully. MERGE captures erosion due to two key processes: (1) headcut retreat due to the action of runoff entering the gully as a waterfall at a gully head, and (2) channel floor and wall scouring due to flow within the gully channel. Deposition results from sediment settling out of the water column; and this deposited sediment is available for re-entrainment.
MERGE replicates the important elements of gully erosion; including attainment of a steady concentration under constant conditions, development of a depositional layer, and in the dynamic case, first flush effects and hysteresis. The analytical solutions have been applied in preliminary evaluations of the model’s performance to assess the benefits of management interventions using on-ground data (Prentice et al. 2021; Roberts 2022; Roberts and Roots 2023).
Analytical quasi-steady state solutions to MERGE (Roberts 2020, eqns 12–15) are used in the present study to describe the sediment concentration along the gully and the sediment flux (kg/s) exiting the gully, which we refer to as the sediment yield for clarity. These analytical solutions capture two cases: (1) where deposition is greater than entrainment, forming a depositional layer on the gully floor, thus protecting the original soil matrix from erosion, and (2) where deposition is less than entrainment, thus exposing the original soil matrix to erosion. Key parameters in MERGE are the mean concentration of sediment within the water column [C (kg/m3)], flow [Q (m3/s)], erosion resistance [J (W s/kg)], Manning’s roughness coefficient [n (s/m1/3)], and the dimensions of the gully head and channel [i.e. length, depth, and width (all m) and slope]. Additional parameters, primarily fixed relationship parameters (albeit modifiable by the user), are outlined in Table 2. A global sensitivity analysis of MERGE demonstrated that the model sensitivity is regime dependent, with the parameters driving the erosion event dominating the model output (i.e. sediment yield). Erosion resistance (J) accounted for at least 35% of the variation in sediment yield in three of the five scenarios, and was only a minor contributor in highly erosive (very low soil cohesion) or highly cohesive (minimal erosion) scenarios. Across the five scenarios, MERGE was insensitive to variations in the gully width, head length, slope, and Manning’s roughness coefficient (Sobol indices ≤0.02 across all scenarios) (Bennett et al. 2023).
| Parameter | Symbol | Value | Unit | |
|---|---|---|---|---|
| Carrying capacity | C* | 0.1σ | kg/m3 | |
| Concentration gradient | b | 1 | Unitless | |
| Dynamic viscosity of water | μ | 1.0031 × 10⁻⁶ρ | kg/(m s) | |
| Erosion resistance | J | 10–2560 | W s/kg | |
| Fluid density | ρ | 1000 | kg/m3 | |
| Friction term | F | 0 | W s/kg | |
| Gravity | g | 9.81 | m/s2 | |
| Initial concentration | C0 | 0 | kg/m3 | |
| Power proportion | k | 0.01 | Unitless | |
| Sediment density | σ | 1330 | kg/m3 | |
| Sediment size | R | 1.6 × 10⁻⁵ | m | |
| Settling velocity | w s | 0.05 | m/s |
Gully erosion intervention assessment
The analytical solutions to MERGE were implemented in Python v 3.9.6. Model code was developed to piece together unique gully sections (both heads and channels) with different parameter values. Fixed relationship parameters (Table 2) were determined as those in Roberts (2020), with the exception of the sediment density (σ), carrying capacity (C*), and power proportion (k). The erosion resistance (J) was input as a selection of values between 10 (i.e. low J; high erodibility) and 2560 W s/kg (i.e. high J; low erodibility). Parameter space for J was broadly explored because MERGE output is sensitive to this parameter (Bennett et al. 2023), and obtaining detailed field measurements of soil cohesion was out of budget scope for our study. Values of J are averaged in modelled gullies but in reality will vary spatially with gully depth and length, and temporally with soil moisture, root mass, and other seasonal factors. The exploration of a range of parameter values allows MERGE users and decision makers to better understand uncertainty in model output driven by sensitive model parameters, and to potentially target additional field or laboratory studies for such parameters, or develop research on the models to include spatially and temporally varying parameters. The Manning’s roughness coefficient, n, was determined as the worst case scenario (i.e. post cattle grazing; Table 1).
Under baseline conditions (no interventions) we assume the flow through the gully is constant. Where two sections join into a single channel as in Riverside-North Gully, the flow in the lower section is the sum of that in the contributing up-gully sections. In gullies with two or more sections receiving catchment input (i.e. Riverside-North Gully), the inflow (Q) was divided and apportioned equally between the various gully heads receiving inputs directly from the catchment. Natural leaky weirs, present in Riverside-South Gully, were not modelled due to negligible effect on the model output, and thus were considered part of the gully channels in which they were nested.
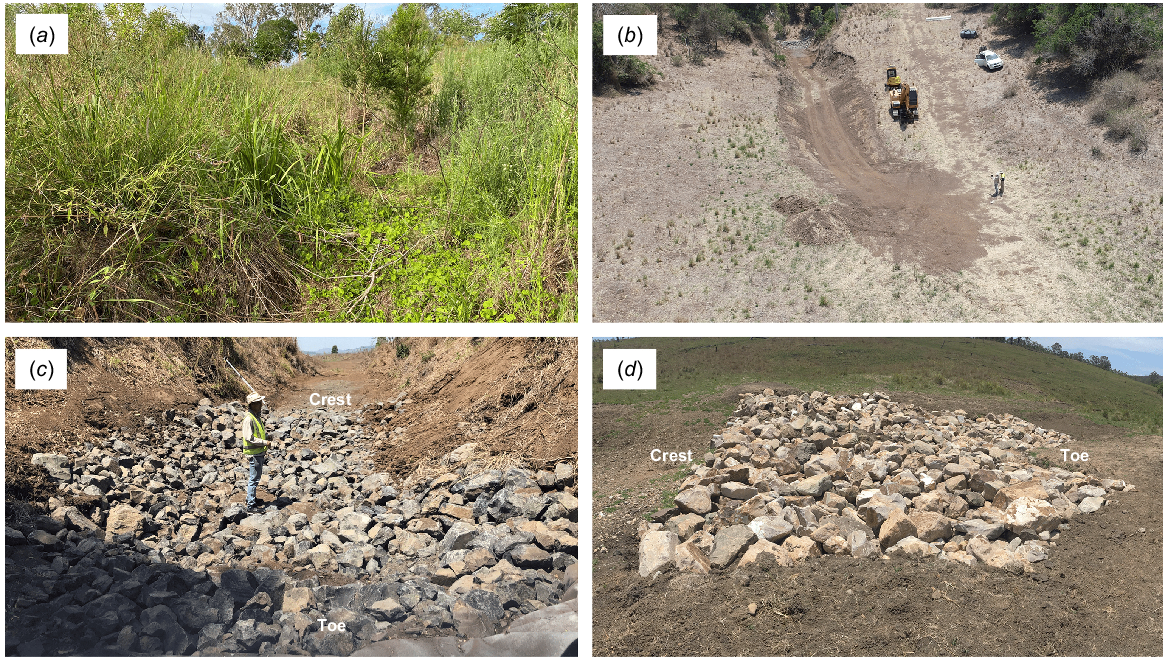
To determine the most effective intervention(s) for reducing gully erosion in each of the three gullies, we quantified the reduction in the sediment yield to the receiving river, for four different interventions applied in isolation and, where interventions were not mutually exclusive, in pairs. The sediment yield, QC, is the product of the flow, Q, and the sediment concentration, C. Intervention #1 simulated a 50% reduction in the inflow (Q) entering the gully head (due to catchment works). Intervention #2 simulated battering (Fig. 2b) and vegetating (with hedges of vetiver grass, Chrysopogon zizanioides) (Fig. 2a) the structure and slope of the gully head in the two most erosive heads of each gully. Battering and vegetating the structure and slope of the gully head were achieved by changing the head to a channel, with the resultant channel modified to a length of 10 m (with the subsequent segment modified accordingly) and a slope of 0.1 (i.e. 1:10). Vegetation of the reshaped gully head was modelled by increasing the Manning’s roughness coefficient to 0.05 s/m1/3, equivalent to the mid value for ‘light brush and trees, in winter’ as suggested by Chow (1959). Intervention #3 simulated the installation of a rock chute (Fig. 2c) at the gully head in the two most erosive heads of each gully. The presence of a rock chute was modelled by assuming that net erosion or deposition would not occur within the region of the rock chute. That is, the sediment concentration (C) at the end of the rock chute was assumed to have the same value as at the start of the rock chute. Intervention #4 simulated the installation of rock check dams (Fig. 2d) within the two channel sections with the greatest slope. This was achieved by defining 10 m long sections (or if the pre-existing channel section was <10 m, the intervention was input as the entire channel section), in the middle of the two longest channel sections in each gully with a Manning’s roughness coefficient of 0.16 s/m1/3, equivalent to the upper value for ‘medium to dense brush, in summer’ as suggested by Chow (1959). Planting of vetiver hedges (Intervention #3) and implementation of rock check dams (Intervention #4) were assumed not to change the depth of flow within the channel. The true situation is more complicated, since increasing the roughness of a channel (i.e. increasing n), results in a slower flow (decreased Q) for a given flow depth (d). Interventions were also simulated in pairs as interventions in practice are rarely applied in isolation. Paired interventions were carried out in all instances, with the exception of the mutually exclusive pairing of battering and vegetating (#2) and rock chutes (#3). Where intervention pairs would result in an overlap, battering and vegetating (#2) and rock chutes (#3) were given precedence over rock check dams (#4), meaning rock check dams in this instance would be implemented as <10 m in length.
Examples of interventions applied in this study: (a) revegetation of the catchment as an example of catchment works, (b) battering (= reshaping) the structure and slope of the gully head (photo represents early development, hence not vegetated), (c) installation of a rock chute at the gully head, and (d) installation of a rock check dam in the gully channel. (Photos: Healthy Land and Water).
Results
Erosion resistance
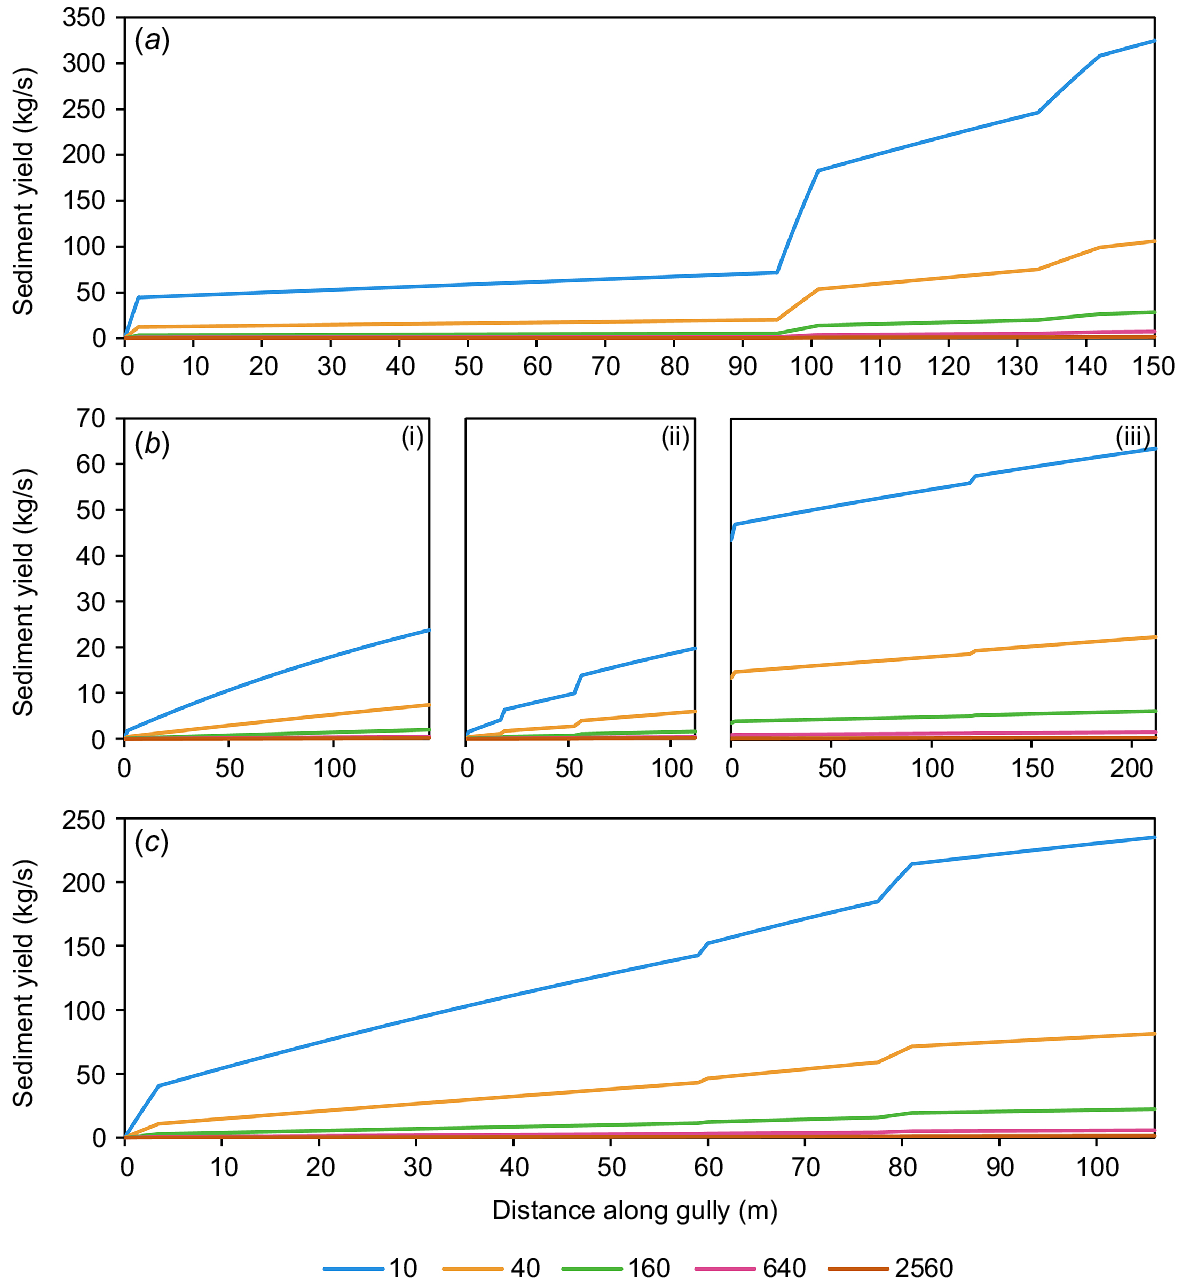
Higher erosion resistance, i.e. higher J values, resulted in a lower sediment yield (QC) along and exiting all three gullies (Fig. 3). The sediment concentration (C) did not reach the carrying capacity (C*) (i.e. the maximal sediment concentration permitted by the model) in any of the cases simulated, i.e. J = 10–2560 W s/kg. In the most erosive case, i.e. J = 10, the maximum sediment concentration simulated was 48%, 61%, and 59% of the carrying capacity in Fernvale, Riverside-North, and Riverside-South gullies, respectively. Across all cases, i.e. J = 10–2560 W s/kg, the sediment yield was 1.8–324.7, 0.4–63.5, and 1.4–235.1 kg/s, in Fernvale, Riverside-North, and Riverside-South gullies, respectively (Fig. 3). Despite significant variation in the absolute impact of interventions for different erosion resistance values, the relative values were consistent across the range of J values explored at the individual gully level. Subsequent model results are therefore presented for a restricted range of J values (40–640 W s/kg). The relative reduction values stated in Results and Discussion are given using the intermediate value J = 160 W s/kg. Results are given in full in Supplementary Tables S1–S4.
Sediment yield (QC; kg/s) along the length of the three gullies: (a) Fernvale Gully, (b) Riverside-North Gully, and (c) Riverside-South Gully, for increasing erosion resistance (J) values between 10 (highly erosive) and 2560 W s/kg (less erosive). The erosion resistance is indicated by the line colour. Riverside-North Gully (b) has two branches, shown in subplots i and ii, that feed into the main channel, shown in subplot iii.
Interventions applied in isolation
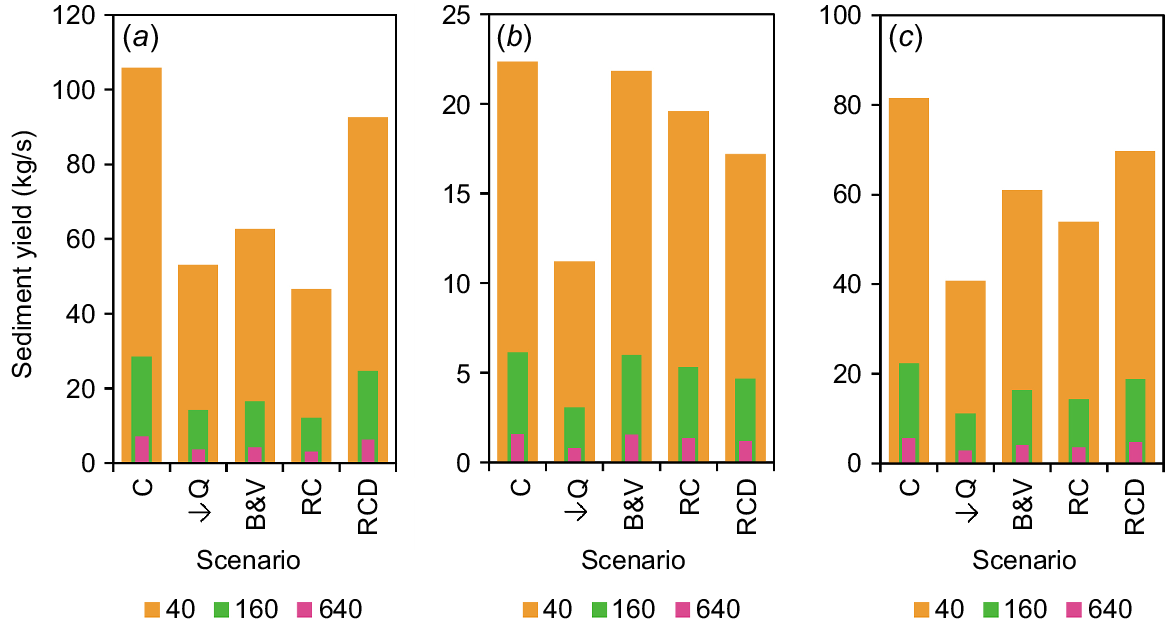
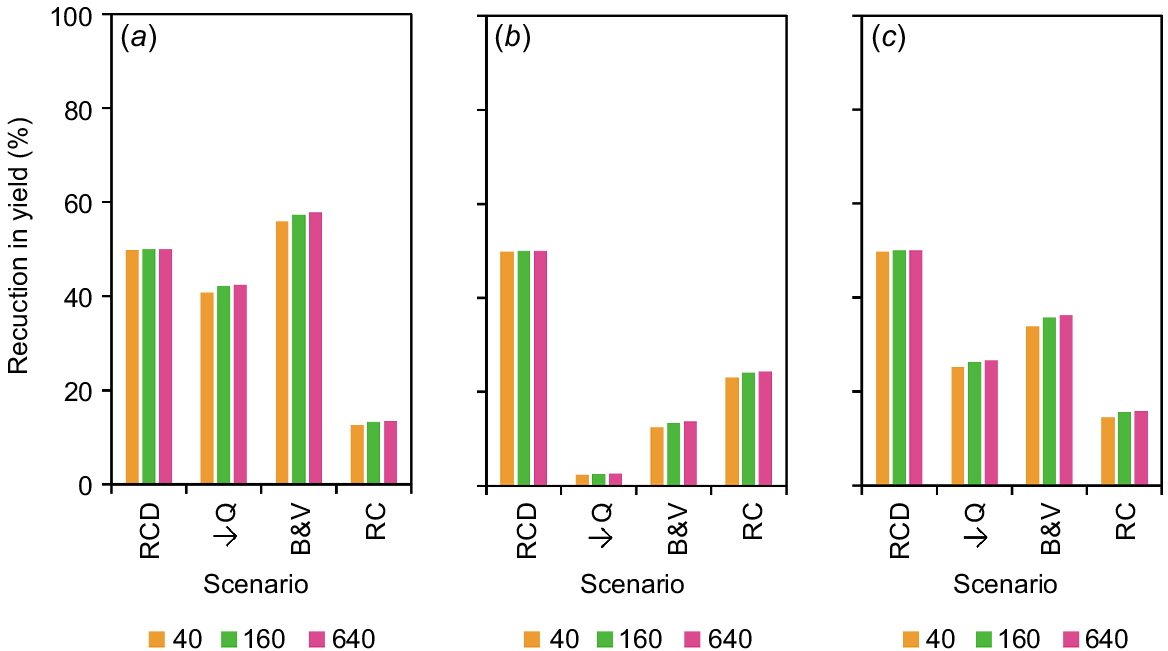
The four interventions applied in isolation resulted in a net decrease in sediment yield across all scenarios. Reductions, however, varied markedly between sites in both absolute and relative terms. Here, assuming the mid-range J-value (i.e. 160 W s/kg), absolute reductions in sediment yield were 3.8–16.4 kg/s at Fernvale Gully, 0.2–3.1 kg/s at Riverside-North Gully, and 3.5–11.1 kg/s at Riverside-South Gully (Fig. 4). These reductions resulted in corresponding relative reductions (i.e. relative to the control) in sediment yield of 13.3–57.4%, 2.5–50.0%, and 15.6–50.0% (Fig. 5). The reduction in sediment yield affected by each intervention typically varied markedly across sites in absolute (and relative) terms by factors of 4.6 (relative = 1.0) for the reduction in flow, 78.3 (relative = 16.9) for battering and vegetation, 19.9 (relative = 4.3) for rock chutes, and 2.6 (relative = 1.8) for rock check dams. The ability of each intervention to reduce the sediment yield therefore resulted in a unique ranking of the interventions by their effectiveness for each site (Table 3). Specifically, the most effective intervention applied in isolation at Fernvale Gully was rock chutes (relative reduction = 57.4%), while at Riverside-North and Riverside-South reducing flow (50%) was most effective.
Sediment yield (kg/s) at baseline (i.e. control as C) and for interventions applied in isolation: (a) Fernvale Gully, (b) Riverside-North Gully, and (c) Riverside-South Gully. Interventions include the reduction of inflow entering the gully (due to catchment works) by 50% (↓Q), battering and vegetating of the structure and slope of the gully head (B&V), installation of rock chutes in two gully heads (RC), and installation of rock check dams in two gully channels (RCD). Legend represents the erosion resistance, J (W s/kg) value.
Relative reduction (%) in sediment yield (kg/s) for interventions applied in isolation: (a) Fernvale Gully, (b) Riverside-North Gully, and (c) Riverside-South Gully. Interventions are the reduction of inflow entering the gully (due to catchment works) by 50% (↓Q), battering and vegetating of the structure and slope of the gully head (B&V), installation of rock chutes in two gully heads (RC), and installation of rock check dams in two gully channels (RCD). Legend represents the erosion resistance, J (W s/kg) value.
| Ranking | Fernvale Gully | Riverside-North Gully | Riverside-South Gully | |
|---|---|---|---|---|
| 1 | RC (57%) | ↓Q (50%) | ↓Q (50%) | |
| 2 | ↓Q (50%) | RCD (24%) | RC (36%) | |
| 3 | B&V (42%) | RC (13%) | B&V (26%) | |
| 4 | RCD (13%) | B&V (2%) | RCD (16%) |
Reduction in yield (at J = 160 W s/kg) relative to control (as %) in parentheses. RC, rock chutes; ↓Q, reduction of inflow; B&V, battering and vegetating; and RCD, rock check dams.
Interventions applied in combination
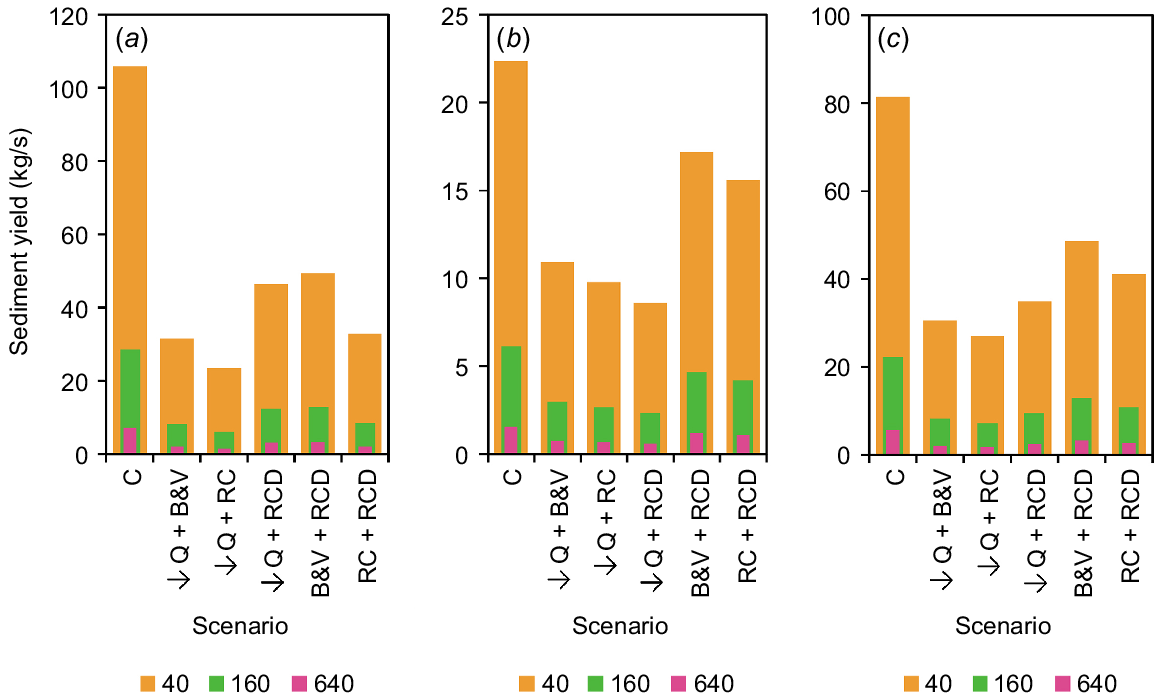
The five intervention combinations resulted in a net decrease in sediment yield across all scenarios. As with those applied in isolation, reductions varied markedly between sites in both absolute and relative terms (Figs 6 and 7), and reductions in sediment yield for a given intervention combination varied markedly in relative terms within and between sites (Fig. 7). As with those applied in isolation, the ability of each intervention combination to reduce the sediment yield resulted in a unique ranking of the interventions by their effectiveness for each site (Table 4). Here, the most effective intervention combinations resulted from the pairing of reduced flow with either a rock chute or rock check dam, with reduced flow and rock chutes the most effective at Fernvale Gully (relative reduction = 78.7%) and Riverside-South Gully (67.8%), and reduced flow and rock check dams the most effective at Riverside-North Gully (62.0%). The most effective interventions applied in combination were demonstrated to outperform the most effective intervention applied in isolation by factors of 1.37, 1.24, and 1.36 in Fernvale, Riverside-North, and Riverside-South gullies, respectively.
Sediment yield (kg/s) at baseline (i.e. control as C) and for interventions applied in combination: (a) Fernvale Gully, (b) Riverside-North Gully, and (c) Riverside-South Gully. Interventions include combinations of the reduction of inflow entering the gully (due to catchment works) by 50% (↓Q), battering and vegetating of the structure and slope of the gully head (B&V), installation of rock chutes in two gully heads (RC), and installation of rock check dams in two gully channels (RCD). Legend represents the erosion resistance, J (W s/kg) value.
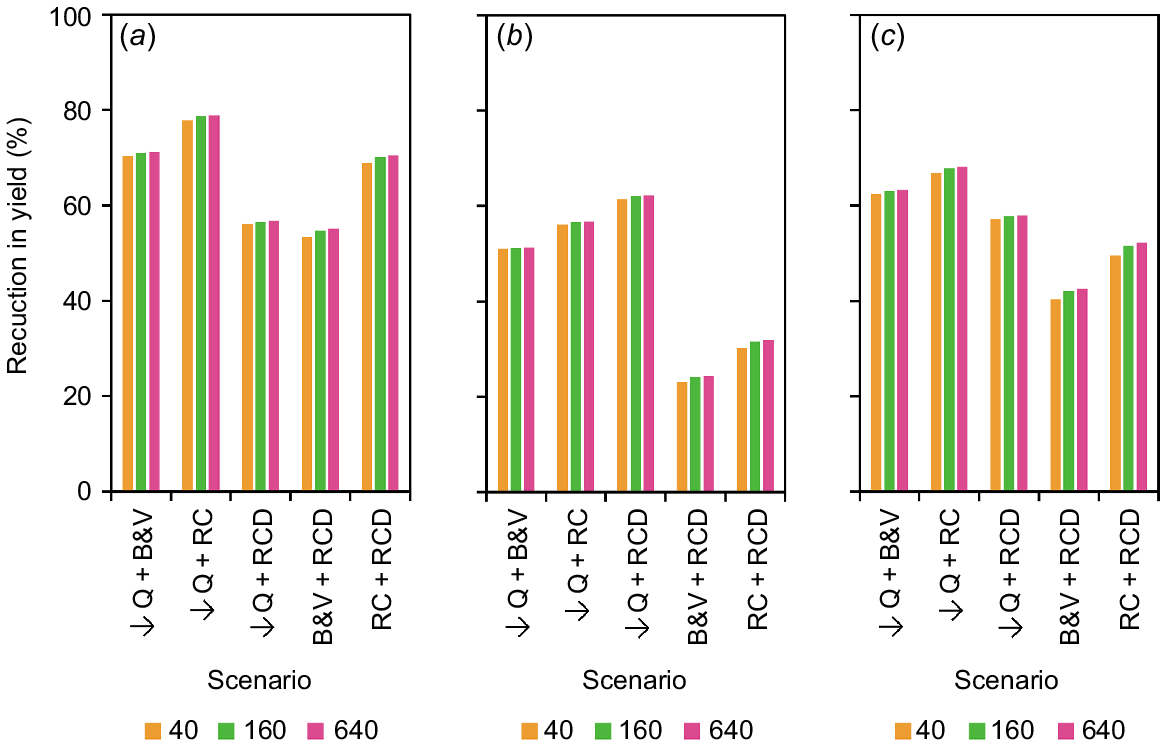
Relative reduction (%) in sediment yield (kg/s) for interventions applied in combination: (a) Fernvale Gully, (b) Riverside-North Gully, and (c) Riverside-South Gully. Interventions include combinations of the reduction of inflow (Q) entering the gully (due to catchment works) by 50% (↓Q), battering and vegetating of the structure and slope of the gully head (B&V), installation of rock chutes in two gully heads (RC), and installation of rock check dams in two gully channels (RCD). Legend represents the erosion resistance, J (W s/kg) value.
| Ranking | Fernvale Gully | Riverside-North Gully | Riverside-South Gully | |
|---|---|---|---|---|
| 1 | ↓Q + RC (79%) | ↓Q + RCD (62%) | ↓Q + RC (68%) | |
| 2 | ↓Q + B&V (71%) | ↓Q + RC (57%) | ↓Q + B&V (63%) | |
| 3 | RC + RCD (70%) | ↓Q + B&V (51%) | ↓Q + RCD (58%) | |
| 4 | ↓Q + RCD (57%) | RC + RCD (32%) | RC + RCD (52%) | |
| 5 | B&V + RCD (55%) | B&V + RCD (24%) | B&V + RCD (42%) |
Reduction in yield (at J = 160 W s/kg) relative to control (as %) in parentheses. ↓Q, reduction of inflow; RC, rock chutes; RCD, rock check dams, and B&V, battering and vegetating.
Discussion
Applying the process-based gully erosion model MERGE in this study, the relative reduction of the sediment yield resulting from each in-gully intervention (c.f. in-catchment interventions) varied markedly depending on the physical properties of individual gullies. Furthermore, the degree of variation was intervention specific, with the relative reduction in the sediment yield varying by a factor of 1.8 in the instance of rock check dams through to a factor of 17 in the instance of battering and vegetating gully heads. Site-specific reductions of the sediment yield to each intervention thus resulted in unique rankings of effectiveness for each intervention option, providing insight into the potential benefits of different management arrangements at the different locations. The orderings for each site were insensitive to erosion resistance across the range of values explored. Thus, while the net benefits of management at these sites, as simulated by MERGE, varies markedly for different erosion resistance values, improved data on the site-specific erosion resistance is unlikely to result in different decisions as to on-ground management, and is therefore of limited benefit. Exploring a broader parameter range could therefore precede costly on-ground studies to better target these studies. These results demonstrate the ability of MERGE to identify and tailor the most effective intervention strategies for a given gully, providing an underpinning basis for decision making for gully managers.
Reductions in the sediment yield resulting from interventions applied in isolation or combination in our study ranged within 2.3–78.9%, comparable to the 12–94% range reported in a review by Bartley et al. (2020). Of the interventions applied in isolation, however, reductions in sediment yield in our study ranged within 2.3–57.8%; and in rock check dams, in particular, reductions in our study ranged within 12.6–24.4%, which is at the lower end of the 2–99% range reported across a suite of studies (e.g. Nyssen et al. 2006; Boix-Fayos et al. 2008; Bellin et al. 2011; Guo et al. 2018; Zhang et al. 2019). The minimal effectiveness of battering and vegetating at Riverside South gully is consistent with the least effective vegetation treatments in studies by Guo et al. (2018) and Zhang et al. (2019) in the Loess Plateau, China. The relative reduction in the sediment yield resulting from the catchment-based intervention of reduction in inflow was approximately proportional to the inflow reduction, with minimal variation across gullies. The relative reduction in sediment yield resulting from each in-gully intervention varied markedly depending on the physical properties of individual gullies, with the variation specific to the intervention. Thus our findings not only demonstrate that modelling of intervention outcomes using MERGE is in alignment with that quantified on-ground, but indicates that efficiency of any one intervention in reducing the sediment yield is highly variable and inextricably linked to the physical and biogeochemical properties of the gully in question (Bartley et al. 2020).
The sediment yield reductions from multiple interventions modelled in this study are similar in magnitude to reported ranges from on-ground measurements at a variety of gullies across the globe applying similar interventions. Reductions in the sediment yield resulting from the most effective intervention pairings were greater than those resulting from the most effective intervention applied in isolation, with a considerable benefit of a second intervention in certain gullies (i.e. increase by a factor >1.34) but small in others (i.e. increase by a factor of <1.14). These results compare well with those from a variety of studies reviewed, and demonstrate that the greatest benefits can be achieved using multiple interventions (e.g. Kuhnle et al. 2008; Nyssen et al. 2008; Garbrecht and Starks 2009; Bartley et al. 2020). Further, the reduction in sediment yield of 56.1–62.2% resulting from the combination of catchment works and the implementation of a rock check dam in our study compares well to the 60–75% reduction resulting from vegetation restoration and check dams (with terracing) in two studies in China (Chen and Cai 2006; Ran et al. 2008).
Limitations
Representing the various interventions in MERGE required assumptions about how these actions change physical parameters and processes within the model. While some of these processes are extensively studied, such as the effect of vegetation on the Manning’s roughness coefficient, further investigation and field-based validation is recommended. First, in the instance of modelling the effect of rock chutes, net deposition and entrainment within the intervention is assumed to be zero. While this provides a conservative representation of the intent of rock chutes, being to provide a non-erosive barrier to prevent erosion of the underlying soil, more complex interactions can occur. Net deposition, and hence the development of a depositional layer, will occur under some conditions. Furthermore, the chutes can alter the flow, increasing or decreasing the velocity and hence increasing or decreasing the erosive power and the ability for net deposition. Second, vegetation effects on roughness are specific to different vegetation species, the effective cover, and how well they establish on the floor and walls. Improved understanding of species commonly used in different geographies would improve modelling. Furthermore, in modelling the effect of battering and vegetation of gully heads and rock check dams, which are modelled by increasing the Manning’s roughness coefficient, the depth of flow is assumed to be unchanged, with roughness only affecting the flow velocity. Moreover, the effects of obstructions in the flow are assumed to be localised, with no effect of the flow down-gully of the obstruction. Further research is required to understand how obstructions in the flow should best be represented in MERGE and how flow volume (depth) and velocity interact with the channel roughness. Increasing vegetation cover would be expected to increase attributes below ground such as root length, density, and network (e.g. Stokes et al. 2014; Vannoppen et al. 2015), which act to hold the soil together, reducing erosion. The representation of vegetation cover in the model can be considered conservative, as only the effects of vegetation on flow velocity are captured, neglecting the effects on erosion resistance, which are expected to further reduce sediment yield (Roberts 2020). Further research is required to provide clear guidance on how to modify the erosion resistance parameter (J) to more comprehensively model the benefits of vegetation in different soil types. GULTEM (Sidorchuk 1999), an alternative gully erosion model, adopts an exponential function to model the effect of roots on soil cohesion (i.e. erosion resistance), with bulk soil cohesion increasing according to exp(0.05R), where R (kg/m3) is the thin root content in the top 5 cm of soil. This approach should be explored as a possible way forward for MERGE. Third, our modelling assumes that interventions work and are maintained. For example, a rock check dam applied in the model will work irrespective of the hydraulic flux, while on-ground the same rock check dam may fail at a certain hydraulic flux; revegetation projects are assumed to maintain the higher vegetation cover during the wet season across multiple years (otherwise the benefit is short lived) yet revegetation projects are not practical in all locations without extensive ongoing maintenance. There are socioeconomic considerations as well as environmental variables that are important to ongoing performance, and model results must be interpreted within the context of these factors.
These limitations must however be balanced against the advantages of the model. Implicit assumptions, such as how the age of a gully affects erosion, are unnecessary since the causes of these observations, namely a reducing catchment area and/or erosion into different soil types, are directly represented within the model. Furthermore, the simplicity with which model parameters can be changed, together with the low computational cost of model runs, makes MERGE naturally suited to Monte-Carlo style investigations that are well suited to assessment of uncertainty. A decision maker or modeller can therefore explore the feasible parameter space and identify thresholds for when different decisions would be made, providing confidence in the decision process even with parameter uncertainty. Broader uptake of the model and continued improvement, especially in terms of how different interventions are represented, will further minimise the above mentioned limitations.
Implications for resource managers
Natural resource management (NRM) professionals are faced with the difficult task of determining how best to invest and allocate their limited resources to a wide array of environmental challenges. To meet these challenges, each investment decision is typically stress tested and prioritised. Unfortunately, the effectiveness of gully erosion interventions is seldom monitored beyond success or failure to control head cut, and thus effectiveness is rarely quantified. Calculating the cost-effectiveness of a given intervention is therefore difficult (Bernhardt et al. 2005). Critically, results derived from MERGE in our study demonstrated a clear method to quantify site-specific differences in the reduction of sediment yield from each intervention and thus provide a clear ranking of the most effective intervention(s) for each site, together with the relative benefits of the different approaches. MERGE provides NRM professionals with a tool to readily identify and quantify the expected reduction in erosion for a given site. As such, MERGE has the ability to provide clarity over whether gully rehabilitation in a given gully should focus on catchment works or in-gully works, a highly contestable debate in and of itself (Bartley et al. 2020), and to identify specific interventions that result in the greatest reduction in sediment yield at a given site. Thus, decision makers have the ability to assess the efficiency and cost-effectiveness of interventions.
When identifying potential solutions for addressing gully erosion, NRM professionals consider a wide range of factors. With most gully erosion works occurring on private property, landholder engagement and co-investment, for both construction and maintenance, must be considered together with the likelihood of achieving upstream catchment management changes such as increasing ground and canopy cover. Maintenance requirements also influence decisions, for example in south-east Queensland initial establishment of vetiver requires a 1–2 year minimum maintenance period and native vegetation requires a minimum 3–5 year maintenance period. If funding options or landholder appetite/capacity are insufficient for adequate maintenance then the feasibility increases for lower-maintenance options such as rock check dams and rock chutes.
Feasibility of delivering a solution, regulations, and impacts on commercial activity must also be considered. The risks of causing further erosion, commonly seen with poorly designed outfalls from diversion banks, or machinery access restrictions for example due to the height of vegetation cover may preclude engineering options. Blocking fish migration passage would trigger regulations and permit requirements, while space for appropriate vegetation buffers may face resistance from the landholders’ adjacent commercial operations.
Risk of failure, return on investment, and assessment of risk also influence the chosen gully rehabilitation options. Lower cost engineering structures designed for 1:20 Annual Exceedance Probability (AEP) are more prone to failure than structures designed for 1:50 or 1:100 AEP, though at a significantly higher cost. On a practical level, it is likely that any design solution will, at some point, receive an event that exceeds design capacity, and thus repair costs must also be considered. The likelihood of failure combined with the cost of repair provides an indication of resilience. If this results in catastrophic failure of the structure and the subsequent repair cost incurred is similar to the initial construction costs, the resilience of that solution is low. The NRM professionals directly or indirectly take these factors into consideration when designing a gully erosion solution.
Future research
Our study revealed certain aspects of the model construction that could benefit from further research. Firstly, MERGE cannot model scenarios where the water depth overtops the depth of the gully head or channel in a given section. Including the floodplain area within the model domain would circumvent this issue. Secondly, model simulations revealed the expected effects of a reduction of flow on energy dissipation down-gully of interventions were not well captured. For example, the sediment yield evaluated at the foot of a rock chute or rock check dam was higher than anticipated, indicating a lesser effect of the intervention. This result highlights that interventions that function by reducing flow velocity (c.f. flow volume) are likely conservative for erosion reduction estimates. Further exploration is required to determine how best to model such interventions. Roberts (2020) illustrates an alternative approach that could address this limitation, by incorporating a decay term for the flow velocity after an obstruction.
MERGE is known to be sensitive to the erosion resistance value, as well as the global carrying capacity (C*) and power proportion (k) (Bennett et al. 2023). Our study highlighted the sensitivity of gully erosion to erosion resistance, reflected in the erosion resistance parameter (J), whereby gully erosion varies considerably according to this user-defined erosion resistance parameter (J; 10–2560 in the present study). Although this variation did not result in a different ordering of interventions in terms of their effectiveness in reducing sediment yield, it does limit the application of MERGE to support cost-benefit analysis across multiple sites. Use of historical records of erosion to constrain J values, possibly relating them to different soil types, would be useful. Reducing uncertainty in the erosion resistance parameter will reduce uncertainty in model outputs, promote confidence in the model, and ensure it is more accessible to decision makers. Observations of gully erosion, particularly at the event scale, are challenging, which limits the amount of data available to constrain the erosion resistance parameter. However, remote sensing provides avenues to improve the spatial cover and frequency of observations, thereby filling this data gap.
MERGE introduces numerous simplifications that warrant further research to understand potential effects on intervention effectiveness. Subsurface water is known to accelerate gully headcut retreat, contributing to bank collapse (Yibeltal et al. 2021); however, MERGE is unable to incorporate this information. Furthermore, the gully morphology is reduced to one-dimensional head and channel sections, neglecting effects from varied bank slopes including bank failure and collapse. Incorporating mass collapse within MERGE would improve sediment loss estimates, and better represent the effectiveness of bank stabilisation methods. The approach used in CONCEPTS could provide a way forward.
Conclusion
This study applied the process-based gully erosion model MERGE to assess the performance of a suite of gully erosion management interventions across three different classical gullies. The simulated relative reduction in the sediment yield resulting from each in-gully intervention varied markedly depending on the physical properties of each gully and the placement of the intervention. Site-specific differences in the reduction of sediment yield from each intervention gave a ranking of the most effective intervention(s) unique to each site. Reductions in sediment yield from combining interventions were greater than those from comparable interventions applied in isolation, however, minimal in other gullies. These results demonstrate the ability of a gully erosion model like MERGE to be useful in identifying and tailoring the most effective intervention strategies for a given gully, and guide decision making for gully management.
Declaration of funding
This project received funding from the Queensland Government through the Queensland Water Modelling Network. MJP received salary support from the Queensland Water Modelling Network. MER received salary and travel support from the Queensland Water Modelling Network.
References
Adame MF, Roberts ME, Hamilton DP, Ndehedehe CE, Reis V, Lu J, Griffiths M, Curwen G, Ronan M (2019) Tropical coastal wetlands ameliorate nitrogen export during floods. Frontiers in Marine Science 6, 671.
| Crossref | Google Scholar |
Addisie MB, Ayele GK, Gessesse AA, Tilahun SA, Moges MM, Zegeye AD, Mekuria W, Schmitter P, Langendoen EJ, Steenhuis TS (2016) Rehabilitating gullies with low cost methods, in the sub humid Ethiopian highlands. Technical report. Available at https://publications.iwmi.org/pdf/H047636.pdf
Alonso CV, Bennett SJ, Stein OR (2002) Predicting head cut erosion and migration in concentrated flows typical of upland areas. Water Resources Research 38, 39–1-39–15.
| Crossref | Google Scholar |
Bartley R, Poesen J, Wilkinson S, Vanmaercke M (2020) A review of the magnitude and response times for sediment yield reductions following the rehabilitation of gullied landscapes. Earth Surface Processes and Landforms 45, 3250-3279.
| Crossref | Google Scholar |
Bellin N, Vanacker V, van Wesemael B, Solé-Benet A, Bakker MM (2011) Natural and anthropogenic controls on soil erosion in the Internal Betic Cordillera (southeast Spain). CATENA 87, 190-200.
| Crossref | Google Scholar |
Bennett FR, Singh A, Roberts ME (2023) Parameter sensitivity analysis of the MERGE quasi-steady state gully erosion model. In ‘MODSIM2023, 25th International Congress on Modelling and Simulation’. (Modelling and Simulation Society of Australia and New Zealand) https://doi.org/10.36334/modsim.2023.bennett128
Bernhardt ES, Palmer MA, Allan JD, Alexander G, Barnas K, Brooks S, Carr J, Clayton S, Dahm C, Follstad-Shah J, Galat D, Gloss S, Goodwin P, Hart D, Hassett B, Jenkinson R, Katz S, Kondolf GM, Lake PS, Lave R, Meyer JL, O’Donnell TK, Pagano L, Powell B, Sudduth E (2005) Synthesizing U.S. river restoration efforts. Science 308, 636-637.
| Crossref | Google Scholar | PubMed |
Boix-Fayos C, de Vente J, Martinez-Mena M, Barberá GG, Castillo V (2008) The impact of land use change and check-dams on catchment sediment yield. Hydrological Processes 22, 4922-4935.
| Crossref | Google Scholar |
Bureau of Meterology (2022) Daily rainfall Amberley (DNRM) TM. Station number 40816, product code IDCJAC0009 reference: 89383337. Available at https://www.bom.gov.au/climate/data/ [Accessed 19 September 2022]
Calero JAG, Krása J, Quinton JN, Klik A, Castiel EF, Intrigliolo DS, Chen L, Strauss P, Yun X, Dostál T (2021) Best management practices for optimized use of soil and water in agriculture. Technical report. (CSIC – Instituto de Agricultura Sostenible (IAS)) doi:10.20350/digitalCSIC/13964
Castillo C, Gómez JA (2016) A century of gully erosion research: urgency, complexity and study approaches. Earth-Science Reviews 160, 300-319.
| Crossref | Google Scholar |
Chen H, Cai Q (2006) Impact of hillslope vegetation restoration on gully erosion induced sediment yield. Science in China Series D 49, 176-192.
| Crossref | Google Scholar |
Cuddington K, Fortin M-J, Gerber LR, Hastings A, Liebhold A, O’Connor M, Ray C (2013) Process-based models are required to manage ecological systems in a changing world. Ecosphere 4, 1-12.
| Crossref | Google Scholar |
Ellis RJ (2018) Dynamic SedNet component model reference guide: update 2017. Technical report. (Queensland Department of Environment and Science) Available at https://www.publications.qld.gov.au/ckan-publications-attachments-prod/resources/99660005-afff-4b56-9639-6a9336332eec/dynamicsednet_referenceguide_2017.pdf
Frankl A, Nyssen J, Vanmaercke M, Poesen J (2021) Gully prevention and control: techniques, failures and effectiveness. Earth Surface Processes and Landforms 46, 220-238.
| Crossref | Google Scholar |
Garbrecht JD, Starks PJ (2009) Watershed sediment yield reduction through soil conservation in a West-Central Oklahoma watershed. Ecohydrology 2, 313-320.
| Crossref | Google Scholar |
Gomez B, Banbury K, Marden M, Trustrum NA, Peacock DH, Hoskin PJ (2003) Gully erosion and sediment production: Te Weraroa Stream, New Zealand. Water Resources Research 39, 1187.
| Crossref | Google Scholar |
Guo M, Wang W, Kang H, Yang B (2018) Changes in soil properties and erodibility of gully heads induced by vegetation restoration on the Loess Plateau, China. Journal of Arid Land 10, 712-725.
| Crossref | Google Scholar |
Hamilton DP, Salmaso N, Paerl HW (2016) Mitigating harmful cyanobacterial blooms: strategies for control of nitrogen and phosphorus loads. Aquatic Ecology 50, 351-366.
| Crossref | Google Scholar |
Hancock GR, Evans KG, Willgoose GR, Moliere DR, Saynor MJ, Loch RJ (2000) Medium-term erosion simulation of an abandoned mine site using the SIBERIA landscape evolution model. Soil Research 38, 249.
| Crossref | Google Scholar |
Haregeweyn N, Tsunekawa A, Nyssen J, Poesen J, Tsubo M, Meshesha DT, Schütt B, Adgo E, Tegegne F (2015) Soil erosion and conservation in Ethiopia: a review. Progress in Physical Geography: Earth and Environment 39, 750-774.
| Crossref | Google Scholar |
Hartman BD, Bookhagen B, Chadwick OA (2016) The effects of check dams and other erosion control structures on the restoration of Andean bofedal ecosystems. Restoration Ecology 24, 761-772.
| Crossref | Google Scholar |
Hunt LP, McIvor JG, Grice AC, Bray SG (2014) Principles and guidelines for managing cattle grazing in the grazing lands of northern Australia: stocking rates, pasture resting, prescribed fire, paddock size and water points – a review. The Rangeland Journal 36, 105.
| Crossref | Google Scholar |
Kavehei E, Roberts ME, Cadier C, Griffiths M, Argent S, Hamilton DP, Lu J, Bayley M, Adame MF (2021) Nitrogen processing by treatment wetlands in a tropical catchment dominated by agricultural landuse. Marine Pollution Bulletin 172, 112800.
| Crossref | Google Scholar | PubMed |
Koci J, Wilkinson SN, Hawdon AA, Kinsey-Henderson AE, Bartley R, Goodwin NR (2021) Rehabilitation effects on gully sediment yields and vegetation in a savanna rangeland. Earth Surface Processes and Landforms 46, 1007-1025.
| Crossref | Google Scholar |
Kuhnle RA, Bingner RL, Alonso CV, Wilson CG, Simon A (2008) Conservation practice effects on sediment load in the Goodwin Creek Experimental Watershed. Journal of Soil and Water Conservation 63, 496-503.
| Crossref | Google Scholar |
Langendoen EJ, Zegeye AD, Tebebu TY, Steenhuis TS, Ayele GK, Tilahun SA, Ayana EK (2014) Using computer models to design gully erosion control structures for humid northern Ethiopia. In ‘Proceedings of the 11th International Conference on Hydroscience & Engineering’. (Eds R Lehfeldt, R Kopmann) pp. 1137–1146. (Bundesanstalt für Wasserbau) Available at https://www.researchgate.net/profile/Essayas-Ayana/publication/275973144_Using_Computer_Models_to_Design_Gully_Erosion_Control_Structures_for_humid_northern_ethiopia/links/554d6c5808ae12808b34edce/Using-Computer-Models-to-Design-Gully-Erosion-Control-Structures-for-humid-northern-ethiopia.pdf
Lewis SE, Bainbridge ZT, Kuhnert PM, Sherman BS, Henderson B, Dougall C, Cooper M, Brodie JE (2013) Calculating sediment trapping efficiencies for reservoirs in tropical settings: a case study from the Burdekin Falls Dam, NE Australia. Water Resources Research 49, 1017-1029.
| Crossref | Google Scholar |
Nkonya E, Anderson W, Kato E, Koo J, Mirzabaev A, von Braun J, Meyer S (2016) Global cost of land degradation. In ‘Economics of land degradation and improvement – a global assessment for sustainable development’. (Eds E Nkonya, A Mirzabaev, J von Braun) pp. 117–165. (Springer International Publishing) doi:10.1007/978-3-319-19168-3_6
Nyssen J, Poesen J, Veyret-Picot M, Moeyersons J, Haile M, Deckers J, Dewit J, Naudts J, Teka K, Govers G (2006) Assessment of gully erosion rates through interviews and measurements: a case study from northern Ethiopia. Earth Surface Processes and Landforms 31, 167-185.
| Crossref | Google Scholar |
Nyssen J, Poesen J, Descheemaeker K, Haregeweyn N, Haile M, Moeyersons J, Frankl A, Govers G, Munro N, Deckers J (2008) Effects of region-wide soil and water conservation in semi-arid areas: the case of northern Ethiopia. Zeitschrift für Geomorphologie 52, 291-315.
| Crossref | Google Scholar |
Poesen J, Nachtergaele J, Verstraeten G, Valentin C (2003) Gully erosion and environmental change: importance and research needs. CATENA 50, 91-133.
| Crossref | Google Scholar |
Prentice MJ, Waud MW, Hamilton DP, Roberts ME (2021) Assessing performance of the MERGE model for simulating gully interventions. In ‘24th International Congress on Modelling and Simulation, Sydney, NSW, Australia, 5 to 10 December’. (Eds RW Vervoort, AA Voinov, JP Evans, L Marshall) pp. 729–735. (Modelling and Simulation Society of Australia and New Zealand Inc.) doi:10.36334/modsim.2021.L4.prentice
Prosser IP (2018) Improving how gully erosion and river sediment transport processes are represented in Queensland catchment models. (Department of Environment and Science) Available at https://science.des.qld.gov.au/__data/assets/pdf_file/0030/80787/qwmn-gully-erosion-processes-report.pdf
Quiñonero-Rubio JM, Nadeu E, Boix-Fayos C, de Vente J (2016) Evaluation of the effectiveness of forest restoration and check-dams to reduce catchment sediment yield. Land Degradation & Development 27, 1018-1031.
| Crossref | Google Scholar |
Ran D-C, Luo Q-H, Zhou Z-H, Wang G-Q, Zhang X-H (2008) Sediment retention by check dams in the Hekouzhen-Longmen Section of the Yellow River. International Journal of Sediment Research 23, 159-166.
| Crossref | Google Scholar |
Rey F (2003) Influence of vegetation distribution on sediment yield in forested marly gullies. CATENA 50, 549-562.
| Crossref | Google Scholar |
Roberts ME (2020) MERGE: modelling erosion resistance for gully erosion – a process-based model of erosion from an idealised linear gully. Soil Research 58, 576-591.
| Crossref | Google Scholar |
Roberts M (2022) Regional pilot application of the MERGE gully erosion model. Technical report. Report to Queensland Water Modelling Network. (Department of Environment and Science) Available at https://science.des.qld.gov.au/__data/assets/pdf_file/0022/285052/QWMN-MERGE-Regional-Pilot-Final-Report.pdf
Roberts ME, Roots K (2023) Porous check dams and the MERGE gully erosion model. In ‘MODSIM2023, 25th International Congress on Modelling and Simulation’. (Eds J Vaze, C Chilcott, L Hutley, S Cuddy). (Modelling and Simulation Society of Australia and New Zealand) doi:10.36334/modsim.2023.roberts
Roberts ME, Burrows RM, Thwaites RN, Hamilton DP (2022) Modelling classical gullies – a review. Geomorphology 407, 108216.
| Crossref | Google Scholar |
Rose CW, Yu B, Ward DP, Saxton NE, Olley JM, Tews EK (2014) The erosive growth of hillside gullies. Earth Surface Processes and Landforms 39, 1989-2001.
| Crossref | Google Scholar |
Rust S, Star M (2017) The cost effectiveness of remediating erosion gullies: a case study in the Fitzroy. Australasian Journal of Environmental Management 25, 233-247.
| Crossref | Google Scholar |
Sidorchuk A (1999) Dynamic and static models of gully erosion. CATENA 37, 401-414.
| Crossref | Google Scholar |
Stokes A, Douglas GB, Fourcaud T, Giadrossich F, Gillies C, Hubble T, Kim JH, Loades KW, Mao Z, McIvor IR, Mickovski SB, Mitchell S, Osman N, Phillips C, Poesen J, Polster D, Preti F, Raymond P, Rey F, Schwarz M, Walker LR (2014) Ecological mitigation of hillslope instability: ten key issues facing researchers and practitioners. Plant and Soil 377, 1-23.
| Crossref | Google Scholar |
Streeter MT, Schilling KE, Burras CL, Wolter CF (2021) Erosion and sediment delivery in southern Iowa watersheds: implications for conservation planning. Journal of Soil and Water Conservation 76, 103-115.
| Crossref | Google Scholar |
Valentin C, Poesen J, Li Y (2005) Gully erosion: impacts, factors and control. CATENA 63, 132-153.
| Crossref | Google Scholar |
Vannoppen W, Vanmaercke M, De Baets S, Poesen J (2015) A review of the mechanical effects of plant roots on concentrated flow erosion rates. Earth-Science Reviews 150, 666-678.
| Crossref | Google Scholar |
Yibeltal M, Tsunekawa A, Haregeweyn N, Adgo E, Meshesha DT, Masunaga T, Tsubo M, Billi P, Ebabu K, Berihun ML (2021) Effect of subsurface water level on gully headcut retreat in tropical highlands of ethiopia. Earth Surface Processes and Landforms 46, 1209-1222.
| Crossref | Google Scholar |
Yitbarek TW, Belliethathan S, Stringer LC (2010) The onsite cost of gully erosion and cost-benefit of gully rehabilitation: a case study in ethiopia. Land Degradation & Development 23, 157-166.
| Crossref | Google Scholar |
Zhang B-J, Zhang G-H, Zhu P-Z, Yang H-Y (2019) Temporal variations in soil erodibility indicators of vegetation-restored steep gully slopes on the loess plateau of china. Agriculture, Ecosystems & Environment 286, 106661.
| Crossref | Google Scholar |