

The spatial and temporal variability and influence factor analysis of soil erosion in a grass farming area: a case study in central China
Zijing Xue A B # , Xiaohuang Liu C D # , Mamat Sawut A E F * , Jiufen Liu C D , Xiaofeng Zhao C D , Liyuan Xing C D , Ran Wang C D , Xinping Luo C D , Chao Wang D , Honghui Zhao D and Ying Wang B
A
B
C
D
E
F
Handling Editor: Claudio Bini
Abstract
Analysing soil erosion has important research significance for the protection of the ecological environment and the prevention and control measures of soil erosion.
This paper aims to discuss the soil erosion degree in the warm temperate grass farming subregion of the southern Shanxi and Guanzhong Basin, China, based on Universal Soil Loss Model, RUSLE.
The soil erosion modulus from 1998 to 2020 of the study area was calculated and divided into five periods: 2000, 2005, 2010, 2015, and 2020.
We highlight two key findings: (1) the average soil erosion modulus changed from 498.86 t km−2 a−1 in 2000 to 316.94 t km−2 a−1 in 2020, and the proportion of soil area with an unchanged erosion degree is above 85%; (2) the average annual erosion area is the largest when rainfall is greater than 550 mm and less than 620 mm. From 2000 to 2020, the area of cultivated land decreased by 3497.47 km2, and the area of grassland increased by 1364.96 km2. The degree of erosion of grassland is the most severe, with soil erosion is most intense when the Normalised Vegetation Index (NDVI) is greater than 0.55 and less than 0.75.
The results show that the soil erosion in this area is slight on the whole and its degree has been decreasing.
The analysis in this paper can elucidate the seriousness of the soil erosion problem so that the government can strengthen the key management of soil and water conservation and achieve the purpose of reducing soil erosion.
Keywords: a case study in central China, influence factor analysis, RUSLE model, soil degradation, soil erosion, Southern Shanxi and Guanzhong Basin, spatial analysis, temporal analysis.
Introduction
Soil erosion is a phenomenon described by a loss of surface soil by external forces (Nigel and Rughooputh 2010). It is currently an important ecological issue of great concern in China (Cheng 2019; Kong 2019; Mu et al. 2022) and worldwide (Mekuria 2022; Wedajo et al. 2022; Rao et al. 2023). For example, Mu et al. (2022) studied soil erosion on the Loess Plateau in China, and Mekuria (2022) explored soil erosion in the Gojeb watershed in Ethiopia. We learned from Shaanxi Provincial Soil and Water Conservation Ecological Environment Monitoring Center (2022) that there was a total of 2 674 200 km2 of soil erosion in China in that year, with hydraulic erosion accounting for 41.35% of all erosion types, thereby constituting the second most important factor in soil erosion.
Soil erosion can cause ecological problems such as land degradation (Mirzabaev et al. 2023), soil loss (Jones et al. 2022), and soil salinisation (Zhang et al. 2022a). This combination of natural changes and human activities can pose a major threat to the development of human society and the survival of the species. Soil erosion includes several types, such as wind erosion (Merrill et al. 2022), hydraulic erosion (Podhrazska et al. 2022), gravitational erosion (Guo et al. 2020), and freeze–thaw erosion (Zhang et al. 2021a). These erosion types exert especially serious impacts on areas with complex topography (Suo 2021) and fragile ecological environments (Sun et al. 2022). These erosional modes have become key constraints to regional ecological development, so this study is important to regional sustainable development and ecological security.
Current models used to study soil erosion include the revised Universal Soil Loss Model, RUSLE, a modified version of the USLE model (Renard et al. 1997), and the Chinese Soil Loss Equation CSLE (Liu et al. 2001). Scholars have combined soil loss equations with geoinformation and remote sensing (Xu 2022; Yin et al. 2022) to analyse the extent of soil erosion in a region by efficiently managing, analysing, processing, and comparing large amounts of data. The soil erosion equation (RUSLE) model (Nigel and Rughooputh 2012) is the most widely used model in China and internationally. It is based on the USLE and has the advantages of a rational structure, a simple methodology, and wide applicability. The model has been used in over a hundred countries and regions to predict soil erosion (Zheng et al. 2001), prioritising the earth’s soils and the ecological environment subject to soil erosion. In the 1970s, the US Department of Agriculture (USDA) developed the Universal Soil Loss Equation (USLE) based on the five main factors of rainfall erosivity (R), soil erodibility (K), topography (LS), vegetation cover (C) and soil and water conservation management practices (P). The model was revised in 1978 to address its problems (Wischmeier and Smith 1978). Since then, the USLE model has shown some limitations as scholars’ understanding of soil erosion has gradually increased. Consequently, the US Soil Conservation Service finally developed a modified version of the RUSLE model in 1997 (Renard et al. 1997). Since the 1990s, Chinese scholars have developed a few empirical erosion models based on the USLE model. Among the more representative are the soil forecasting model of Jiang et al. (1996) for shallow gully and bare-ground slopes and the CSLE model for Chinese soil erosion equations (Liu et al. 2001).
Soil erosion is currently studied in China and abroad mainly by analysing its impact factors (Hu 2016; Gao et al. 2022; Xu 2022; Yin et al. 2022; Zhang et al. 2022b) and spatial and temporal variability characteristics (Fang et al. 2015; Guo et al. 2021; Yao et al. 2021; Alsafadi et al. 2022; Wang et al. 2022). Some scholars analyse soil erosion degree by combining the influence factors and soil erosion (Hu 2016; Gao et al. 2022; Xu 2022; Yin et al. 2022; Zhang et al. 2022b). Hu (2016) used RUSLE to focus on the changes in R and C factors as the analysis of soil erosion changes on the Loess Plateau. Gao et al. (2022) quantified land use changes and soil erosion characteristics in Chongqing based on RUSLE and GIS spatial analysis. Other scholars used the spatial and temporal changes of soil erosion to describe its erosion degree (Fang et al. 2015; Guo et al. 2021; Yao et al. 2021; Alsafadi et al. 2022; Wang et al. 2023). Fang et al. (2015) combined RUSLE with GIS and RS to analyse the spatial distribution characteristics of soil erosion in the Lhasa River basin in 2010. Yao et al. (2021) analysed the spatial and temporal variability of soil erosion degree based on RUSLE as well as the spatial overlay function and linear regression equation.
The topography of the southern Shanxi and Guanzhong Basin (hereafter referred to as SSGB) regions of China is relatively flat, and its soil erosion is less influenced by topography but more influenced by the monsoon climate and precipitation. The area has also been subjected to many years of intensive agricultural development, with a large amount of forested and cultivated land; thus, erosion is present in the area according to the land use type. Therefore, the analysis of rainfall, land use types, and vegetation cover is of great importance for soil control in the area. Zhao (2014) has presented an overview of soil erosion, including the south-western Shanxi region, in his ecological vulnerability assessment; Zhao et al. (2022) have analysed the drivers of soil erosion change in a sub-regional context, including the Guanzhong region. Many scholars have analysed the spatial and temporal characteristics and impact factors of soil erosion on the Loess Plateau (Jiang et al. 1996; Hu 2016; Guo et al. 2020). Still, no scholars have yet done so by subdividing the region into zones. Therefore, it is necessary to analyse the spatial and temporal variability of soil erosion and the impact factors in each regional area by dividing the area into zones.
In this study, ArcGIS is used to calculate six factors for the study area based on RUSLE to estimate the area’s soil erosion modulus in five periods from 1998 to 2020. The spatial and temporal characteristics of soil erosion in the area are then exploed by dividing it into secondary zones. Finally, the extent to which rainfall, land use type, and Normalised Vegetation Index (NDVI) affect soil erosion is discussed separately. Overall, this paper explores the extent of soil erosion by analysing the characteristics of its spatial and temporal variability and influence factors. This study enables the reader to understand the magnitude of the soil erosion problem. It also provides support for soil erosion prevention and management, as well as ecological regulation in the region. Ultimately, the government should be able to strengthen the key management of soil and water conservation to reduce soil erosion.
Overview of the study area
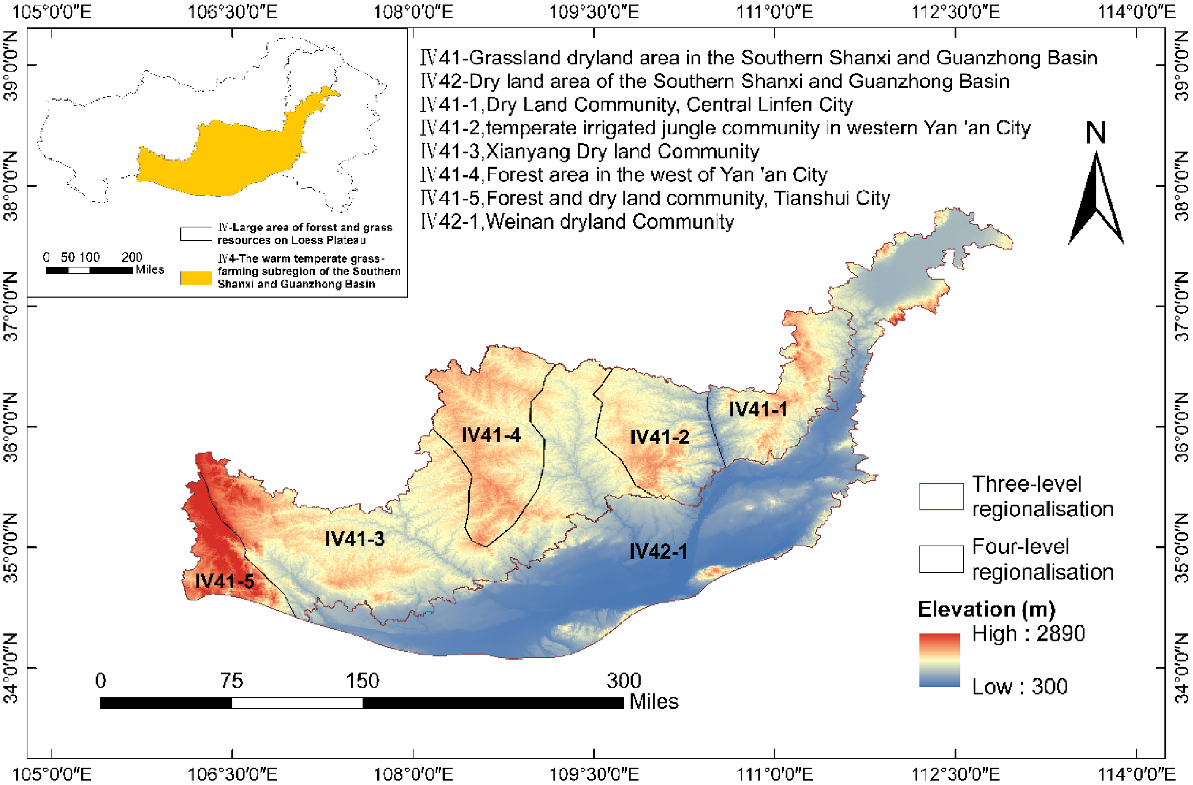
The warm temperate grassland sub-region of the SSGB (34°8′–37°72′N, 106°7′–112°86′E) belongs to the second level of the Loess Plateau Forestry and Grassland Resources Region under the first level of natural resources zoning (Fig. 1) (Zhang et al. 2020a). It is located in the south-central part of the Loess Plateau, spanning four provinces and autonomous regions including Gansu, Ningxia, Shaanxi, and Shanxi. It is bounded to the south by the Qinling Mountains, to the north by the Loess Plateau of northern Shaanxi, and to the east by the Zhongtiao and Taiyue Mountains, through which the Wei River passes. It covers a total area of about 96 500 km2 and has a warm temperate climate. The average annual precipitation is 500–600 mm, mainly in July–September, and the average annual temperature is 12–13.6°C. A line running from north-east to south-west divides the region into dryland areas and grassland-covered dryland areas, showing a topographic feature of high in the north-west and low in the south-east. The north-western part of the region is a dryland-covered grassland area, with natural vegetation dominated by temperate deciduous broad-leaved forests. The south-east is relatively flat and has been used as arable land in recent years, with its crops mainly consisting of cotton and wheat.
Materials and methods
Data sources
The data used in this study include a Digital Elevation Model (DEM), the Normalised Vegetation Index (NDVI), Land Use/Cover Change in China (CNLUCC) (Xu et al. 2018), Precipitation and Soil Texture, and Soil Organic Carbon (Wieder et al. 2014) (Table 1). The raster resampling tool of ArcGIS was used to unify the spatial resolution of the data to 1 km.
| Data type | Data description | Spatial resolution | Data source and Website | |
|---|---|---|---|---|
| Topographic and geomorphic data | Digital elevation model (DEM) | 1 km | The Data Center for Resources and Environmental Sciences, (RESDC) (http://www.resdc.cn) | |
| Land use data | Annual land use Remote sensing monitoring data sets for 2000, 2005, 2015 and 2020 | 1 km | Resource and Environment Science and Data Center (http://www.resdc.cn/DOI) (Xu et al. 2018) | |
| Soil data | Spatial distribution data of soil texture | 1 km | The Data Center for Resources and Environmental Sciences, (RESDC) (http://www.resdc.cn) | |
| Soil organic carbon | 1 km | National Tibetan Plateau/Third Pole Environment Data Center. (http://data.tpdc.ac.cn) (Meng and Wang 2018) | ||
| Vegetation index data | Monthly Normalised Vegetation Index (NDVI) from 1998 to 2020 | 1 km | National Earth System Science Data Center, National Science and Technology Infrastructure of China (http://www.geodata.cn) | |
| Precipitation data | Monthly precipitation data from 1998 to 2020 | 1 km | National Earth System Science Data Center, National Science and Technology Infrastructure of China (http://www.geodata.cn) |
Data analysis methods
First, the soil erosion modulus, as calculated using the RUSLE model, indicates the degree of soil erosion. Second, the soil erosion modulus is divided into six different intensity classes according to the latest Soil Erosion Classification and Grading Standard (SL190–2007) issued by the Ministry of Water Resources. The conversion between these six classes was then used to obtain the conversion between the calculated soil erosion intensities. Finally, this paper adds a field for the conversion between the different intensities to show the strengthening and weakening of the erosion levels. The spatial and temporal variability of soil erosion is analysed by integrating these data.
Combining Precipitation, LUCC (Moisa et al. 2023), and NDVI with soil erosion reveals that as these parameters change over time, so does the degree of soil erosion. The effect of these factors on the degree of soil erosion is used to analyse their relationship with the degree of soil erosion.
Research methodology
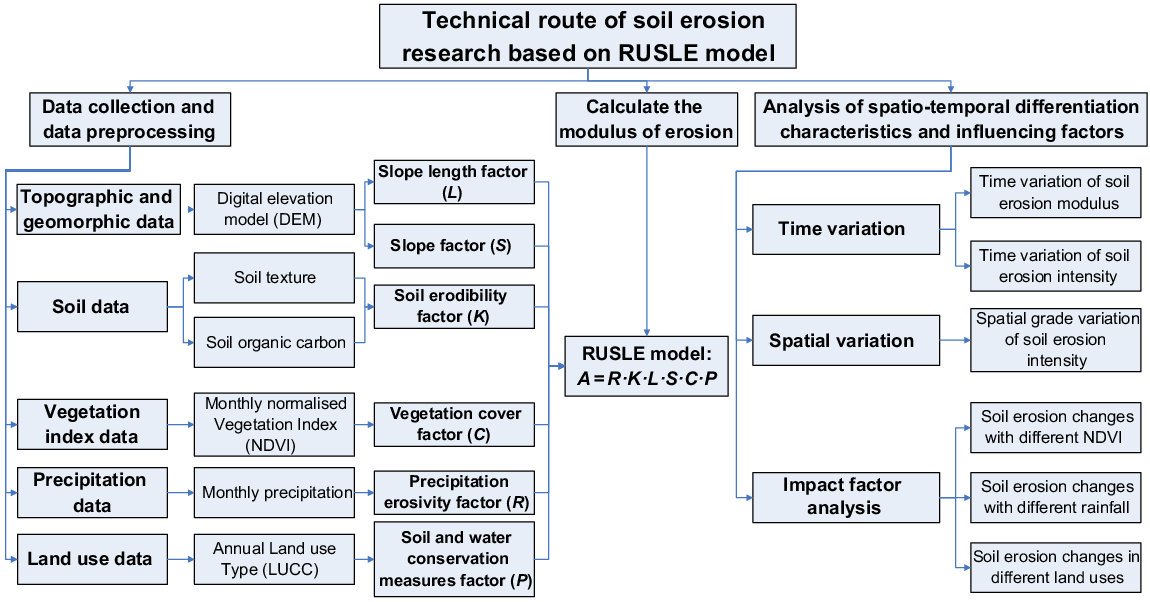
This study uses the soil erosion equation (RUSLE model), which is currently used worldwide. The model is designed to represent the extent of soil erosion in the area by fitting six influence factors to calculate the soil erosion modulus. The technical route of the study is shown in Fig. 2. The soil erosion equation is calculated as follows:
where A denotes the annual average soil erosion modulus of the area in t hm−2 a−1, R denotes the rainfall erosion force factor in MJ mm hm−2 h−1 a−1, K denotes the soil erodibility factor in t h MJ−1 mm−1, L denotes the slope length factor; S denotes the slope factor, C denotes the vegetation cover and management factor, and P denotes the soil and water conservation measure factor.
Precipitation erosivity is related to the amount, intensity, and timing of rainfall as well as the climate and topography of the study area. It is one of the most fundamental dynamical factors in the RUSLE model, reflecting the influence of rainfall on the degree of soil erosion. Consistent with the analysis in this paper, precipitation erosivity is the most dominant and obvious influence factor. According to Zhang and Fu (2003), the precipitation erosivity factor R is calculated as follows:
where P denotes the multi-year average precipitation and R is the multi-year average rainfall erosion force factor.
In addition to being a factor of RUSLE/USLE, the soil erodibility factor is also a basic parameter of models such as EPIC and AGNPS. The erodibility factor is necessary for regional surveys and mapping using the RUSLE model. The higher the K-value, the more susceptible the soil is to erosion. This paper uses the calculation of the K-factor in the evaluation of the EPIC model by Williams et al. (1996), which combines data such as soil texture and organic carbon to derive the K-factor, which is calculated as follows:
where SAN is Sand (sandy soil), SIL is Silt (silty soil), CLA is Clay (clayey soil), and C is soil organic carbon.
In this paper, the hydrological analysis module in ArcGIS is used to extract the flow accumulation by creating a depression-free DEM (Shan et al. 2019) to calculate the slope length factor, which is an acceleration factor for erosion dynamics. It refers to the ratio of soil loss from a slope of a certain slope length to one of a standard slope length, given consistent rainfall, soil, and slope gradient. A modified slope-length factor algorithm (Wischmeier and Smith 1978; McCool et al. 1987; Desmet and Govers 1996) was used, calculated as follows:
where λ is the horizontal projected slope length in metres (m), α is the slope length index, β is the ratio of fine gully erosion to fine inter-gully erosion, and θ is the slope degree (°).
Both the slope length index and slope factor are used to reflect the effect of topography on soil erosion and are collectively referred to as the topography factor. The slope factor is the ratio of soil loss from a slope at an arbitrary value to that at a standard slope while all other conditions are held constant. In this paper, we apply the slope equation of Liu et al. (2001), which is calculated as follows:
The RUSLE model was used to calculate the slope length (L) and slope (S) factors using a digital elevation model (DEM).
The C factor represents the role of vegetation cover and management practices on soil erosion. Among the six factors, C is the most variable and most sensitive to soil erosion and is an important factor for human control of soil. The C factor includes the role of many factors related to vegetation cover, including those above-ground, below-ground, and on the soil surface. According to the algorithm of Tan et al. (2005), the C factor is calculated as follows:
where fc is the percentage of vegetation cover, NDVI is the multi-year average value of normalised vegetation index, and NDVImax and NDVImin are the maximum and minimum values of NDVI in the SSGB, respectively.
The percentage of vegetation cover was first calculated by Eqn 9, followed by the magnitude of the percentage using conditional statements to obtain the vegetation cover and management C factor.
The P-factor is the ratio of soil erosion under a specific soil conservation measure to soil erosion when the plot is ploughed downhill without the measure. The P-factor enables the impact of various soil and water conservation measures on the amount of soil erosion to be effectively assessed. It is considered the most uncertain factor and takes values from 0 to 1. The closer the value to 0, the better the effect, and vice versa. P-values for various land cover types were determined by assigning values to different land use types according to Bai (2010); the corresponding situation is shown in Table 2.
| First order type | Secondary type | P-value | |||
|---|---|---|---|---|---|
| Number | Land use type | Number | Land use type | ||
| 1 | Cultivated land | 11 | Paddy field | 0.01 | |
| 12 | Dry land | 0.55 | |||
| 2 | Forest land | 21 | Forest land | 0.80 | |
| 22 | Shrubbery | 0.80 | |||
| 23 | Dredging land | 0.80 | |||
| 24 | Other forest land | 1.00 | |||
| 3 | Meadow | 31 | High cover grassland | 1.00 | |
| 32 | Medium coverage grassland | 1.00 | |||
| 33 | Low cover grassland | 1.00 | |||
| 4 | Water area | 41 | River channel | 0.00 | |
| 42 | Lake | 0.00 | |||
| 43 | Permanent glacial grassland | 0.00 | |||
| 46 | Beach land | 0.00 | |||
| 5 | Urban and rural, industrial and mining, residential land | 51 | Urban land | 0.00 | |
| 53 | Other construction land | 0.00 | |||
| 6 | Unused land | 61 | Sandy land | 0.06 | |
| 63 | Saline–alkali land | 0.06 | |||
| 64 | Marshland | 0.03 | |||
| 65 | Bare land | 1.00 | |||
Results and analysis
Temporal variation of soil erosion
Fig. 3 shows the change in soil erosion modulus in the SSGB from 1998 to 2020, as calculated using the RUSLE model. As can be seen in the figure, the erosion level as a whole shows a consistent reduction trend. In particular, slight erosion increased from 78% in 2000 to 86.4% in 2020, reflecting an increase of 8.6%. Light, moderate, strong, and very strong erosion decreased by 7.93, 0.39, 0.06, and 0.007%, respectively. From 2000 to 2015, slight erosion has been increasing, and the other modes of erosion intensity are in states of relative reduction. However, from 2015 to 2020, the area of slight erosion decreased, and light, moderate, and strong erosion all demonstrated relative increases, ultimately yielding a slight increase in the soil erosion intensity from 2015 to 2020. The increase in rainfall during this period and the significant increase in grassland area is thought to be the reason for this, resulting in a slight increase in soil erosion compared to 2015. However, there is still a trend toward less soil erosion in 2020 compared to other years.
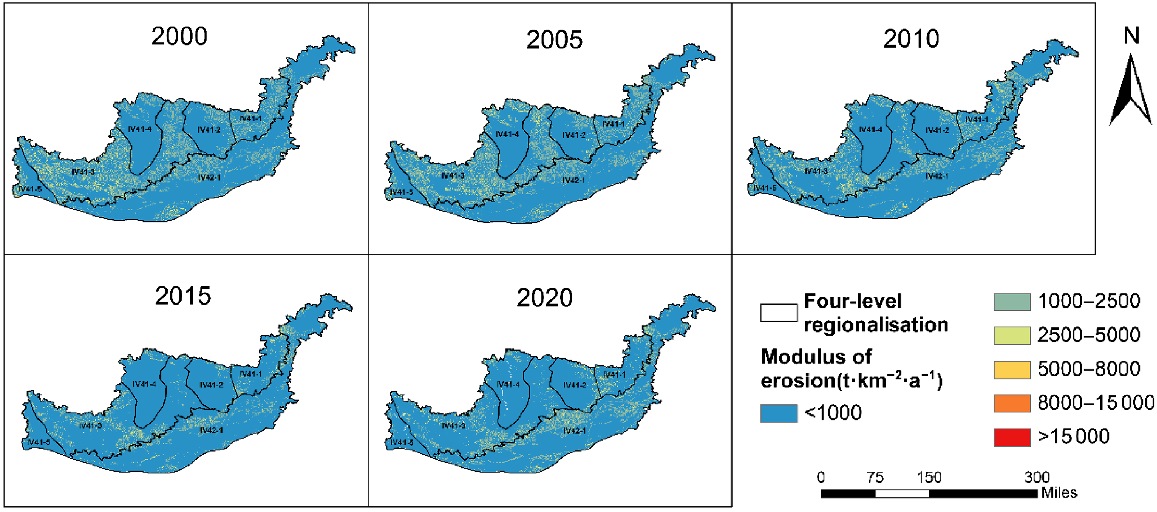
From 1998 to 2020, the erosion of the three plots IV41-5, IV41-2, and IV41-4 is relatively light overall and has been showing a decreasing trend. This is because these three plots are wooded or temperate scrub plots, while the others are dryland plots; thus, they are prone to more erosion than these three plots. From 2015 to 2020, the erosion has increased mainly in plots IV41-1, IV41-2, and IV42-1, due to increased rainfall in these three plots during this period. Although erosion is more severe in several other plots, soil erosion has also continued to decrease over this 23-year period. Compared to the large area of moderate and intense erosion in 2000, the 2020s only feature minor patches.
The shift in soil erosion intensity area over time in the SSGB is in Fig. 4, where it can be seen that in each of the four shifts from 2000 to 2020, there is a shift in soil area from other erosion intensities to slight erosion. It can also be seen that in these four transfers from light, moderate, and strong erosion to slight erosion, the associated percentage has been the lowest from 2000 to 2005 with corresponding transferred areas of 2212.28, 267.23, and 15.72 km2, respectively, while the highest transferred area occurred in 2010–2015 with 5945.81, 1406.18, and 95.25 km2, respectively. The transfer from very strong erosion to all other erosion intensities had its highest transfer ratio from 2015 to 2020.
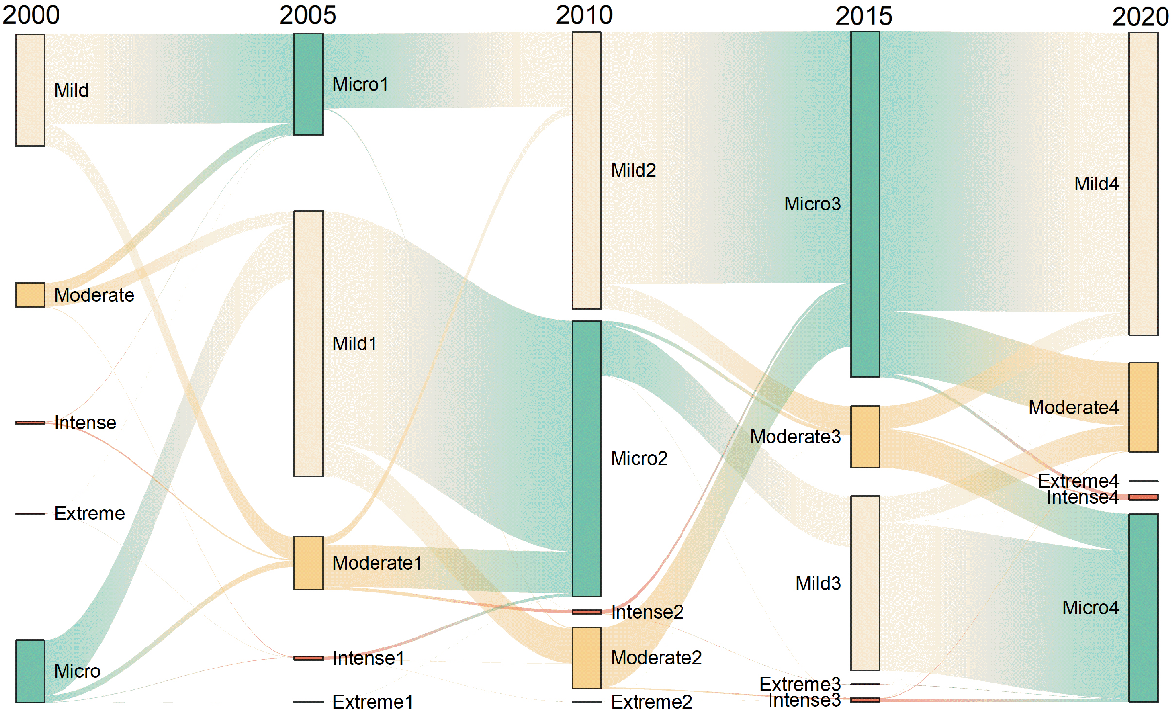
The greatest reduction in soil erosion occurred from 2010 to 2015, and the soil control measures during this period achieved good results. The shift in erosion intensity from 2015 to 2020 is more complex. More area was shifted to light and moderate erosion than to slight erosion, and there were many areas where there was a slight increase in soil erosion. In addition, there was also a high percentage of area shifting from very strong erosion to other erosion. The above analysis indicates that there were also some areas where the degree of soil erosion was significantly mitigated.
Horizontal spatial variation of soil erosion intensity
The grade change and area occupation after grading the soil erosion intensity is in Fig. 5. As can be seen from the figure, most of the grade increases from 2000 to 2005 are distributed in the upper-right corners of IV41-4 and IV41-3, which belong to the land boundaries of Yan’an and Xianyang. From 2005 to 2010, the grade increases are more densely distributed in the southern part of Jinan. From 2010 to 2015, the grade increases are mainly distributed in IV42-1, where there is mainly cultivated land. The grade increases from 2015 to 2020 are more distributed along the boundaries of Jinan, Weinan, and Xianyang. Although the increase in soil erosion intensity grade from 2015 to 2020 is relatively obvious from the graph, this is only a slight increase relative to 2015. As a whole, the erosion level is still in a reduced state.
Changes of soil erosion intensity levels (area proportion) in the SSGB during the period 1998–2020.
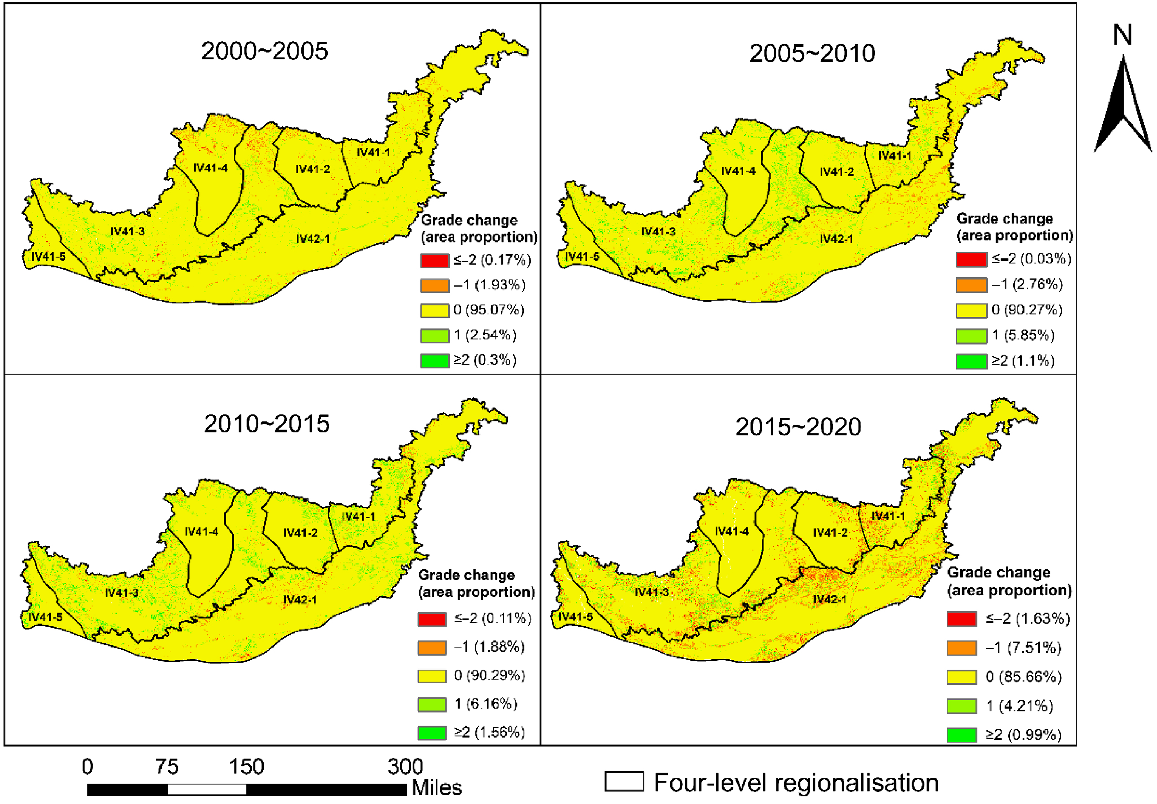
The proportion of soils with constant erosion (class = 0) is above 85%, the proportion of soils with an increase of more than two classes (class ≤ −2) from 2000 to 2015 is always less than 0.2%, and the proportion of soils with a decrease in class (class = 1 and class ≥ 2) is always greater than the proportion of soils with an increase in class (class ≤ −2 and class = −1). The proportion of the area with an increase in rank reached 9.14%. However, as shown in Fig. 3, there is still an overall reduction in the degree of erosion.
Influence factors of soil erosion
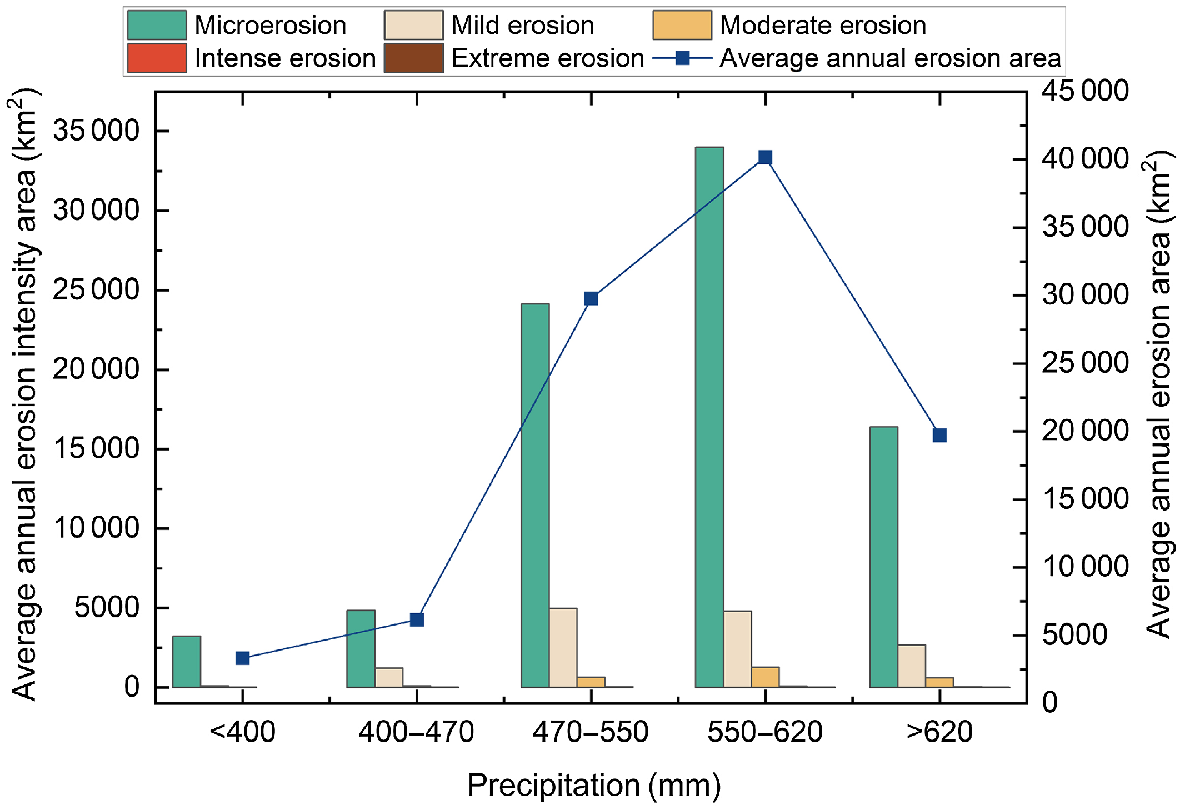
The average annual erosion intensity area, as well as the total average annual erosion area changes at different rainfall levels, are shown in Fig. 6. The maximum erosion area occurs when the rainfall is greater than 550 mm and less than 620 mm, and the minimum erosion area occurs when the rainfall is less than 400 mm. Very strong erosion does not occur until the rainfall reaches 550 mm. Moreover, compared to other levels of rainfall, the proportion of soil area with either moderate and strong or very strong erosion was largest at 3.42 and 3.37% for rainfall greater than 500 mm and less than 620 mm and for rainfall greater than 620 mm, respectively. While the rainfall was less than 400 mm, both strong and very strong erosion were absent, and the proportion of soil area with light and moderate erosion was the smallest. When the rainfall is greater than 620 mm, although the erosion area is not at its largest, the proportion of soil area with moderate and above erosion is also relatively large. The reason for the small erosion area is that the area covered by rainfall greater than 620 mm is small. This means that when the rainfall increases, the degree of soil erosion is likely to increase with it. Thus, it has been proved that the influence of rainfall on the degree of soil erosion is of great concern.
By comparing the land use types from 2000 to 2020, the transfer matrix of soil erosion in the SSGB from 2000 to 2020 is shown in Table 3. From the table, we can see that the area of cultivated land decreased by 3497.47 km2 from 2000 to 2020, and the area of grassland and urban–rural, industrial–mining, and residential land increased by 1364.96 and 2166.35 km2, respectively. The area of forest land and unused land increased to a lesser degree. The increased area of urban–rural, industrial–mining, and residential land indicates that in recent years, people have used much of the land for economic development and construction. The decrease in the area of cultivated land and the increase in the area of grassland indicate that we are aware of the serious soil erosion and the decrease in the yield of cultivated land, so we have implemented the return of cultivated land to forest land to protect and improve the ecological environment.
| Land use/cover change in 2000 (km2) | ||||||||
|---|---|---|---|---|---|---|---|---|
| Cultivated land | Forest land | Meadow | Water area | Urban and rural, industrial and mining, residential land | Unused land | |||
| Land use/cover change in 2020 (km2) | Cultivated land | 28695.15 | 2919.40 | 8050.57 | 543.28 | 2503.72 | 58.97 | |
| Forest land | 3356.34 | 10503.06 | 5088.64 | 47.37 | 120.84 | 8.70 | ||
| Meadow | 9346.90 | 5397.98 | 11908.62 | 196.24 | 360.57 | 13.53 | ||
| Water area | 585.81 | 62.83 | 142.10 | 226.20 | 69.60 | 1.93 | ||
| Urban and rural, industrial and mining, residential land | 4238.92 | 221.70 | 638.01 | 122.77 | 921.25 | 14.50 | ||
| Unused land | 45.43 | 25.13 | 30.93 | 9.67 | 4.83 | 13.53 | ||
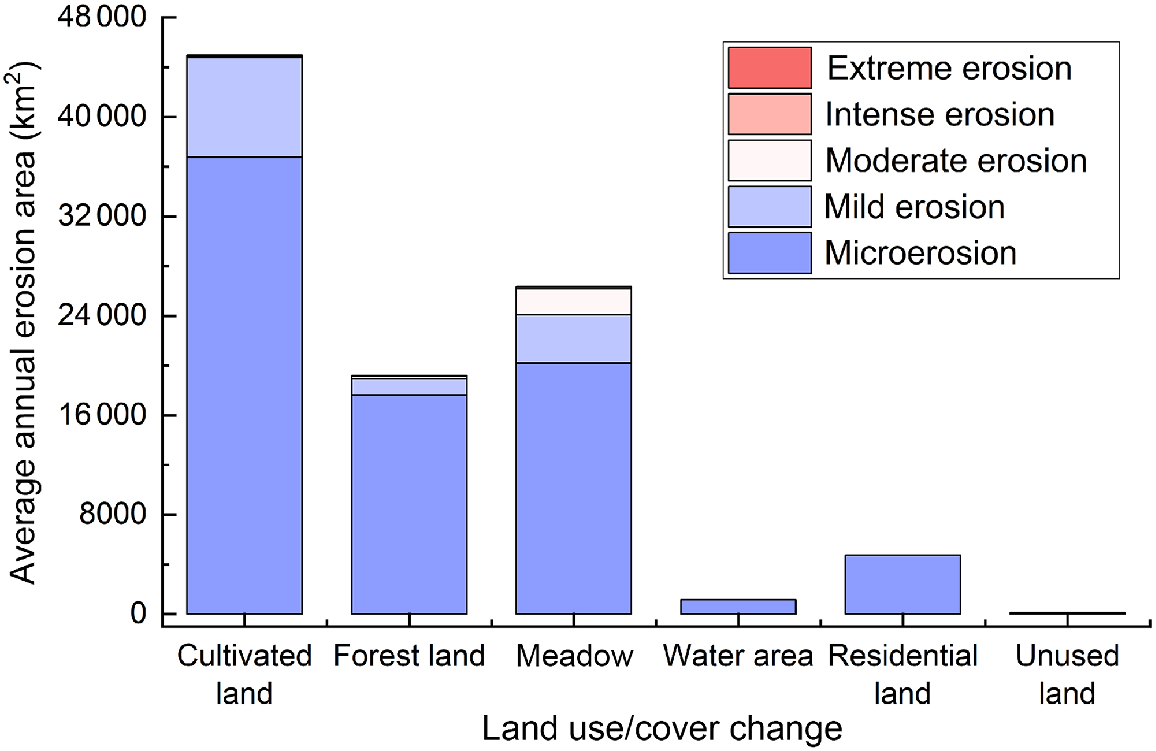
The area of erosion intensity for each year with different land-use types was calculated to obtain the average annual erosion area of each land use type and formed a cumulative histogram (Fig. 7). It can be seen that the erosion area of cultivated land is greatest, reaching 44959.49 km2, followed by grassland and forest land, 26 333 and 19171.12 km2 respectively; however, the erosion degree of grassland is the most serious, with the highest percentage of erosion area of medium degree and above reaching 8.57%; the erosion area of watershed and urban–rural, industrial–mining and residential land is smaller, indicating that their impact on soil erosion has a smaller impact. Although the erosion area of unused land is small, it also has moderate and above erosion, which indicates that unused land also exerts a certain degree of influence on the soil.
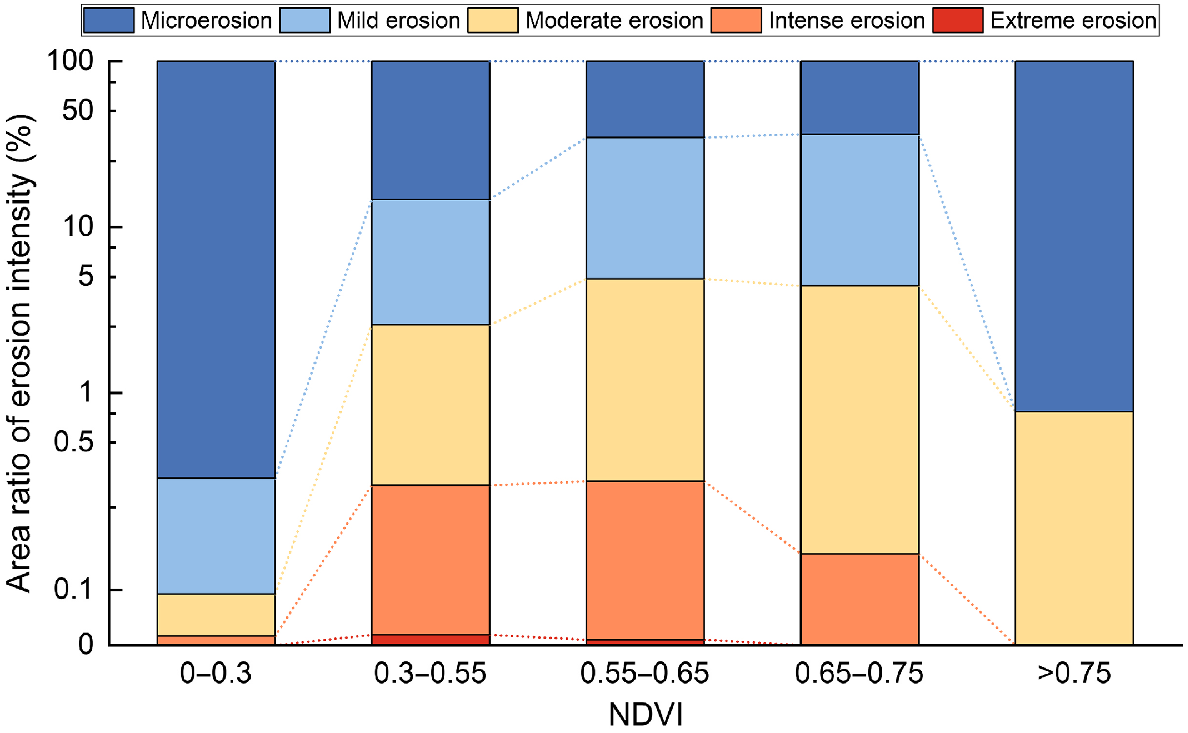
The area share of soil erosion intensity in the study area at different NDVI levels is in Fig. 8. There are no areas of severe erosion in the area, and the area share of slight erosion is more than 60% for both. When the NDVI is between 0 and 0.3 or when the NDVI is greater than 0.75, the percentage of slight erosion is above 99%, and there is almost no light and above erosion. The most intense erosion occurs when the NDVI is either between 0.55 and 0.65 or when the NDVI is between 0.65 and 0.75, followed by NDVI greater than 0.3 and less than 0.55. The proportions of light and above erosion areas for the three NDVI conditions mentioned above are 34.66%, 36.27% and 14.69% respectively. Among these, there is only moderate erosion except for slight erosion for NDVIs greater than 0.75, and there is an absence of very strongly eroded soil for NDVI values greater than 0 and less than 0.3 and for NDVI less than 0.65 and more than 0.75.
Discussion
The SSGB is an area of relatively light soil erosion. This paper calculates six factors based on the RUSLE model using spatial analysis tools in GIS. The soil erosion in the study area and the spatial-temporal variation characteristics are then analysed. On this basis, the impact of these factors on soil erosion is also analysed by combining the modulus of soil erosion with precipitation, land use, and NDVI.
The comparative analysis of the study data has led to the reasons for the above results in the study area. The study area has not experienced any severe soil erosion from 1998 to 2015, and its soil erosion level has been continuously in a reduced state. However, there was a tendency for a slight increase in erosion from 2015 to 2020. The main areas with increasing tendencies are the three plots IV41-1, IV41-2, and IV42-1. Through analysis, it is believed that there are two main reasons for this: (1) precipitation in these plots has increased from 2015 to 2020 compared to previous years, with the average annual rainfall increasing by 25.6, 23.5, and 11.5 mm, respectively, causing the erosion level of the soil in this area to increase; and (2) shift in land use type from 2015 to 2020 is relatively large, with the area of grassland increasing by 1076.89 km2. Grassland has a larger P-value and, therefore, may lead to a change in the degree of soil erosion. Secondly, from the analysis of the impact factors, it was found that NDVI in the range of 0–0.55 has less impact on soil erosion than on landscapes with an NDVI between 0.55 and 0.75. The reason for this was that the land use types with higher NDVI are mostly grassland, which experiences the most severe soil erosion, thus, leading to a greater degree of impact.
Many scholars have researched areas, to varying degrees, including natural resources, ecological environment, and vegetation and land use (Zhang et al. 2020b, 2021b; Dou et al. 2021; Lai et al. 2021; Zheng et al. 2021, 2022; Fang et al. 2022; Fu et al. 2022; Gong et al. 2023). Among them, Fu et al. (2022) pointed out that natural resource observation and monitoring is an indispensable technical tool in studying inter-resource and inter-environmental roles, resource asset management, and ecological environment restoration; Dou et al. (2021) analysed the application of observations in ecological environmental protection and restoration work based on the existing comprehensive observation work of natural resource elements and proposed a rationalisation for observational-based work to serve as ecological environmental protection and restoration work; Lai et al. (2021) and Zhang et al. (2021b) analysed the dynamic changes of natural resources in south-west China and concluded that the dominant resources were obvious within each zone and that the change characteristics were different among zones. Many scholars also have conducted very prominent studies on soil erosion, such as Guo et al. (2020), Hu (2016), Kong (2019) and Sun et al. (2022), who have done studies on soil erosion on the Loess Plateau, including gravity and hydraulic erosion, and explored the spatial and temporal changes of soil erosion by analysing the influence factors in the paper. However, the study area of the previous authors was limited to the Loess Plateau, and they did not divide it finely for study. This paper differs from previous studies in that it divides the SSGB into six finer four-level zones for analysis and explores both the temporal and spatial variations of the soil erosion modulus and intensity while also combining the main influence factors with erosion results to analyse the extent of their changes on soil erosion. The results of this study differ from previous work in that soil erosion in the SSGB is relatively mild. Ultimately, it was also determined that the soil erosion area in this region is greatest when annual rainfall is in the range of 550–620 mm and that the erosion of grassland is most severe. Severe erosion also exists when the NDVI is in the range of 0.3–0.75.
By describing and comparing the above results, this paper discusses and analyses the spatial and temporal variation characteristics of soil erosion degree and the associated influence factors. However, this paper relies on previous research to determine the P-factor assignments, noting that these assignments have not been investigated and studied in the field. Hence, there is likely to be some error in this regard. However, according to the current study, their assignment is empirical, so such errors are inevitable. This paper did not analyse the effect of slope length and slope gradient on soil erosion (i.e. the vertical spatial variation of soil erosion in the area) because the terrain of the study area is relatively flat. Consequently, it is not very meaningful to analyse its slope.
Conclusions
This study analyses the degree of soil erosion in the warm, temperate, grass farming subregion of the SSGB. Based on the combination of the soil loss equation (RUSLE) model and the spatial analysis tool in ArcGIS, the soil erosion modulus of the SSGB was calculated for five periods from 1998 to 2020, and its spatial and temporal variation characteristics and the relationship between the influence factors and soil erosion were analysed. The conclusions are as follows.
There is no soil with a soil erosion intensity rating of severe erosion in the SSGB from 1998 to 2020, indicating the degree of soil erosion was relatively mild. The soil erosion modulus was in continuous decline from 1998 to 2020, and although there was a slight increase from 2015 to 2020, the overall soil erosion level in the area was in a reduced state over these 23 years.
The proportion of soil area with unchanged erosion in the SSGB from 1998 to 2020 was over 85%, and the proportion of soil area with decreasing grades from 2000 to 2015 was always larger than that with increasing grades; the grades from 2015 to 2020 increased slightly, but its erosion level was still in a reduced state overall.
The degree of soil erosion in the SSGB is correlated with rainfall, land-use types, and NDVI, and the degree of soil erosion generally tends to increase with increasing rainfall; the area of cultivated land decreased by 3497.47 km2 from 2000 to 2020, while the area of grassland and the collective area of urban-rural, industrial–mining and residential land increased by 1364.96 and 2166.35 km2, respectively. Among the six land use types, cultivated land and grassland areas are the most eroded. Furthermore, soil erosion is strongest when the NDVI ranges from 0.55 to 0.65, followed by 0.3–0.55.
This paper explores the spatial and temporal variation characteristics and influence factors of soil erosion in the SSGB and provides the main basis for planning soil and water conservation measures and soil erosion control in the region. In doing so, it lays a good foundation for developing integrated soil and water conservation control measures according to the local conditions.
Data availability
The data that support this study are available in [The Data Center for Resources and Environmental Sciences] at [http://www.resdc.cn] and [National Earth System Science Data Center, National Science & Technology Infrastructure of China 2023] in [http://www.geodata.cn].
Declaration of funding
This research was funded by two projects. The first Project is the research on Integrated Technology System for Natural Resources Observation and Monitoring (Project No. DD20230514), Start and End: 2023-2025, Annual funding: RMB 2 million. The second Project is Special Funds Projects for Basic Scientific Research Business Expenses of Chinese Academy of Geological Sciences (Grant No. JKYQN202362). We should like to extend our sincere thanks for the anonymous reviewers of this manuscript for their helpful suggestions.
References
Alsafadi K, Bi S, Abdo HG, Al Sayah MJ, Ratonyi T, Harsanyi E, Mohammed S (2022) Spatial-temporal dynamic impact of changes in rainfall erosivity and vegetation coverage on soil erosion in the Eastern Mediterranean. Environmental Science and Pollution Research International
| Crossref | Google Scholar |
Desmet PJJ, Govers G (1996) A GIS procedure for automatically calculating the USLE LS factor on topographically complex landscape units. Journal of Soil and Water Conservation 51(5), 427-433.
| Google Scholar |
Dou W, Wang B, Liu X, Chen C, Zhang X (2021) The role of integrated observation of natural resource elements in ecological protection and restoration. Land and Resources Information [10] 11-17.
| Google Scholar |
Fang G, Xiang B, Zhao W, et al. (2015) Study on soil erosion in Lhasa River Basin based on GIS and RUSLE. Journal of Soil and Water Conservation 29(3), 6-12.
| Google Scholar |
Fang M, Liu X, Kong F, Li M, Pei X (2022) A method for producing year-by-year land cover data based on the GEE platform: the Yellow River Basin as an example. Remote Sensing of Natural Resources 34(01), 135-141.
| Google Scholar |
Fu Y, Tan C, Liu X, Sun X, Yuan Z, Zheng Y (2022) Definition, classification, observation and monitoring of natural resources and their application in territorial planning and governance. Geology in China 49(04), 1048-1063.
| Crossref | Google Scholar |
Gao S, Liu Q, Luo X (2022) Analysis of land use change and soil erosion characteristics in Chongqing based on RUSLE model. China Soil and Water Conservation [11] 32-36+7.
| Google Scholar |
Gong C, Wang S, Lu H, Chen Y, Liu J (2023) Research progress on spatial differentiation of soil heavy metals and its influencing factors based on geographic detectors. Environmental Science 44(05), 2799-2816.
| Google Scholar |
Guo W, Xu X, Zhu T, Zhang H, Wang W, Liu Y, Zhu M (2020) Changes in particle size distribution of suspended sediment affected by gravity erosion: a field study on steep loess slopes. Journal of Soils and Sediments 20(3), 1730-1741.
| Crossref | Google Scholar |
Guo L, Liu R, Men C, Wang Q, Miao Y, Shoaib M, Wang Y, Jiao L, Zhang Y (2021) Multiscale spatiotemporal characteristics of landscape patterns, hotspots, and influencing factors for soil erosion. Science of The Total Environment 779, 146474.
| Crossref | Google Scholar |
Hu K (2016) Research on soil erosion dynamics in different bioclimatic zones of Loess Plateau. People’s Changjiang 47(13), 16-23.
| Google Scholar |
Jiang Z, Wang Z, Liu Z (1996) Quantitative study on spatial variation of soil erosion in a small watershed in the loess hilly region. Journal of Soil and Water Conservation 2(1), 1-9.
| Google Scholar |
Jones BG, Gyawali BR, Zourarakis D, Gebremedhin M, Antonious G (2022) Soil loss analysis of an eastern Kentucky watershed utilizing the universal soil loss equation. Environments 9(10), 126.
| Crossref | Google Scholar |
Lai M, Wu S, Zhang H, Liu J, Wang X, Chen X (2021) Analysis of the dynamic changes of natural resources in southwest China based on comprehensive zoning. China Geological Survey 8(02), 83-91.
| Google Scholar |
McCool DK, Brown LC, Foster GR, Mutchler CK, Meyer LD (1987) Revised slope steepness factor for the universal soil loss equation. Transactions of the ASAE 30(5), 1387-1396.
| Google Scholar |
Mekuria ET (2022) Assessment of spatial soil erosion using RUSLE model integration with GIS and RS tools a case study of Gojeb catchment, Omo-Gibe Basin, Ethiopia. International Journal of Environmental Protection and Policy 10(5), 130-139 Available at https://www.sciencepublishinggroup.com/article/10.11648.j.ijepp.20221005.13.
| Google Scholar |
Meng X, Wang H (2018) Soil map based harmonized world soil database (v1.2). National Tibetan Plateau/Third Pole Environment Data Center. Available at http://data.tpdc.ac.cn
Merrill SD, Zobeck TM, Liebig MA (2022) Field measurement of wind erosion flux and soil erodibility factors as affected by tillage and seasonal drought. Soil Science Society of America Journal 86(5), 1296-1311.
| Crossref | Google Scholar |
Mirzabaev A, Strokov A, Krasilnikov P (2023) The impact of land degradation on agricultural profits and implications for poverty reduction in Central Asia. Land Use Policy 126, 106530.
| Crossref | Google Scholar |
Moisa MB, Babu A, Getahun K (2023) Integration of geospatial technologies with RUSLE model for analysis of soil erosion in response to land use/land cover dynamics: a case of Jere watershed, Western Ethiopia. Sustainable Water Resources Management 9(1), 13.
| Crossref | Google Scholar |
Mu X, Li P, Liu B, Zhao G, Gao P, Sun W (2022) Evolution of soil erosion patterns and their driving mechanisms on the Loess Plateau from 1901-2016. People’s Yellow River 44(09), 36-45.
| Google Scholar |
National Earth System Science Data Center, National Science & Technology Infrastructure of China (2023) Technology plan project data collection column. Available at http://www.geodata.cn
Nigel R, Rughooputh SDDV (2010) Soil erosion risk mapping with new datasets: an improved identification and prioritisation of high erosion risk areas. Catena 82, 191-205.
| Crossref | Google Scholar |
Nigel R, Rughooputh SDDV (2012) Application of a RUSLE-based soil erosion modelling on Mauritius Island. Soil Research 50(8), 645-651.
| Crossref | Google Scholar |
Podhrazska J, Kucera J, Szturc J, Blecha M, Karasek P, Pelisek I, Konecna J (2022) The effects of long-acting water erosion on the hydro-pedological characteristics of chernozems. Agronomy 12(10), 2574.
| Crossref | Google Scholar |
Rao W, Shen Z, Duan X (2023) Spatiotemporal patterns and drivers of soil erosion in Yunnan, Southwest China: RULSE assessments for recent 30 years and future predictions based on CMIP6. Catena 220(PartB), 106703.
| Crossref | Google Scholar |
Shaanxi Provincial Soil and Water Conservation Ecological Environment Monitoring Center (2022) The 2021 China soil and water conservation bulletin. Available at https://www.sxwscm.cn/zcfg/sbgb/2022-07-14/1113.html
Shan L, Yang X, Zhu Q (2019) Effects of DEM resolutions on LS and hillslope erosion estimation in a burnt landscape. Soil Research 57(7), 797-804.
| Crossref | Google Scholar |
Sun Y, Li N, Huang B, Zhao X, Yan H, Cao Y (2022) Spatial and temporal variation of soil conservation in the Loess Plateau region from 2000 to 2019 and analysis of influencing factors. Soil and Water Conservation Research 29(06), 290-297.
| Google Scholar |
Tan B, Li Z, Wang Y, et al. (2005) A rapid estimation method of soil erosion intensity in watersheds based on remote sensing data. Remote Sensing Technology and Applications 20(2), 215-220.
| Google Scholar |
Wang F, Liu JT, Fu TG, Gao H, Qi F (2022) Spatio-temporal variations in soil erosion and its influence factors in Taihang Mountain area based on RUSLE modeling. Chinese Journal of Eco-Agriculture 30(07), 1064-1076.
| Crossref | Google Scholar |
Wang S, Xu X, Huang L (2023) Spatial and temporal variability of soil erosion in Northeast China from 2000 to 2020. Remote Sensing 15(1), 225.
| Crossref | Google Scholar |
Wedajo AG, Fufa F, Mentsiro AA (2022) Assessment of spatial soil erosion using RUSLE model integration with GIS and RS tools: the case of Gilgel Gibe-I catchment, South West Ethiopia. American Journal of Bioscience and Bioengineering 10(1), 10-22.
| Crossref | Google Scholar |
Wieder WR, Boehnert J, Bonan GB, Langseth M (2014) Regridded harmonized world soil database v1.2. Data set. Oak Ridge National Laboratory Distributed Active Archive Center, Oak Ridge, Tennessee, USA. Available at http://daac.ornl.gov
Williams J, Nearing M, Nicks A, et al. (1996) Using soil erosion models for global change studies. Journal of Soil and Water Conservation 51(5), 381-385.
| Google Scholar |
Xu X (2022) Soil erosion research based on USLE and GIS – a case study of Qingxu County. Natural Resources of North China [04] 144-146+150.
| Google Scholar |
Xu X, Liu J, Zhang S, Li R, Yan C, Wu S (2018) Multi-period land use remote sensing monitoring dataset in China (CNLUCC). Resource and Environment Science Data Registration and Publication System. Available at http://www.resdc.cn/DOI
Yao K, Zhou B, He L, Li Y (2021) Characteristics of spatial and temporal dynamics of soil erosion in the South Mountain area of West Sichuan from 2000-2018. Soil and Water Conservation Bulletin 41(04), 224-230+251.
| Google Scholar |
Yin Z, Chang J, Huang Y (2022) Multiscale spatiotemporal characteristics of soil erosion and its influencing factors in the yellow river basin. Water 14(17), 2658.
| Crossref | Google Scholar |
Zhang W, Fu J (2003) Estimating rainfall erosivity from different types of rainfall data. Resource Science 25(1), 35-41.
| Crossref | Google Scholar |
Zhang H, Fan J, Huang L, Tang Y, Yue Y, Yang Y, Liu X (2020a) Theoretical research and technical solutions for comprehensive natural resource zoning in China. Resource Science 42(10), 1870-1882.
| Google Scholar |
Zhang S, Nie Y, Zhang H, Li Y, Han Y, Liu X, Wang B (2020b) Spatial and temporal variation of NDVI and driving forces of vegetation in Inner Mongolia based on geodetectors. Journal of Grasslands 28(05), 1460-1472.
| Google Scholar |
Zhang L, Ren F, Li H, Cheng D, Sun B (2021a) The influence mechanism of freeze-thaw on soil erosion: a review. Water 13(8), 1010.
| Crossref | Google Scholar |
Zhang Z, Zhang H, Liu X, Wu H, Liu S, Liu X (2021b) Dynamic change characteristics of comprehensive regionalization of natural resources in North China. Geological Survey of China 8(02), 92-99.
| Crossref | Google Scholar |
Zhang W, Zhang W, Liu Y, Zhang J, Yang L, Wang Z, Mao Z, Qi S, Zhang C, Yin Z (2022a) The role of soil salinization in shaping the spatio-temporal patterns of soil organic carbon stock. Remote Sensing 14(13), 3204.
| Crossref | Google Scholar |
Zhang Y, Li W, Li S, Xie B, Shi F, Zhao J (2022b) Spatial distribution of optimal plant cover and its influencing factors for Populus simonii Carr. on the Bashang Plateau, China. Land 11(6), 890.
| Crossref | Google Scholar |
Zhao Y, Li C, He H, Wang Q, Wu J (2022) Analysis of driving factors of soil erosion change in Shaanxi Province based on maximum rate of change. People’s Yellow River 44(07), 105-111+114.
| Google Scholar |
Zheng F, Liu F, Yang Q, et al. (2001) Review of research progress in soil erosion prediction model. Bulletin of Soil and Water Conservation 21(6), 16-18.
| Google Scholar |
Zheng Y, Zhang H, Liu X, Liu X, Bao K, Wang X (2021) Analysis of natural resources dynamic change characteristics under comprehensive regionalization in Northeast China from 1990 to 2018. Geological Survey of China 8(02), 100-108.
| Crossref | Google Scholar |
Zheng Y, Li F, Liu X, Chang M, Zhao H, Lai M, Zhang Z (2022) Temporal and spatial variation of natural resources and their ecological environment effects in Northeast China in the past 30 years under the background of industrialization. Geology in China 49(05), 1361-1373.
| Crossref | Google Scholar |