

Nitrogen and phosphorus leaching losses under cropping and zone-specific variable-rate irrigation
John J. Drewry A * , Carolyn B. Hedley B , Stephen J. McNeill C , Ahmed G. El-Naggar E , Kishor K. Karakkattu A and David J. Horne D
A
B
C
D
E Present address:
Abstract
Agricultural land use is intensifying globally. Irrigation and other farm practices associated with intensification, such as cultivation, grazing, and fertiliser application, can increase nutrient losses. Variable rate irrigation (VRI) systems manage irrigation to spatially variable soils and different crops (zones). We lack knowledge on nutrient losses under zone-specific irrigation for mixed-cropping systems (combined crop and livestock grazing).
This study evaluated drainage, nitrogen, and phosphorus leaching losses under zone-specific irrigation for a temperate mixed-cropping system.
The study site had sheep grazing and crops including peas, beans, wheat, turnips, plantain, and ryegrass-white clover pasture. It had a variable-rate centre-pivot irrigator for two soil zones (free draining Zone 1; poorly drained Zone 2). Drainage flux meters (DFMs) collected drainage leachate, and samples for measurement of nitrogen (N) and phosphorus (P) concentrations. Soil water balance data and statistical modelling evaluated nutrient leaching losses over 5 years.
The mean leaching load of NOx-N (nitrate + nitrite) across 5 years was 133 (s.d. 77) and 121 (s.d. 97) kg N/ha/year for Zone 1 and Zone 2, respectively. Similarly, the mean leaching load of reactive P across all years was 0.17 (s.d. 0.30) and 0.14 (s.d. 0.14) kg P/ha/year for Zone 1 and Zone 2, respectively. The nitrogen concentrations and loads generally had greater uncertainty in Zone 2.
The DFMs worked well for the free draining sandy soil. However, fewer samples were collected in the silt soil, requiring the statistical modelling developed in this study. This study gave a reasonable estimate of annual leaching load means, but the indicators of their within-year variation were not reliable, partly due to differences in sampling frequency. With some exceptions, there was generally more NOx-N leaching from the free draining Zone 1. VRI provided a system to control irrigation-related drainage and leaching in these soil zones.
Drainage flux meters are more reliable in well-drained than in poorly drained soil. Given the lack of published studies, this study has improved knowledge of nutrient losses under zone-specific irrigated mixed-cropping systems in a temperate climate.
Keywords: cropping, drainage, irrigation, nitrate, nitrate leaching, phosphorus, soil water balance, variable rate irrigation, water quality.
Introduction
Agricultural land use intensification is occurring in many areas globally to support the demand for food production from population growth (Viglizzo et al. 2011; Cherubin et al. 2016; Camporese et al. 2021). Intensification of agricultural land includes the irrigation of previously non-irrigated areas. Irrigation is used to increase pasture and crop yields, but this is often associated with an increase in nutrient inputs through fertiliser, increased stock numbers, changing cropping patterns, and crop and pasture management practices (Barros et al. 2012; Cherubin et al. 2016; Drewry et al. 2021a; Koppe et al. 2021).
However, irrigation and other practices associated with intensification, such as cultivation, grazing, and nutrient inputs, can increase nutrient losses, and affect soil carbon, nutrient cycling, and soil health indicators (Drewry et al. 2021b, 2022a; Lambie et al. 2021; Mayel et al. 2021; Monaghan et al. 2021; Eger et al. 2023). Efforts to reduce diffuse nutrient losses from agriculture through improved farm practices, regulation, or catchment management is challenging and ongoing (Lynam et al. 2010; Snelder et al. 2020; Srinivasan et al. 2020; Grizzetti et al. 2021; Macintosh et al. 2021; McDowell et al. 2021). Cropping patterns and crop types, fertilisation rates, and irrigation efficiency contribute to a range of nitrate losses under irrigation (Barros et al. 2012). As an example, nitrogen (N) leaching losses from centre-pivot irrigated lucerne were higher when compared with non-irrigated lucerne, with the largest losses occurring during summer irrigation (Graham et al. 2022).
Water and nutrient losses from farms can be reduced through precision agriculture practices, such as the use of management zones for improved management of irrigation and fertiliser to spatially variable soils or to different crops in mixed-cropping systems (Drewry et al. 2022b). These practices, coupled with good farm management practices, can help reduce farm inputs and nutrient losses, increase water use efficiency, and improve crop and pasture yields (Hedley et al. 2009; González Perea et al. 2018; O’Shaughnessy et al. 2019; Vogeler et al. 2019; El-Naggar et al. 2020).
Variable rate irrigation (VRI) systems have been developed for managing spatially variable soils, or for managing several crops in different areas (zones) under the irrigator. VRI has been shown to reduce drainage and nutrient losses compared with uniformly applied irrigation water (Hedley 2015; McDowell 2017; González Perea et al. 2018; Drewry et al. 2019). Although some studies have investigated the effect of different grazed crops, such as plantain, on N leaching under dairying (Rodriguez et al. 2023), losses under such crops also need evaluation under irrigated mixed-cropping systems. Mixed-cropping systems involve repeated disturbances during crop transitions, fallow periods, legacy effects of legume crops, and animal inputs, all or which may increase nutrient losses. These systems may challenge VRI systems due to changing crop water demand. There appear to be few published studies evaluating nutrient leaching losses in New Zealand cropping systems over multiple years and crop sequences (Norris et al. 2023).
A range of methods have been used to evaluate drainage and nutrient losses under irrigation, including lysimeters (Gray et al. 2021; Graham et al. 2022), modelling (Vogeler et al. 2019), and drainage flux meters (DFMs) (Loo et al. 2019; Norris et al. 2023). DFMs have a buried, cylindrical collector outfitted with a wick to provide tension for draining the column of soil above. Drainage from the soil is measured and sampled from a reservoir. These meters are simple to operate and are a useful tool for measuring drainage and solutes (Gee et al. 2009; Norris et al. 2023). Meissner et al. (2010) evaluated drainage differences between DFMs and lysimeters, and identified that further research was required to evaluate the role of DFMs in measurements of water quality and drainage in less free draining soils. Very few published studies have evaluated nutrient losses using DFMs (Norris et al. 2023). Although some studies have evaluated nutrient losses under VRI systems (e.g. McDowell 2017), there is a paucity of data for N and phosphorus (P) concentrations and leaching losses under zone-specific irrigation VRI systems for mixed-cropping systems (combined crops and livestock grazing).
This study measured drainage and N and P concentrations in leachate under two contrasting management zones of a variable rate centre-pivot irrigator for a mixed-cropping system using DFMs. The objectives were to estimate leaching losses from mixed-cropping system zones, and evaluate the potential of DFMs as a tool for estimating nutrient losses.
Materials and methods
Overview of site and soils
The study was conducted at Massey University’s No. 1 Farm, near Palmerston North, New Zealand. The farm is located at 40.22°S and 175.36°E. The climate of the region is temperate. Median annual rainfall at Palmerston North (1981–2010) was 900 mm; mean annual temperature range was 9.1°C (Chappell 2015).
The study area (1.2 ha) is on a mixed-cropping site, typically cropped with peas, beans, and spring wheat, with sheep grazing between cropping events. The site has a centre-pivot irrigator with variable rate control that irrigates two management zones. The two management zones are based on soil type. These two zones were delineated using information from a soil survey (Pollok et al. 2003), an electromagnetic survey (El-Naggar et al. 2021), and measurements of a range of soil physical properties. Zone 1 soil is a Manawatū fine sandy loam, a deep, free-draining soil classified as a Fluvial Recent Soil (Hewitt 2010). Zone 2 is a Manawatū silt loam classified as a Fluvial Recent Soil and is poorly drained. Both soils are classified as a Fluvisol in the FAO Reference Soil Group (IUSS Working Group WRB 2015).
Soil analyses were undertaken to characterise the soils. Soil available water capacity (AWC) was determined in 0.1-m increments to 1 m depth (El-Naggar et al. 2020). Soil samples for physical analysis were collected in August 2016 using undisturbed cores sampled at 20-cm intervals to 1 m depth. Sampling details for the site are described in El-Naggar et al. (2021), with general physical methods in Drewry et al. (2021c). Analyses undertaken at the Manaaki Whenua – Landcare Research Soil Physics Laboratory were: particle size distribution, bulk density, porosity, and air permeability (Gradwell and Birrell 1979). Soil samples for chemical analysis were collected in August 2016. Analyses were: Olsen P, total carbon (C) and N, pH, cation exchange capacity, and exchangeable K, Mg, and Ca, with analyses undertaken at the Massey University School of Agriculture and Environment laboratory.
Crop and irrigation management
The site was cropped with a series of monoculture crops for harvest, including peas (Pisum sativum), beans (Phaseolus vulgaris), spring wheat (Triticum aestivum), and oats (Avena sativa), followed by Barkant turnips (Brassica rapa), plantain (Plantago lanceolata), chicory (Cichorium intybus), ryegrass (Lolium perenne), red clover (Trifolium pratense), and white clover (Trifolium repens) in pasture mixes grazed by animals, over the period 2016–2021 (Table 1). The cropped site is typically grazed with sheep when not in crop or is fallow, termed ‘mixed cropping’.
| Date | Field management Zone 1 | Field management Zone 2 | |
|---|---|---|---|
| May 2016 | Bare ground | Same as Zone 1 | |
| October 2016 | Chisel ploughed and cultivated. 37.75 kg N/ha and 25 kg P/ha applied. Peas (Ashton) sown 260 kg/ha | Same as Zone 1 | |
| January 2017 | Peas harvested. Chisel plough and cultivation. 37.75 kg N/ha and 25 kg P/ha applied. Beans (Contender) sown 75 kg/ha. | Same as Zone 1 | |
| March–April 2017 | Beans harvested. Plough and full cultivation. 37.75 kg N/ha and 25 kg P/ha applied. Oats (Milton) sown 120 kg/ha. Barkant turnips sown 3 kg/ha. | Same as Zone 1 | |
| Remaining 2017 | The forage crops are grazed by approx. 75 ewes, especially in August. November 2017 plough and full cultivation. 37.75 kg N/ha and 25 kg P/ha applied. Peas (Ashton) sown 260 kg/ha. | Same as Zone 1 | |
| 2018 | January 2018 harvest peas. February 2018 Chisel plough and cultivation. 37.75 kg N/ha and 25 kg P/ha applied. Beans (Contender) sown 75 kg/ha, part area. Oats (Milton) sown 110 kg/ha. April harvest beans. | Same, with some mix across zones. March 2018 plough and full cultivation. 37.75 kg N/ha and 25 kg P/ha applied. Barkant turnips sown 3 kg/ha. Brassica (Pallaton Raphno) sown 8 kg/ha. | |
| November 2018 | 37.75 kg N/ha and 25 kg P/ha applied. Wheat (Sensas) sown 150 kg/ha. | Same | |
| 2019 | February harvest wheat. April full cultivation. 37.75 kg N/ha and 25 kg P/ha applied. Oats (Milton) sown, direct drilled 110 kg/ha. | Same, plus oats (Milton) sown 110 kg/ha, Barkant turnips sown 3 kg/ha, with full cultivation. | |
| October 2019–2020 | Ploughing and full cultivation. 37.75 kg N/ha and 25 kg P/ha applied. Plantain (7 kg/ha), perennial ryegrass (12 kg) and white clover mix (3 kg) sown, rest bare ground. Plantain mix (mown): 23 December 2019, 11 February 2020, 8 March 2020, 1 May 2020, 2 June 2020, 2 July 2020. Plantain grazed (ewes and lambs) from 1 October 2020 on approx. monthly basis until 16 June 2021. | Same as Zone 1 | |
| 2020 | February 36.8 kg N/ha applied. April plough and full cultivation. Oats (Milton 110 kg/ha) and peas (150 kg/ha) sown. | April 2020 direct drilled annual ryegrass. | |
| 2020 | Oct 2020 plough and full cultivation. November 37.75 kg N/ha and 25 kg P/ha applied. Mix sown (Puna II chicory 5 kg/ha, Legacy white clover 2 kg/ha, Bounty white clover 2 kg/ha, Sensation red clover 4 kg/ha). | Same as Zone 1 | |
| 2021 | Chicory mix grazed from 6 January 2021 to 16 June 2021. Un-grazed rest of winter. Grazing recommenced 20 September 2021. Grazed by approx. 80 lambs on a 3–4 week rotation. 37.75 kg N/ha and 25 kg P/ha applied. | Same as Zone 1 |
N and P applications were from Cropmaster 15 fertiliser (content: N 15.1%, P 10%, K 10%, S 7.7%). February 2020 N applied as urea.
The 86-m irrigator had one span containing 31 sprinklers, each with a spray radius of 5 m and a flow rate of 26.3 m3/h. The pivot provided a mechanism to apply known and fixed amounts of irrigation. Soil water balance (SWB) scheduling used the FAO56-ET method to calculate daily soil water deficits to determine crop water requirements (El-Naggar et al. 2020).
Experimental design and drainage flux meters
An electromagnetic (EM) survey of the site was conducted to identify the two management zones. Zone maps were derived using geostatistical methods, as reported by El-Naggar et al. (2021). Briefly, electromagnetic and gamma radiometric data were interpolated into regular 5-m resolution grids using ordinary kriging. These were then used to derive zone maps using unsupervised clustering; further details are described elsewhere (Hedley et al. 2016; El-Naggar et al. 2021). The VRI pattern was developed for this site based on this information.
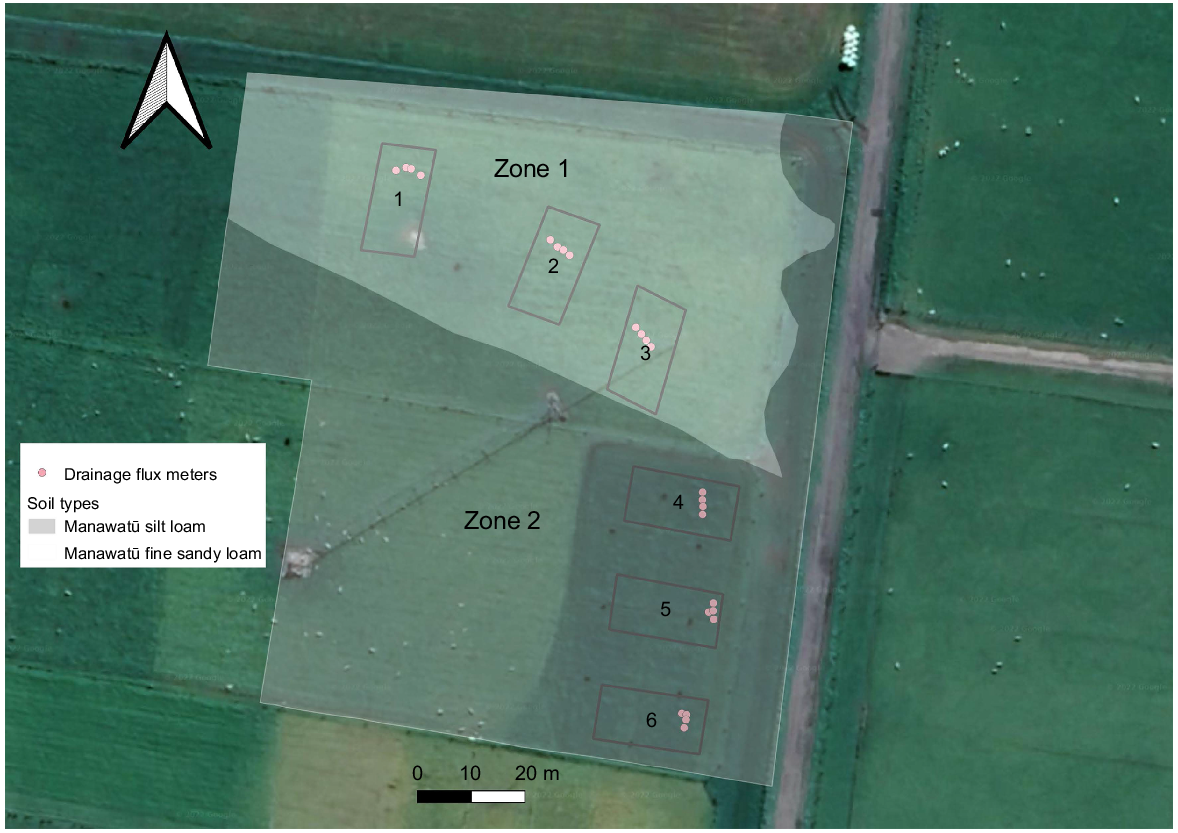
Twelve DFMs were constructed for each of two management zones using an existing design (Gee et al. 2002, 2009; Norris et al. 2023). The wick length was 0.06 m and the control tube (convergence ring) was approximately 0.015 m in height. Each DFM was installed 3–4 m apart with its top at least 0.65 m below the soil surface. The trial site was designed with three plots applied to each of the two soil zones, with four replicate DFMs grouped in each plot (Fig. 1). The DFMs were located on the 76 m arc from the centre of the irrigator.
The 24 DFMs were installed (28 April to 26 May 2016) to collect drainage water below 0.65 m soil depth. For installation, a hole was prepared 0.20 m in diameter, and 1.8 m deep, with a hand auger. Stones were encountered at approximately 1.2–1.5 m depth in Zone 2. At installation, the 0.20-m section of pipe above the wick was repacked with soil taken from the same depths. The wick in the funnel section was wet up and then diatomaceous earth added and packed tightly. Finally, 99% pure silica sand was added, and water carefully poured over this until it measured approximately 0.01 m in depth above the sand, removing air bubbles. Pipes with collection tubes were installed beneath approximately 0.65 m to facilitate drainage water collection, as the DFMs remain in the soil. Further information is available in Karakkattu et al. (2020).
Drainage sampling measurements and water nutrient concentrations
Drainage volumes were measured and collected regularly using a customised pumping system. Drainage was measured on 74 occasions between 26 May 2016 and 23 June 2021. Water quality samples were collected from drainage on 40 sampling dates. Water quality samples were collected every 1–3 weeks during the first year, then approximately 2-monthly or every 80–100 mm of rainfall until approximately late 2019. From then, water quality samples were collected seasonally, due to resourcing constraints. Water samples were analysed for ammonia-N, NOx-N (nitrate-N + nitrite-N) and reactive phosphorus by the Manaaki Whenua – Landcare Research Environmental Chemistry Laboratory, with methods described in Manaaki Whenua – Landcare Research (2021). All samples were refrigerated at 4°C during storage, and filtered at the laboratory with Whatman No. 42 filter papers prior to analysis. The ammonia-N (NH4-N) was determined colorimetrically using the indophenol reaction with sodium salicylate and hypochlorite; NO3-N by Cd reduction and NEDD colorimetry; and NOx-N is reported (nitrate-N + nitrite-N). For reactive P (i.e. filterable reactive P), the orthophosphate reacted with ammonium molybdate and antimony potassium tartrate under acidic conditions, then a molybdenum blue complex was formed after ascorbic acid reduction. All analyses were performed with a QuikChem 8500 flow injection analyser (Lachat Instruments, Milwaukee, WI, USA).
Soil water balance modelling
For the SWB, a daily time-step model was developed. This model used the FAO56-ET Penman-Monteith method (Allen et al. 1998) and weather data derived from the Palmerston North CliFlo climate station (http://cliflo-niwa.niwa.co.nz/) (NIWA and AgResearch climate station 21963), which was located only 50 m from the site, to calculate the daily ETo (reference evapotranspiration), ETc (crop evapotranspiration) and soil water deficit (SWD) values. The daily SWDs were used to determine crop water requirements for irrigation scheduling and crop management (El-Naggar et al. 2020, 2021). Separate SWBs were constructed per zone using farm and nutrient management (Table 1, Supplementary Fig. S1 in Supplementary material), crop, irrigation, and the AWC data collected per zone.
Statistical analysis
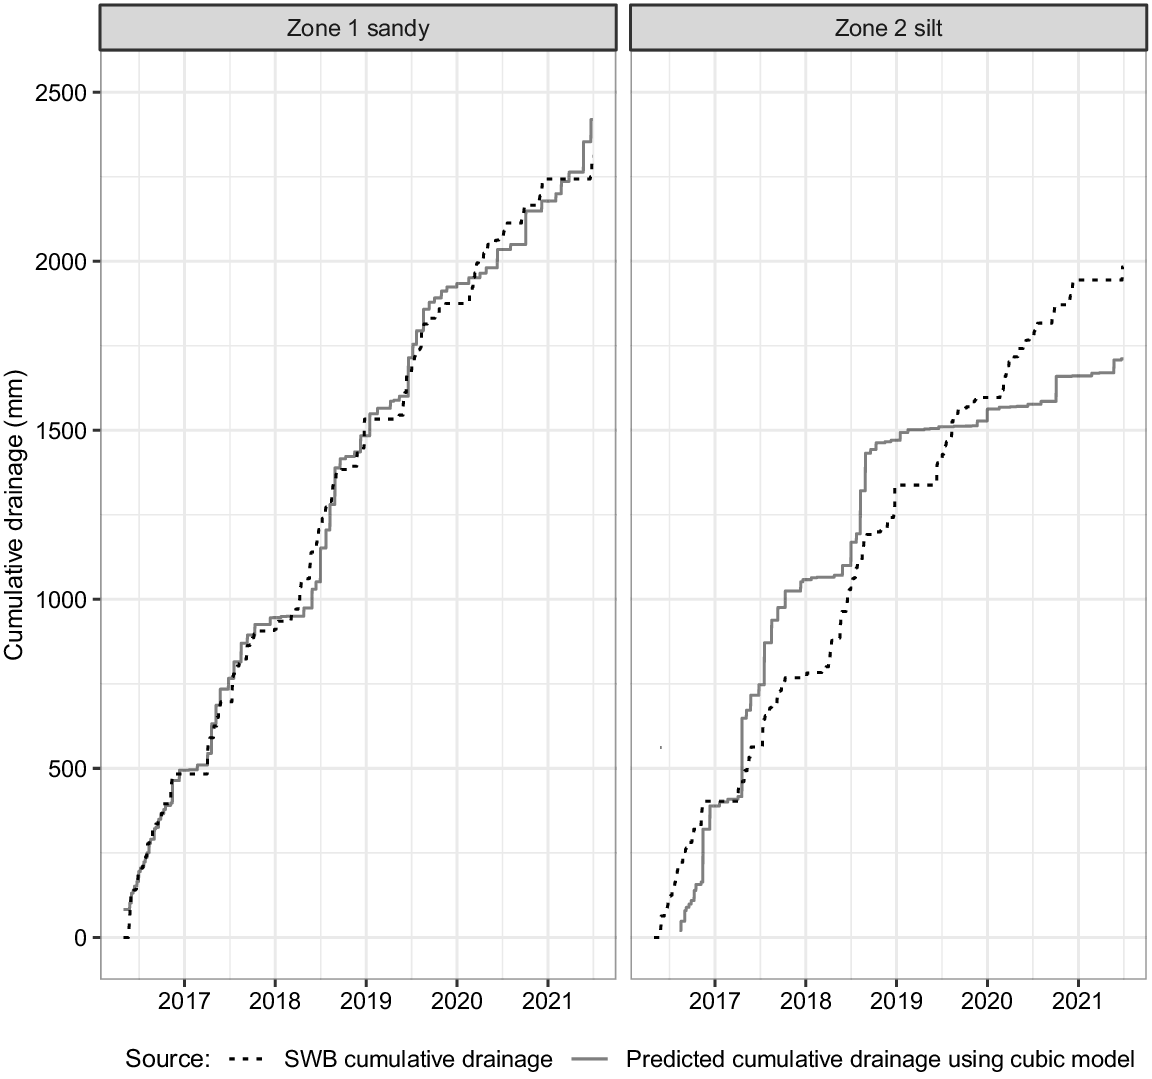
The measured drainage from Zone 1 was found to be much greater than the SWB-modelled drainage. There were fewer drainage and nutrient samples from Zone 2 after 2017, than for Zone 1, so zone-specific scaling was required. The approach was to estimate the parameters of a linear, quadratic, or cubic zone-specific model to estimate the SWB estimates from the DFM measurements. Overall, the cubic model was best and was adopted. The models are zone-specific and the cubic version of the correction is:
where ycorr is the corrected DFM cumulative drainage to match the SWB estimate, for zone i. The uncertainty is ε, assumed to be a Gaussian with a zero mean. Using the zone-specific cubic model to correct the field-measured DFM cumulative flow, the cumulative drainage for all the sample dates was evaluated.
Concentration values below the limit of detection were replaced by half the detection limit. Evaluation indicated the temporal variation is likely to be non-linear over time. A generalised additive mixed model (GAM) with a random effect for the replicate, and smoothing for the date to account for between- and within-year trends, was used. The GAM model was fitted with each nutrient treated as a Gamma with log-link. The long-term temporal trend was accounted for using a (tensor spline) smooth function of the number of years since the start of 2016, and the intra-annual temporal trend accounted for using a (tensor spline) smooth function of the day of the year. Both splines are zone-specific. A random effect was included for the group within each zone, to account for possible random variation at a site. The model used for estimation of the load during each hydrological year included terms for cumulative rainfall and irrigation. The general GAM model form was:
where μi,j = E(Yi,j) and Yi,j = EF(μi,j, ϕ). Yi,j is a response variable (one of NOx-N, ammonia-N, or P), EF(μi,j, ϕ) is a Gamma distribution with mean μi,j and scale parameter ϕ, for zone i. The fj(Years since 2016) and fk(Day of year) are zone-specific smooth functions of the number of years since 1 January 2016 and the day or the year, respectively (Wood 2017), which is cyclic.
The terms for cumulative rainfall and irrigation include an interaction with the date. This form is required since rainfall and irrigation have a large proportion of zeros (i.e. no rainfall and/or no irrigation). It is not clear whether adding these terms would improve the model for load, since omitting the terms would be partially offset by the smooth terms f1,1 and f2,1.
The fitted GAM used the mgcv::gam() procedure (Wood 2017) using maximum likelihood, so models could be compared. Models using an additive random effect (group, zone, or DFM) were evaluated using the R-squared, the proportion of deviance explained, and the Akaike Information Criterion (AIC) (Table 2). The model with the random effect associated with DFMs was improved over zone and group (also repeated for the other response variables), so was chosen as the final model, explaining 53.5%, 73%, and 69.7% of the total deviance for NOx-N, ammonia-N, and reactive P, respectively.
| Nutrient | Random effect | R-squared | Deviance explained | AIC | |
|---|---|---|---|---|---|
| NOx-N mg/L | Zone | 0.431 | 0.436 | 6097 | |
| Group | 0.473 | 0.473 | 6045 | ||
| DFM | 0.503 | 0.535 | 5989 | ||
| Ammonia-N mg/L | Zone | 0.252 | 0.64 | 84 | |
| Group | 0.346 | 0.66 | 2.3 | ||
| DFM | 0.155 | 0.73 | −144 | ||
| Reactive P mg/L | Zone | 0.014 | 0.056 | −3440 | |
| Group | 0.239 | 0.478 | −3942 | ||
| DFM | 0.596 | 0.697 | −4316 |
Note: The best model has the highest R-squared (0–1), highest proportion of deviance explained (0–1), or the lowest AIC. In each case, the comparison is specific to the nutrient.
The nutrient loads were calculated from cumulative drainage and the nutrient concentrations from the models developed. For annual statistics of drainage and load, the period 1 July to 30 June was used, as it is common practice in the Southern Hemisphere to use this hydrological year. All statistical analyses were carried out using the statistical package ‘R’ ver. 4.2.0 (R Core Team 2022).
Results
Site soil characteristics
The median sand content of Zone 1 ranged from 55 to 95% and increased with depth, while the median sand content of Zone 2 was 38–60% and increased with depth (Table 3). Median silt (Zone 1: 3–31%; zone 2: 29–46%) and clay contents in both zones decreased with depth (Table 3). Zone 1 median cation exchange capacity values were less than in Zone 2 (Table 3). Zone 1 Olsen P values were greater than in Zone 2; bulk density, and total C and N varied between the zones and depths (Table 3). The air permeability, porosity, pH, exchangeable K, Mg, Ca, and sulfate values per zone and depth are presented in the supplementary material (Table S2). Air permeability was greater in Zone 1.
| Zone | Depth (cm) | Bulk density (Mg/m3) | C (%) | N (%) | Olsen P (μg P/g) | CEC (meq/100 g) | Sand (%) | Silt (%) | Clay (%) | |
|---|---|---|---|---|---|---|---|---|---|---|
| Zone 1 sandy | 0–20 | 1.27 | 2.11 | 0.229 | 56.5 | 11.4 | 55 | 31 | 14 | |
| 20–40 | 1.45 | 0.51 | 0.059 | 15.7 | 5.6 | 80 | 13 | 7 | ||
| 40–60 | 1.43 | 0.20 | 0.027 | 8.1 | 3.9 | 92 | 5 | 3 | ||
| 60–80 | 1.42 | 0.16 | 0.023 | 3.9 | 2.9 | 91 | 5 | 4 | ||
| 80–100 | 1.42 | 0.13 | 0.022 | 2.5 | 2.6 | 95 | 3 | 2 | ||
| Zone 2 silt | 0–20 | 1.32 | 1.98 | 0.218 | 45.9 | 14.0 | 38 | 43 | 19 | |
| 20–40 | 1.41 | 1.22 | 0.138 | 13.2 | 13.0 | 42 | 44 | 14 | ||
| 40–60 | 1.35 | 0.45 | 0.054 | 4.9 | 7.4 | 39 | 46 | 15 | ||
| 60–80 | 1.34 | 0.30 | 0.038 | 3.1 | 5.7 | 60 | 29 | 11 | ||
| 80–100 | 1.40 | 0.29 | 0.038 | 3.4 | 6.1 | 49 | 38 | 12 |
Drainage
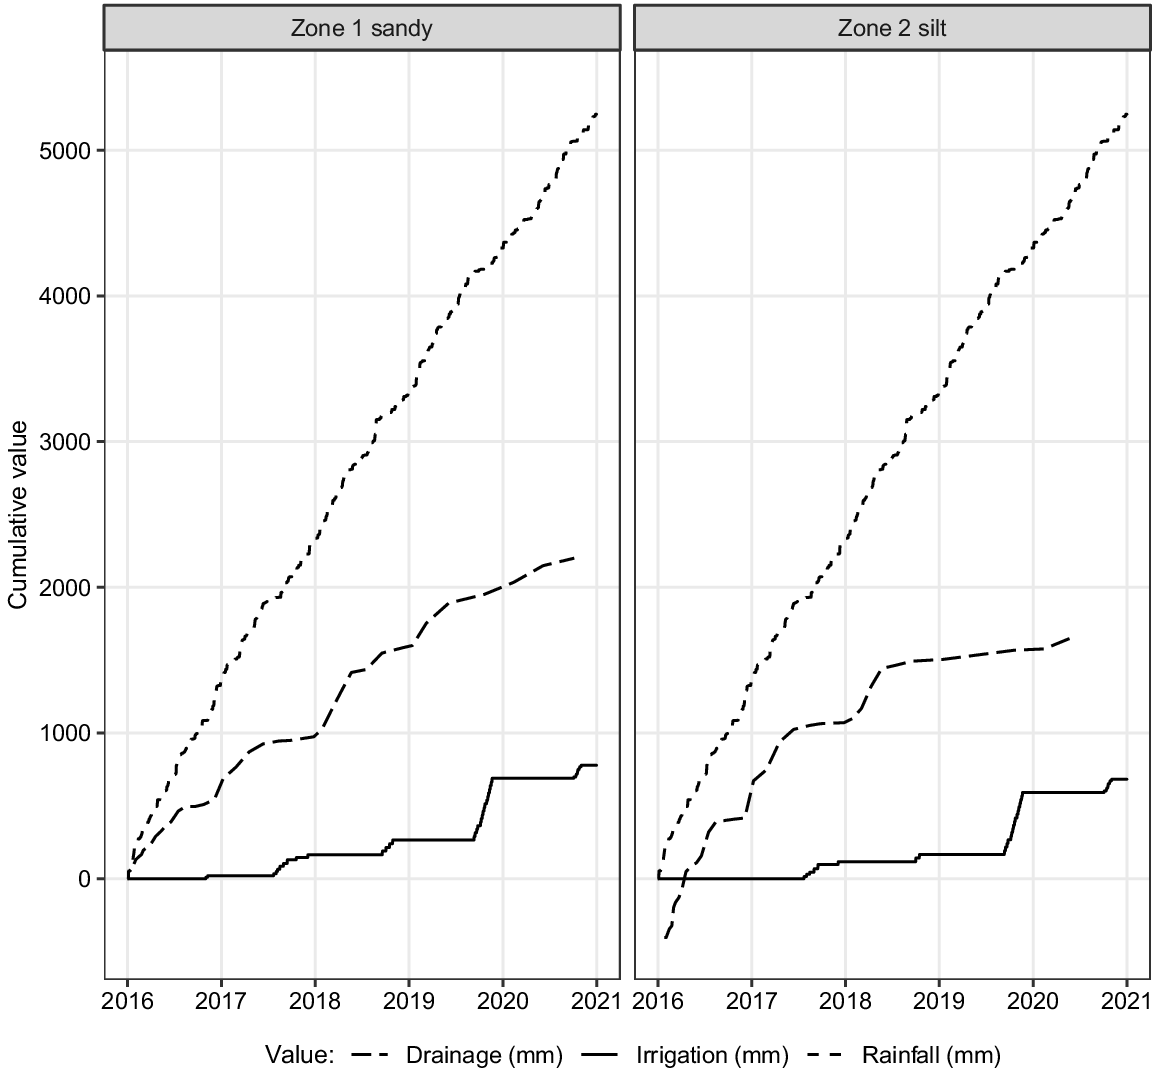
The relationship between SWB modelled and field-measured cumulative drainage over time for the zones using the matching procedure in the methods is shown in Fig. 2. For the modelled drainage on an annual basis, the drainage in Zone 1 was less variable between years than in Zone 2. The cumulative rainfall and irrigation are presented in Fig. 3.
Nutrient concentrations and loads
There is some evidence in Zone 1 drainage concentrations of an intra-annual trend, and this trend is consistent between the DFMs (Figs 4 and S2). In Zone 2, the DFMs had fewer samples beyond 2019, so given the shorter time (2016–2019), the intra-annual trend is not clear for Zone 2 (Fig. S2 in Supplementary material).
Drainage nutrient concentrations over time (points), with each curve corresponding to the GAM model estimate for a specific DFM, using a random effect for each DFM. The shaded region around each line indicates plus-or-minus one standard error for each prediction. Arrows correspond to dates when fertiliser were added in each zone. Note the vertical scale is logarithmic.
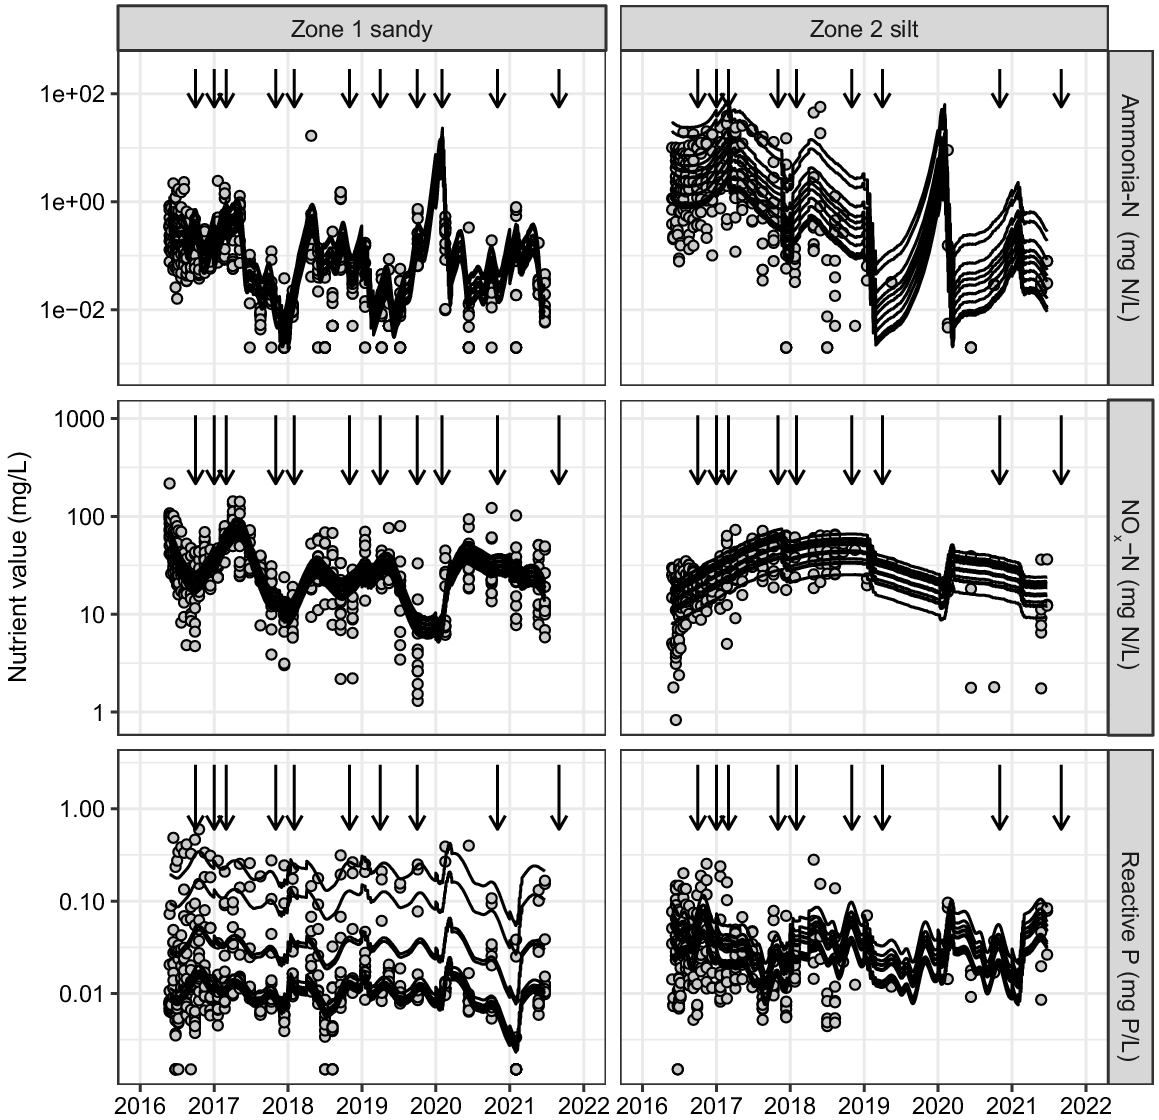
The nutrient concentrations over time using the GAM model are presented in Fig. 4. Ammonia-N data indicate an annual effect within Zone 1, but this is not clear for Zone 2. The difference in the predictions between DFMs in Zone 1 are quite small, but likely to be greater in Zone 2. The data for NOx-N suggests an annual effect within Zone 1, but not for Zone 2. For reactive P, the results suggest an annual effect within Zone 1, with large differences between DFMs (Fig. 4). For Zone 2, the reactive P differences between DFMs is not as large and the annual effect is less pronounced, in part likely due to sparse sampling from 2019. Overall, the adopted model gives a reasonable account of nutrient concentrations over time and between DFMs.
The timing of fertiliser application is shown by arrows shown in Fig. 4. Although variations in nutrient can be observed in Fig. 4, the relationship between the dates of fertiliser application and nutrient concentration variation is not clear. This is due, at least in part, to the seasonality in rainfall, irrigation, and the fertiliser application. A formal analysis of the relationship between these quantities would require considerably more time series data than are available.
The nutrient loads are presented in Fig. 5, showing the variability of individual points for each DFM, while the box plot corresponds to the value pooled over all DFMs (in each year and zone). Although variable, Zone 1 had mostly greater NOx-N loads than Zone 2 (Table 4). The dominant form was nitrate rather than ammonia-N (Table 4). The load of NOx-N during 2016 for both zones was greater than subsequent years (Fig. 5, Table 4). Zone 2 had greater variability in ammonia-N and NOx-N loads per DFM than Zone 1. Zone 1 had much greater variability in reactive P loads per DFM than Zone 2. There were no obvious patterns in annual nutrient loads with annual rainfall and irrigation. However, the ammonia-N annual loads in Zone 2 showed a general decreasing pattern with the decreasing annual rainfall during the period.
Nutrient loads (kg N/ha/year or kg P/ha/year) of ammonia-N, NOx-N and reactive phosphorus (P) for the two management zones, per year (1 July to 30 June). The points are for each DFM. The box plot is generated for the pooled value over all DFMs. For boxplots, the median is shown, and the boxes represent the inter-quartile range, (25th and 75th percentile), and whiskers represent 1.5 times the inter-quartile range. Note the scale is logarithmic.
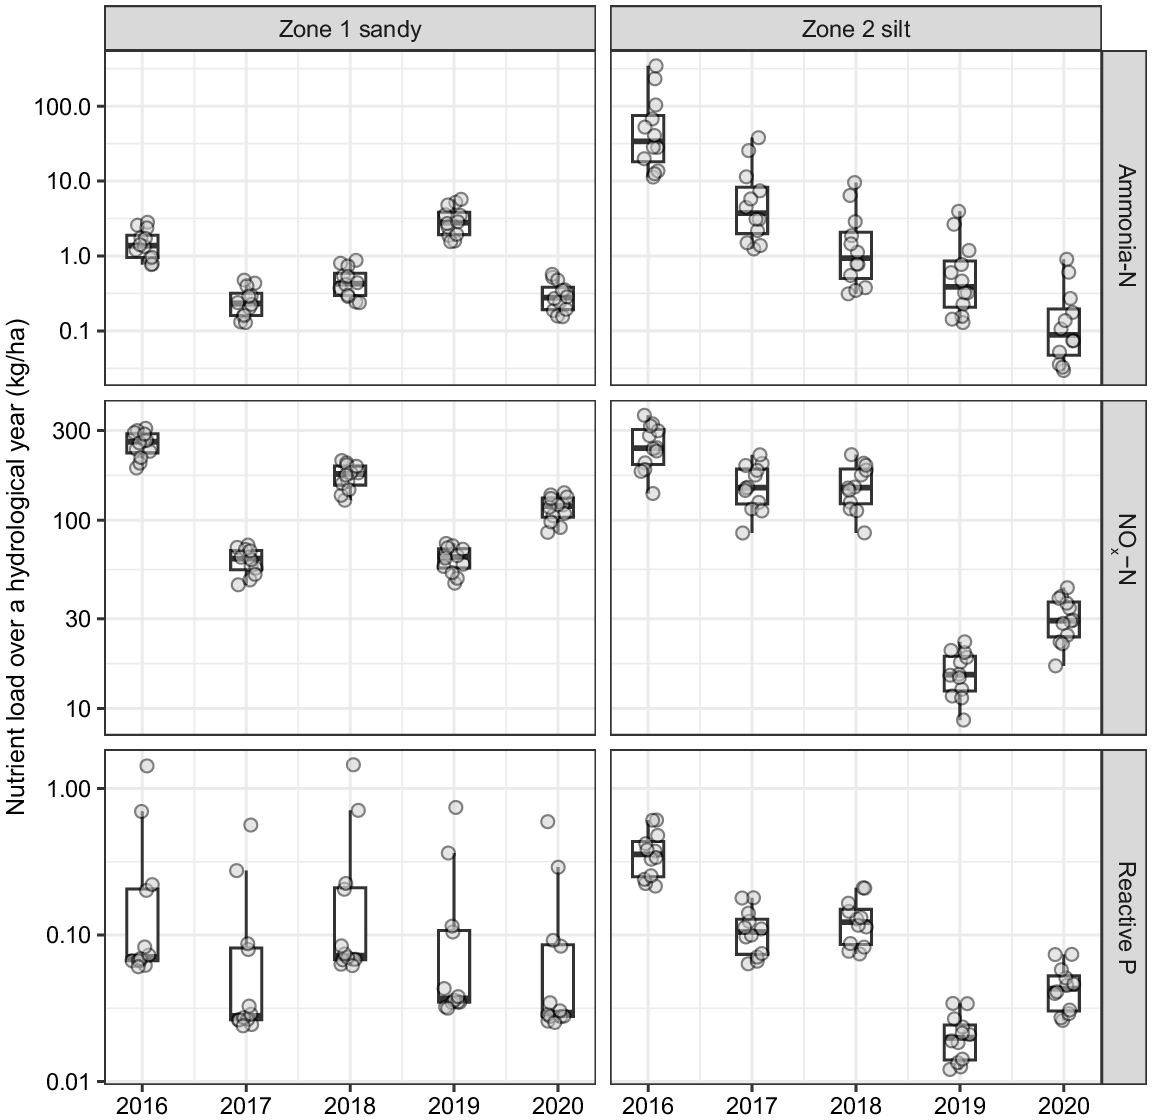
| Median nutrient leaching load | Zone | 2016 | 2017 | 2018 | 2019 | 2020 | |
|---|---|---|---|---|---|---|---|
| Ammonia-N | Zone 1 sandy | 1.38 | 0.23 | 0.43 | 2.79 | 0.28 | |
| Zone 2 silt | 34.4 | 3.78 | 0.95 | 0.39 | 0.09 | ||
| NOx-N | Zone 1 sandy | 261 | 62.6 | 176 | 63.9 | 119 | |
| Zone 2 silt | 242 | 149 | 149 | 15.1 | 29.3 | ||
| Reactive P | Zone 1 sandy | 0.071 | 0.028 | 0.072 | 0.037 | 0.03 | |
| Zone 2 silt | 0.356 | 0.105 | 0.123 | 0.02 | 0.043 |
As described in the methods, the model used for estimation of loads during each hydrological year included terms for cumulative rainfall and irrigation. A likelihood ratio test of models, with and without these terms, shows that both have a highly significant beneficial effect for reactive P (P < 0.01), but the benefits for NOx-N and ammonia-N are less convincing (P = 0.14 and P = 0.017, respectively). The benefit of including these terms is adding high temporal-frequency information, but when the load was estimated over a full hydrological year, that high-frequency information was largely lost. Thus, estimates of load over a full year differ by little, if the effects of rainfall and irrigation were included or excluded. Table S1 in the Supplementary material shows the absolute difference in the estimated median load for each hydrological year for all responses. There is no obvious pattern, except that perhaps differences are larger in the sandy soil.
In summary, the median load of NOx-N across all 5 years was 119 and 120 kg N/ha/year for Zones 1 and 2, respectively (Table 5). The mean load of NOx-N across all years was 133 and 121 kg N/ha/year for Zones 1 and 2, respectively. The mean load of reactive P across all 5 years was 0.17 and 0.14 kg P/ha/year for Zone 1 and Zone 2, respectively (Table 5). Table 5 presents the coefficient of variation (COV; ratio of the standard deviation to the mean). Since the mean was greater than the median, the results in Table 5 show that the distributions of each nutrient are right-skewed. The high COV values for ammonia-N and reactive P in zone 2 (i.e. high standard deviation relative to the mean) in Table 5 reflect the high variation in the nutrient load between hydrological years.
| Zone | Nutrient | Median load (kg/ha/year) | Mean load (kg/ha/year) | Standard deviation load (kg/ha/year) | Coefficient of variation | |
|---|---|---|---|---|---|---|
| Zone 1 sandy | Ammonia-N | 0.527 | 1.15 | 1.31 | 1.14 | |
| NOx-N | 119 | 133 | 77.1 | 0.58 | ||
| Reactive P | 0.067 | 0.17 | 0.30 | 1.72 | ||
| Zone 2 silt | Ammonia-N | 1.31 | 18.3 | 54.9 | 2.99 | |
| NOx-N | 120 | 121 | 96.6 | 0.80 | ||
| Reactive P | 0.08 | 0.14 | 0.14 | 1.05 |
Discussion
In Zone 1 (the deep free draining soil), regular collection of drainage samples occurred. However, from 2018, approximately a year and half after installation, there were fewer samples collected from DFMs from Zone 2 (the poorly drained soil). It is possible that preferential cracks caused by installation slowly reduced while the soil settled, or the DFM wick performance was not as effective later (but difficult to resolve once DFMs are installed), reducing drainage collected in Zone 2. Some DFMs were reported by Norris et al. (2023) to have large variations in drainage, so modelled drainage was needed for several sites. They reported it was more challenging to repack soil to replicate natural flow conditions in the heavy-textured soils, concluding the use of DFMs on clay loams is less appropriate than on freer draining soils. Similarly, Meissner et al. (2010) reported that DFMs work well in sandy soils, while other studies also reported high variability in drainage with DFMs and wick-based samplers (Zhu et al. 2002; Gee et al. 2009; Herath et al. 2014), requiring sufficient samplers to account for variability.
A key lesson from this study is that the later quarterly sampling was not frequent enough in either zone, versus the more frequent much earlier sampling. Regularity of sampling is beneficial for time series and regression analysis to provide adequate samples to determine the within-year, seasonal variation, and systematic trends in the long term. For example, sampling once a month for several years (but in conjunction with drainage events) is more valuable than much more frequent sampling for one early year, particularly if budget resourcing is limited, since the long-term trend in nutrient concentration changes in the first year or so after installation before settling into a regular pattern of response to rainfall and irrigation. Our statistical modelling approach gives a reasonable estimate of annual means, but the within-year variation is not reliable, so we have not reported seasonal differences. Moreover, the long-term trend in the rainfall-plus-irrigation response differs between zones, which necessitates regular sampling. In our case, it is likely that there was inadequate frequency of sampling after 2019, which limits the accuracy of estimated nutrient load in later years for each zone. The combined DFM and statistical modelling approach used in this study worked well for Zone 1 where regular collection of drainage samples occurred. However, as there were fewer samples collected from the Zone 2 DFMs, the statistical modelling approach was particularly important in Zone 2.
In this study, a wide range of crops were grown. The site is small and is a research site, hence some management practices may differ to commercial farms, so some nutrient concentrations in both soil and water may differ. Some practices at this site, for example, the incorporation of green legume stubble into soil rather than removal, is likely to generate more N. In contrast, mowing the plantain mixed pasture would be likely to generate less N leaching, compared with leaching under grazing by sheep. This study was not designed to evaluate specific practices, but rather to get a general sense of leaching losses under an irrigated mixed-cropping system, to identify the ability of DFMs to measure leaching losses and develop a procedure for processing data from DFMs.
A challenge in measuring nutrient leaching losses in cropping systems, is that they are typically measured over a single season or single crop, due to short crop rotations and practices such as cultivation (Norris et al. 2023). Annual NOx-N load in our study was broadly comparable given our long measurement period and methods. However, several studies (Francis 1995; Khaembah and Horrocks 2018) were conducted in drier regions, with less drainage occurring than in our study. A wide range of nutrient loads for mixed-cropping systems in New Zealand was reported as 1–113 kg N/ha/year (median 13.5) (Srinivasan et al. 2020), with details available elsewhere (Drewry 2018). Most of those mixed-cropping studies have focused on nitrate-N leaching from measurements (median 52 kg N/ha/year) or modelling (median 13 kg N/ha/year). Annual losses of nitrate-N (expressed as kg N/ha/year) from cropping studies include: 25–110 (Francis 1995), 12–20 (Khaembah and Horrocks 2018), 5–119 (Tsimba et al. 2021), 13–151 (average 57) (Norris et al. 2023), and c. 10–32 (Lisson and Cotching 2011), depending on climate, soil, crop, and management. For sheep- and beef-grazed pasture under uniformly applied irrigation, nutrient loads were 17–23 kg N/ha/year (Srinivasan et al. 2020). In contrast, simulated winter cattle grazing of fodder beet can have >200 kg N/ha leached, depending on soil and practices (Malcolm et al. 2022). Comparisons of nutrient losses between studies should be used as a broad guide, but with caution, due to different soils, crops, climates, and practices. Phosphorus loads for arable and mixed-cropping systems were 0.1–2.9 kg P/ha/year (median 0.1) (Srinivasan et al. 2020), but leaching contributed to c. 0.2 kg P/ha/year or less, in contrast to runoff (c. 2.6 kg P/ha/year) (Drewry 2018). However, this is based on very few P loss studies under cropping systems (Drewry 2018), so values should be used with caution. For comparison, DRP loss in runoff for sheep pasture systems were up to 0.15 kg P/ha/year in hill country (Lambert et al. 1985), while drainage leaching losses of FRP were up to 0.03 kg P/ha over 1.5 years in sheep-grazed winter forage crops (McDowell and Houlbrooke 2009). In our study, reactive P losses are broadly comparable to other studies, but there are few similar studies for comparison.
Overall, in our study, there was generally greater NOx-N leaching from the free draining zone 1. Zone 1 drainage was also temporally more responsive to irrigation and rain events than the poorly draining zone 2. The VRI system provided a system to control irrigation-related drainage and leaching in these two soil zones. The practical and broader significance of our results is that, where spatially variable soils (or crops) exist under irrigators, irrigation can be managed in specific zones to reduce irrigation-induced drainage and nutrient leaching. However, there were some significant rain events during the trial, which can override the impact of VRI.
Factors important in P loss include soil P concentration and the ability of soil to retain P: high soil P concentrations can pose a risk to water quality, while P leaching is typically greater in sandy soils (McDowell 2017; Macintosh et al. 2019; Drewry et al. 2021b). Soil Olsen P agronomic targets in New Zealand for sheep-grazed pastures are 20–30 mg/L (Morton and Roberts 2009). Targets for crops include: high yielding oats (20 mg/L, 0–15 cm), peas (10 mg/L) (Nicholls et al. 2009), and for cropping soil quality (20–40 mg/kg) (Drewry et al. 2021b). In New Zealand, industry-derived Olsen P target values are reported volumetrically, whereas regional authority soil quality values are reported gravimetrically, with further details elsewhere (Drewry et al. 2022c). Median Olsen P concentrations were 57 and 46 mg/kg (0–20 cm) for Zone 1 and 2 respectively. This suggests concentrations are higher than required, and associated risk of P leaching is also higher, so mitigation measures (such as reducing the rates of P fertiliser) could be adopted. Soil P can take many years to decline depending on practices and mitigation strategies (Dodd et al. 2014; McDowell and Smith 2023).
Drainage fluxmeters have several advantages such as ease of management, cost effectiveness, and their ability to capture drainage events. However, there are disadvantages, including the small spatial representation due to their small cross-sectional size, so sufficient replication is required. After installation, there is a period while the soil settles which may affect drainage and concentrations. Considerable effort was made to model the SWB, drainage, and losses in our approach. We agree with Norris et al. (2023) that if DFMs become more widely available, that technical skill is needed to interpret the data. Several suggested improvements to DFMs have been reported, including the use of a one-way valve system to prevent backflow from temporary high water tables and reducing the constructed depth of the DFM (Meissner et al. 2010). From our experience, several potential improvements could be made to the DFMs including automating some components with digital recording and interfaces, providing compartments for multiple samples, and use of emerging sensor technology for water quality. Further refinement of wick lengths would be useful to ensure DFMs can be used more efficiently in soils that are not free draining. The wick length could be scaled to approximate the tension exerted by the different matrix of the silt loam versus the sandy soil.
Conclusions
The DFMs in this study worked well for the free draining soil, but fewer drainage samples were collected in the Zone 2 poorly drained soil. The combined soil water balance and statistical modelling data were needed to determine nutrient losses. The nutrient concentrations in Zone 1 had some evidence of an intra-annual trend, but this was not clear for Zone 2. The nutrient concentrations and loads generally had greater uncertainty in Zone 2. Some management practices may differ compared with commercial farms, so caution should be applied in extrapolating these results. Our approach gave a reasonable estimate of annual leaching load means, but the within-year variation was not reliable, so we have not reported seasonal differences. This was partly as the sampling in the later period was less frequent. An implication for future research is ensuring regularity of sampling in the long term, with careful interpretation of the data. With some exceptions, there was generally more NOx-N leaching from the free draining Zone 1. Zone 1 drainage was temporally more responsive to irrigation and rain events than Zone 2. However, the estimates of nutrient loads over a full year differed by little, if the effects of rainfall and irrigation model terms were included or excluded. The VRI system provided a system to control irrigation-related drainage and leaching in these two soil zones. Where spatially variable soils (or crops) exist under irrigators, irrigation can be managed in specific zones to reduce irrigation-induced drainage and nutrient leaching. Given the lack of published data, this study has improved knowledge of nutrient leaching losses under zone-specific irrigated mixed-cropping systems in a temperate climate.
Data availability
The data that support this study cannot be publicly shared due to ethical or privacy reasons and may be shared upon reasonable request to the corresponding author if appropriate.
Declaration of funding
Funding was provided by the New Zealand Ministry of Business, Innovation and Employment (MBIE) Strategic Science Investment Funded (SSIF). Funding was also provided in part by the Manaaki Whenua – Landcare Research and Plant and Food Research led Endeavour programme, Maximising the Value of Irrigation, (contract CO9X1309).
Acknowledgements
The project research was a collaboration between Manaaki Whenua – Landcare Research and Massey University. From Plant and Food Research we thank Steve Green for initial advice, provision of the DFMs and help with their installation, and providing the customised pumping system; Carlo van den Dijssel for assistance with DFM installation; and Brent Clothier for initial advice. We thank Massey University for use of the site and Mark Osborne for managing the farm operations and providing farm management information. From Manaaki Whenua – Landcare Research, we thank Pierre Roudier and John Dando for assistance with DFM installation, Jagath Ekanayake for providing telemetry, installation assistance, and discussions about potential DFM improvements, Paul Peterson for field assistance, Sujatha Senanayake and the Environmental Chemistry laboratory team for water quality analyses, and colleagues for reviewing the manuscript and editing.
References
Allen RG, Pereira LS, Raes D, Smith M (1998) Crop evapotranspiration. Guidelines for computing crop water requirements. FAO Irrigation and drainage paper No. 56. Food and Agriculture Organization of the United Nations, Rome. Available at https://www.researchgate.net/publication/284300773 [Verified 11 June 2018]
Barros R, Isidoro D, Aragüés R (2012) Irrigation management, nitrogen fertilization and nitrogen losses in the return flows of La Violada irrigation district (Spain). Agriculture, Ecosystems & Environment 155, 161-171.
| Crossref | Google Scholar |
Camporese M, Gumiere SJ, Putti M, Botter G (2021) Efficient irrigation of maize through soil moisture monitoring and modeling. Frontiers in Water 3, 627551.
| Crossref | Google Scholar |
Chappell PR (2015) The climate and weather of Manawatu-Wanganui. NIWA Science and Technology Series 66. NIWA, Wellington. Available at https://niwa.co.nz/sites/niwa.co.nz/files/NIWA_ManawatuWanganui_Climate_WEB.PDF [Verified 31 May 2018]
Cherubin MR, Karlen DL, Franco ALC, Tormena CA, Cerri CEP, Davies CA, Cerri CC (2016) Soil physical quality response to sugarcane expansion in Brazil. Geoderma 267, 156-168.
| Crossref | Google Scholar |
Dodd RJ, McDowell RW, Condron LM (2014) Is tillage an effective method to decrease phosphorus loss from phosphorus enriched pastoral soils? Soil and Tillage Research 135, 1-8.
| Crossref | Google Scholar |
Drewry JJ, Manderson AK, Hedley CB (2019) Evaluation of irrigation strategies for arable farms to mitigate nitrogen loss using the OVERSEER model. In ‘Nutrient loss mitigations for compliance in agriculture. Vol. Occasional Report No. 32’. (Eds LD Currie, CL Christensen) pp. 1–11. (Fertilizer and Lime Research Centre, Massey University: Palmerston North) Available at http://flrc.massey.ac.nz/publications.html [Verified 21 February 2019]
Drewry JJ, Carrick S, Penny V, Houlbrooke DJ, Laurenson S, Mesman NL (2021a) Effects of irrigation on soil physical properties in predominantly pastoral farming systems: a review. New Zealand Journal of Agricultural Research 64(4), 483-507.
| Crossref | Google Scholar |
Drewry JJ, Cavanagh J-AE, McNeill SJ, Stevenson BA, Gordon DA, Taylor MD (2021b) Long-term monitoring of soil quality and trace elements to evaluate land use effects and temporal change in the Wellington region, New Zealand. Geoderma Regional 25, e00383.
| Crossref | Google Scholar |
Drewry JJ, McNeill SJ, Carrick S, Lynn IH, Eger A, Payne J, Rogers G, Thomas SM (2021c) Temporal trends in soil physical properties under cropping with intensive till and no-till management. New Zealand Journal of Agricultural Research 64(2), 223-244.
| Crossref | Google Scholar |
Drewry JJ, Carrick S, Penny V, Dando JL, Koele N (2022a) Effect of irrigation on soil physical properties on temperate pastoral farms: a regional New Zealand study. Soil Research 60(8), 760-771.
| Crossref | Google Scholar |
Drewry JJ, Hedley C, Sharp J, Thomas S, Wallace D, El-Naggar A, Roudier P, Ekanayake J, Clothier B (2022b) Improving irrigation efficiency using soil water management and proximal soil sensing. In ‘Adaptive strategies for future farming. Vol. Occasional report No. 34’. (Eds CL Christensen, DJ Horne, R Singh) pp. 1–9. (Farmed Landscapes Research Centre, Massey University: Palmerston North) Available at http://flrc.massey.ac.nz/publications.html [Verified 26 April 2022]
Drewry JJ, Stevenson BA, McNeill SJ, Cavanagh J-AE, Taylor MD (2022c) Impact of volumetric versus gravimetric assessment on Olsen P concentrations. New Zealand Journal of Agricultural Research 65(6), 463-483.
| Crossref | Google Scholar |
Eger A, Stevenson BA, Theng B, Rhodes P, Fraser S, Penny V, Burge OR (2023) Long-term effects of fertilizer application and irrigation on soils under pasture land use. Journal of Soil Science and Plant Nutrition 23, 801-818.
| Crossref | Google Scholar |
El-Naggar AG, Hedley CB, Horne D, Roudier P, Clothier BE (2020) Soil sensing technology improves application of irrigation water. Agricultural Water Management 228, 105901.
| Crossref | Google Scholar |
El-Naggar AG, Hedley CB, Roudier P, Horne D, Clothier BE (2021) Imaging the electrical conductivity of the soil profile and its relationships to soil water patterns and drainage characteristics. Precision Agriculture 22, 1045-1066.
| Crossref | Google Scholar |
Francis GS (1995) Management practices for minimising nitrate leaching after ploughing temporary leguminous pastures in Canterbury, New Zealand. Journal of Contaminant Hydrology 20(3–4), 313-327.
| Crossref | Google Scholar |
Gee GW, Ward AL, Caldwell TG, Ritter JC (2002) A vadose zone water fluxmeter with divergence control. Water Resources Research 38(8), 16-1-16-7.
| Crossref | Google Scholar |
Gee GW, Newman BD, Green SR, Meissner R, Rupp H, Zhang ZF, Keller JM, Waugh WJ, van der Velde M, Salazar J (2009) Passive wick fluxmeters: design considerations and field applications. Water Resources Research 45(4), W04420.
| Crossref | Google Scholar |
González Perea R, Daccache A, Rodríguez Díaz JA, Camacho Poyato E, Knox JW (2018) Modelling impacts of precision irrigation on crop yield and in-field water management. Precision Agriculture 19(3), 497-512.
| Crossref | Google Scholar |
Gradwell MW, Birrell KS (1979) Methods for physical analysis of soils. New Zealand Soil Bureau scientific report 10C. (Department of Scientific and Industrial Research: Lower Hutt) Available at https://doi.org/10.7931/dl1-sbsr-10c [Verified 19 July 2018]
Graham SL, Laubach J, Hunt JE, Mudge PL, Nuñez J, Rogers GND, Buxton RP, Carrick S, Whitehead D (2022) Irrigation and grazing management affect leaching losses and soil nitrogen balance of lucerne. Agricultural Water Management 259, 107233.
| Crossref | Google Scholar |
Gray CW, McDowell RW, Graham SL, Hunt JE, Laubach J, Rogers GND, Carrick S, Whitehead D (2021) Phosphorus transport in subsurface flow from a stony soil under irrigated and non-irrigated lucerne. New Zealand Journal of Agricultural Research 64(3), 429-443.
| Crossref | Google Scholar |
Grizzetti B, Vigiak O, Udias A, Aloe A, Zanni M, Bouraoui F, Pistocchi A, Dorati C, Friedland R, De Roo A, Benitez Sanz C, Leip A, Bielza M (2021) How EU policies could reduce nutrient pollution in European inland and coastal waters. Global Environmental Change 69, 102281.
| Crossref | Google Scholar | PubMed |
Hedley C (2015) The role of precision agriculture for improved nutrient management on farms. Journal of the Science of Food and Agriculture 95(1), 12-19.
| Crossref | Google Scholar | PubMed |
Hedley CB, Yule IJ, Tuohy MP, Vogeler I (2009) Key performance indicators for simulated variable-rate irrigation of variable soils in humid regions. Transactions of the ASABE 52(5), 1575-1584.
| Crossref | Google Scholar |
Hedley CB, Roudier P, Peterson P (2016) Gamma soil surveys – investigating soil patterns for nutrient and water management. In ‘Integrated nutrient and water management for sustainable farming. Vol. Occasional Report No. 29’. (Eds LD Currie, R Singh) pp. 1–8. (Fertilizer and Lime Research Centre, Massey University) Available at http://flrc.massey.ac.nz/workshops/16/Manuscripts/Paper_Hedley_2016.pdf [Verified 24 July 2018]
Herath I, Green S, Horne D, Singh R, Clothier B (2014) Quantifying and reducing the water footprint of rain-fed potato production, part I: measuring the net use of blue and green water. Journal of Cleaner Production 81, 111-119.
| Crossref | Google Scholar |
IUSS Working Group WRB (2015) World reference base for soil resources 2014, update 2015. International soil classification system for naming soils and creating legends for soil maps. FAO Number World Soil Resources Reports No. 106. (FAO: Rome) Available at https://www.fao.org/3/i3794en/I3794en.pdf
Karakkattu KK, Hedley C, El-Naggar A, Ekanayake J, Drewry J, Horne D, Clothier B (2020) Three years of drainage fluxmeter measurements under a variable rate centre pivot–how do they relate to soil, climate and irrigation?. In ‘Nutrient management in farmed landscapes. Vol. Occasional Report No. 33’. (Eds CL Christensen, DJ Horne, R Singh) pp. 1–9. (Farmed Landscapes Research Centre, Massey University: Palmerston North) Available at http://flrc.massey.ac.nz/publications.html [Verified 5 August 2020]
Khaembah EN, Horrocks A (2018) A modelling approach to assessment and improvement of nitrogen management on New Zealand arable farms: a case study. Agronomy New Zealand 48, 1-11.
| Google Scholar |
Koppe E, Rupollo CZ, de Queiroz R, Uteau Puschmann D, Peth S, Reinert D (2021) Physical recovery of an oxisol subjected to four intensities of dairy cattle grazing. Soil and Tillage Research 206, 104813.
| Crossref | Google Scholar |
Lambert MG, Devantler BP, Nes P, Penny PE (1985) Losses of nitrogen, phosphorus, and sediment in runoff from hill country under different fertiliser and grazing management regimes. New Zealand Journal of Agricultural Research 28(3), 371-379.
| Crossref | Google Scholar |
Lambie SM, Mudge PL, Stevenson BA (2021) Microbial community composition and activity in paired irrigated and non-irrigated pastures in New Zealand. Soil Research 60(4), 337-348.
| Crossref | Google Scholar |
Lisson SN, Cotching WE (2011) Modelling the fate of water and nitrogen in the mixed vegetable farming systems of northern Tasmania, Australia. Agricultural Systems 104(8), 600-608.
| Crossref | Google Scholar |
Loo SE, Zebarth BJ, Ryan MC, Forge TA, Cey EE (2019) Quantifying nitrate leaching under commercial red raspberry using passive capillary wick samplers. Vadose Zone Journal 18(1), 1-12.
| Crossref | Google Scholar |
Lynam T, Drewry J, Higham W, Mitchell C (2010) Adaptive modelling for adaptive water quality management in the Great Barrier Reef region, Australia. Environmental Modelling & Software 25(11), 1291-1301.
| Crossref | Google Scholar |
Macintosh KA, Doody DG, Withers PJA, McDowell RW, Smith DR, Johnson LT, Bruulsema TW, O’Flaherty V, McGrath JW (2019) Transforming soil phosphorus fertility management strategies to support the delivery of multiple ecosystem services from agricultural systems. Science of The Total Environment 649, 90-98.
| Crossref | Google Scholar | PubMed |
Macintosh KA, McDowell RW, Wright-Stow AE, Depree C, Robinson GM (2021) National-scale implementation of mandatory freshwater farm plans: a mechanism to deliver water quality improvement in productive catchments in New Zealand? Nutrient Cycling in Agroecosystems 120(2), 121-129.
| Crossref | Google Scholar |
Malcolm BJ, Cameron KC, Beare MH, Carrick ST, Payne JJ, Maley SC, Di HJ, Richards KK, Dalley DE, de Ruiter JM (2022) Oat catch crop efficacy on nitrogen leaching varies after forage crop grazing. Nutrient Cycling in Agroecosystems 122, 273-288.
| Crossref | Google Scholar |
Manaaki Whenua – Landcare Research (2021) Water testing. Available at https://www.landcareresearch.co.nz/partner-with-us/laboratories-and-diagnostics/environmental-chemistry-laboratory/water-testing/ [Verified 17 September 2021]
Mayel S, Jarrah M, Kuka K (2021) How does grassland management affect physical and biochemical properties of temperate grassland soils? A review study. Grass and Forage Science 76, 215-244.
| Crossref | Google Scholar |
McDowell RW (2017) Does variable rate irrigation decrease nutrient leaching losses from grazed dairy farming? Soil Use and Management 33(4), 530-537.
| Crossref | Google Scholar |
McDowell RW, Houlbrooke DJ (2009) Management options to decrease phosphorus and sediment losses from irrigated cropland grazed by cattle and sheep. Soil Use and Management 25(3), 224-233.
| Crossref | Google Scholar |
McDowell RW, Smith LC (2023) The longevity of cultivation in decreasing the potential for phosphorus loss in runoff. Soil and Tillage Research 227, 105618.
| Crossref | Google Scholar |
McDowell RW, Monaghan RM, Smith C, Manderson A, Basher L, Burger DF, Laurenson S, Pletnyakov P, Spiekermann R, Depree C (2021) Quantifying contaminant losses to water from pastoral land uses in New Zealand III. What could be achieved by 2035? New Zealand Journal of Agricultural Research 64(3), 390-410.
| Crossref | Google Scholar |
Meissner R, Rupp H, Seeger J, Ollesch G, Gee GW (2010) A comparison of water flux measurements: passive wick-samplers versus drainage lysimeters. European Journal of Soil Science 61(4), 609-621.
| Crossref | Google Scholar |
Monaghan R, Manderson A, Basher L, Spiekermann R, Dymond J, Smith C, Muirhead R, Burger D, McDowell R (2021) Quantifying contaminant losses to water from pastoral landuses in New Zealand II. The effects of some farm mitigation actions over the past two decades. New Zealand Journal of Agricultural Research 64(3), 365-389.
| Crossref | Google Scholar |
Norris M, Johnstone PR, Green SR, Trolove SN, Liu J, Arnold N, Sorensen I, van den Dijssel C, Dellow S, van der Klei G, Wright P, Clark G, Cummins M, Bromley S, Wallace D (2023) Using drainage fluxmeters to measure inorganic nitrogen losses from New Zealand’s arable and vegetable production systems. New Zealand Journal of Crop and Horticultural Science 51(2), 274-296.
| Crossref | Google Scholar |
O’Shaughnessy SA, Evett SR, Colaizzi PD, Andrade MA, Marek TH, Heeren DM, Lamm FR, LaRue JL (2019) Identifying advantages and disadvantages of variable rate irrigation: an updated review. Applied Engineering in Agriculture 35(6), 837-852.
| Crossref | Google Scholar |
Pollok J, Nelson P, Touhy M, Gillingham S, Alexander M (2003) Massey University soil map. Massey University, Palmerston North. Available at arcgisweb.massey.ac.nz
R Core Team (2022) ‘R: a language and environment for statistical computing.’ (R Foundation for Statistical Computing) Available at https://www.R-project.org/ [Verified 19 January 2023]
Rodriguez MJ, Navarrete S, Horne DJ, Hanly JA, Bishop P, Kemp PD (2023) Can secondary metabolites of plantain reduce N losses from urine patches? New Zealand Journal of Agricultural Research 66(1), 83-100.
| Crossref | Google Scholar |
Snelder TH, Whitehead AL, Fraser C, Larned ST, Schallenberg M (2020) Nitrogen loads to New Zealand aquatic receiving environments: comparison with regulatory criteria. New Zealand Journal of Marine and Freshwater Research 54(3), 527-550.
| Crossref | Google Scholar |
Srinivasan MS, Muirhead RW, Singh SK, Monaghan RM, Stenger R, Close ME, Manderson A, Drewry JJ, Smith LC, Selbie D, Hodson R (2020) Development of a national-scale framework to characterise transfers of N, P and Escherichia coli from land to water. New Zealand Journal of Agricultural Research 64(3), 286-313.
| Crossref | Google Scholar |
Tsimba R, Gunn T, Densley R, Williams I, Edmeades G, Millar J (2021) Quantification and mitigation of nitrogen leaching in a maize silage cropping system. Journal of New Zealand Grasslands 83, 163-170.
| Crossref | Google Scholar |
Viglizzo EF, Frank FC, Carreño LV, Jobbágy EG, Pereyra H, Clatt J, Pincén D, Ricard MF (2011) Ecological and environmental footprint of 50 years of agricultural expansion in Argentina. Global Change Biology 17(2), 959-973.
| Crossref | Google Scholar |
Vogeler I, Thomas S, van der Weerden T (2019) Effect of irrigation management on pasture yield and nitrogen losses. Agricultural Water Management 216, 60-69.
| Crossref | Google Scholar |
Zhu Y, Fox RH, Toth JD (2002) Leachate collection efficiency of zero-tension pan and passive capillary fiberglass wick lysimeters. Soil Science Society of America Journal 66(1), 37-43.
| Crossref | Google Scholar |