

Pesticide extraction from soil into runoff in North American and Australian croplands
D. Mark Silburn A B * and M. H. Crawford C D
A
B
C
D
Abstract
Do some pesticides run off more than others? How does pesticide runoff vary with pesticide properties?
Improve understanding of pesticide runoff from croplands.
Concentrations in surface soil and in runoff from three Australian rainfall simulation studies and three rainfall simulation and five catchment studies in North American croplands were used. The ratio of event averaged runoff concentrations and the surface soil concentrations is the runoff extraction ratio.
Pesticide runoff concentrations were closely related to soil surface concentrations at the start of rainfall. Runoff extraction ratios were not significantly different for 13 pesticides with a wide range of properties, on gentle slopes (0–3%), but were significantly lower for three pesticides. On steeper slopes, runoff extraction was significantly greater for atrazine but lower for glyphosate and metolachlor. Low sloping, furrow irrigated fields had low sediment concentrations and low pesticide runoff concentrations for more tightly sorbed pesticides, but not for less sorbed pesticides. Runoff extraction was not significantly different for simulated and most catchment studies.
Similar runoff extraction ratios were due to similar hydrology and limited sediment concentrations. Different runoff extraction occurs on bare soil if (a) pesticides are leached from the runoff-mixing layer, requiring sorption coefficients less than two and significant infiltration, and no interflow, (b) sediment concentrations are either low (<2 g L−1) or high (>100 g L−1) and (c) pesticides have different concentration profiles in the runoff-mixing layer.
Conditions studied apply for croplands in the North American mid-west on silty soils and for Australian clay soils.
Keywords: croplands, herbicides, insecticides, partition coefficients, pesticide runoff, rainfall simulator, runoff risk, soil concentrations.
Introduction
To quote Wauchope et al. (1992), ‘A principal goal of pesticide science is to … predict the environmental impact of a pesticide’. Pesticide runoff losses to receiving waters can cause environmental impacts. Pesticide runoff is the transport of pesticides dissolved in solution or sorbed to sediment. A major reason for poor understanding of pesticide runoff losses is that the literature presents a seemingly random collection of runoff concentrations, which are only predictable to within about an order of magnitude (Wauchope and Leonard 1980). Most plot or small catchment studies of pesticide runoff involve few pesticides. It is difficult to know if the pesticide runoff observed is due to pesticide properties or study conditions, for instance event timing after spraying. There are many pesticides (>400), with a wide range in chemical properties (Hornsby et al. 1996). Pesticide runoff is the outcome of a series of processes, which may be affected by pesticide properties, namely application rate, dissipation, leaching, partitioning, runoff extraction, runoff transport, sediment deposition and dilution. These processes can operate on pesticides on the plant canopy, crop residues and the surface soil layer. The amount of pesticide applied is important in determining the amount lost in runoff (Melland et al. 2016; Fillols et al. 2020; Silburn et al. 2023). Because of pesticide dissipation, timing of runoff after application is important. Thus, runoff concentrations are usually greatest in the first event after application and decline through time (e.g. Glenn and Angle 1987; Isennsee and Sadeghi 1993).
Baker (1980), Leonard et al. (1979), Spencer et al. (1985) and Silburn (2023) found strong relationships between pesticide concentrations in runoff and in the soil surface. The approach taken here, outlined in a conceptual framework below, is simple and empirical. It offers a framework for interpreting pesticide runoff based on Silburn and Kennedy (2007) and Silburn (2023). The aim was to investigate pesticide runoff extraction from soil, using data for pesticide concentrations in runoff and in the soil, for pesticides of contrasting properties. Data were from Australian rainfall simulator studies and North American cropland catchments and rainfall simulator studies.
Conceptual framework
Silburn (2023) outlined a conceptual framework for pesticide runoff, which is summarised here. Transfer of chemicals from the soil into runoff during a rainfall event is the outcome of the following processes. During rainfall, chemicals leach downwards into the soil, depending on the infiltration amount and sorption properties of the chemical and the soil. Next, extraction from the soil into runoff occurs, in the water phase and by sediment entrainment. There is a positive correlation between water and sediment phase extraction (Sharpley 1985; Ahuja 1986). The amount of chemical available for runoff extraction and movement downwards depends on the concentration in the soil surface, in a layer termed the runoff-mixing layer. An ‘effective depth of interaction’ can be defined, which is only 2–3 mm thick (Ahuja 1986) but in practice 5–25 mm soil layers are sampled. The chemical distribution with depth in the soil surface layer is important but unknown. For the sediment-sorbed component, runoff concentrations of strongly sorbed chemicals are generally 1–10 times the soil concentrations (Leonard et al. 1979; Willis et al. 1983). This is because of size-selective erosion (enrichment) and differences in the concentrations in the depth of the soil sampled and the eroded depth. Pesticide concentrations extracted into runoff are also affected by the concentration profile within the soil surface layer (Baker 1980), which will change through time after application.
Leaching through the runoff-mixing layer continues throughout a rainfall event. Chemicals that are weakly sorbed have exponentially decreasing concentrations (C) with time (t), i.e. C(t) = C0 exp[−(flow/volume)t] (Baker 1980; Ahuja and Lehman 1983). This equation can be formulated to account for sorption. Truman et al. (1998) confirmed the exponential decline in soil surface concentrations under rainfall experimentally for atrazine. Chemicals that are strongly sorbed to soil will be unaffected by this process.
Where leaching is restricted by moist, compacted subsoil, the soil concentration will be diluted into the rainfall volume and transferred into runoff rather than into the leachate. Runoff concentrations are then 1–2 orders of magnitude higher than where leaching is unrestricted (Ahuja and Lehman 1983). Snyder and Woolhiser (1985) observed significant exfiltration on sloping flumes, which increased dye removal in runoff; dissolved chemicals were contributed as ‘interflow’ [as explained by Loch et al. (1987)] as well as by surface extraction. In brief, interflow is water flowing through the soil surface layers, for example the tilled layer of a cultivated soil or the A horizon of a duplex soil, whereas overland flow is runoff flowing across the soil surface. Indeed, Barnett et al. (1972) found runoff concentrations were highest for all nutrients when interflow occurred rather than overland flow, on steep slopes. Wang et al. (2022) found that interflow was the main loss pathway for nitrate-nitrogen whereas the main loss pathway for more sorbed compounds (e.g. ammonium) was surface runoff. Edwards et al. (1980) observed lower glyphosate runoff concentrations from interflow than overland flow, due to topsoil ‘filtering’ the glyphosate (i.e. adsorption). Thus, chemicals need to be weakly sorbed to be transported in interflow.
In summary, the main processes that affect extraction of chemicals into runoff after application amount and dissipation are leaching and dilution of solutes (increasingly for more weakly sorbed pesticides) and sediment transport (increasingly for strongly sorbed pesticides). Both processes are affected by pesticide sorption and hydrology (including interflow) and the concentration profile in the surface soil.
Runoff extraction ratios
Baker (1980) and Leonard et al. (1979) give non-linear equations relating event runoff pesticide concentrations (CRO μg L−1) to soil concentrations (C′SOIL mg kg−1) for poorly sorbed and tightly sorbed chemicals (Silburn 2023) where the slope was E and the exponent P1. Leonard et al. (1979) conceptualised coefficient E as an ‘extraction coefficient’ for poorly sorbed pesticides and an ‘enrichment factor’ for sorbed pesticides. Exponent P1 represents non-linearity and was 1.2 (Leonard et al. 1979) or 1.03 (Baker 1980) for poorly sorbed pesticides, reflecting changing extraction efficiency and distribution in the surface soil with time of contact. Higher soil concentrations were related to more recent applications. The P1 was 0.83 for sorbed pesticides (Leonard et al. 1979), indicating a changing sediment composition with sediment concentration, consistent with size-selective deposition and more clay and organic matter in finer sediment. Silburn (2023) found soil and runoff concentrations were linearly related, because they did not include longer times after application (>50 days); these data are suitable for the highest risk period. Assuming linearity, the runoff extraction (ERO) follows:
The maximum potential runoff concentration (Silburn 2023) is where the runoff concentration is equal to the pesticide mass in the mixing-layer divided by the rainfall volume. For sediment sorbed chemicals, maximum potential runoff concentration (or no-enrichment runoff concentration) equals the soil concentration multiplied by the sediment concentration. If sediment enrichment occurs, pesticide runoff concentration is greater than this value; if the pesticide is desorbed from the soil/sediment, it is less than this value.
Methods
Experimental outline
Data were used for soil pesticide concentrations before rain and event mean concentrations in runoff for Australian rainfall simulation studies (Silburn 2023) and North American rainfall simulator and catchment studies. Properties of the pesticides studied are given in Table 1.
| Pesticide (common name) | Type and class | Solubility in water (mg L−1) | Soil sorption KOC (L kg−1) | Field dissipation half-life (days) | Vapour pressure (mPa) | Volatility rating | |
|---|---|---|---|---|---|---|---|
| Insecticides | |||||||
| Chlorpyrifos | Organophosphate (OP) | 1.05 | 5509 | 28 | 2.26 | Low | |
| Dimethoate | OP | 25,900 | 20 | 7 | 3.32, 1.1 | Neg. | |
| Profenofos | OP | 28 | 2000 | 7 | 2.5, 0.12 | Low | |
| Endosulfan | Cyclodiene | 0.32 | 11,500 | 86R/50 | 0.023, 0.83 | High | |
| α-isomer | Organochlorine | 0.53CB | 4000A | 6.08CB | |||
| β-isomer | 0.28CB | 20,000A | 3.04CB | ||||
| Sulfate | 0.17CH | 7240B | – | ||||
| Herbicides | |||||||
| Diuron | Phenylurea, non-ionic | 42 | 680 R/480 | 229R/90 | 0.009 | Neg. | |
| Fluometuron | Phenylurea, weakly acidic, non-ionic | 110 | 100 | 90R | 0.125 | Neg. | |
| Metolachlor | Substituted acetamide | 530 | 120R/200 | 21R/90 | 4.17, 2.7 | Neg. | |
| Pendimethalin | Dinitroaniline | 0.275 | 17,490R/5000 | 101R/90 | |||
| Prometryn | s-triazine, basic | 33 | 400 | 60 | 0.27, 0.165 | Neg. | |
| Pyrithiobac sodiumC | Pyrimidinyl carboxyl very polar, anionic | 264,000 pH5, 705,000 pH7, 690,000 pH9 | 5–35, 9−21U increase with pH | 60R 11, 14, 46U decrease with pH | <4.8 × 10⁻⁶ | Neg. | |
| Additional in simulated rainfall runoff studies | |||||||
| Parathion-methyl | OP | 60 | 5100 | 5 | 1.99, 0.4 | Neg. | |
| Monocrotophos | OP | 106 | 1 (est.) | 30 | 21.3, 9.3 | Neg. | |
| DDEU,H | DDT residue | 0.1 (est) | 151,000R/50,000H | 1000 (2–16 years) | –, 0.86 | Significant | |
| DDTH | Organochlorine | 0.025 | (0.38–0.88) × 106 | Significant | |||
| Trifluralin | Dinitroaniline, non-ionic | 0.221 | 15,800 | 170R (57–126) | 13.7, 14.6 | Significant | |
Class is according to Weber (1972). Vapour pressures from Weber (1994) and Tomlin (1994) are given where published values differ. Volatility is based on Henry’s coefficient (KH) from Wauchope et al. (1992), with ratings of Gerritse et al. (1991) – negligible is indicated as Neg. in the table, KH < 10−5, low 10−5−10−3, significant 10−3−10−1 and high > 10−1.
A – Peterson and Batley (1993). B – Calculated from Hugo (1999) adsorption KD = 42 and OC = 0.58%.
C – Bates (1993). Pyrithiobac sodium or DPX-PE350, KIH-2031 and sodium 2-chloro-6[4,6-dimethoxypyrimidin-2-yl thio] benzoate, 850 g.a.i./kg, pKa = 2.34.
CB – Cotham and Bidleman (1989) and Barrett et al. (1991). CH – Chapra (1989). H – Hornsby et al. (1996).
T – Tomlin (1994), Trichell et al. (1968). W – Weber (1994). U – Wauchope et al. (1992) Pesticide Properties Database. R – recent values from Pesticide Properties Database.
Silburn (2023) studied 12 pesticides with a wide range of properties, from dimethoate [solubility ~40,000 mg L−1, soil sorption coefficient (KOC) 20 L kg−1] and pyrithiobac sodium (solubility ~700,000 mg L−1, KOC 9–21 L kg−1) to DDE with a low water solubility (0.003 mg L−1) and high KOC (380,000–880,000 L kg−1) (Table 1). The Australian rainfall simulation studies (Silburn 2023) were at Gatton (Lockyer Valley), Emerald (Central Highlands) and Jondaryan on the Darling Downs (Table 2). The Gatton soil has a dark clay loam to light clay (crusting or cloddy) surface, is a Black Dermosol (Isbell and National Committee on Soil and Terrain 2021) used for cropping. The Emerald site was on an irrigated cotton farm west of Emerald, Queensland, on a Black Vertosol (Isbell and National Committee on Soil and Terrain 2021) and is strongly self-mulching and cracking. The site was used to grow irrigated cotton for >20 years. The Jondaryan site is a gently undulating alluvial plain of Oakey Creek. The soil is a Haplic self-mulching Black Vertosol (Isbell and National Committee on Soil and Terrain 2021) used for growing irrigated cotton and winter cereals. Studies occurred on row-crop layouts with 1 m wide rows except at Gatton (0.75 m wide rows), hills were 0.25 m high, with linear 50% side-slopes 0.4 m long. The furrows were used for irrigation and wheel traffic. Downfield slopes were 0.2–1.5%. Studies occurred early in the cotton season between planting and the first irrigation. All sites had low cover (<5%), except where cover was applied at Emerald as cotton trash (6.8 t ha−1 biomass with 47–56% cover) or wheat stubble (1.8 t ha−1 biomass with 15–25% cover or 2.8 t ha−1 biomass with 30–35% cover). Surface soils (0–50 mm) were loose and at air-dry moisture content; the surface had a strong crust at Jondaryan. There were no cracks as the sites had been pre-irrigated or fallowed. All sites had several centimetres of loose soil in the furrow over firm moist subsoil, compacted to varying degrees. Gatton had no crop and wheel traffic was random. The Emerald and Jondaryan sites had a wheel track and non-wheel track as separate plots under the simulator.
| Reference | Study description | |
|---|---|---|
| Silburn (2023) | Gatton (Lockyer Valley). The soil has a dark clay loam to light clay (crusting or cloddy) surface, a Black Dermosol (Isbell and National Committee on Soil and Terrain 2021) used for cropping. Treatments: a range of times after application and cultural treatments (e.g. range of cover, plot sizes and slopes, rainfall intensity and spray formulations). | |
| Silburn (2023), Silburn and Glanville (2002), Silburn et al. (2002), Silburn and Hunter (2009) | Emerald (Central Highlands). The site was on an irrigated cotton farm west of Emerald, Queensland, on a Black Vertosol (Isbell and National Committee on Soil and Terrain 2021) and is strongly self-mulching and cracking. It was used for irrigated cotton for >20 years. Treatments: time after applications and a range of cover, and plus or minus wheel traffic. | |
| Silburn (2023), Silburn et al. (2013) | Jondaryan on the Darling Downs. The site was on the gently undulating alluvial plain of Oakey Creek. The soil is a Haplic self-mulching Black Vertosol (Isbell and National Committee on Soil and Terrain 2021) used for growing irrigated cotton and winter cereals. Treatments: time after applications and a range of cover, and plus or minus wheel traffic. | |
| Information across all sites | A rainfall simulator applied rainfall at intensities of 95, 95 and 67 mm h−1. Studies occurred on row-crop layouts with 1 m rows except Gatton (0.75 m rows), hills were 0.25 m high, with linear 50% side-slopes 0.4 m long. Furrows were used for irrigation and wheel traffic. Downfield slopes were 0.2–1.5%. Studies occurred early in the cotton season between planting and first irrigation. All sites had low cover (<5%), except where cover was applied at Emerald (as cotton trash or wheat stubble). Surface soils (0–50 mm) were loose and at air-dry moisture content; the surface had a strong crust at Jondaryan. There were no cracks as the sites had been pre-irrigated or fallowed. All sites had a few cm of loose soil in the furrow over firm moist subsoil, compacted to varying degrees. Gatton had no crop and wheel traffic was random. Emerald and Jondaryan had a wheel track and non-wheel track as separate plots under the simulator. Twelve pesticides with a wide range of properties were studied, from dimethoate (solubility ~40,000 mg L−1, soil sorption coefficient (KOC) 20 L kg−1) and pyrithiobac sodium (solubility ~700,000, KOC 9–21) to DDE with a low water solubility (0.003) and high KOC (380,000–880,000). All pesticide were applied by qualified pesticide applicators using suitable, calibrated, high quality equipment. Descriptions of application rates and methods and laboratory analysis methods are given in Silburn et al. (2002, 2013). Application rates (g.a.i. ha−1) are given in Supplementary data. |
The North American studies involved 13 herbicides for rainfed studies and 11 herbicides and insecticides for irrigated cropping (Table 3). Table 3 includes the pesticides studied, descriptions of the soils, slopes and how soil concentrations were obtained, and whether simulated rainfall was used. Pesticides had a wide range in properties and over four orders of magnitude range in soil concentrations. Sorption varied from low for atrazine and propachlor (KOC ~ 100 L kg−1), to intermediate for glyphosate (19,600 L kg−1) and high for paraquat (1,000,000 L kg−1) (Hornsby et al. 1996). Soil concentrations were measured for depths of 5–150 mm. Availability of soil concentrations was the main limitation determining which studies were used here. Further descriptions are provided with the results.
| Reference | Study description | |
|---|---|---|
| Dryland (rainfed) crop lands | ||
| Trichell et al. (1968) | Measured runoff of three acidic herbicides, picloram, 2,4,5-T and dicamba, at 24 h and 4 months after spraying, from fallow soil rainfall simulator plots (3.28 m × 3.28 m, 12.7 mm rainfall in 1 h), clay loam, 3% slope, Texas. Soil concentrations not measured. Soil concentrations (0–5 mm) for 24 h after spraying were calculated from the spray rate assuming no losses. Pesticides were applied at either 1.12 or 2.24 kg ha−1 of the product A. | |
| Ritter et al. (1974) | Measured atrazine and propachlor (KOC ~100) in soil and runoff on four small catchments in Iowa USA, silt loam, slopes 0–15%. Herbicides were applied annually at planting, ‘ridged’ corn compared to ‘surface-contoured’ corn. Soil concentrations (0–25 mm) interpolated from first-order equation fitted to data measured through time. The herbicides were applied at 2.24, 4.48 or 6.725 or kg ha−1. | |
| White et al. (1976) | Measured 2,4-D runoff from a 0.34 ha catchment, cultivated (annual corn, conventional till), loamy sand (OC = 0.29%), 3.2% slope, Tifton Georgia, 1970–1972, and soil concentrations (0–5 mm) measured after application in 1972. In 1972, simulated rainfall (82.5 mm in 30 min) was applied to 30.2 m2 sub-plots at 1, 8 and 35 days after application. 2,4-D was applied at 0.56 kg ha−1. Soil concentrations for storms and for rainfall simulator plots were determined from days after spraying by interpolating between soil concentrations. Event average runoff concentrations were not presented (see text). | |
| Leonard et al. (1979), data from Smith et al. (1978) | Measured pesticide in soil (0–10 mm) and runoff from four small cropping terraced catchments, Georgia USA (~3% slope, sandy loam soils), over 4 years of annual herbicide applications to summer crops. The herbicides were applied at rates of 1.45–3.3 kg ha−1 for atrazine, 1.35 and 1.61 kg ha−1 for cyanazine, 3.16–3.36 kg ha−1 for diphenamid and 1.66 kg ha−1 for propazine. Annual average sediment concentration 5.6 g L−1, range 1.8–18.8 g L−1 annually. Four herbicides of similar sorption (atrazine, cyanazine, diphenamid and propazine, KOC 100–210), transported in water phase, while paraquat was strongly sorbed to sediment. Event average runoff concentrations and soil concentrations (0–10 mm) were taken from figs 4 and 5, Leonard et al. (1979). | |
| Baker and Laflen (1979), data from Baker (1980) | Measured runoff of atrazine, propachlor and alachlor (KOC 100–200), applied to the surface on wheel tracks and non-wheel tracks, or incorporated into soil, from 1.5 m × 9.1 m rainfall simulator plots (7% slope, sandy loam). Rainfall intensity 70 mm h−1, rain applied 7–11 h after spraying. Event average concentrations in runoff and soil (0–10 mm) from fig. 3 in Baker (1980). The intended rate of application was 2.5 kg ha−1. | |
| Edwards et al. (1980) | Measured runoff and soil (0–25 mm, including vegetation) glyphosate concentrations (anionic, phosphate-like sorption) on catchments (0.3–3.1 ha, ~15% slope) with high cover and low sediment loads, Iowa. Data derived from equations for soil and runoff concentrations against days after spraying. Glyphosate was applied at rates of 1.12, 3.36 or 8.96 kg ha−1 in various years or to various catchments. | |
| Buttle (1990) | Measured metolachlor (KOC 200) in soil (0–150 mm) and runoff during 3 months after one application on natural rainfall runoff plots (23.8 m2) on upslope areas (loam soil, OM = 2.7%, slope ~9%), growing maize in Canada. Pre-emergence surface broadcast (‘surface’) application was compared with pre-plant incorporated to 150 mm (‘incorp’). Soil concentrations (0–25 mm), for surface application, estimated by assuming all herbicide in 0–150 mm was in 0–25 mm; for incorporated, assuming concentrations in 0–25 mm soil equal to 0–150 mm soil. Metolachlor was applied at 2.75 L ha−1. | |
| Irrigated crop lands | ||
| Spencer et al. (1985) | Measured runoff, sediment and concentrations of 11 pesticides in runoff from 10 furrow irrigated fields (28–60 ha), Imperial Valley, California, for 1–3 years each. Soils were silty clay or silty clay loam, 40–50% clay, OC = 0.4–0.7%. Insecticides were generally aerially applied, with interception on crop canopies. Herbicides were applied to soil with ground-rigs. Event average (flow-weighted) pesticide concentrations were given. Sediment concentrations were low, with an average across fields of ~0.7 g L−1 (season averages 0.2–1.2 g L−1 for different fields, 0.2–2 g L−1 for individual irrigations). Before some irrigations, 0–10 mm soil samples were collected from irrigation furrows. Partition coefficients were measured in runoff for selected events. Runoff and soil concentrations were taken from Spencer et al. (1985) appendix tables 1–6. Pesticides were applied to various fields and in various years. For example, in 1979 applications to field one were: prometryn was applied in two applications at 0.90 or 2.24 kg ha−1, dinitramine was applied in two applications at 0.56 or 0.75 kg ha−1, chlorpyrifos was applied on four occasions at 0.34–0.56 kg ha−1, azinphosmethyl and permethrin were applied on six occasions at 0.12–0.52 kg ha−1 and fenvalerate on three occasion at 0.19 kg ha−1. In 1980, applications to field one were: prometryn twice at 0.3 and 1.3 kg ha−1, DCPA twice at 3.4 and 4.2 kg ha−1, methomyl at 0.4 kg ha−1, fenvalerate on two occasions at 0.11 and 0.16 kg ha−1 and permethrin on three occasions at 0.14, 0.20 and 0.14 kg ha−1. In 1980, chlorpyrifos was applied to field one twice at 0.42 and 0.28 kg ha−1. | |
Statistical analysis
Initial data analyses demonstrated the data contained heterogeneity of variances and non-normal distributions of multiple pesticides (Shapiro Wilk test) and consequently a base-10 logarithm transformation was required to achieve normality and homogeneity. The pesticide dataset was divided into slope classes: level to very gently inclined (0–3%), gently inclined (3–10%) and moderately inclined (10–32%). Following this, one-way analysis of variance (ANOVA) test for differences between group means was undertaken. If significant F-tests were obtained from ANOVA at P < 0.01 then a means comparisons report for all pairs, Tukey HSD test and connecting letters report were produced. Pesticides not connected by the same letter significantly differ. Statistical analysis was conducted using JMP®, Ver. 15.1.0. (SAS Institute Inc., Cary, NC, 1989–2021).
All data that were normally distributed and had equal variances for level to very gently inclined (0–3%) slope were pooled if a significant F-test was obtained from ANOVAs at P < 0.01, then a means comparisons report, Tukey HSD test and connecting letters report were produced. Pesticides not connected by the same letter significantly differ. The pesticides atrazine, dimethoate, diphenamid, glyphosate and metolachlor were not included due to non-normality, while 2,4-D was normally distributed but failed the equal variance criteria.
Results
For rainfed cropping studies, statistical comparisons of runoff extraction between pesticides and studies are presented first, and then sites and comparisons are discussed in detail.
Statistical comparisons
Runoff extraction was not significantly different for 15 pesticides but was significantly lower for trifluralin (Table 4). Runoff extraction ratios were not significantly different for total, alpha, beta and sulphate-endosulfan for non-transformed analysis. Thus, runoff extraction for endosulfan was not significantly different. Metolachlor was less sorbed (Koc = 200) than the other pesticides, which explains why it had lower runoff extraction. Trifluralin is tightly sorbed (Koc = 15,800 c.f. <600 for most herbicides) but it is also volatile and was applied <50 days prior to simulated rainfall. Volatilisation would have led to lower concentrations in the surface of the runoff-mixing layer, leading to lower runoff extraction. Moderate slopes did not cause significantly greater runoff extraction for atrazine, but runoff extractions of glyphosate and metolachlor were significantly lower (Table 4). As shown in Table 4, the runoff extraction ratios for North American catchments (Leonard et al. 1979) were not significantly greater than those for the Australian rainfall simulator plots. One exception was trifluralin runoff extraction for the rainfall simulator plots, which was significantly lower.
| Slope class | Pesticide common name | N | Mean log transformed ERO | Mean untransformed ERO | Data source | |
|---|---|---|---|---|---|---|
| Moderately inclined (10–30%) | Atrazine | 17 | 1.96a | 105.7 | Ritter et al. (1974) | |
| Glyphosate | 8 | 1.54b | 54.17 | Edwards et al. (1980) | ||
| Gently inclined (3–10%) | Atrazine | 26 | 1.67a | 54.1 | Baker and Laflen (1979) | |
| Metolachlor | 12 | 0.47b | 3.90 | Buttle (1990) | ||
| Level to very gently inclined (0–3%) | Atrazine | 35 | 1.45ab | 37.24 | Leonard et al (1979) | |
| Chlorpyrifos | 5 | 1.35abc | 24.65 | Darling Downs | ||
| Cyanazine | 7 | 1.69a | 52.57 | Leonard et al. (1979) | ||
| DDE | 13 | 1.10c | 13.64 | Darling Downs, Emerald | ||
| Dimethoate | 14 | 1.23bc | 18.89 | Darling Downs, Gatton | ||
| Diphenamid | 27 | 1.61a | 50.49 | Leonard et al. (1979) | ||
| Fluometuron | 4 | 1.35abc | 22.74 | Darling Downs | ||
| Metolachlor | 5 | 1.40abc | 25.1 | Darling Downs | ||
| Pendimethalin | 5 | 1.29abc | 20.33 | Darling Downs | ||
| Profenofos | 5 | 1.36abc | 24.95 | Darling Downs | ||
| Prometryn | 21 | 1.43abc | 28.28 | Darling Downs, Emerald, Gatton | ||
| Pyrithiobac sodium | 5 | 1.31abc | 20. 43 | Darling Downs | ||
| Endosulfan sulfate | 18 | 1.39abc | 27.0 | Darling Downs, Emerald, Gatton | ||
| Total endosulfan | 23 | 1.40abc | 25.54 | Darling Downs, Emerald, Gatton | ||
| Trifluralin | 139 | 1.11c | 19.16 | Darling Downs, Emerald |
Means followed by the same letter are not significantly different (P < 0.01).
Log-transformed ERO values from the cyanazine data of Leonard et al. (1979) and the Australian rainfall simulator plots (Emerald, Gatton and Darling Downs; Silburn 2023) are shown in Table 5. The ERO was significantly lower for trifluralin, pendimethalin and DDE (all more tightly sorbed compounds) from the rainfall simulator studies, but was was significantly higher for the cyanazine data from Leonard et al. (1979). The ERO values for beta, total and sulfate endosulfan were somewhat lower. However, ERO values for most of the pesticides from the rainfall simulator data were not significantly different, once the more sorbed trifluralin, pendimethalin and DDE were excluded. This lack of difference in ERO values for many pesticides is consistent with the analysis in Table 4.
| Pesticide (common name) | N | Mean log transformed ERO | Mean ERO | Data source | |
|---|---|---|---|---|---|
| Cyanazine | 7 | 1.69a | 52.57 | Leonard et al. (1979) | |
| Endosulfan sulfate | 18 | 1.39b | 26.98 | Darling Downs, Emerald, Gatton | |
| Total endosulfan | 23 | 1.40b | 25.54 | Darling Downs, Emerald, Gatton | |
| Prometryn | 21 | 1.43ab | 28.28 | Darling Downs, Emerald, Gatton | |
| Trifluralin | 13 | 1.11c | 19.16 | Darling Downs, Emerald | |
| Alpha endosulfan | 18 | 1.43ab | 27.18b | Darling Downs, Emerald, Gatton | |
| Profenofos | 5 | 1.36abc | 24.95 | Darling Downs, | |
| Beta endosulfan | 23 | 1.40b | 26.32 | Darling Downs, Emerald, Gatton | |
| Chlorpyrifos | 5 | 1.35abc | 24.65 | Darling Downs | |
| Fluometuron | 4 | 1.35abc | 22.74 | Darling Downs | |
| Pyrithiobac sodium | 5 | 1.31abc | 20.43 | Darling Downs | |
| Pendimethalin | 5 | 1.29bc | 20.33 | Darling Downs | |
| DDE | 13 | 1.10c | 13.64 | Darling Downs, Emerald |
Means followed by the same letter are not significantly different (P < 0.01).
Leonard et al. (1979)
Leonard et al. (1979) had data from four small cropping terraced catchments in Georgia USA (~3% slope, sandy loam soils), over 4 years of annual herbicide applications to summer crops (data from Smith et al. 1978). They measured runoff, sediment and herbicide concentrations in runoff from the catchments. The annual average sediment concentration was 5.6 g L−1 (range 1.8–8.8 g L−1). They investigated relationships between concentrations in runoff and in the surface soil (0–10 mm depth). For four herbicides of similar low sorption (atrazine, cyanazine, diphenamid and propazine, KOC 100–210), dominantly transported in the water phase, they found a strong relationship (R = 0.93), with no difference due to herbicide, watershed or year (Fig. 1). The rainfall simulator data of Silburn (2023) coincided with these data over much of the range (Fig. 1) and runoff extraction of the herbicides and most other pesticides were not significantly different (Table 4).
Pesticide soil and runoff concentrations from rainfall simulator plots (Cro = 30 × C′soil; Silburn 2023) compared with herbicides (Leonard et al. 1979) from catchments (Cro = 50 × C′soil1.2), and potential maximum concentrations for 50 mm rainfall. Rainfall simulator sites: DD, Jondaryan; EM, Emerald, Gatton; Py_Na, pyrithiobac sodium.
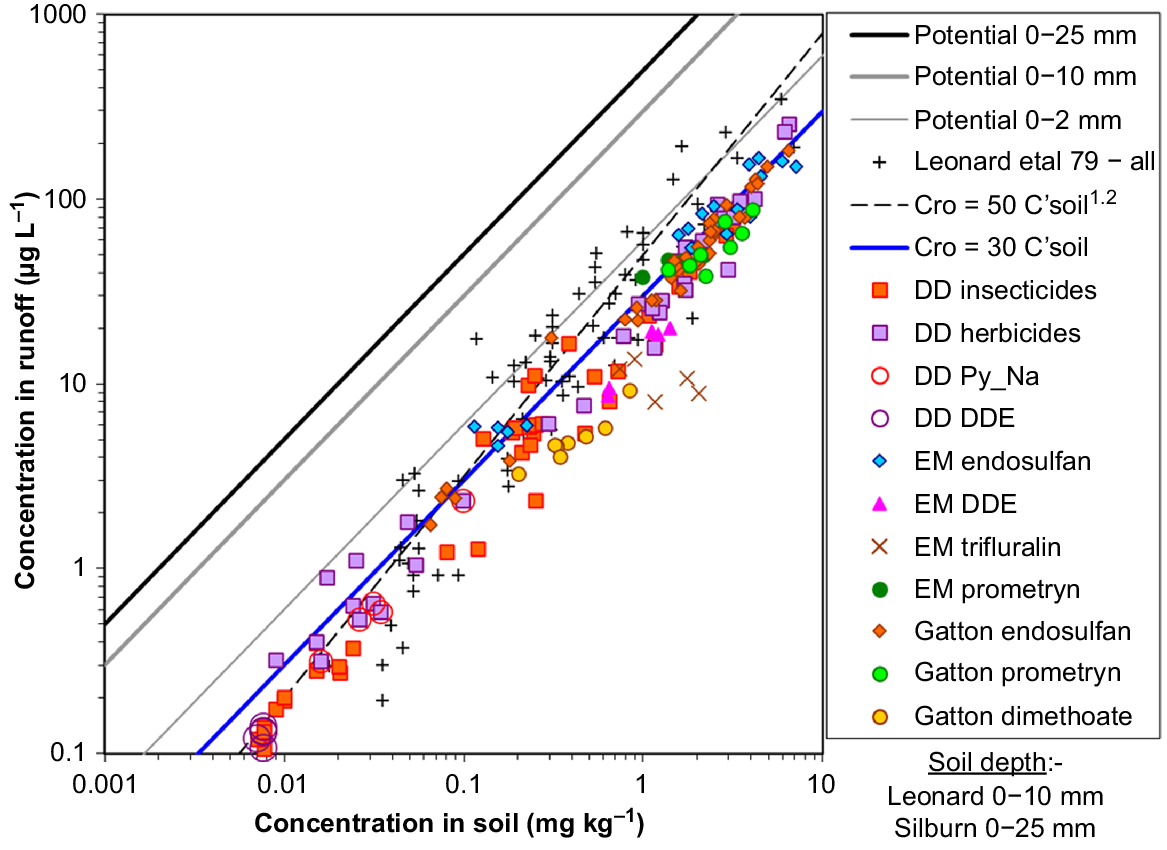
Leonard et al. (1979) derived the relationship between runoff concentrations CRO (μg L−1) and 0–10 mm soil C′SOIL (mg kg−1). The data extended over four orders of magnitude and was significantly non-linear. This indicated that extraction was more efficient at higher soil concentrations and less efficient with longer time of contact with soil. This relationship and that of Silburn (2023) coincide at a soil concentration of around 0.1 mg kg−1 (Fig. 1). The catchment runoff concentrations were twice those of Silburn (2023) at a soil concentration of 5 mg kg−1. Higher concentrations were associated with runoff soon after spraying and presumably higher concentrations in the top few millimetres of soil. For the simulator data, lower soil concentrations were associated with pesticides with low applications rates (e.g. pyrithiobac sodium and organophosphates). Leonard et al. (1979) considered the non-linearity reflected less efficient extraction with time after spraying, and ‘inadequacy in using the 0–10 mm zone as a reference throughout the growing season’. As time progresses, 0–10 mm soil over-estimates surface concentrations extracted into runoff, with concentrations lower at the soil surface and increasing with depth. Leonard et al. (1979) provides some of the few data on this issue. At 13 days and 20 mm of rain after spraying, atrazine concentrations were lower in 0–10 mm than 10–20 mm soil.
The Leonard et al. (1979) and rainfall simulator data were about an order of magnitude lower than the maximum potential runoff concentrations (Fig. 1), which had extraction ratios of 300 and 500, for 0–10 and 0–25 mm soil depth, respectively (for 50 mm of rain). Thus, both natural and simulated rainfall extracted <10% of the pesticide mass from these soil layers, consistent with observed pesticide losses as a percent of applied amounts (Wauchope 1978) and with a runoff-mixing layer shallower than 10 mm (Baker 1980; Ahuja 1986). Potential runoff concentrations correspond to observed runoff with complete extraction of a soil depth of <2 mm (Fig. 1).
Leonard et al. (1979) also studied paraquat, a compound highly sorbed to clay surfaces and dominantly transported in sediment. They found a good relationship between runoff concentrations and 0–10 mm soil concentrations multiplied by sediment concentration (SC) (Fig. 2): CRO (μg L−1) = 1000 × 2.16 × [SC(g L−1) × C′SOIL(mg/kg)/1000]0.83 (R = 0.97). Multiplying soil concentrations by sediment concentrations gives an estimate of runoff concentrations where the sediment mass was eroded with a concentration equal to the soil concentration, i.e. with no enrichment or desorption (‘no-enrichment’ line in Fig. 2). Paraquat concentrations in sediments were greater than those measured in the soil. Leonard et al. (1979) identified the coefficient 2.16 as an enrichment factor, due to preferential transport of finer sediments. Similar enrichment ratios for clay, organic matter and sediment specific surface compared to catchment soil were also found. The non-linearity results in an enrichment ratio of 7.0 at low values of SC × C′SOIL and declining to 1.5 at the highest values of SC × C′SOIL (Fig. 2).
Pesticide runoff concentrations related to soil concentration times sediment concentration (SC), from rainfall simulator plots (Silburn 2023), and catchments for paraquat (P1–4, Leonard et al. (1979), and enrichment ratios for paraquat. Rainfall simulator sites: DD, Jondaryan; EM, Emerald, and Gatton; Py_Na, pyrithiobac sodium.
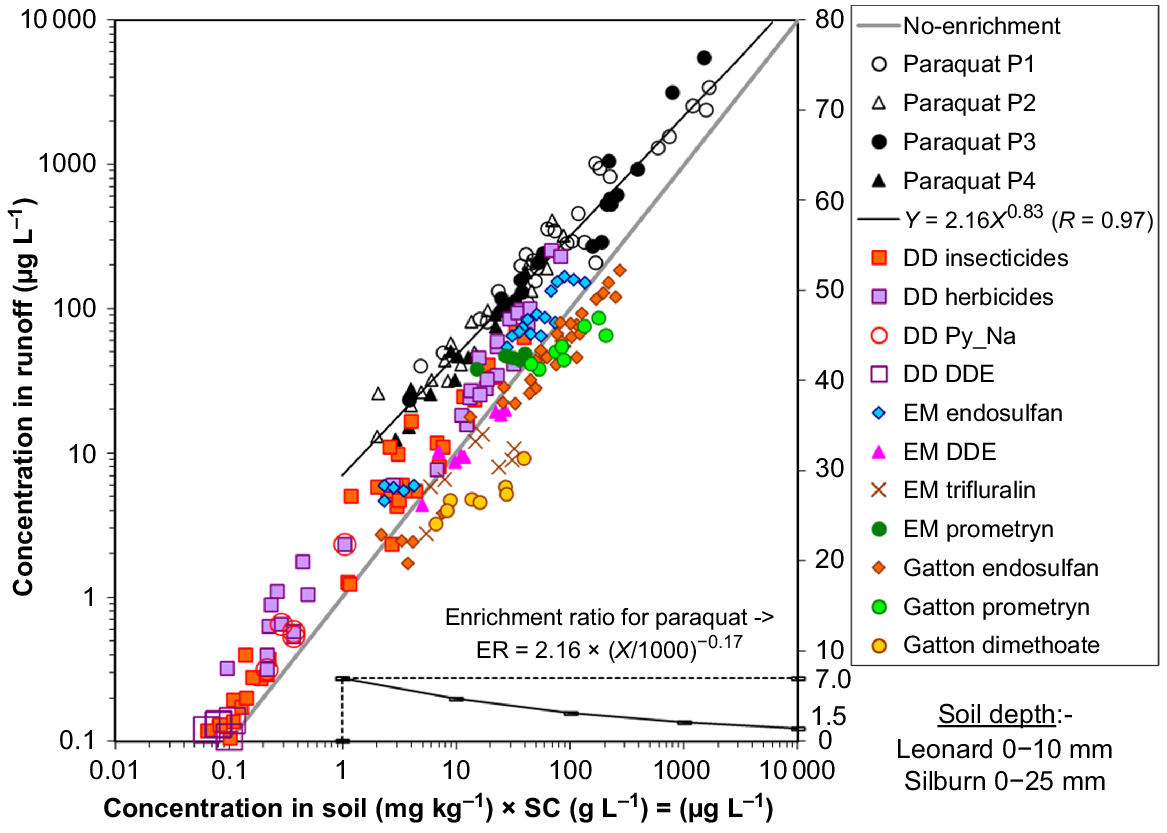
The rainfall simulator plots gave runoff concentrations that were lower than the data for paraquat at the same soil concentration (Fig. 2). At the lowest paraquat concentrations, paraquat concentrations were almost an order of magnitude greater than rainfall simulator concentrations, because of this seven-fold enrichment. Pesticides from rainfall simulator plots were less enriched, with concentrations in sediment (mg kg−1) closer to the soil concentration. Enrichment ratios for paraquat and their relationship to sediment concentration are like relationships found for sediment-sorbed chemical transport from lighter textured soils (Rose and Dalal 1988; Smith et al. 1993).
Baker (1980) (data from Baker and Laflen 1979)
Baker and Laflen (1979) studied runoff of atrazine, propachlor and alachlor (KOC = 100–200), applied to the surface on wheel tracks and non-wheel tracks, or incorporated into the soil. They used a rainfall simulator to apply 70 mm h−1 of rainfall 7–11 h after spraying (Table 3). The study was typical of many older simulator studies, with rain applied soon after spraying at a high intensity. Baker (1980) found the relationship between event average concentration in runoff and 0–10 mm soil was CRO (μg L−1) = 45 × [C′SOIL (mg kg−1)]1.03 (R = 0.81). The agreement with the Leonard et al. (1979) data for water-transported herbicides was surprisingly good. Indeed, the data from the two studies were not significantly different in the mean ERO (P < 0.001) (Fig. 3). Both studies had slightly greater runoff concentrations than Australian rainfall simulator plots (Silburn 2023) at higher soil concentrations. Simulated rain on small plots (Baker and Laflen 1979) provided a useful estimate of herbicide runoff from catchments, albeit at different locations. A direct comparison of simulator and catchment data at the same location (White et al. 1976) is given below.
Pesticide soil and runoff concentrations from North American rainfall simulator and catchment studies, compared with Leonard et al. (1979) (Cro = 50 × C′soil1.2), Baker (1980) and Silburn (2023) (Cro = 30 × C′soil), and lines approximating limits of the data.
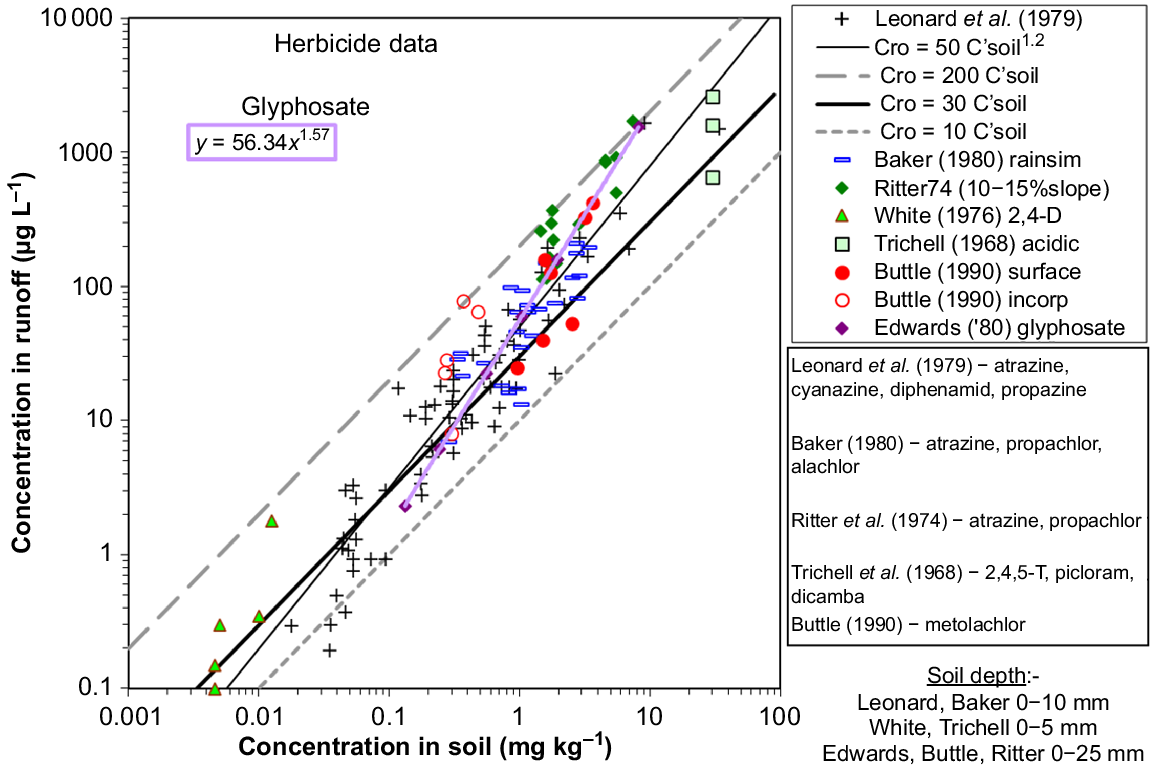
Other North American studies in crop land
Data for runoff and soil concentrations are shown in Fig. 3 for catchment studies of Ritter et al. (1974) for atrazine and propachlor, White et al. (1976) for 2,4-D, Edwards et al. (1980) for glyphosate and Buttle (1990) for metolachlor, and rainfall simulator plots of Trichell et al. (1968) for three acidic herbicides. In the interests of brevity these studies are described in Table 3. The data of Baker (1980) and Leonard et al. (1979) and best-fit lines from Leonard et al. (1979) and Silburn (2023) are also included.
The herbicide data from these five studies show less agreement with the other data (Fig. 3). Runoff extraction for atrazine (Ritter et al. 1974; Baker and Laflen 1979) was significantly greater while runoff extraction was significantly lower for glyphosate (Edwards et al. 1980) and metolachlor (Buttle 1990) (Table 4). Surface-applied metolachlor gave higher soil (0–25 mm) and runoff concentrations than when incorporated (Buttle 1990). A two-sample t-test showed that the surface applied and incorporated treatments were significantly different. Mean ERO for surface applied was 4.81, significantly greater than the mean ERO of 2.61 for incorporated. The mean average extraction ratio for the data of Ritter et al. (1974) was 167, five times those from Silburn (2023). Runoff concentrations for all five studies approached the maximum potential extraction of 200 for events soon after spraying (Fig. 3). Extraction ratios were highest soon after spraying and declined with time. The studies of Ritter et al. (1974) and Buttle (1990) were under highly erosive conditions and experienced large pesticide losses. Ritter et al. (1974) recorded a storm 7 days after application where 15% of applied atrazine was lost in runoff. Buttle (1990) measured 31–46% of applied metolachlor lost in sediment. This is higher than generally expected for this soluble herbicide because sediment concentrations were high, averaging >100 g L−1 and above 200 g L−1 in some events, compared with 6 g L−1 on average for Leonard et al. (1979).
Glyphosate data (Edwards et al. 1980) fitted the relationship CRO (μg L−1) = 56.3 × [C′SOIL (mg kg−1)]1.6, steeper than the relationships from Leonard et al. (1979) and Baker (1980). The catchment had high cover (sprayed-out meadow), and soil concentrations included glyphosate on cover and runoff included washoff from cover. Aslam et al. (2013) found that glyphosate was more easily desorbed from decomposed maize residues than were other herbicides (e.g. metolachlor). Rampoldi et al. (2011) found limited and reversible glyphosate adsorption on soybean and maize crop residues. Thus, the higher runoff extraction of glyphosate was probably explained by its greater desorption from the sprayed-out meadow grass. High runoff losses from meadow cover were like higher glyphosate runoff losses from cane trash compared to bare soil found by Silburn et al. (2023). The 2,4-D (White et al. 1976) had greater runoff concentrations than the other data (Leonard/Silburn) soon after spraying but fitted with the other data at longer times after spraying. High runoff concentrations for acidic herbicides (Trichell et al. 1968) were related to high soil concentrations and were not due to inherently greater runoff extraction.
There is a range in runoff concentrations at any soil concentration, with runoff extraction ratios from 10 to 200 for individual events when the most erosive (steep) sites are included (Fig. 3). For more moderate slopes (Leonard et al. 1979; Baker 1980), 90% of events had an extraction ratio between 15 and 80, or 0.3–1.8 times the mean (coefficient of variation 72%). In other words, runoff concentrations varied by less than a factor of two compared to three to four orders of magnitude range in soil concentrations. This is a large improvement compared to the model of Wauchope and Leonard (1980). Thus, the analysis here provides a better first approximation of pesticide runoff.
White et al. (1976)
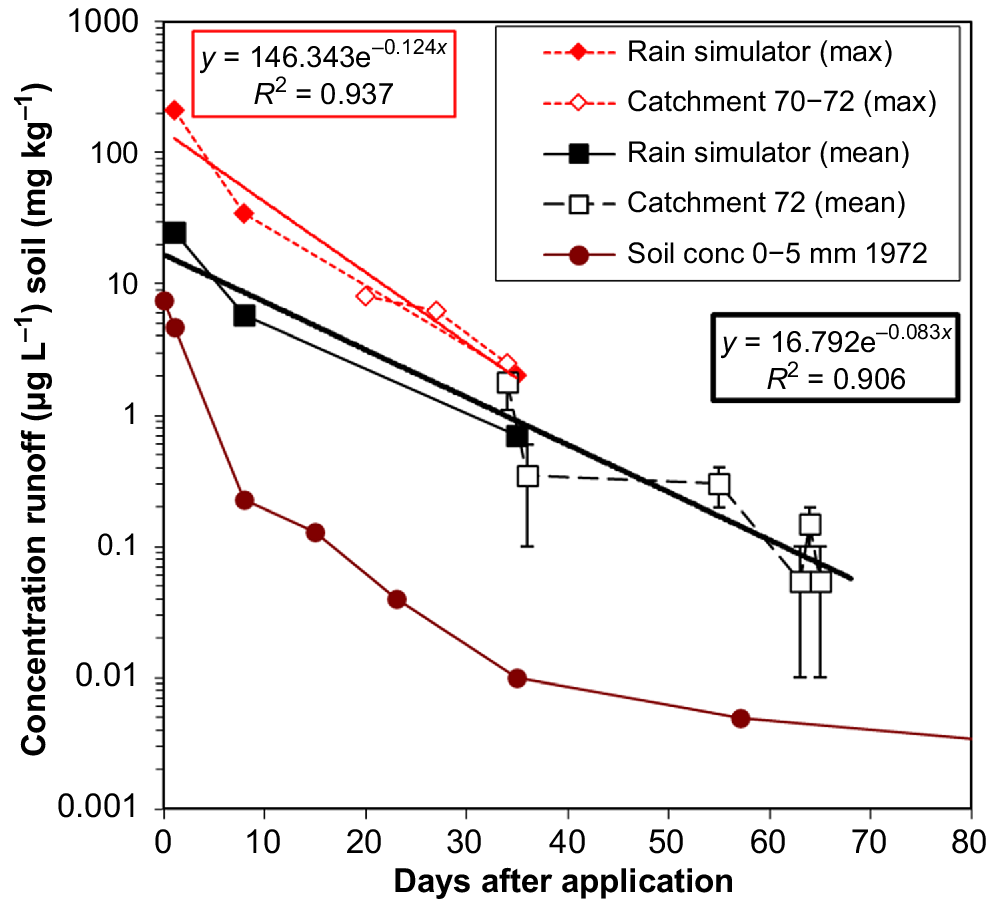
White et al. (1976) measured runoff of 2,4-D from a small, cultivated catchment in Georgia (annual corn, conventional till) (Table 3). They present maximum and minimum concentrations for storm runoff and annual maxima over 3 years and soil concentrations (0–5 mm) for 1 year. Event average concentrations were not given, so means of range values were used. Also, simulated rainfall was applied to three 30.2 m2 sub-plots at 1, 8 and 35 days after 2,4-D application, at 165 mm h−1 for 30 min. Soil concentrations for storms and simulator plots were determined from the soil concentration-days since spraying data. Two aspects are of interest here, namely, comparison of rainfall simulator with catchment data, and comparison of soil and runoff concentrations.
Mean 2,4-D runoff concentrations from the rainfall simulator and catchment fit the same relationship with days after spraying well (Fig. 4, R2 = 0.906), indicating that the rainfall simulator provides a good estimate of catchment pesticide runoff. Maximum runoff concentrations for simulator plots agreed closely with maximum concentrations from the catchment, as a function of days after application (Fig. 4, R2 = 0.937).
Comparison of 2,4-D runoff concentrations from rainfall simulator plots and catchment, and soil concentrations through time after application (White et al. 1976). Concentrations are means (symbols), maximum and minimum (error bars), and maximum annual (‘max’).
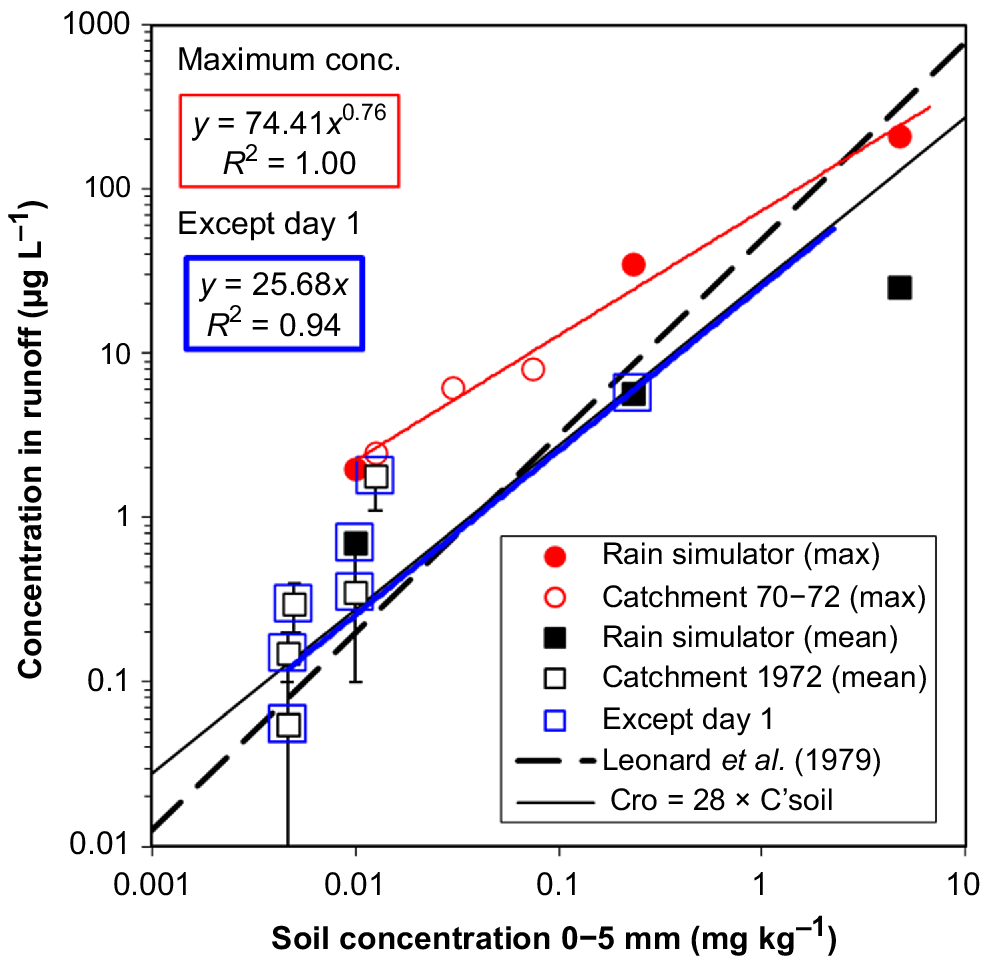
Mean runoff concentrations from the rainfall simulator and catchment relate well to soil concentrations (R2 = 0.94) and the equations of Leonard et al. (1979) and Silburn (2023) (Fig. 5), apart from at 1 day after spraying (the largest value). This point had a higher runoff concentration, which may be related to less leaching from the runoff-mixing layer and less contribution in sediment, as the partitioning coefficient was lower than at early times (White et al. 1976). Maximum runoff concentrations for the rainfall simulator and catchment were well correlated and also correlated with soil concentrations (R2 = 0.98), with an extraction coefficient three times the event average.
Mean and maximum 2,4-D runoff concentrations from rainfall simulator plots and catchment, related to soil concentrations (0−5 mm) (White et al. 1976), compared with Leonard et al. (1979) (Cro = 50 × C′soil1.2) and Silburn (2023) (Cro = 28 × C′soil). Concentrations are means (symbols), maximum and minimum (error bars), and maximum annual (‘max’).
Irrigated cropland – Spencer et al. (1985)
Spencer et al. (1985) measured runoff, sediment and concentrations of 11 pesticides (herbicides and insecticides) in runoff from 10 furrow irrigated fields (28–60 ha) in Imperial Valley, California, for 1–3 years each (on silty clay or silty clay loam soils, 40–50% clay, OC = 0.4–0.7%) (Table 3). Event average (flow-weighted) pesticide concentrations were given. Sediment concentrations were low, with an average across fields of ~0.7 g L−1 (0.2–1.2 g L−1) or 0.2–2 g L−1 for individual irrigations. Before some irrigations, 0–10 mm soil samples were analysed for pesticides. These data were used by Spencer et al. (1985) to investigate relationships between pesticides in runoff and in soil prior to irrigation. The pesticides studied are listed in Table 1, and have a range in KOC of 72 (methomyl) to 11,500 (endosulfan).
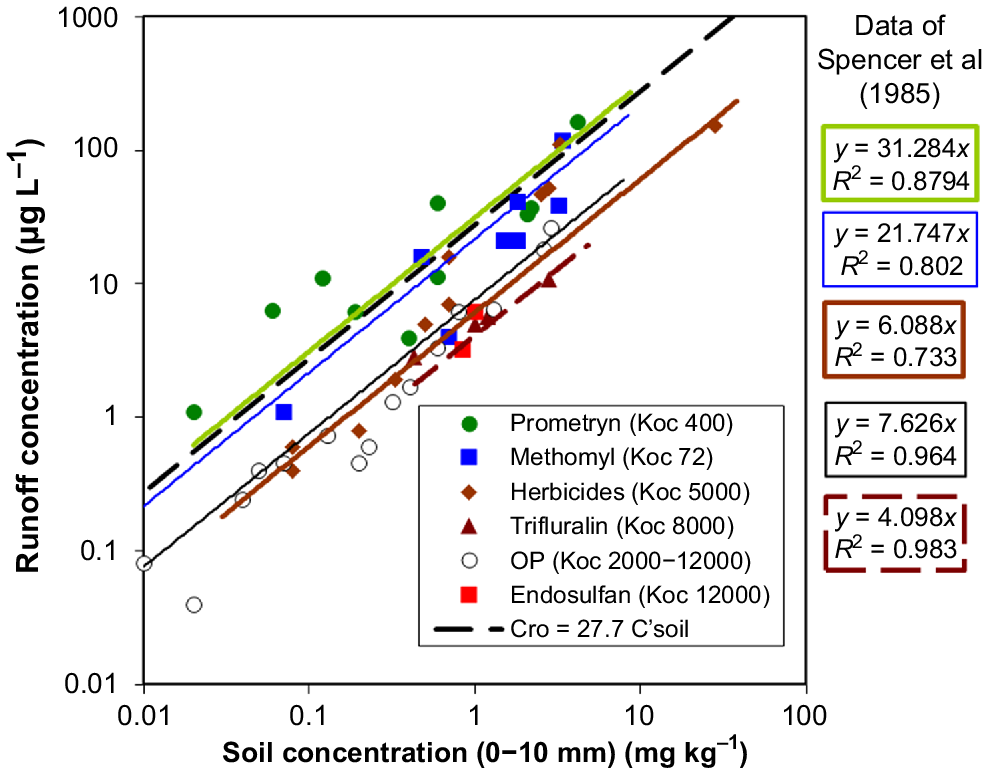
Runoff concentrations relate well to soil concentrations for each pesticide or pesticide group (Fig. 6, R2 = 0.59–0.95), though there was variation between some events. This was not surprising given data are from a variety of fields, years, crop stages and irrigations within seasons. Prometryn and methomyl data coincide well with the relationship of Silburn (2023). Runoff extraction ratios for the prometryn data of Spencer et al. (1985) significantly differed to those of Silburn (2023). In contrast, the runoff extraction ratios of trifluralin were the same (n.s.d. P = 0.007) for the data of Spencer et al. (1985) and Silburn (2023). Runoff extraction ratios varied by a factor of seven and were highest for the less sorbed prometryn (31.3) and methomyl (21.7) and decreased to 4–7 for more sorbed compounds.
Mean runoff concentrations from furrow irrigation related to furrow soil concentrations (0−10 mm), Imperial Valley, California (Spencer et al. 1985), compared with Cro = 27.7 × C′soil (Silburn 2023). Herbicides DCPA and dinitramine. The OPs were chlorpyrifos, diazinon, ethyl-parathion, malathion and methyl-parathion. KOCWauchope et al. (1992).
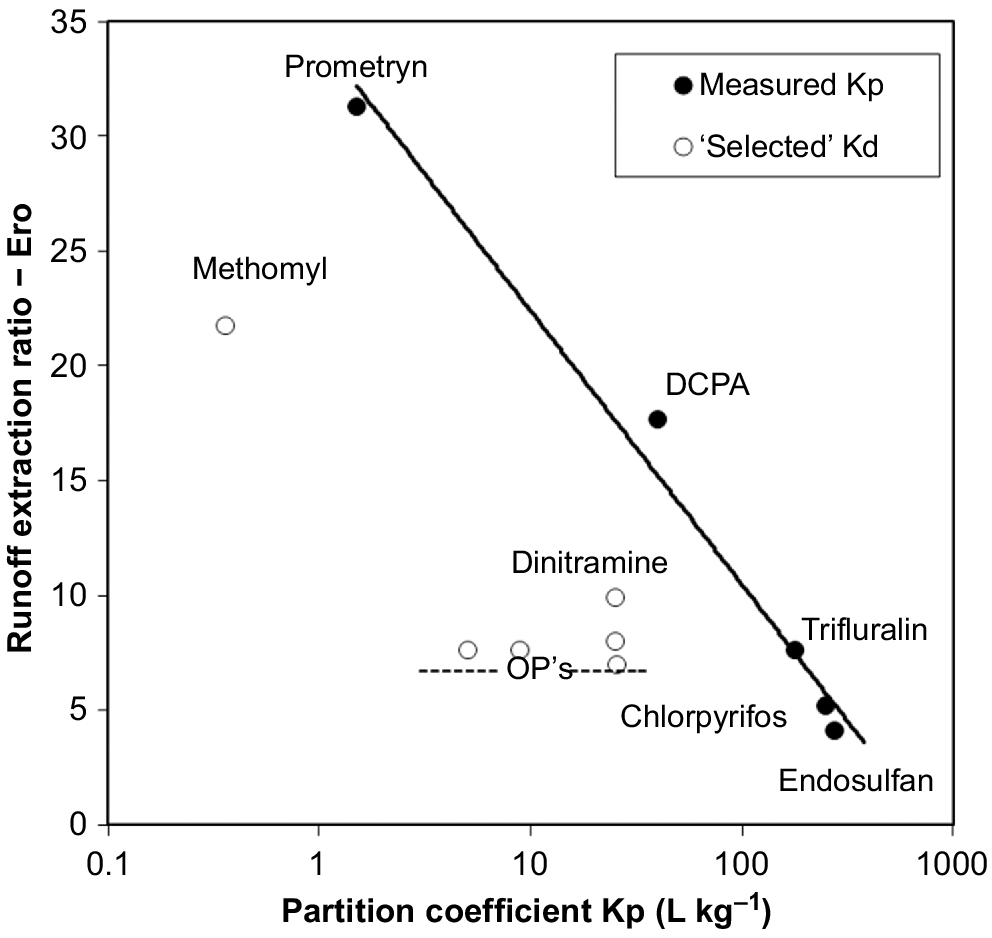
The ERO values for each pesticide or group (Fig. 6) are plotted against partition coefficients in Fig. 7. Decreasing runoff extraction ratio with greater partition coefficient was consistent where partition coefficients were measured in irrigation runoff by Spencer et al. (1985) (Fig. 7). Measured partition coefficients were about five times ‘selected’ soil sorption coefficients (Wauchope et al. 1992) for chlorpyrifos, endosulfan and trifluralin, 1.6 times for DCPA and similar for prometryn (see also Silburn 2003; Silburn et al. 2023).
Runoff extraction ratios (slopes of equations fitted in Fig. 6) related to soil sorption coefficients (KD) from KOC (Wauchope et al. 1992) and OC = 0.5%, or partition coefficients (KP) in irrigation runoff (Spencer et al. 1985). OPs: chlorpyrifos, diazinon, ethyl-parathion, malathion and methyl-parathion.
Lower runoff extraction for more sorbed pesticides was related to low sediment concentrations in runoff. The contribution of sediment phase pesticides to the total concentration was low (e.g. <20%), even for highly sorbed pesticides (‘Fsed SC = 0.7 g L−1’ in Fig. 8a). For tightly sorbed pesticides, little was transported in the water phase, so without sediment movement, little was transported in total.
(a) Pesticide sediment phase fraction (FSED) related to KP, for the actual sediment concentration in runoff (~0.7 g L−1) and for sediment concentrations of 25−50 g L−1. ERO–KP shown to indicate the KP for each pesticide. (b) Runoff extraction ratios for measured sediment concentration and calculated for sediment concentration of 25 g L−1, using measured Kp values.
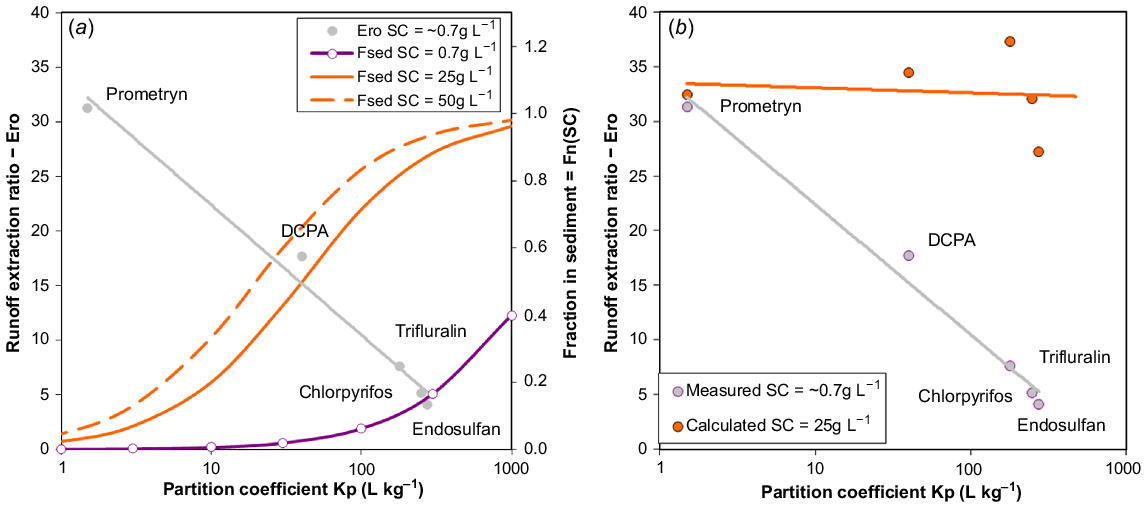
Had sediment concentration in runoff been greater, the sediment phase proportion would have increased for more sorbed pesticides (e.g. 80–100% for partition coefficients KP > 100, Fig. 8a) and runoff extraction ratios would have been higher (ERO = 25–35), similar to prometryn (Fig. 8b). Even for DCPA with a measured KP of 40, sediment phase proportion increased from almost nothing with sediment concentration of 0.7 g L−1 to about 50% with sediment concentration of 25 g L−1, doubling the ERO to 34. Increased sediment concentration did not affect runoff extraction of prometryn, because little was transported on sediment (KP = 1.5). Interpretation of the Spencer et al. (1985) data indicates that runoff extraction ratios are like those of Silburn (2023), once differences in sediment concentrations are taken into account.
Discussion
There was a high degree of consistency in runoff extraction from soil into runoff for pesticides with a wide range of properties, within rainfall simulator and catchment studies. Pesticide runoff concentrations, which vary widely, were mainly determined by the soil concentration at the time of the event. Soil concentrations were determined by prior application and dissipation rates. Runoff extraction also varies with extremes of hydrology, particularly excessive or restricted leaching, occurrence of interflow, and low or high sediment concentrations.
What differentiates runoff extraction between pesticides?
Differences in runoff extraction between pesticides for bare soil occur in the following cases:
Pesticides are differentiated due to leaching, requiring low sorption and significant infiltration and leached pesticides are not returned to runoff as interflow (Loch et al. 1987; Silburn 2023). This is discussed in the next section.
Pesticides were differentiated by sorption to and transport on, sediment, requiring different sorption properties and low (Spencer et al. 1985) or high sediment concentrations (Ritter et al. 1974; Buttle 1990). With low sediment concentrations, poorly sorbed pesticides are extracted into runoff, but strongly sorbed pesticides are almost absent. With high sediment concentrations, pesticide runoff concentrations will depend on soil concentrations and runoff losses can be large for more sorbed pesticides.
Pesticides have different concentration profiles within the runoff-mixing layer with time after spraying. Only a shallow soil layer (e.g. 2–5 mm) is involved in the majority of mixing (Ahuja et al. 1981). A recently sprayed pesticide has a higher concentration in this upper few millimetres of soil compared with the average over the sampled depth, and runoff extraction is greater. Over time, greater dissipation near the surface (e.g. due to volatilisation or photolysis) and downward leaching and diffusion leads to lower concentrations in the surface than in deeper soil and less runoff extraction.
Factors such as cover and slope impact runoff extraction to the extent they affect sediment concentrations and hydrology. Cover reduces erosion and enhances infiltration and thus reduces runoff extraction if interflow does not occur. Greater slope leads to greater sediment concentrations and increase runoff extraction of more sorbed pesticides.
Leaching from the runoff-mixing zone
Silburn (2023) calculated effects of infiltration on pesticide leaching for a 25 mm deep soil layer using the advection equation1 (Leonard et al. 1987) for a range of soil sorption coefficients (KD) and indicative pesticides. Soil concentrations were barely affected by leaching for pesticides with KD greater than 100 (e.g. endosulfan, trifluralin and DDE), even with 100 mm of infiltration. This is consistent with endosulfan being found mostly in the surface few centimetres of soil months after application (Kennedy et al. 2001). Leaching only reduced concentrations by 10% during 50 mm of infiltration for KD = 14 (e.g. prometryn). With KD = 1.4 (e.g. atrazine or fluometuron), soil concentrations were reduced by ~25% with 30 mm of infiltration (at the start of runoff), were halved with 50 mm and reduced by 20% with 100 mm. The KD needs to be ~0.2 for soil concentration to be halved with 30 mm of infiltration. Thus, KDmust be low (<2) for leaching to significantly reduce concentrations in 0–25 mm soil during a large rainfall event. This is consistent with Briggs (1981) who found that KD < 1 was a critical divide for leaching. While many pesticides have KD > 2, many herbicides and a few insecticides will have values around or less than two (Briggs 1981).
For other Australian rainfall simulator sites (Silburn 2023), infiltration amounts were about half those at Emerald (46–53 mm), only 17–25 mm. Thus, a considerable proportion of pesticides were still in the mixing-layer and available to mix with runoff. In contrast, where infiltration was highest (65 mm, Emerald covered plots), nitrate-nitrogen runoff indicated that leaching was restricted by subsoil compaction, especially on wheel-track plots (Silburn et al. 2002), causing interflow and more complete mixing. This is consistent with much greater runoff bromide ion (Br−) concentrations where leaching was restricted (Ahuja and Lehman 1983). However, for Emerald plots, runoff concentrations of prometryn, the least sorbed pesticide studied, only increased slightly on covered wheel-track plots, probably because some leached prometryn was adsorbed. Thus, pesticides must be very weakly sorbed to runoff, similarly to nitrate-nitrogenor Br−. A case where leaching probably reduced runoff extraction was dimethoate (poorly sorbed) at Gatton where runoff extraction was more than halved (Silburn 2023). This is supported by soil concentrations measured after rain which were only 5% of concentrations before rain.
Thus, reduction in runoff concentrations due to leaching was not influential in the rainfall simulator studies; infiltration was too small and soil sorption too high. The lower infiltration for the Australian rainfall simulator plots is not unusual during storm rainfall on bare cultivated clay soils used for grain and cotton cropping in eastern Australia (Silburn 2023). Restricted infiltration through compacted subsoil is common (Silburn and Connolly 1995). The similarity of runoff extraction for the Australian studies and most of North American runoff studies indicates that the same processes were probably occurring in both regions.
Why pesticides have similar runoff extraction ratios
Several factors push runoff extraction towards similarity rather than difference between pesticides, so long as leaching is restricted. An important factor is that the mass of soil and volume of water involved in mixing are the same for all pesticides on a plot. The consistency of runoff extraction indicates that this is also similar between plots and catchments. Also, many factors that increase solute extraction also increase detachment of sediment (e.g. increased rainfall intensity, greater slope and low cover) (Ahuja 1986, 1990), and cause similar extraction of poorly sorbed and tightly sorbed pesticides. Most pesticides studied had some contribution in the water and sediment phases. Also, as sediment concentrations decreases, physical enrichment of chemicals in sediment increases (Rose and Dalal 1988), so the sediment phase concentration does not decrease in linear proportion with the sediment concentration. The net effect is to moderate expected effects of sediment concentration on runoff extraction, except at very low or high sediment concentrations. Thus, in the Gatton simulator study of Silburn (2023), runoff extraction was similar between plots with sediment concentrations from 20 to 60 g L−1.
Runoff concentration will be linearly related to soil concentrations where large differences in days after application (>50 days) do not occur. Longer time after spraying also means that runoff extraction is lower, as partition coefficients increase (Wauchope et al. 2002; Silburn 2003) and the proportion in the surface of the mixing-layer decreases. Thus, a non-linear relationship between runoff concentrations and soil concentrations is likely when long times after application are included (Leonard et al. 1979).
Climate change may change the intensity of rainfall across northern Australia. Fraser et al. (2011) developed a model to estimate 15-min rainfall intensities (I15) across Australia. This used minimum temperature, daily rainfall and diurnal temperature range to estimate I15. The model was calibrated on one long-term set of pluviometer data and validated on another. The resulting model, while simple, was considered an improvement on the previous model. The model was considered a robust model of short duration rainfall intensity across Australia, particularly northern Australia. Analysis of trends in observed I15 showed that I15 generally increased over the period of data (average record length 37 years), with a greater rate of increase over more recent years (1990–2004). In principle, increased rainfall intensities will lead to increased risk of runoff occurring and thus would increase the risk of pesticide runoff losses.
Knowledge gaps
Major knowledge gaps include understanding runoff extraction for a wider range of pesticides including more recently introduced pesticides and understanding how runoff extraction is related to pesticide properties. There are also major knowledge gaps around pesticide half-lives in soil and on crop residues in tropical and sub-tropical environments. Understanding the toxicity and comparative runoff risk of pesticides is a major knowledge gap.
Conclusion
Previous studies (Leonard et al. 1979; Wauchope and Leonard 1980; Silburn 2023) suggested that to understand pesticide runoff, it is useful to separate the processes that occur between spraying and the runoff event, that is application and dissipation, from those that occur during the runoff event, that is extraction of pesticides from soil into runoff. To investigate runoff extraction, mean flow-weighted pesticide concentrations in runoff from simulated rainfall events and catchments were compared with their concentrations in soil before rain. For bare soil, Silburn (2023) studied 12 pesticides with simulated rainfall in Australia. The North American simulator and catchment data involved 13 herbicides for rainfed studies and 11 herbicides and insecticides for irrigated cropping. The pesticides had a wide range of properties and concentrations in surface soil. The ratio of runoff concentration to soil concentration, the runoff extraction ratios (ERO), was calculated from these data. Relationships from Silburn (2023) and Leonard et al. (1979) [runoff concentration = fn(soil concentration)] were compared with these runoff extraction ratios.
Total concentrations of pesticides extracted into runoff were closely related to surface soil concentrations prior to rainfall, irrespective of pesticide properties (e.g. partitioning coefficients). Runoff extraction was not significantly different for most pesticides, except where leaching reduced concentrations in the soil surface or sediment concentrations were low (<2 g L−1, low slopes) or high (>100 g L−1, steep slopes). For leaching to be effective, the soil sorption coefficient must be less than two, the infiltration must be large (>100 mm), and interflow must not return infiltrated water to runoff. The similarity of runoff extraction between pesticides and studies indicates these conditions were rarely met in Australian and North American croplands.
Other reasons for similarity of runoff extraction follow:
Many factors that increase solute extraction also increase detachment of sediment (e.g. increased rainfall intensity, greater slope and low cover), and thus cause similar extraction of poorly sorbed and tightly sorbed pesticides.
As sediment concentrations decrease, enrichment of chemicals in sediment increases, so the sediment phase concentration does not decrease in proportion to the sediment concentration. The net effect is to moderate expected effects of sediment concentration on runoff extraction, except at very low or high sediment concentrations.
On any plot or catchment, the same mass of soil and the same volume of water are involved in mixing, independent of the chemical being considered.
The similarity of runoff extraction between sites was probably due to similarities in soil aggregation, leaching and interflow, and in sediment concentrations. These similarities apply to much of the croplands on clay soils in eastern Australia and in the North American mid-west.
The analysis presented here, presents a conceptual model where the major drivers of pesticide runoff were separated between (a) application rate and dissipation, described by the soil concentration at the start of rain, which accounts for 3–4 orders of magnitude differences in runoff concentration and (b) runoff extraction during the rainfall event, which varies over a limited range.
Declaration of funding
Funding was provided by Cotton Research and Development Corporation and Murray Darling Basin Commission, and the Department of Environment, Science and Innovation.
Acknowledgements
We thank Dr Craig Thornton for providing additional statistics. We thank Dr Stephen Lewis and Dr Aaron Davis (both JCU) for reviewing the manuscript and improving it. We also thank reviewers from the Journal for their helpful suggestions.
References
Ahuja LR (1986) Characterization and modeling of chemical transfer to runoff. In ‘Advances in soil science. Vol. 4’. (Ed. BA Stewart) pp. 149–188. (Springer) doi:10.1007/978-1-4613-8612-4_3
Ahuja LR (1990) Modeling soluble chemical transfer to runoff with rainfall impact as a diffusion process. Soil Science Society of America Journal 54, 312-321.
| Crossref | Google Scholar |
Ahuja LR, Lehman OR (1983) The extent and nature of rainfall-soil interaction in the release of soluble chemicals to runoff. Journal of Environmental Quality 12, 34-40.
| Crossref | Google Scholar |
Ahuja LR, Sharpley AN, Yamamoto M, Menzel RG (1981) The depth of rainfall-runoff-soil interaction as determined by 32P. Water Resources Research 17, 969-974.
| Crossref | Google Scholar |
Aslam S, Garnier P, Rumpel C, Parent SE, Benoit P (2013) Adsorption and desorption behavior of selected pesticides as influenced by decomposition of maize mulch. Chemosphere 91, 1447-1455.
| Crossref | Google Scholar | PubMed |
Baker JL, Laflen JM (1979) Runoff losses of surface-applied herbicides as affected by wheel tracks and incorporation. Journal of Environmental Quality 8, 602-607.
| Crossref | Google Scholar |
Barnett AP, Carreker JR, Abruna F, Jackson WA, Dooley AE, Holladay JH (1972) Soil and nutrient losses in runoff with selected cropping treatments on tropical soils. Agronomy Journal 64, 391-395.
| Crossref | Google Scholar |
Briggs GG (1981) Adsorption of pesticides by some Australian soils. Australian Journal of Soil Research 19, 61-68.
| Crossref | Google Scholar |
Buttle JM (1990) Metolachlor transport in surface runoff. Journal of Environmental Quality 19, 531-538.
| Crossref | Google Scholar |
Cotham WE, Jr, Bidleman TF (1989) Degradation of malathion, endosulfan, and fenvalerate in seawater and seawater/sediment microcosms. Journal of Agricultural and Food Chemistry 37, 824-828.
| Crossref | Google Scholar |
Edwards WM, Triplett GB, Jr, Kramer RM (1980) A watershed study of glyphosate transport in runoff. Journal of Environmental Quality 9, 661-665.
| Crossref | Google Scholar |
Fillols E, Davis AM, Lewis SE, Ward A (2020) Combining weed efficacy, economics and environmental considerations for improved herbicide management in the Great Barrier Reef catchment area. Science of The Total Environment 720, 137481.
| Crossref | Google Scholar | PubMed |
Fraser GW, Carter JO, McKeon GM, Day KA (2011) A new empirical model of sub-daily rainfall intensity and its application in a rangeland biophysical model. The Rangeland Journal 33, 37-48.
| Crossref | Google Scholar |
Glenn S, Angle JS (1987) Atrazine and simazine in runoff from conventional and no-till corn watersheds. Agriculture, Ecosystems & Environment 18, 273-280.
| Crossref | Google Scholar |
Isennsee A, Sadeghi AM (1993) Impact of tillage practice on runoff and pesticide transport. Journal of Soil & Water Conservation 48, 523-527.
| Google Scholar |
Kennedy IR, Sánchez-Bayo F, Kimber SW, Hugo L, Ahmad N (2001) Off-site movement of endosulfan from irrigated cotton in New South Wales. Journal of Environmental Quality 30, 683-696.
| Crossref | Google Scholar | PubMed |
Leonard RA, Langdale GW, Fleming WG (1979) Herbicide runoff from upland Piedmont watersheds – data and implications for modeling pesticide transport. Journal of Environmental Quality 8, 223-229.
| Crossref | Google Scholar |
Leonard RA, Knisel WG, Still DA (1987) GLEAMS: groundwater loading effects of agricultural management systems. Transactions of the ASAE 30, 1403-1418.
| Crossref | Google Scholar |
Loch RJ, Thomas EC, Donnollan TE (1987) Interflow in a tilled, cracking clay soil under simulated rain. Soil and Tillage Research 9, 45-63.
| Crossref | Google Scholar |
Melland AR, Silburn DM, McHugh AD, Fillols E, Rojas-Ponce S, Baillie C, Lewis S (2016) Spot spraying reduces herbicide concentrations in runoff. Journal of Agricultural and Food Chemistry 64, 4009-4020.
| Crossref | Google Scholar | PubMed |
Peterson SM, Batley GE (1993) The fate of endosulfan in aquatic ecosystems. Environmental Pollution 82, 143-152.
| Crossref | Google Scholar | PubMed |
Rampoldi EA, Hang S, Barriuso E (2011) The fate of glyphosate in crop residues. Soil Science Society of America Journal 75, 553-559.
| Crossref | Google Scholar |
Ritter WF, Johnson HP, Lovely WG, Molnau M (1974) Atrazine, propachlor, and diazinon residues on small agricultural watersheds. Runoff losses, persistence, and movement. Environmental Science & Technology 8, 38-42.
| Crossref | Google Scholar |
Sharpley AN (1985) Depth of surface soil-runoff interaction as affected by rainfall, soil slope, and management. Soil Science Society of America Journal 49, 1010-1015.
| Crossref | Google Scholar |
Silburn DM (2023) Pesticide extraction from soil into runoff under a rainfall simulator. Soil Research 61, 468-483.
| Crossref | Google Scholar |
Silburn DM, Connolly RD (1995) Distributed parameter hydrology model (ANSWERS) applied to a range of catchment scales using rainfall simulator data I: Infiltration modelling and parameter measurement. Journal of Hydrology 172, 87-104.
| Crossref | Google Scholar |
Silburn DM, Glanville SF (2002) Management practices for control of runoff losses from cotton furrows under storm rainfall. I. Runoff and sediment on a black Vertosol. Australian Journal of Soil Research 40, 1-20.
| Crossref | Google Scholar |
Silburn DM, Hunter HM (2009) Management practices for control of runoff losses from cotton furrows under storm rainfall. III. Cover and wheel traffic effects on nutrients (N and P) in runoff from a black Vertosol. Soil Research 47, 221.
| Crossref | Google Scholar |
Silburn DM, Kennedy IR (2007) Rain simulation to estimate pesticide transport in runoff. In ‘Rational environmental management of agrochemicals: risk assessment, monitoring, and remedial action. ACS Symposium Series, No. 966’. (Eds IR Soloman, KR Gee, SJ Crossan, AN Wang, S Sanchez-Bayo) pp. 120–135. (American Chemical Society) doi:10.1021/bk-2007-0966.ch008
Silburn DM, Simpson BW, Hargreaves PA (2002) Management practices for control of runoff losses from cotton furrows under storm rainfall. II. Transport of pesticides in runoff. Australian Journal of Soil Research 40, 21-44.
| Crossref | Google Scholar |
Silburn DM, Foley JL, deVoil RC (2013) Managing runoff of herbicides under rainfall and furrow irrigation with wheel traffic and banded spraying. Agriculture, Ecosystems and Environment 180, 40-53.
| Crossref | Google Scholar |
Silburn DM, Fillols E, Rojas-Ponce S, Lewis S, McHugh AD (2023) Direct comparison of runoff of residual and knockdown herbicides in sugarcane using a rainfall simulator finds large difference in runoff losses and toxicity relative to diuron. Science of The Total Environment 863, 160976.
| Crossref | Google Scholar | PubMed |
Smith SJ, Sharpley AN, Ahuja LR (1993) Agricultural chemical discharge in surface water runoff. Journal of Environmental Quality 22, 474-480.
| Crossref | Google Scholar |
Snyder JK, Woolhiser DA (1985) Effects of infiltration on chemical transport into overland flow. Transactions of the American Society of Agricultural Engineers 28, 1450-1457.
| Crossref | Google Scholar |
Trichell DW, Morton HL, Merkle MG (1968) Loss of herbicides in runoff water. Weed Science 16, 447-449.
| Crossref | Google Scholar |
Truman CC, Leonard RA, Davis FM (1998) GLEAMS-TC: A two-compartment model for simulating temperature and soil water content effects on pesticide losses. Soil Science 163, 362-373.
| Crossref | Google Scholar |
Wang H, Gao L, Pang Z, Yang J, Chen X, Zhang J, Wang S, Tong R, Shi C, Chen X (2022) Surface flow–interflow-coupled nitrogen loss in gray fluvo-aquic farmland soils in the Anhui Section of the Huaihe River Basin, China. Canadian Journal of Soil Science 102, 331-340.
| Crossref | Google Scholar |
Wauchope RD (1978) The pesticide content of surface water draining from agricultural fields—a review. Journal of Environmental Quality 7, 459-472.
| Crossref | Google Scholar |
Wauchope RD, Leonard RA (1980) Maximum pesticide concentrations in agricultural runoff: a semiempirical prediction formula. Journal of Environmental Quality 9, 665-672.
| Crossref | Google Scholar |
Wauchope RD, Buttler TM, Hornsby AG, Augustjn-Beckers PW, Burt JP (1992) The SCS/ARS/CES pesticide properties database for environmental decision-making. Reviews in Environemtnal Contamination and Toxicology 123, 1-155.
| Google Scholar |
Wauchope RD, Yeh S, Linders JBHJ, Kloskowski R, Tanaka K, Rubin B, Katayama A, Kördel W, Gerstl Z, Lane M, Unsworth JB (2002) Pesticide soil sorption parameters: theory, measurement, uses, limitations and reliability. Pest Management Science 58, 419-445.
| Crossref | Google Scholar | PubMed |
Weber JB (1994) Properties and behavior of pesticides in soil. In ‘Mechanisms of pesticide movement into ground water’. (Ed. R Honeycutt) pp. 15–41. (CRC Press) doi:10.1201/9781351074346
White AW, Jr, Asmussen LE, Hauser EW, Turnbull JW (1976) Loss of 2,4-D in runoff from plots receiving simulated rainfall and from a small agricultural watershed. Journal of Environmental Quality 5, 487-490.
| Crossref | Google Scholar |
Willis GH, McDowell LL, Murphree CE, Southwick LM, Smith S, Jr (1983) Pesticide concentrations and yields in runoff from silty soils in the Lower Mississippi valley. Journal of Agricultural and Food Chemistry 31, 1171-1177.
| Crossref | Google Scholar |