

Salt dynamics, leaching requirements, and leaching fractions during irrigation of a halophyte with different saline waters
Mansoor Al-Tamimi A , Steve Green B , Wasel Abou Dahr A , Ahmed Al-Muaini A , Dionysia Lyra C , Khalil Ammar C , Mohamed Dawoud A , Paul Kenyon D , Peter Kemp D , Lesley Kennedy E and Brent Clothier B *
B *
A
B
C
D
E
Abstract
More than 830 million ha of soils are salt affected, representing around 9% of the world’s land surface. Groundwater high in salt already covers some 16% of the land area. Saline water can be used effectively for irrigation by salt leaching to despatch the accumulated salts, but this can pose a risk of salinisation of groundwater. It is important that the efficacy of salt leaching is confirmed, and the impacts of salt loading below the rootzone can be assessed.
We examine the efficiency and impact of salt leaching to remove salt from the rootzone.
Our soil, a Typic Torripsamment, is the dominant soil across the Arabian Peninsula. We carried out detailed laboratory experiments of salt leaching dynamics via salt breakthrough curves, analytical modelling, and through the field monitoring of impacts.
Analytical solutions well predicted the salt breakthrough curves from repacked soil columns in the laboratory and we were able to confirm that all of the soil’s water was actively involved in transport, and that salt behaved as an inert tracer. The breakthrough curves were well predicted using a small solute dispersivity, so piston displacement was found to be a good assumption. Salt was easily flushed from the columns. To back this up in the field, soil sampling was carried out down to 1 m across 36 profiles after the harvest of a halophytic crop irrigated with saline water. Salt storage was only 1.8 kg m−2, even though 80 kg m−2 had been applied. This is a positive result for managing irrigation.
Salt leaching can maintain equable salinity in the rootzone. However, this leaching carried salt back to groundwater at 2–3 times the concentration of the applied water. We confirmed that the amount of salt leaching back to groundwater can be significant.
This salt dilemma will require careful management to achieve crop yields and protect the environment.
Keywords: convection-dispersion, leaching fraction, mobile–immobile pore-water, piston displacement, residual salts, saline irrigation, salt breakthrough analysis, salt-leaching requirements.
Introduction
The Food and Agriculture Organisation of the United Nations has just published a global map of salt-affected soils (FAO 2021). The FAO (2021) notes that salt-affected soils can develop quickly in response to human activities due to inappropriate management, through saline water leaching to groundwater and then this groundwater being subsequently used for irrigation. These soils undergo a loss of soil health, and lose their abilities for food, fuel, and fibre production, natural infiltration, carbon sequestration, and other ecosystem functions.
The FAO has found that more than 830 million ha of soils are salt affected, representing around 9% of the world’s land surface, across all continents with more than two-thirds of these in arid and semi-arid zones. Some 10% of the soils of the world’s croplands are salt affected, so mitigation measures are needed to ensure global food security and maintain soil ecosystem services, especially where irrigation, mainly drawn from brackish groundwater, is needed for crop growth (Shahin and Salem 2015). Leaching of salt from the rootzone can be used with irrigation to minimise the impacts of soil salinisation through the flushing of salts out of the soil.
Yet groundwater high in salt already covers 24 million km2, or some 16% of the total land area on earth (van Weert et al. 2009). In the United Arab Emirates (UAE), the salinity of groundwater is rising, and the changing geochemistry of the aquifers has been described by EAD (2018). So, while saline water can be used effectively for irrigation through using salt leaching, the despatch of salts from the rootzone back to groundwater poses a risk of increasing salinisation of groundwater (Sherif et al. 2021). We recently published the results from our field work on crop growth under irrigation with saline water and measurements of salt leaching (Al-Tamimi et al. 2023). Here we seek to understand the salt dynamics in the rootzone soil and quantitatively assess whether the salt leaching procedures we adopted were effective at fully leaching salts from the rootzone.
We examined this both in the laboratory and field, to confirm the efficiency of salt leaching to remove salt from the rootzone. We did this through laboratory experiments on soil columns to quantify the leaching breakthrough of saline waters through soil. We also examined the end-of-season salt residues left in the soil after growing a halophytic crop of Salicornia irrigated with saline water using a leaching fraction to maintain good crop-growing conditions.
Objectives
Our objectives were to use salt-leaching measurements both from soil columns in the laboratory and through field monitoring of salt residues following a season of growing a halophytic crop under saline irrigation to achieve the following:
test whether salt moves through this desert soil as an inert tracer and to assess whether all of the soil’s pore water is actively involved in salt transport so that salt leaching is fully effective;
determine the effectiveness of salt leaching in the field by quantifying the residual salt load left in the soil after a full growth season of irrigating a halophytic crop of Salicornia using irrigation water with three different salinities and three different irrigation emitters.
Salt leaching
Sufficient leaching of salt from the soil profile under crops irrigated with saline water is critical to maintain a viable rootzone for crop growth. The electrical conductivity (EC) of the saturation extract in the rootzone soil that will maintain a tolerable yield depression, usually 10% or less (US Salinity Laboratory Staff 1954), is deemed the ECse. The leaching criterion that achieves ECse is called the leaching requirement (LR) (Rhoades 1974). Nonetheless, this leaching of salt from the rootzone, realised using a leaching fraction (LF) means that high amounts of salt can potentially be despatched to groundwater in the drainage, which can pose a risk to the water quality of the underlying aquifer since the EC of the drainage water (ECdw) will be greater than that of the irrigation water (ECiw) (Hoffman and Van Genuchten 1983). The LR and LF are both defined as the depth of water drained below the root zone divided by the depth of irrigation water applied, as we discuss below. Rhoades (1974) noted that LR differs from LF in that LR must be used to control the soil-water salinity within the rootzone within tolerable limits. The LF is simply the actual fraction of applied water that appears as drainage water, and which carries with it the displaced salts down to the underlying aquifer.
This highlights the conundrum of the irrigation of halophytes using saline water. There is the requirement to balance the need to flush salts out of the rootzone by leaching, with the imperative to protect groundwater by limiting salt leaching through drainage. This is the dilemma we address here. Furthermore, all of these leaching analyses are predicated on the assumption that the flux of the invading saline irrigation water completely displaces all of the salty pore water that is antecedently resident in the soil prior to the irrigation. This assumption can be stated in another way, and that is that all the pore water resident in the soil is mobile and can be displaced in its entirety by piston flow with the flux concentration of the infiltrating solution (van Genuchten and Wierenga 1976). We test this hypothesis of piston displacement through using both laboratory soil-column experiments and field monitoring.
Leaching requirements
The LR is the minimum value of LF that would prevent the rootzone salinity becoming too saline for ‘good’ plant growth (Rhoades 1974). If LR is the minimum value of LF when the maximum ‘permissible’ value of ECdw is ECdw*, then
Rhoades (1974) developed a procedure for determining the appropriate values for and suggested that
where is the crop-appropriate value of the saturation extract EC of rootzone salinity to realise a tolerable yield depression (Maas 1990). So,
Since we are growing an obligate halophyte, rather than a facultative crop, we have less interest in the LR, as is very high. Our experiments have shown little impact of salinity (≈10–40 dS m−1) on yield of Salicornia. So, our focus here is on the environmental impacts of the LF through ECdw, and the putative role played by piston displacement of all of the resident rootzone salt by the infiltrating drainage water.
Leaching fractions
Ayers and Westcot (1994) noted that with the LF defined in general as
then ECdw, will be given by
The lower the LF, with less water draining through the profile, the higher the relative EC in the leachate. Managing the LF to achieve a balance between salt flushing from the rootzone and limit water quality degradation of the underlying aquifer. Eqns 4 and 5 assume that all of the water leaching through the rootzone acts by piston displacement to remove excess salt from the entire wetted pore space. That is the assumption we test here, namely that there is essentially no immobile pore water, and that all of the wetted pore water is fully mobile (van Genuchten and Wierenga 1976).
Materials and methods
Our experiments were carried out at the International Centre for Biosaline Agriculture (25.09°N; 55.39°E; 48 m a.s.l.) near Dubai. The soil there is a Typic Torripsamment. It is a spatially uniform, deep sandy desert soil of aeolian origin (EAD 2009). These soils are the most extensive soils in the UAE, and are also found across much of the Arabian Peninsula (Abdelfattah and Pain 2012).
Salt breakthrough experiments were carried out in the laboratory during infiltration into a column of repacked sand using a sequence of saline water, between which the soil was flushed with fresh water (FW; Section ‘Breakthrough experiments’). These data were interpreted using an analytical solution to the dispersive-convective equation that describes miscible displacement in a soil with fully mobile pore water (Section ‘Analyses’). Field data were also obtained from soil monitoring before and after the 2021–2022 Salicornia growing season (Section ‘Field monitoring’), as well as from establishing the field profiles of salt left in the soil at the end of the growing season following the harvest in 2022 (Section ‘Soil profiling’).
Breakthrough experiments
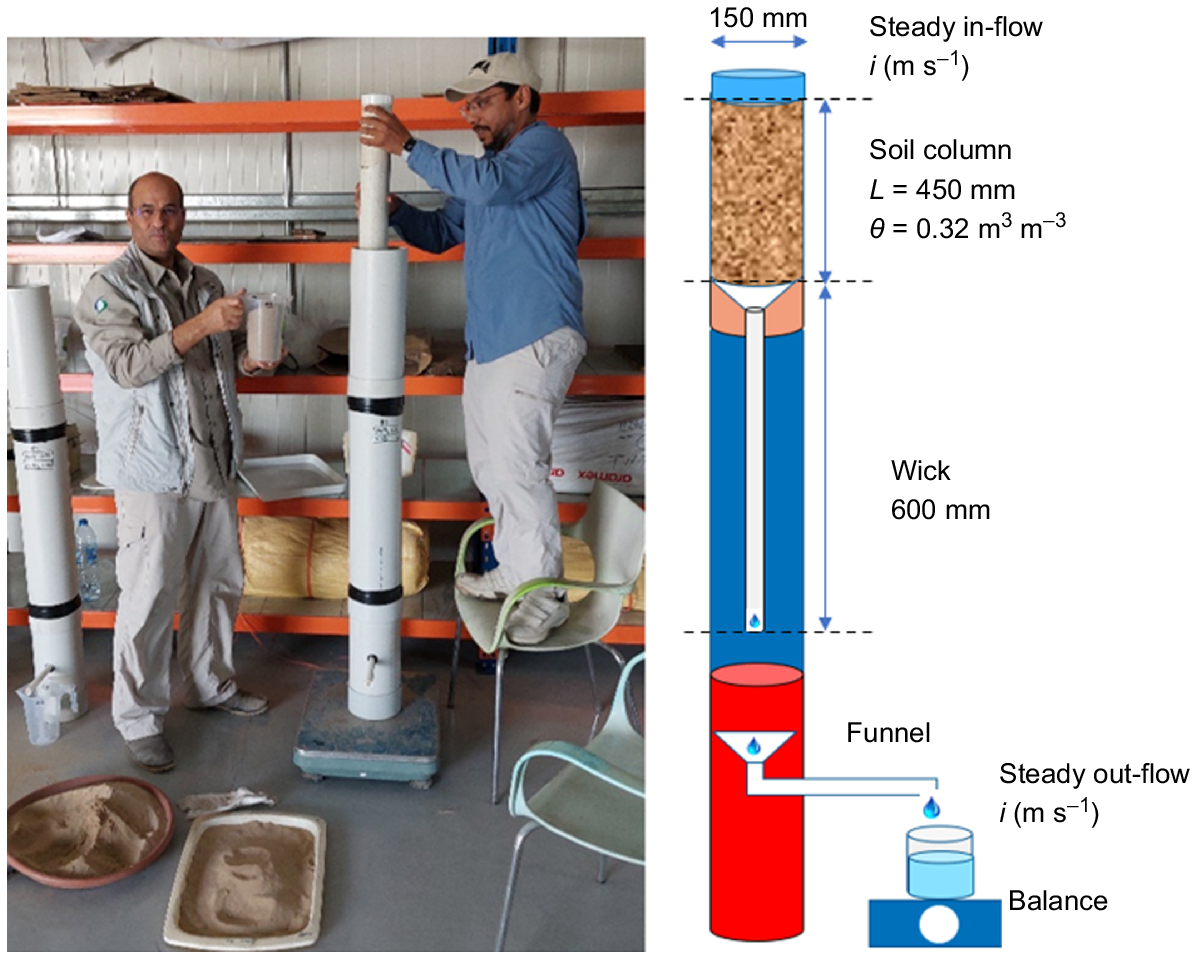
To establish three soil columns of length L = 450 mm and diameter 150 mm, sand over the depth range 0–300 mm was taken from the field plots. The sand was air dried (≈1% g g−1) and sieved to remove large pieces of organic material. This sand was then carefully packed into the columns in small amounts to ensure uniform bulk density of 1.6 kg L−1 (Fig. 1). The surface of the soil was then ponded with FW (≈0.5 dS m−1) to leach any initially resident salts from the column. The steady flow through the column, once water was dripping out the free-water base, was ≈100 mm h−1. For this single-grained, apedal soil, this did not alter the soil’s hydraulic character, and the flow rate was found to be that of the hydraulic conductivity that we had found in the undisturbed field using mini-disk tension infiltrometers. Thus, our repacking of this desert sand did not alter the soil’s hydraulic character. A series of salt leaching pulses were then established in the sequence of groundwater (GW, ≈25 dS m−1), followed by FW, then reverse-osmosis brine (RO, ≈35 dS m−1), followed by FW, then the aquabrine sequence (AQ, ≈35 dS m−1), with another pulse of FW, followed with saline water at 10 dS m−1 (EC10, ≈10 dS m−1) which was eventually flushed again with FW to end the breakthrough experiments. The EC of the leachate was measured frequently with a portable conductivity meter (WTW Model 3310). Our time domain reflectometry probes showed that free water emerged from the base of the column when the soil was at water content Θ = 0.32 m m−3.
Left panel. Packing air-dry sand into a soil column in preparation for the collection of salt leaching data to measure the salt breakthrough curves in the leachate. The right panel shows the experimental set-up used to collect the breakthrough curve data. This device consists of an upper section of repacked sand within a polyvinyl chloride (PVC) column of 150 mm diameter, length L = 450 mm, and at steady volumetric water content Ө = 0.32 m3 m−3. This sand-filled column sits atop a middle section of a PVC pipe of length 650 mm housing the fibreglass capillary wick of length 600 mm, the top of which is entwined inside a sand-filled funnel which is in contact with the base of the soil column above. A lower basal section of 300 mm contains a funnel to collect the drainage from the wick which feeds into an outflow pipe that drains into a beaker sitting on a balance. The weight change is recorded every 5–10 min to establish that the flow is steady at i (m s−1). The leachate is then emptied into another container and the EC of the drainage solution recorded frequently.
For simplicity, we only present the detailed measurements from one of the soil column experiments. There was negligible variation between columns, as careful packing had meant there was little difference in the salt-breakthrough curves.
Analyses
The basis for our analysis of the measured breakthrough curves of salt flowing through this vertical soil column of length L (m) is the partial differential equation describing the one-dimensional convective and dispersive flow of a biologically and chemically inert solute, yet one that is potentially adsorbed by the soil (Clothier and Green 2022). Here we simply use C as the salt concentration in the soil solution. The units of C are mg L−1, although at the levels of salinity encountered here these can be converted into EC (dS m−1), using the conversion 1 dS m−1 equals 720 mg L−1 (Ayers and Westcot 1994). The partial differential equation describing this miscible displacement through soil of an inert and potentially adsorbed solute was given by van Genuchten and Alves (1982):
where Θ is the volumetric soil-water content (m3 m−3), x is the soil depth (m), t is time (s), q is the volumetric flux of water flowing through the soil (m s−1), D is the solute dispersion-coefficient (m2 s−1), ρ is soil bulk density (g m−3), and S is the adsorbed concentration of salt (mg m−3). For simplicity we take any adsorption of salt onto the soil’s surfaces as being governed by a linear isotherm, namely
where KD (mg L−1) is the distribution coefficient of salt partitioned between the adsorbed and dissolved states. Using this isotherm (Eqn 7), and if q the volumetric flow of water through the soil is at a steady rate of v (m s−1), then Eqn 6 simplifies to
where R, the so-called retardation factor, is given by
If the solute behaves as a simple tracer, with no adsorption, then KD is zero (Eqn 7), and there is no retardation as R = 1 (Eqn 9).
Our experiments involved pre-leaching of the soil column with FW (Co ≈ 0 or 0.5 dS m−1), and then applying pulses of duration to (s) of staged, influent salt solutions of concentration Ci (mg L−1 or dS m−1). After to, the soil was again leached with FW, prior to the infiltration of another pulse of to with a salt solution of a different Ci.
The steady rate of water flow through the soil, v, can be observed in breakthrough experiments by observing the steady rate of infiltration, or drainage, through the soil, i (m s−1). It follows that
We present our results here, for ease of interpretation, using the ordinate of the cumulative amount of steady-state infiltration, or drainage, up until time t*, namely I(t*) (m). The cumulative infiltration I to time t* is simply found from the steady rate of infiltration, i, using
The initial and upper-boundary conditions that describe each of these infiltration-pulse sequences are
The solution for the efflux concentration of salt at the base of the column, C(L,t), using Eqn 8 subject to Eqn 12 and 13, was given by Carslaw and Jaegar (1959), and as eqn B5 in van Genuchten and Alves (1982) as
where
and exp is the exponential function, and erfc is the complementary error function (Carslaw and Jaegar 1959, appendix II). We take D to be linearly related to pore water velocity v by the dispersivity α (mm): D = α v (Gelhar and Collins 1971).
Eqns 14 and 15 were used to assess, by comparison with the measured breakthrough concentrations of C(L,t), the α of the invading salt solution, and whether the infiltrating salt behaves as a tracer, without adsorption (R = 1). Furthermore, we tested whether all of the soil’s volumetric fraction of water Θ was actively involved in solute transport (Eqn 5), or whether some of the soil’s resident water was immobile and not actively involved in piston displacement of salt (van Genuchten and Wierenga 1976; Clothier et al. 1992).
Field monitoring
Salicornia bigelovii Torrey was sown during the second week of November 2022 (Al-Tamimi et al. 2023). Prior to this on the 25 October 2021, soil samples at 0–300 and 300–600 mm depths were taken at three locations across the site.
The crop was subsampled for the harvest yield of fresh tips on 14 April 2022, then total dry weight on 6 June 2022, and for seed during mid-September 2022. Irrigation was stopped on 31 August 2022 and then the crop had dried off. Following this, on 26 October 2022, three soil samples per plot of GW, RO, and AQ were taken at 0–300 and 300–600 mm for surface soil salinity analysis.
These before-planting and after-harvest surface-soil samples were analysed by a commercial company using the saturated-paste method to determine the EC of the extract in dS m−1 (US Salinity Laboratory Staff 1954). From the measured EC and the water content of the paste, assuming a bulk density of 1.6 kg L−1, these results were converted into a salt concentration in mg kg−1.
Soil profiling
In late October 2022, after the Salicornia crop had been harvested, soil profile cores were taken for analysis of the residual salt content in the soil. Cores were taken down to a depth of 1 m, and soil subsamples were taken in 100-mm increments down the profile. Four core replicate profiles were taken within each of the nine plots which covered the three water types (AQ, GW, and RO) and three types of irrigation-emitters [bubblers (_b), pressure-compensated drippers (_d), and subsurface tape (_s)]. The 360 subsamples were dried in an oven at 105°C for 24 h, and the gravimetric water contents (g g−1) recorded to establish the soil-water content profiles at the end of the season. From each of the subsamples, some 30 g of dried soil was placed in a screw-top bottle, and 50 g of water added. The bottles were vigorously shaken and left to rest, then just prior to using an EC electrode the bottles were again shaken, and soon thereafter the supernatant EC (mg L−1) was measured. Using the measured gravimetric water contents, these data were converted to salt concentrations in mg kg−1. The 10 values for each individual profile were summed down to 1 m, and by knowing that soil bulk density was 1.6 g L−1, these profile measurements were presented in terms of residual salt storage in the top 1 m in kg m−2. This resulted in four 0–1-m salt-storage values at the end of the season for each of the nine irrigation-water and emitter combinations.
Results and discussion
Salt breakthrough curves are presented for the sequential leaching of salt solutions through columns of repacked soil (Section ‘Breakthrough curves’). Then, we discuss the results obtained through soil sampling in the field before and after a season’s growth of Salicornia that had been irrigated with saline water (Section ‘Field profiles’).
Breakthrough curves
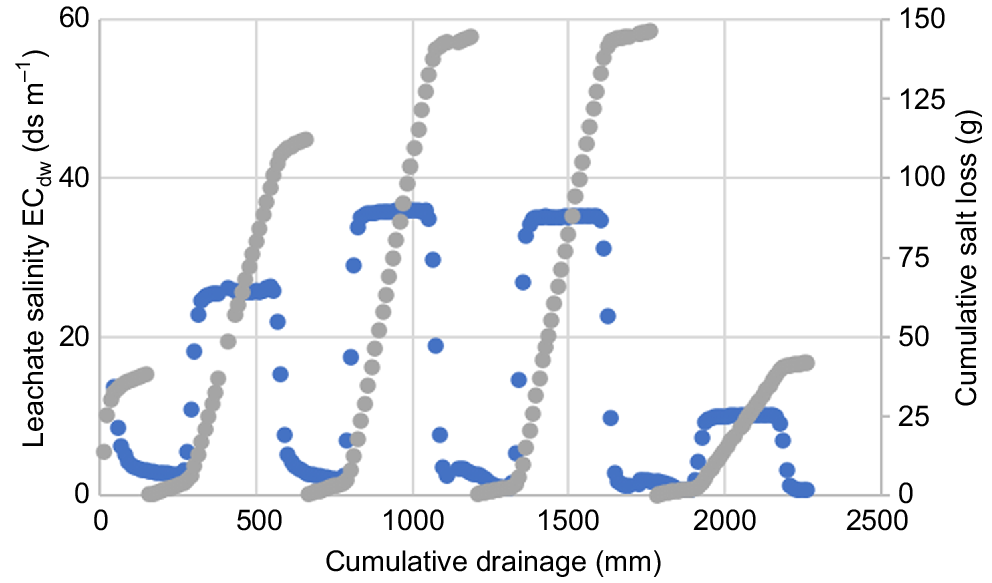
The continuous leachate-salinity measurements and the cumulative salt losses per pulse from the repacked columns are shown in Fig. 2.
The measured salt breakthrough curves plotted against the cumulative drainage following a sequence of irrigation pulses applied to a 450-mm long vertical column of air-dry repacked sand taken from near the experimental plots where Salicornia was grown. Drainage concentration of salt (EC, dS m−1) ( ) and cumulative leaching loss of salt (g) (
 ). An irrigation pulse of freshwater at influent concentration Ci ≈ 0.5 dS m−1 was used initially to wash out the residual salts. Then pulses of length to (s) were sequentially applied in the order of groundwater (Ci = 25 dS m−1), reverse-osmosis brine (Ci = 35 dS m−1), aquabrine (Ci = 35 dS m−1), and finally saline water at EC = 10 dS m−1). Between each set of the saline pulses, the column was flushed out again using freshwater.
The sequential salinity measurements in the leachates within each salt pulse and subsequent FW flushing are given in Fig. 3a–d. The influent salt concentrations Ci (dS m−1) are given along with the measured effluent concentrations C(L). As well, in Fig. 3a–d are presented the solutions to Eqn 14 for each saline pulse and the subsequent flushing. Here we used the measured water content of Θ = 0.32 m3 m−3, which considers that all of the pores’ water is mobile. For sands and coarse-textured soils, solute dispersion is often well described using a dispersivity of α = 2 mm (Clothier et al. 1988). We used this value here. We assumed the salt to be inert with KD = 0, so that R = 1.
Measured salt breakthrough curves ( ) using an ordinate of cumulative infiltration (I, mm) showing a sequence of irrigation ‘pulses’ applied to an L = 450 mm long column of air-dry sand. Irrigation pulses were sequentially applied as (a) groundwater (influent concentration Ci = 25 dS m−1), (b) reverse-osmosis brine (Ci = 35 dS m−1), (c) aquabrine (Ci = 35 dS m−1), and (d) low salinity water (EC = 10 dS m−1). In between each set of saline pulses, the columns were flushed using freshwater at Ci ≈ 0.5 dS m−1. The measured breakthrough curve data () are compared with predictions of C(L) (dS m−1) using Eqn 14 (
 ) with Ө = 0.32 m3 m−3, a dispersivity α = 2 mm, and a retardation of R = 1 as would apply for an inert solute.
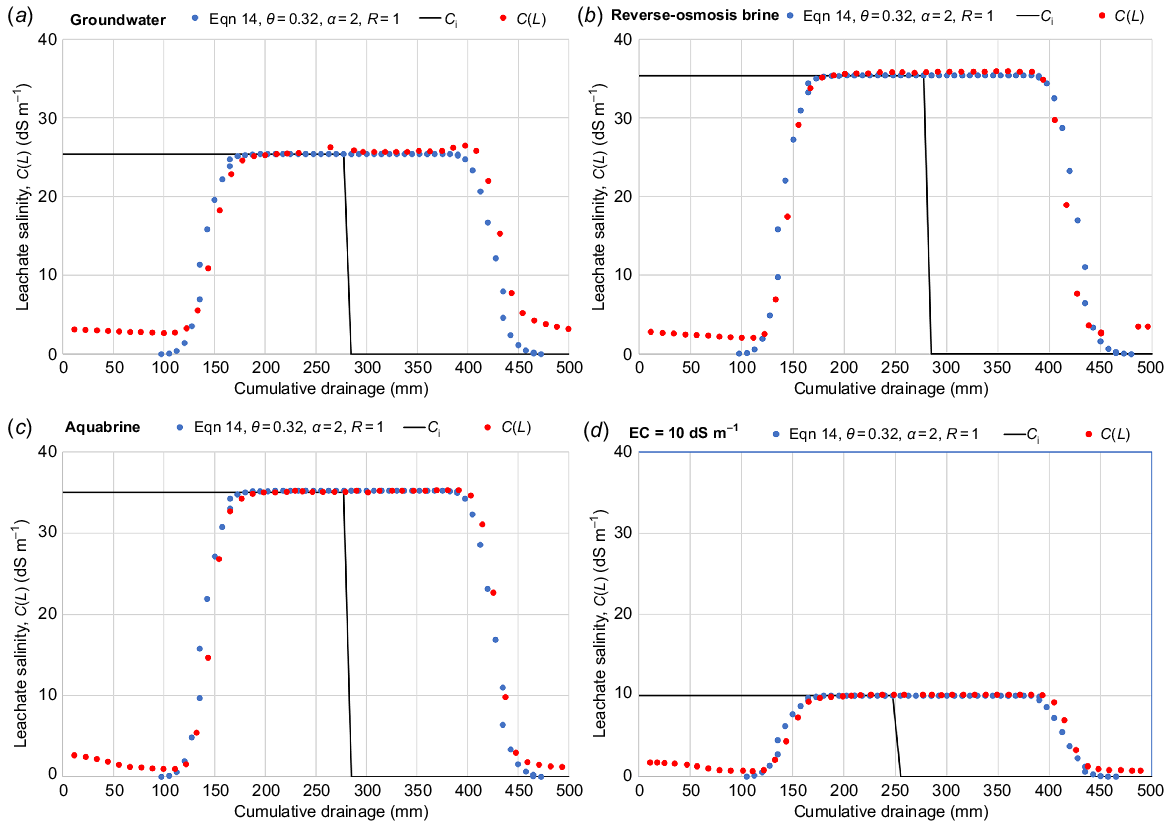
The fit of the solutions to Eqn 14 with the measured data was very good in all cases. The frontal positions of the salt invasion and flushing were well predicted using the inert-solute assumption for salt of R = 1. The transient shapes of the breakthrough curves were also generally well predicted by the assumption that all soil pore water was actively involved in transport, with there being no immobile water. However, on closer inspection there were indications of some volumetric fraction of immobile water slowly transferring into the main fraction of convecting pore water. Prior to the invasion of the successive salt-fronts, there were salt concentrations higher than the 0.5 dS m−1 of the FW used as flushing prior to the salt pulse. Likewise, following the subsequent flushing after the salt pulse, the salt concentrations in the leachate were still above the 0.5 dS m−1 of FW being used to push the salt out. This slow ‘bleeding’ of salt would appear to come via diffusion from salt still contained in the smaller pores of less-mobile water. The small cumulative amount of salt involved in this ‘late bleeding’ of salt after flushing (Figs 2 and 3) verifies that the volumetric fraction of the soil’s pore water that is immobile is very small.
From these breakthrough-curve analyses using soil columns in the laboratory we can confirm that for this desert sand it is apt to consider that all of the soil’s water is actively involved in transport, and that salt behaves as an inert tracer. Furthermore, the breakthrough curves were well predicted using a solute dispersivity of α = 2 mm, such that the invasion and flushing fronts of salt were near-rectangular in shape, indicating that piston displacement of the resident solute is a good assumption. These all lend credence to strategies for effectively managing saline irrigation using LR (Eqn 3), and for assessing environmental impacts using LF (Eqn 5).
Field profiles
To back this up in the field, depthwise profiles of soil-water content and soil-solution salt contents were obtained from soil sampling down to 1 m from 36 soil profiles. The soil water and soil solution results are shown in Fig 4a, b. These profiles were taken following harvest of the crop. These 36 profiles comprise four profiles per treatment block. The nine treatment blocks were made up of plots irrigated with the GW, RO, and AQ saline water, supplied by the three emitter types of bubblers, drippers, and subsurface.
(a) Gravimetric soil-water content (g g−1) of the soil profile under Salicornia plots just prior to planting of the second season, as measured from core samples taken in November 2022. The plots are distinguished by the water source (AQ, aquabrine; GW, groundwater; and RO, brine water from the desalination process), and the emitters (_b, bubblers; _d, drippers; and _s, subsurface). (b) Soil-solution salt concentration (mg L−1) under the Salicornia plots just prior to planting of the second season, as measured from core samples taken in November 2022. The plots are distinguished by the water source (AQ, G, and RO), and the emitters (_b, _d, and _s).
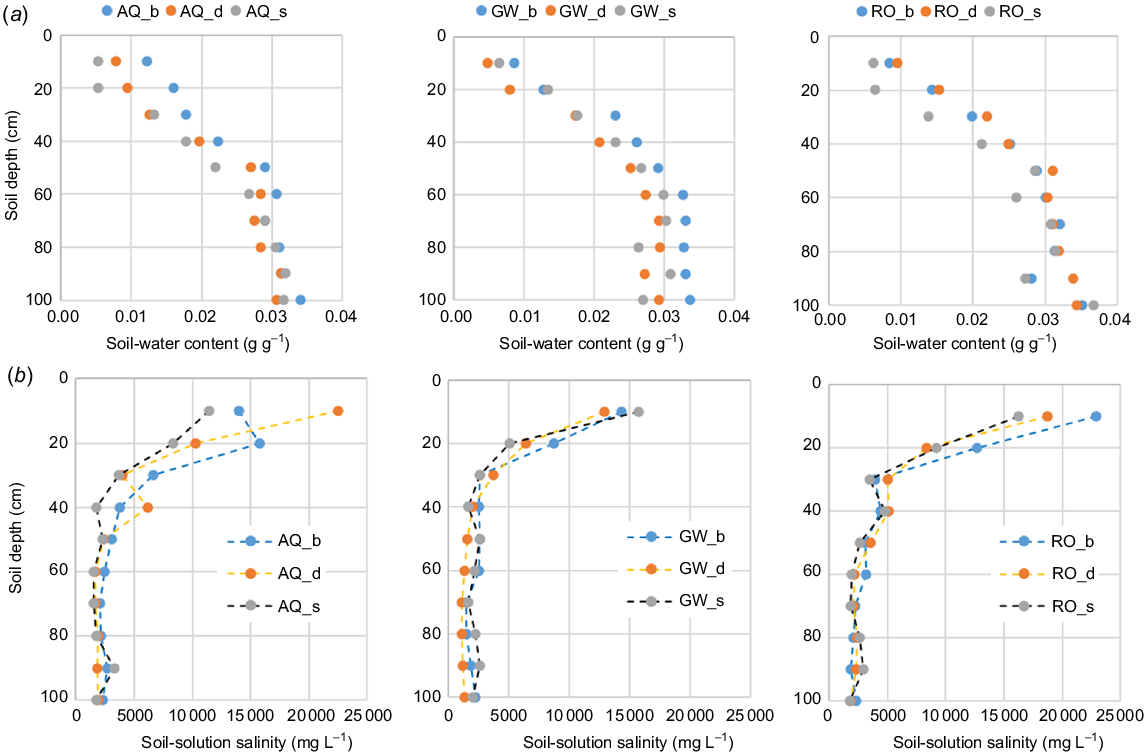
There were no differences between the profiles either by water type or irrigation emitter, and this applied to both the water contents (Fig. 4a) and soil-solution salt contents (Fig. 4b). The soil had dried out throughout the profile (Fig. 4a) by gravity drainage at depth and by root extraction and soil-water evaporation within the top 500 mm. The soil-solution salt content was highest in the top 400 mm, due in part to the concentration of the salt in the diminished soil-water content.
We also measured the profiles of salt in the surface soil before (October 2021) and after (October 2022), i.e. following a season’s growth of Salicornia irrigated with saline water via different irrigation emitters. These soil salt-contents were measured for 0–600 mm using saturated-paste extracts from samples averaged over the two depths (0–300 and 300–600 mm) across the three profiles before and after crop harvest and these were 3610 ± 1510 and 4730 ± 1510 mg kg−1, respectively. The average salt contents following harvest were slightly higher than those beforehand, although this difference was non-significant. This standard monitoring confirms that there was no salt accumulation in the upper part of the soil profile following the season’s irrigation with brackish water.
Because there were no differences in the 36 profiles presented in Fig. 4, in Fig. 5 we present the mean profile of soil salt-content in mg kg−1. That the salt concentrations measured in extracts from our deep-soil profile cores and using the saturated paste method on samples in the surface 600 mm were in broad agreement is heartening, especially given the disparate measurement methodologies used.
The overall profile of salt concentration (, mg kg−1) measured by soil sampling following crop harvest in early November 2022 and expressed depthwise as the means (n = 36) of the 10-cm slabs from the sampling of four profiles within each of the nine plots of the three different saline waters and the three irrigation emitter types.
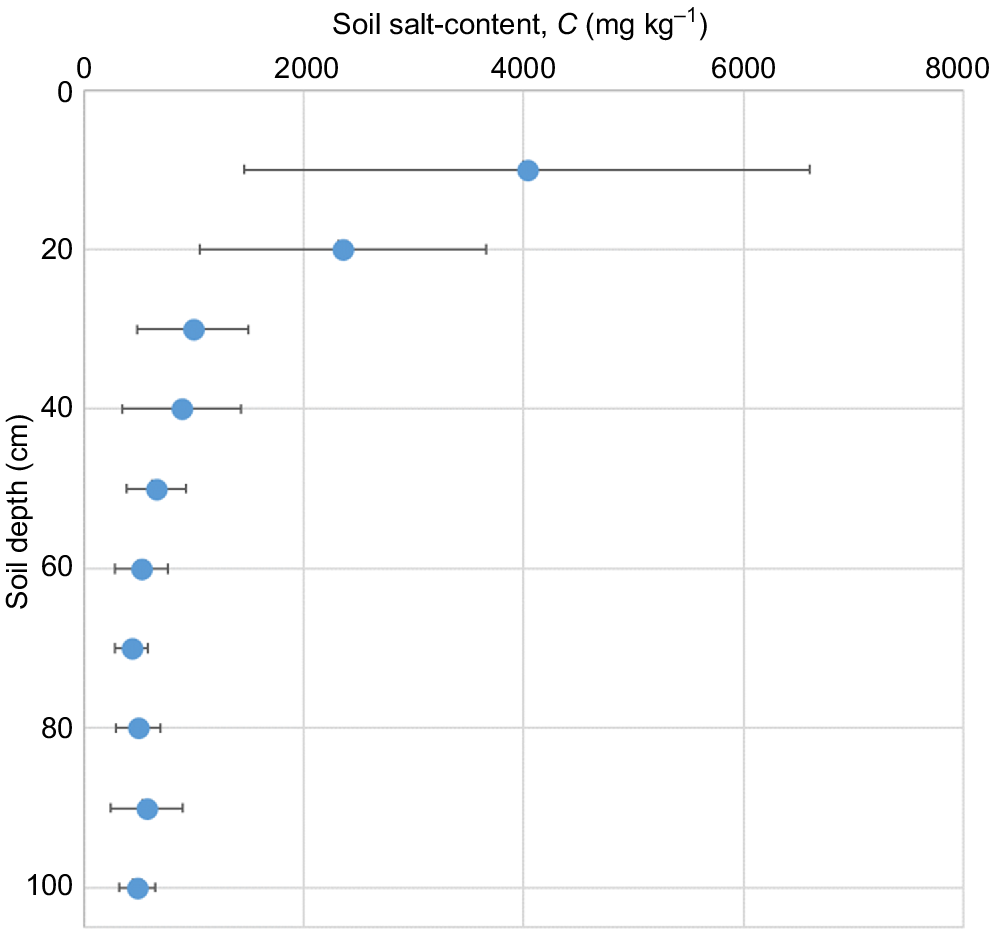
Our 36 profiles showed that more salt was stored in the top 200 mm of the profiles, possibly due to the higher organic matter content there resulting from crop and root residues.
From these profiles of salt concentration data (mg kg−1), the total storage of salt in the top 1 m of soil was calculated (kg m−2) (Table 1). There were no differences among the nine plots, and the average salt storage in the profile was 1.8 ± 0.4 kg m−2. We did not have such measurements before the crop was planted, so this stored salt could be due either to the season’s irrigation with saline waters, or could even be a legacy from beforehand. We calculated that on average some 80 kg m−2 of salt was applied over the season by the saline irrigation water. So even if all the salt measured in the profile after harvest had come from the irrigation water, only 2.25% of the salt had remained in the soil. It could be that some of this 1.8 kg m−2 of residual salt was related to that which had become resident in the immobile fraction of the soil pore water, as we had observed in our breakthrough curves. If so, then this very small amount of ‘immobile salt’ would indeed be resistant to leaching. Nonetheless, some 78 kg m−2 of salt had been leached through the rootzone by the LF and despatched to the groundwater underneath. This reinforces the breakthrough-curve analyses that showed salt was effectively displaced by piston flow through all of the soil pore water. This highlights the value of simply using LR (Eqn 3) to manage the soil-water salinity in the rootzone.
| Treatment | Salt storage 0–1 m (kg m−2) | |
|---|---|---|
| Groundwater – subsurface (GW_s) | 1.4 ± 0.4 | |
| Groundwater – dripper (GW_d) | 1.3 ± 0.3 | |
| Groundwater – bubbler (GW_b) | 1.6 ± 0.4 | |
| Reverse-osmosis brine – subsurface (RO_s) | 1.9 ± 0.4 | |
| Reverse-osmosis brine – dripper (RO_d) | 2.1 ± 0.7 | |
| Reverse-osmosis brine – bubbler (RO_b) | 2.4 ± 0.6 | |
| Aquabrine – subsurface (AQ_s) | 1.5 ± 0.3 | |
| Aquabrine – dripper (AQ_d) | 2.2 ± 0.4 | |
| Aquabrine – bubbler (AQ_b) | 2.2 ± 0.4 | |
| Average | 1.8 ± 0.4 |
Four soil profiles (n = 4) were extracted from each of the nine plots and the salt content of each 10-cm slab measured, so that the profile storage of salt could be calculated. The raw data are shown in Fig. 4b, and the average depthwise profile of salt storage is shown in Fig. 5. The soil bulk density was taken to be 1.6 kg L−1.
Al-Tamimi et al. (2023) calculated that the LF (Eqn 5) could have potentially resulted in an annual rise in groundwater salinity of 2.6 dS m−1 year−1, which could have deleterious consequences for the future quality of the water in the underlying aquifer.
Conclusions
We set out to determine the effectiveness of leaching for maintaining rootzone salinity when irrigating using saline water. The use of the metrics of the LR (Rhoades 1974) and LF (Maas 1990) to manage irrigation with saline water simply assumes a priori that there is a complete flushing of salt from the profile through infiltration. We sought to verify that salt leaching could be described using piston displacement with a small value of the solute dispersivity. Our laboratory measurements and field monitoring confirmed that for these desert soils, which predominate across the Arabian Peninsula, salt can indeed be effectively leached from the profile. We found that the invading irrigation water effectively displaced all of the salt-laden water resident in the soil of the rootzone prior to irrigation and despatched it downwards. This effectiveness has benefits for maintaining equable salinity conditions in the rootzone through implementation of a LR. However, the effectiveness of the salt LF means that the underlying aquifer is receiving drainage water of salinity some 2–3 times higher than that of the irrigation water. This can compromise, in the longer term, the water quality of the groundwater from which irrigation is drawn. This salt dilemma will require careful management to achieve economic crop yields while sustaining the environment in semi-arid and arid regions where saline groundwater is used for irrigation.
Declaration of funding
This research was funded by Environment Agency-Abu Dhabi under the Memorandum of Understanding on Environmental Cooperation signed between the UAE and New Zealand Governments in 2013. The project was managed by OnlyFromNZ Ltd. The research was also carried out in partnership with the International Centre for Biosaline Agriculture based in Dubai, UAE, who provided the research facilities and platform for the experiments and was funded by their internal project ICBA.056 Integrated Agri-Aquaculture Systems (IAAS).
References
Abdelfattah MA, Pain C (2012) Unifying regional soil maps at different scales to generate a national soil map for the United Arab Emirates applying digital soil mapping techniques. Journal of Maps 8(4), 392-405.
| Crossref | Google Scholar |
Al-Tamimi M, Green S, Dahr WA, Al-Muaini A, Lyra D, Ammar K, Dawoud M, Kenyon P, Kemp P, Kennedy L, McLachlan A, Clothier B (2023) Drainage, salt-leaching impacts, and the growth of Salicornia bigelovii irrigated with different saline waters. Agricultural Water Management 289, 108512.
| Crossref | Google Scholar |
Clothier BE, Sauer TJ, Green SR (1988) The movement of ammonium nitrate into unsaturated soil during unsteady absorption. Soil Science Society of America Journal 52, 340-345.
| Crossref | Google Scholar |
Clothier BE, Kirkham MB, McLean JE (1992) In situ measurement of the effective transport volume for solute moving through soil. Soil Science Society of America Journal 56, 733-736.
| Crossref | Google Scholar |
FAO (2021) Global map of salt-affected soils. Food and Agriculture Organization, Rome, Italy. p. 20. Available at fao.org [accessed 23 August 2023]
Gelhar LW, Collins MA (1971) General analysis of longitudinal dispersion in nonuniform flow. Water Resources Research 7, 1511-1521.
| Crossref | Google Scholar |
Hoffman GJ, Van Genuchten MT (1983) Soil properties and efficient water use: water management for salinity control. In ‘Limitations to efficient water use in crop production’. (Eds HM Taylor, WR Jordan, TR Sinclair) pp. 73–85. (American Society of Agronomy, Inc. Crop Science Society of America, Inc. Soil Science Society of America, Inc.)
Shahin SM, Salem MA (2015) The challenges of water scarcity and the future of food security in the United Arab Emirates (UAE). Natural Resources and Conservation 3(1), 1-6.
| Crossref | Google Scholar |
Sherif M, Sefelnasr A, Ebraheem AA, Al Mulla M, Alzaabi M, Alghafli K (2021) Spatial and temporal changes of groundwater storage in the Quaternary aquifer, UAE. Water 13, 864.
| Crossref | Google Scholar |
van Genuchten MT, Wierenga PJ (1976) Mass transfer studies in sorbing porous media I. Analytical solutions. Soil Science Society of America Journal 40, 473-480.
| Crossref | Google Scholar |