

Ammonia/ammonium dissociation coefficient in seawater: A significant numerical correction
Thomas G. Bell A B , Martin T. Johnson A , Timothy D. Jickells A and Peter S. Liss AA Laboratory for Global Marine and Atmospheric Chemistry (LGMAC), School of Environmental Sciences, University of East Anglia, Norwich, Norfolk, NR4 7TJ, United Kingdom.
B Corresponding author. Email: Thomas.Bell@uea.ac.uk
Environmental Chemistry 4(3) 183-186 https://doi.org/10.1071/EN07032
Submitted: 16 April 2007 Accepted: 16 May 2007 Published: 22 June 2007
Environmental context. Quantifying ammonia concentrations in natural waters is important for our understanding of environmental processes that relate, in particular, to aquaculture toxicity and to the transfer of gaseous ammonia into the atmosphere where it plays a role in new particle formation and climate regulation. The proportion of ammonia present in natural waters is determined in part by variations in temperature and salinity. This work identifies that a previous equation for predicting ammonia concentrations over natural temperature and salinity ranges is incorrect and suggests alternative, more appropriate equations. A more accurate estimation of environmental ammonia concentrations is essential if improved estimates are to be made of the flux of ammonia into the atmosphere and the level of ammonia toxicity within aquacultures.
Abstract. The equilibrium between ammonia (NH3) and ammonium (NH4+) in aqueous solution is a function of temperature, pH and the ionic strength of the solution. Here we reveal a 30-year-old error in published work on the thermodynamics of ammonium dissociation in seawater, which has propagated throughout the literature. The work in question[1] [K. H. Khoo, C. H. Culberson, R. G. Bates, J. Solution Chem. 1977, 6, 281] presents an incorrect expression for the variation of the acid dissociation coefficient (Ka) of ammonium with temperature and ionic strength. We detail the error and reveal that it can lead to as much as a 500% overestimation in calculated NH3 concentration under environmental conditions. This finding is highly relevant, particularly for studies of ammonia toxicity and air–sea ammonia exchange. In addition, we recommend two expressions that better reproduce previous experimental work: (i) taken from the work of Johansson and Wedborg,[2] and (ii) our own derivation using the dataset of Khoo et al.[1]
Additional keywords: ammonia, ammonium, aquatic chemistry, correction, dissociation coefficient, seawater.
The biolimiting element nitrogen exists in numerous oxidation states, and many nitrogen-containing compounds are an integral part of biological systems. Here we are specifically interested in ammonia (NH3, a form of reduced N) and its protonated form, ammonium (NH4+). In aqueous environments, nitrogen is taken up and assimilated by phytoplankton for the construction of amino acids and proteins (i.e. for growth and repair). However, whilst NH4+ is an essential nutrient for some photosynthesisers, NH3 is also often excreted as a waste product or metabolite by higher organisms, particularly fish. In aqueous natural environments, complex cycles of production and consumption processes exist for NH3/NH4+.[3–6] Whilst an understanding of the relevant processes and their respective rates is important, the quantification of ambient concentrations is also essential. In particular, knowledge of the exact NH3 concentration is important in studies of air–sea gas exchange and NH3 toxicity within aquacultures; we refer to these specific examples later in this paper.
In aqueous solution, NH3 exists in equilibrium with NH4+, which is a weak acid that reversibly dissociates into ammonia and a proton (Eqn 1).

The position of the equilibrium between ammonium and ammonia is represented by the acid dissociation coefficient of ammonium, Ka (i.e. the equilibrium coefficient for the above reaction):
where square brackets denote concentration. Although the formal expression of Ka should use activities instead of concentrations, seawater Ka values have tended to be expressed using concentration terms and as a function of temperature and ionic strength.[1,2,7] Eqn 2 represents a formula for calculating seawater Ka and thus uses concentrations rather than activities.
When quantifying ammonia concentrations in natural waters, it is most common to measure the sum of the concentrations of ammonium and ammonia, i.e. [NHX] or the ‘total ammonium’ concentration. Total ammonium concentration can be used in combination with H+ concentration [H+] and literature values of Ka to calculate the NH3 concentration (Eqn 3):
It should be noted that direct pH measurements using a glass electrode give H+ activity (or {H+}). It is, therefore, necessary to convert from {H+} into [H+] by dividing {H+} by the activity coefficient (γ), which can be calculated using the following formula[8] (or equivalent):

where S = salinity (dimensionless).
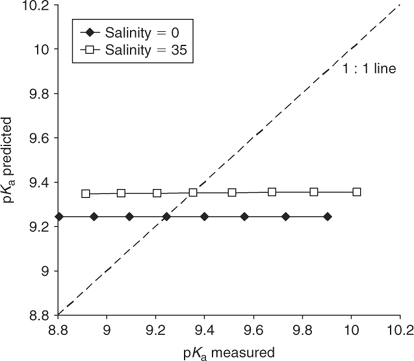
Khoo et al.[1] discuss the findings of a laboratory study on the dissociation of ammonium in synthetic seawater over a range of temperature and ionic strength. They present measured values of pKa (i.e. –log10Ka) and a predictive expression, which is supposed to be derived from their observations (Eqn 5):

where: pKa° is the acid dissociation coefficient of ammonium in pure water at 25°C (9.245[9]), t is the temperature in °C and If is the formal ionic strength of the solution (mol L–1), which can be converted into salinity.[10] However, the expression presented in Eqn 5 fails to reproduce the measurements presented within the paper (see Fig. 1), or equivalent measurements presented elsewhere,[2,7,11] which are in good agreement with the dataset of Khoo et al.[1] In fact, Eqn 5 implies that when If is zero (i.e. pure water) there is no temperature effect on pKa, which from the experimental data[1] is clearly incorrect. No account of the formula’s derivation is provided. We have tried to contact the authors but have been unable to obtain their perspective or an explanation.
|
A more accurate correction for the effect of temperature and salinity on pKa in seawater was published just a few years after Khoo et al.[1] and uses the following equation:[2]
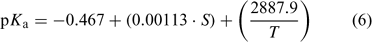
where T is the temperature in K, and S is the salinity (dimensionless). Note that Eqn 6 shows relatively close agreement with the Khoo et al.[1] measured data, as well as other data.[2,7]
In addition, we have derived a predictive equation to represent a best fit to the Khoo et al.[1] dataset (Eqn 7). Later in this paper, we discuss these predictive equations and how well they compare (see Fig. 3 below).

where t is the temperature in °C and If is the formal ionic strength of the solution. This was derived using (i) the average slope of the linear relationships that exist between pKa and t when If is kept constant (slope = 0.0315536), and (ii) the average slope of the linear relationships that exist between pKa and If when t is kept constant (slope = 0.14737). Every one of these linear relationships was strong (mean r2 = 1.00, range 0.99 to 1.00). To derive Eqn 7, the intercept of the line when both If and t were zero was derived (10.0423) and the t function (0.03145536·t) and If function (0.14737·If) applied to this value. As might be expected, agreement between the measured data of Khoo et al.[1] and that predicted using Eqn 7 is very good (r2 = 1.00, slope = 1.00, intercept = 0.01).
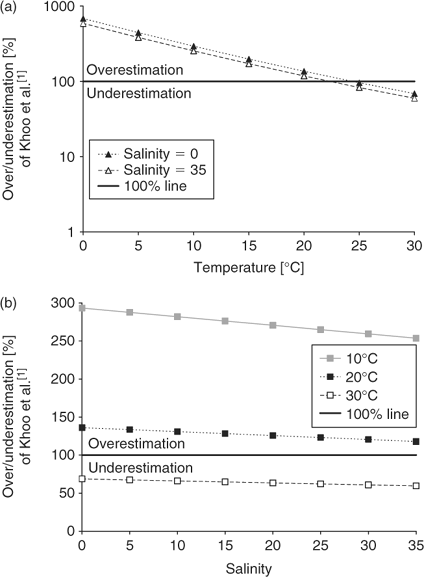
Ammonia concentrations for typical surface water conditions based on the incorrect pKa values from Khoo et al.[1] (Eqn 5) are compared to the values of Johansson and Wedborg[2] (Eqn 6). These plots (Fig. 2) demonstrate the percentage over/underestimation (Eqn 8) for environmental ranges of temperature (Fig. 2a) and salinity (Fig. 2b):
|
|
where [NH3(aq)](1977) is the NH3 concentration calculated using Khoo et al.[1] and [NH3(aq)](1980) is the NH3 concentration calculated using Johansson and Wedborg.[2] Greater than 100% is an overestimation of ambient NH3 concentration while less than 100% is an underestimation. In general, using the Khoo et al.[1] formula leads to an overestimation of ambient NH3 concentrations except above ~23°C (Fig. 2a). Changes in salinity have a substantially smaller effect (Fig. 2b).
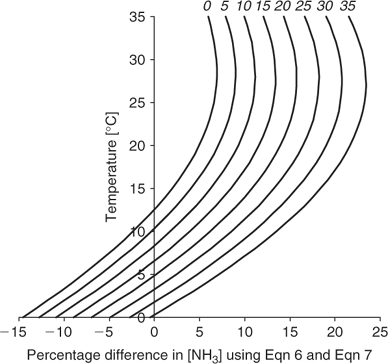
Although Eqn 6 and Eqn 7 compare well with the datasets from which they were derived, it is useful to compare the numerical outcomes of these relationships. Fig. 3 displays the percentage difference in [NH3] over natural temperature and salinity ranges:
where [NH3(aq)](Eqn 6) is the NH3 concentration calculated using Eqn 6 and [NH3(aq)](Eqn 7) is the NH3 concentration calculated using Eqn 7. A value of zero represents no difference between Eqn 6 and Eqn 7. There is a range in the percentage difference in [NH3] (a maximum of 23% difference when S = 35, t = 27°C) between Eqn 6 and Eqn 7 (Fig. 3). This is likely a result of the methodological differences between Khoo et al.[1] and Johansson and Wedborg;[2] note that equivalent differences can also be seen in the data they present.[2] In particular, Khoo et al.[1] used a sulfate-free buffer, while Johansson and Wedborg[2] used a sulfate-containing medium. Johansson and Wedborg[2] consider this the dominant cause for the differences observed. The percentage difference in [NH3] that can be generated by using either Eqn 6 or Eqn 7 is substantial and warrants further study.
It is clear that identifying the appropriate concentration of NH3 is important in environmental chemistry. To highlight this, two examples have been chosen, although many more are likely to exist within the literature: (i) aquaculture studies; and (ii) air–sea NH3 flux studies. These examples have been chosen in part because many research groups (including our own) have used the Khoo et al.[1] equation as part of aquaculture studies[12,13] and air–sea NH3(g) exchange studies.[14–16]
-
It has been shown that NH3 is toxic to many organisms above certain threshold levels.[12,17] Aquacultures that maintain temperatures below 20°C and use the Khoo et al.[1] expression will substantially overestimate the level of NH3 present, which is relevant in terms of toxicity to fish and the related costs of removing NH3 from water recycled within the aquaculture.[13]
-
The exchange of gaseous NH3 between the oceans and the atmosphere is part of the global redistribution and cycling of nitrogen.[18] Either an over or under estimation of aqueous NH3 concentrations will have substantial impacts upon the calculation of the air–sea flux of NH3(g) because the flux is dependent upon simultaneous measurements of oceanic and atmospheric concentrations. This is particularly important in oceanic regions away from terrestrial influences, where the atmospheric and oceanic concentrations are such that the direction of flux can change as a result of relatively small changes in concentration.[19,20]
In summary, there is an unexplained error in the Khoo et al.[1] formula (Eqn 5) that leads to substantial error in the estimation of true NH3 concentrations in seawater (Fig. 1). To appropriately estimate the true concentration of NH3(aq), the formula that should be used to calculate pKa is either Eqn 6[2] or Eqn 7 (this work). However, significant differences also exist between the products of these two equations.
Acknowledgements
We thank two anonymous reviewers for their constructive comments that helped improve the original manuscript. This work was supported by the UK Natural Environment Research Council (NERC) as part of a tied studentship (Bell; NER/S/J/2002/11030) and a SOLAS KT research grant (Liss; NE/E001696/1).
[1]
K. H. Khoo,
C. H. Culberson,
R. G. Bates,
J. Solution Chem. 1977, 6, 281.
| Crossref | GoogleScholarGoogle Scholar |
| Crossref | GoogleScholarGoogle Scholar |
| Crossref | GoogleScholarGoogle Scholar |
| Crossref | GoogleScholarGoogle Scholar |
| Crossref | GoogleScholarGoogle Scholar |
| Crossref | GoogleScholarGoogle Scholar |
| Crossref | GoogleScholarGoogle Scholar |
| Crossref | GoogleScholarGoogle Scholar |
| Crossref | GoogleScholarGoogle Scholar |
| Crossref | GoogleScholarGoogle Scholar |
| Crossref | GoogleScholarGoogle Scholar |
| Crossref | GoogleScholarGoogle Scholar |

[19]
[20]