

Solid phase microextraction speciation analysis of triclosan in aqueous media containing sorbing nanoparticles
Katarzyna ZielińskaLaboratory of Physical Chemistry and Colloid Science, Wageningen University, Dreijenplein 6, 6703 HB Wageningen, the Netherlands. Email: katarzyna.zielinska@wur.nl; kzielinska@gmail.com
Environmental Chemistry 11(1) 72-76 https://doi.org/10.1071/EN13167
Submitted: 30 August 2013 Accepted: 21 December 2013 Published: 25 February 2014
Environmental context. Speciation analysis of organic compounds in aquatic media is often performed using solid phase microextraction with the assumption that only the free organic form is accumulated. We show that in the presence of silica nanoparticles, this interpretation is confounded by partitioning of nanoparticulate-bound compounds between water and the solid phase, as well as their aggregation at solid–bulk medium interfaces. Equilibrium measurement of the target analyte is feasible if the solid phase is protected by a suitable membrane.
Abstract. Solid phase microextraction (SPME) is applied in the speciation analysis of the hydrophobic compound triclosan in an aqueous medium containing sorbing SiO2 nanoparticles (NPs). It is found that these NPs, as well as their complexes with triclosan, partition between the bulk medium and the solid phase poly(dimethylsiloxane) (PDMS). Furthermore, they appear to aggregate at the PDMS–water interface. The total triclosan concentration in the solid phase thus includes both the free and the NP-bound forms. Proper computation of the analyte concentration in the sample medium requires (i) consideration of the speciation of triclosan inside the solid phase and (ii) elimination of the effects of aggregation of NP complexes at the solid phase–bulk medium interface. Possible solutions include application of a protective membrane with pore size smaller than the NP diameter. This allows measurement of the free triclosan concentration, albeit at the cost of longer accumulation times and loss of kinetic information on the triclosan–NP complex.
Additional keyword: SPME.
Introduction
The freely dissolved form of an organic compound is often considered to be the predominant bioavailable species that governs toxicity for organisms.[1,2] One of the most common methods used to measure the concentration of free organics is solid phase microextraction (SPME).[3–5] This technique is based on partitioning of organic molecules between the sample solution and a polymer solid phase. Reliable and straightforward SPME analysis requires two conditions to be met. First, only the free form of the target analyte partitions between the sample medium and the solid phase.[1] Second, the freely dissolved concentration is not depleted by the SPME (so-called non-depletive SMPE, nd-SPME[1,4]). Fulfilment of both conditions is not difficult for a sample containing the target analyte only, but in heterogeneous environmental samples containing binding components such as humic acids, nanoparticles and proteins, it becomes a challenge. Association of target molecules with different sample constituents generally leads to lowering of the concentration measured by SPME (if only the free form is accumulated)[1,6,7] and significant changes in the extraction kinetics (for example by labile complexes of the target that facilitate the diffusive transport[8]). A recent study utilising confocal laser spectroscopy showed, however, that complexing silica nanoparticles do partition into the extracting solid phase, poly(dimethylsiloxane) (PDMS).[9] Conventional interpretation may then give rise to overestimation of the free concentration of the target, as its nanoparticulate complex species entering the solid phase will be measured along with the free analyte. Moreover it can slow down the overall kinetics of the partitioning of the target analyte.
Triclosan (5-chloro-2-(2,4-dichlorophenoxy)phenol) was chosen as an exemplary target analyte. It is a widely employed antimicrobial, antibacterial and preservative agent used in a variety of personal care and consumer products[10,11] and has been detected in wastewater, surface waters as well as in seawater. Its high octanol–water partition coefficient (log Kow of 5.4) indicates the tendency of the compound to be sorbed by organic material and sufficiently hydrophobic surfaces.[12,13] Triclosan presents a low toxicity towards mammals and is partially removed during conventional wastewater treatments. However, it was proved that it is acutely and chronically toxic to aquatic organisms and can be bioaccumulated in fish tissue.[14,15] In addition, different studies have suggested that under certain conditions (e.g. in the presence of hypochlorite or in photochemical reactions) the parent species can be converted into more toxic and persistent compounds such as polychlorinated dibenzodioxins, chlorinated phenols and polychlorinated biphenyl ethers.[11] Thus, the environmental fate of triclosan remains a concern that merits further attention.
In previous SPME studies, using a polyacrylate solid phase, on diclofenac in the presence of sorbing nanoparticles straightforward behaviour was observed, i.e. the accumulation process was controlled by the diffusion limited partitioning of the free diclofenac.[16] In the present work, the focus is on a more involved system, namely triclosan in the presence of sorbing SiO2 nanoparticles that enter the solid phase PDMS. We shall consider the role of the nanoparticulate species, analyse the potential interferences and suggest possible ways to get around them.
Experimental
Materials
Triclosan (purity >97 %, diffusion coefficient in water 6.1 × 10⁻¹⁰ m2 s–1 at 25 °C[17]), Ludox LS silica nanoparticles (mean radius of 7.5 nm as previously measured,[9,18] diffusion coefficient of 2.7 × 10⁻¹¹ m2 s–1, molar mass computed as ~2 × 10⁶ g mol–1[6]), acetone, ethanol and liquid chromatography–mass spectrometry (LC-MS) grade methanol were obtained from Sigma–Aldrich (Zwijndrecht, the Netherlands). Glass fibres with a core diameter of 110 μm and a 100-μm PDMS film (volume 0.6667 μL cm–1) were obtained from Poly Micro Industries (Phoenix, AZ). Regenerated cellulose dialysis membrane (cut-off 3500 Da, pore size <5 nm) were from Spectra/Por Dialysis (Breda, the Netherlands). The ultra-pure deionised water (resistivity <18 MΩ cm) was prepared by a Millipore water purification system (Millipore Waters, Amsterdam, the Netherlands) equipped with an organic-free kit. Oasis HLB cartridges (Waters, Milford, MA, USA) were used to transfer triclosan from water to organic solvent before chromatographic analysis.
Gas chromatography
Triclosan concentrations were determined by gas chromatography (HP 6890 gas chromatograph, Agilent Technologies Inc., Palo Alto, CA, USA) equipped with a split/splitless injector. Separations were carried out using an Agilent 190915-413 column, 30 m × 0.25 mm × 0.25-μm film thickness. Helium (99.999 %) was used as a carrier gas at a flow rate of 1 cm3 min–1. The temperature program was set up as follows: 70 °C, 2-min isothermal, 25 °C min–1 to 120 °C, then at 5 °C min–1 to 250 °C, followed by an isothermal hold at this temperature. Detection was performed with a mass spectrometer (HP 5973 Mass Selective Detector, Agilent) under electron-impact ionisation (70 eV, 200 °C) and full-scan (m/z 35–435) or selected ion-monitoring conditions (m/z 288).
Preparation and characterisation of the triclosan–SiO2 nanoparticle dispersions
Sample solutions were prepared by spiking Millipore water with triclosan dissolved in methanol and adding aliquots of a standard Ludox LS nanoparticles dispersion to give final triclosan concentrations ranging from 6.9 × 10⁻³ to 3.4 × 10⁻² mol m–3 and nanoparticle concentrations of 8.2 × 10⁻³ mol m–3. Using nitric acid, the dispersions were adjusted to pH 5.0 as a compromise between sufficient negative charge on the nanoparticles (increasing with increasing pH) and sufficient sorption affinity for triclosan (increasing with decreasing pH). After separation of the nanoparticles by centrifugation (1.5 h at 50 000g at 20 °C) a certain volume of the supernatant was passed through a HLB Oasis cartridge (previously washed with 2 cm3 of methanol and 2 cm3 of Millipore water). The retained triclosan was eluted with 3 × 0.5 cm3 of methanol (recovery 98 %); 2 μL of the HLB eluent was injected into a gas chromatograph–mass spectrometer for an independent reference of the free triclosan content.
SPME measurements
The PDMS fibres (chosen on the basis of partition data given by Canosa et al.[11]) were cut to a length of 2 cm and cleaned with methanol. Each individual fibre was exposed to 10 cm3 of sample dispersion, containing 3.4 × 10⁻² mol m–3 of triclosan and 8.2 × 10⁻³ mol m–3 of SiO2 nanoparticles, under mild stirring on a rock and roller shaker (Meettech, NL) at ambient temperature in the laboratory (20 ± 2 °C). Triplicate measurements were performed. The amount of triclosan accumulated by the solid phase was determined by extracting the fibre with 1 cm3 of methanol. Some of the exposed fibres were first placed in a vial filled with water and treated with ultrasound (Transsonic 570, Elma) in order to try to remove particle aggregates from the PDMS surface. Alternatively, some fibres were first rinsed by one of the solvents: distilled water, acetone or ethanol and gently wiped with tissue before the methanol extraction. The methanol extract was directly injected into a gas chromatograph system for quantification.
The same basic procedure was applied to membrane-protected SPME fibres. The dialysis membrane tubes (length 3 cm, flat width 18 mm) were pre-soaked in water before use. After introduction of the SPME fibre, the membrane tube was sealed at both ends and then immersed in the stirred sample dispersion (50 cm3).
Results and discussion
Sorption of triclosan by SiO2 nanoparticles
Considering previous work on the adsorption of different types of molecules on silica,[19] we can assume that triclosan may be bound to the SiO2 nanoparticles as a result of the formation of hydrogen bridges between silanol groups (Si–OH) and the hydroxy group of the analyte, and hydrophobic interactions.[19,20] The extent of adsorption of triclosan by SiO2 nanoparticles at pH 5.0 is presented in Fig. 1 in terms of the surface concentration of triclosan (ΓTCS–NP, mol m–2) v. its free concentration in bulk medium (c*w,TCS). The set of data can be described by a Langmuir type isotherm (see dashed line in Fig. 1):

where ΓS,max is the maximum concentration of binding sites, and KTCS is the equilibrium constant that can be expressed as the ratio between the rate constants for adsorption (kad) and desorption (kdes). For the present triclosan–SiO2 nanoparticle system the apparent maximum surface concentration is ~6 × 10⁻⁹ mol m–2 corresponding to three molecules of triclosan bound to one SiO2 nanoparticle. The isotherm yields a thermodynamic sorption constant (KTCS) equal to 6 × 10² m3 mol–1 (Henry coefficient of 3.6 × 10⁻³ m), which corresponds to fairly weak association. For a nanoparticle concentration (c*NP) of 8.2 × 10⁻³ mol m–3 and total analyte concentration of 3.4 × 10⁻² mol m–3 (concentrations used in the SPME experiment) ~45 % of triclosan is bound by nanoparticles. It is worth mentioning that in the linear regime of the isotherm where nanoparticle binding sites are in large excess, the stability of triclosan–nanoparticle complexes depends only on the nanoparticle concentration, and for lower c*w,TCS the ratio between free and nanoparticle-bound triclosan will remain the same for a given c*NP.
|
Lability of the triclosan–nanoparticle complex
It may be expected[6,7] that the lability of the complex triclosan–nanoparticulate species is determined by the rate of diffusive transport of triclosan between the bulk medium and the surface of the spherical nanoparticles. The rate of adsorption (Rad, mol m–3 s–1) is given by kadc*NPc*w,TCS where c*NP is the bulk concentration of nanoparticles (mol m–3). The rate constant of adsorption (kad, m3 mol–1 s–1) is given by[21]:

where rNP, Dw,TCS and NA are the respective particle radius, the diffusion coefficient of the analyte in water and Avogadro’s number. Substituting the values for rNP and Dw,TCS into Eqn 2 yields a kad value of 3.4 × 10⁷ m3 mol–1 s–1. In combination with the thermodynamic sorption constant (KTCS) the derived rate constant for desorption is found to be 5.7 × 10⁴ s–1. Such values of kad and kdes render the system dynamic on the time scale of SPME, implying that the bulk equilibrium between free and bound organic is maintained. Under conditions of the present SPME experiments, the ratio between the kinetic flux and the diffusive flux of the nanoparticle-bound TCS is computed to be ~1.4 × 10³ (for details on the computation, see Zielińska et al.[6]). Because this is much larger than unity, the triclosan–SiO2 nanoparticle complex system will be fully labile in the process of transfer of triclosan molecules from the bulk medium to the SPME surface. Thus the equilibrium between nanoparticle-bound and free analyte is also maintained in the diffusion layer at the bulk medium–solid phase interface.
Conventional SPME (without nanoparticle-blocking membrane)
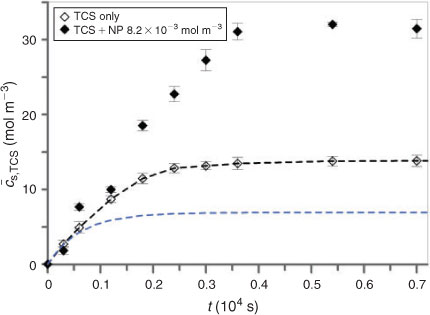
The first step of our SPME studies was to measure the extraction of triclosan from water into the PDMS solid phase as a function of time. The resulting temporal profile is presented in Fig. 2 (open symbols) as the average concentration of analyte within the PDMS layer (

|
The kTCS refers to the accumulation rate constant, which for Ksw,TCS >> 1 (and the diffusion coefficient of triclosan in the solid phase (Ds,TCS) not much smaller than Dw,TCS) is generally determined by the diffusive mass transfer in the aqueous phase[7]:

where As and Vs are the surface area and volume of the solid polymer coating, and δ is the aqueous steady-state diffusion layer thickness. The value of kTCS obtained for accumulation of triclosan in the PDMS solid phase is found to be 1.5 × 10⁻³ s–1 with a corresponding effective diffusion layer thickness of ~40 μm.
The simplest case of an analyte–nanoparticle system would be that in which the sorbing particles are non-partitioning so that only the free form of the target organic analyte is accumulated in the solid phase.[3,4] The extracted amount of analyte is then lower than that for the blank (sample containing organic only), reflecting the lower concentration of its free form in the sample medium (see blue line in Fig. 2).[23] In contrast with this expectation, addition of silica nanoparticles to a triclosan solution apparently results in higher solid phase concentrations of analyte (Fig. 2). As found previously, SiO2 nanoparticles are able to accumulate in the PDMS phase and they also appear to form aggregates at its interface with water.[9] Thus their complexes with triclosan are an additional form of target analyte associated with the extracting phase in SPME analysis. Therefore, rigorous interpretation must consider speciation in the solid phase, where in principle all the species (free triclosan, free nanoparticles and triclosan–nanoparticle complexes) are present.
The initial curve slope obtained for the sample containing nanoparticles was higher than that for the NP-free blank. As reported previously, after immersing the solid phase into the sample dispersion large aggregates of nanoparticles (carrying adsorbed analyte molecules) appear at the surface of the solid phase. For the details on this aggregation process, see Zielińska and van Leeuwen.[9] Unfortunately, these aggregated nanoparticulate complexes appear to be firmly attached to the surface of the solid phase. Even after various attempts to remove them (by means of rinsing with different solvents, wiping and exposing to ultrasound) the amount of measured analyte remains the same as for un-treated fibres. This suggests that the triclosan bound by the nanoparticle aggregates is included in the accumulation data, because it is known that the partition coefficient for the nanoparticles is significantly smaller (Ksw,NP = 5[9]) than that for triclosan (Ksw,TCS = 4 × 10²). Interestingly, the situation in which macromolecular or nanoparticulate components of the sample (e.g. proteins[3,24] and humic acids[25]) are sorbed by the solid phase is generally qualified as a form of fouling[26,27] and so far judged to be irrelevant for the SPME measurement.[1,4]
The time to reach equilibrium in samples containing nanoparticles is longer than that for the particle-free case (see Fig. 2). This might be related to slow diffusion inside the solid phase of the triclosan–nanoparticle species, which feature (i) low partition coefficients (Ksw,TCS–NP << Ksw,TCS) and (ii) low mobilities. Based on the partition coefficients for analyte and nanoparticles it seems that in the solid phase, in contrast to the sample medium, most of the analyte should occur in the free form. Owing to the difference in affinities of triclosan and silica nanoparticles towards the solid phase, the sorption coefficient inside the solid phase (Ks) is two or three orders of magnitude smaller than that in water (calculated according to the equation given in Zielińska and van Leeuwen[9]).
Membrane-protected SPME
Partitioning of nanoparticulate species into the solid phase could be simply prevented by the use of a protective membrane with appropriate pore size that allows the free diffusion of the analyte triclosan while blocking the nanoparticulate species. This approach was used previously for the SPME of organics in samples containing humic acids[25] and proteins.[16,28] Application of a protective film should prevent any interaction between the nanoparticulate complexes and the solid phase, including the extensive aggregation of nanoparticulate species at the solid phase–bulk medium interface. Thus we also performed the extraction of triclosan from the aqueous SiO2 nanoparticle dispersion by PDMS protected with a dialysis membrane with pore size <5 nm. The results are presented in Fig. 3.
|
For the blank the eventual equilibrium concentration of the analyte extracted by membrane-protected PDMS is the same as for the conventional SPME described above. In the presence of 8.2 × 10⁻³ mol m–3 nanoparticles, however, the equilibrium concentration of triclosan in the solid phase is found to be ~55 % of that for the blank. This outcome reflects fairly well the speciation in medium as independently verified (see Experimental section) and underlines the effectiveness of the membrane used. In contrast, the time to reach equilibrium has increased tremendously as compared to experiments without protecting membrane (reaching the order of several days). This not only generates practical inconvenience, it also invalidates evaluation of the temporal extraction profile in terms of the basic kinetic parameters of the extraction process, and labilities of the nanoparticulate species in the medium. The problem is that analyte molecules have to diffuse through the protective membrane and the membrane-protected solution volume before reaching the solid phase. Improvements of the membrane-protected mode may be envisaged, but some uncertainties with respect to the precise diffusion conditions will be inherent to applying an additional membrane. Still, for equilibrium SPME the protective membrane is an effective tool to prevent overestimation of the free concentration of the analyte in complex samples containing different particulate species that simultaneously partition into the extraction phase.
Conclusion
Nanoparticulate complexes of triclosan partition into PDMS and form aggregates at the solid phase–water interface. This causes changes in triclosan’s SPME extraction profiles and may lead to serious overestimation of its free concentration in the sample medium. One of the ways to avoid interferences attributable to partitioning of nanoparticulate complexes is the application of a protective membrane with a pore size smaller than the nanoparticle diameter. The present study confirms this for the microextraction of triclosan from samples containing sorbing SiO2 nanoparticles. The drawback of this protective mode is prolongation of the SPME equilibration time and loss of kinetic information from the temporal accumulation profile. For optimisation of membrane-protected SPME it will be necessary to develop devices with better defined geometries, which should minimise the adverse effects on diffusive mass transfer of analyte species. A possible solution along these lines might be in the dedicated modification of the PDMS surface, e.g. by a polyelectrolyte brush that repels oppositely charged nanoparticles.
Acknowledgements
The assistance of Prof. Herman P. van Leeuwen and Prof. Raewyn M. Town during the course of the presented investigations is kindly acknowledged. This work was performed within the framework of the BIOMONAR project funded by the European Commission’s seventh framework program (Theme 2: Food, Agriculture and Biotechnology), under grant agreement 244405.
References
[1] M. B. Heringa, C. Hogevonder, F. Busser, J. L. M. Hermens, Measurement of the free concentration of octylphenol in biological samples with negligible depletion-solid phase microextraction (nd-SPME): analysis of matrix effects. J. Chromatogr. B 2006, 834, 35.| Measurement of the free concentration of octylphenol in biological samples with negligible depletion-solid phase microextraction (nd-SPME): analysis of matrix effects.Crossref | GoogleScholarGoogle Scholar | 1:CAS:528:DC%2BD28XjsFOgt7s%3D&md5=a4aeee014d07d4e9f07df460df09d423CAS |
[2] J. M. Conder, T. W. La Point, Solid-phase microextraction for predicting the bioavailability of 2,4,6-trinitrotoluene and its primary transformation products in sediment and water. Environ. Toxicol. Chem. 2005, 24, 1059.
| Solid-phase microextraction for predicting the bioavailability of 2,4,6-trinitrotoluene and its primary transformation products in sediment and water.Crossref | GoogleScholarGoogle Scholar | 1:CAS:528:DC%2BD2MXjslantLw%3D&md5=86d6538592b6a313b870b3a555be4babCAS | 16110982PubMed |
[3] A. G. Oomen, P. Mayer, J. Tolls, Nonequilibrium solid-phase microextraction for determination of the freely dissolved concentration of hydrophohic organic compounds: matrix effects and limitations. Anal. Chem. 2000, 72, 2802.
| Nonequilibrium solid-phase microextraction for determination of the freely dissolved concentration of hydrophohic organic compounds: matrix effects and limitations.Crossref | GoogleScholarGoogle Scholar | 1:CAS:528:DC%2BD3cXjs1KnsLk%3D&md5=27578c8175a0fef14e2bd0e414914308CAS | 10905310PubMed |
[4] M. B. Heringa, J. L. M. Hermens, Measurement of free concentrations using negligible depletion-solid phase microextraction (nd-SPME). Trends Analyt. Chem. 2003, 22, 575.
| Measurement of free concentrations using negligible depletion-solid phase microextraction (nd-SPME).Crossref | GoogleScholarGoogle Scholar | 1:CAS:528:DC%2BD3sXotVCmt7o%3D&md5=42a64fc1103a6b2f45c39e70fd285487CAS |
[5] B. Bojko, E. Cudjoe, G. A. Gomez-Rios, K. Gorynski, R. Jiang, N. Reyes-Garces, S. Risticevic, E. Silva, O. Togunde, D. Vuckovic, J. Pawliszyn, SPME – Quo vadis? Anal. Chim. Acta 2012, 750, 132.
| SPME – Quo vadis?Crossref | GoogleScholarGoogle Scholar | 1:CAS:528:DC%2BC38XhtFSgs7nO&md5=d80ffde987738d3f45f1bbf0a13a6223CAS | 23062435PubMed |
[6] K. Zielińska, H. P. van Leeuwen, S. Thibault, R. M. Town, Speciation analysis of aqueous nanoparticulate diclofenac complexes by solid-phase microextraction. Langmuir 2012, 28, 14672.
| Speciation analysis of aqueous nanoparticulate diclofenac complexes by solid-phase microextraction.Crossref | GoogleScholarGoogle Scholar | 22989313PubMed |
[7] K. Benhabib, R. M. Town, H. P. van Leeuwen, Dynamic speciation analysis of atrazine in aqueous latex nanoparticle dispersions using solid phase microextraction (SPME). Langmuir 2009, 25, 3381.
| Dynamic speciation analysis of atrazine in aqueous latex nanoparticle dispersions using solid phase microextraction (SPME).Crossref | GoogleScholarGoogle Scholar | 1:CAS:528:DC%2BD1MXhslOqt7s%3D&md5=053f26eada1b26e5ba2d84ecc1e01cb1CAS | 19708138PubMed |
[8] M. A. Jeannot, F. F. Cantwell, Solvent microextraction as a speciation tool: determination of free progesterone in a protein solution. Anal. Chem. 1997, 69, 2935.
| Solvent microextraction as a speciation tool: determination of free progesterone in a protein solution.Crossref | GoogleScholarGoogle Scholar | 1:CAS:528:DyaK2sXktFSksb0%3D&md5=0f5efa16abc9532133e57621d7c1fc27CAS | 9253247PubMed |
[9] K. Zielińska, H. P. van Leeuwen, Role of nanoparticles in analytical solid phase microextraction. Environ. Chem. 2013, 10, 120.
| Role of nanoparticles in analytical solid phase microextraction.Crossref | GoogleScholarGoogle Scholar |
[10] H. Singer, S. Muller, C. Tixier, L. Pillonel, Triclosan: occurrence and fate of a widely used biocide in the aquatic environment: Field measurements in wastewater treatment plants, surface waters, and lake sediments. Environ. Sci. Technol. 2002, 36, 4998.
| Triclosan: occurrence and fate of a widely used biocide in the aquatic environment: Field measurements in wastewater treatment plants, surface waters, and lake sediments.Crossref | GoogleScholarGoogle Scholar | 1:CAS:528:DC%2BD38XotlCjs7k%3D&md5=fc6497eac0f88a9a58dab50264daf16eCAS | 12523412PubMed |
[11] P. Canosa, I. Rodriguez, E. Rubi, R. Cela, Optimization of solid-phase microextraction conditions for the determination of triclosan and possible related compounds in water samples. J. Chromatogr. A 2005, 1072, 107.
| Optimization of solid-phase microextraction conditions for the determination of triclosan and possible related compounds in water samples.Crossref | GoogleScholarGoogle Scholar | 1:CAS:528:DC%2BD2MXjtlWjsrg%3D&md5=6d1aaf4b4de830ca7d3a57b5f85c0c36CAS | 15881465PubMed |
[12] C. Wu, A. L. Spongberg, J. D. Witter, Adsorption and degradation of triclosan and triclocarban in solis and biosolids-amended soils. J. Agric. Food Chem. 2009, 57, 4900.
| Adsorption and degradation of triclosan and triclocarban in solis and biosolids-amended soils.Crossref | GoogleScholarGoogle Scholar | 1:CAS:528:DC%2BD1MXlvVyrur8%3D&md5=794cc0fcf1f66e7abb2e7ef0911b0188CAS | 19441835PubMed |
[13] A. Karnjanapiboonwong, A. N. Morse, J. D. Maul, T. A. Anderson, Sorption of estrogens, triclosan, and caffeine in a sandy loam and a silt loam soil. J. Soils Sediments 2010, 10, 1300.
| Sorption of estrogens, triclosan, and caffeine in a sandy loam and a silt loam soil.Crossref | GoogleScholarGoogle Scholar | 1:CAS:528:DC%2BC3cXhtFOnt7vP&md5=dfb085184b563bfba14be7663b1daa12CAS |
[14] B. A. Wilson, V. H. Smith, F. Denoyelles, C. K. Larive, Effects of three pharmaceutical and personal care products on natural freshwater algal assemblages. Environ. Sci. Technol. 2003, 37, 1713.
| Effects of three pharmaceutical and personal care products on natural freshwater algal assemblages.Crossref | GoogleScholarGoogle Scholar | 1:CAS:528:DC%2BD3sXhvF2mu7o%3D&md5=5fd24fb8cb12ab887dfe6e3b272797adCAS | 12775039PubMed |
[15] M. E. Balmer, T. Poiger, C. Droz, K. Romanin, P. A. Bergqvist, M. D. Muller, H.-R. Buser, Occurrence of methyl triclosan, a transformation product of the bactericide triclosan, in fish from various lakes in Switzerland. Environ. Sci. Technol. 2004, 38, 390.
| Occurrence of methyl triclosan, a transformation product of the bactericide triclosan, in fish from various lakes in Switzerland.Crossref | GoogleScholarGoogle Scholar | 1:CAS:528:DC%2BD3sXpsFaqsbs%3D&md5=228891e14e0d80ac49fa35539892aff0CAS | 14750712PubMed |
[16] A. Sarafraz-Yazdi, A. Amiri, G. Rounaghi, H. Eshtiagh-Hosseini, Determination of non-steroidal anti-inflammatory drugs in urine by hollow-fiber liquid membrane-protected solid-phase microextraction based on sol-gel fiber coating. J. Chromatogr. B 2012, 908, 67.
| Determination of non-steroidal anti-inflammatory drugs in urine by hollow-fiber liquid membrane-protected solid-phase microextraction based on sol-gel fiber coating.Crossref | GoogleScholarGoogle Scholar | 1:CAS:528:DC%2BC38Xhs1aqt7%2FF&md5=ac6b8edca88a48ba908c8be49cac1e00CAS |
[17] A. Corbin, B. Pitts, A. Parker, P. S. Stewart, Antimicrobial penetration and efficacy in an in vitro oral biofilm model. Antimicrob. Agents Chemother. 2011, 55, 3338.
| Antimicrobial penetration and efficacy in an in vitro oral biofilm model.Crossref | GoogleScholarGoogle Scholar | 1:CAS:528:DC%2BC3MXos1Ort7w%3D&md5=0e420165c27c348cbe648f8e6e763a9eCAS | 21537022PubMed |
[18] D. Goveia, J. P. Pinheiro, V. Milkova, A. H. Rosa, H. P. van Leeuwen, Dynamics and heterogeneity of PbII binding by SiO2 nanoparticles in an aqueous dispersion. Langmuir 2011, 27, 7877.
| Dynamics and heterogeneity of PbII binding by SiO2 nanoparticles in an aqueous dispersion.Crossref | GoogleScholarGoogle Scholar | 1:CAS:528:DC%2BC3MXmsFGhtLo%3D&md5=6fac0b4d9bbf773d026b4a59192aada6CAS | 21612251PubMed |
[19] S. K. Parida, S. Dash, S. Patel, B. K. Mishra, Adsorption of organic molecules on silica surface. Adv. Colloid Interface Sci. 2006, 121, 77.
| Adsorption of organic molecules on silica surface.Crossref | GoogleScholarGoogle Scholar | 1:CAS:528:DC%2BD28Xos12quro%3D&md5=d4c36e02b4080240feb15aeb0181bcb8CAS | 16879799PubMed |
[20] X. J. Leng, K. Starchev, J. Buffle, Adsorption of fluorescent dyes on oxide nanoparticles studied by fluorescence correlation spectroscopy. Langmuir 2002, 18, 7602.
| Adsorption of fluorescent dyes on oxide nanoparticles studied by fluorescence correlation spectroscopy.Crossref | GoogleScholarGoogle Scholar | 1:CAS:528:DC%2BD38Xms1WmsLw%3D&md5=bf8ed2af1a892efdff4a15850c1e1114CAS |
[21] H. P. van Leeuwen, J. Buffle, Chemodynamics of aquatic metal complexes: from small ligands to colloids. Environ. Sci. Technol. 2009, 43, 7175.
| Chemodynamics of aquatic metal complexes: from small ligands to colloids.Crossref | GoogleScholarGoogle Scholar | 1:CAS:528:DC%2BD1MXosFOjsbY%3D&md5=27b54de58841adf9f8d3a819ba905ccfCAS | 19848119PubMed |
[22] K. Benhabib, T. L. ter Laak, H. P. van Leeuwen, Steady-state diffusion regime in solid-phase microextraction kinetics. Anal. Chim. Acta 2008, 609, 113.
| Steady-state diffusion regime in solid-phase microextraction kinetics.Crossref | GoogleScholarGoogle Scholar | 1:CAS:528:DC%2BD1cXhsFWku7o%3D&md5=9d379196f19b59815fb76826e8e37bc4CAS | 18243879PubMed |
[23] M. A. Jeannot, F. F. Cantwell, Solvent microextraction as a speciation tool: determination of free progesterone in a protein solution. Anal. Chem. 1997, 69, 2935.
| Solvent microextraction as a speciation tool: determination of free progesterone in a protein solution.Crossref | GoogleScholarGoogle Scholar | 1:CAS:528:DyaK2sXktFSksb0%3D&md5=0f5efa16abc9532133e57621d7c1fc27CAS | 9253247PubMed |
[24] M. B. Heringa, D. Pastor, J. Algra, W. H. J. Vaes, J. L. M. Hermens, Negligible depletion solid-phase microextraction with radiolabeled analytes to study free concentrations and protein binding: an example with [3H]Estradiol. Anal. Chem. 2002, 74, 5993.
| Negligible depletion solid-phase microextraction with radiolabeled analytes to study free concentrations and protein binding: an example with [3H]Estradiol.Crossref | GoogleScholarGoogle Scholar | 1:CAS:528:DC%2BD38XotlSnu7c%3D&md5=f17bc28e8f071d8756205f60b303f162CAS | 12498194PubMed |
[25] Z. Y. Zhang, J. Poerschmann, J. Pawliszyn, Direct solid phase microextraction of complex aqueous samples with hollow fibre membrane protection. Anal. Commun. 1996, 33, 219.
| Direct solid phase microextraction of complex aqueous samples with hollow fibre membrane protection.Crossref | GoogleScholarGoogle Scholar |
[26] J. Poerschmann, Z. Y. Zhang, F. D. Kopinke, J. Pawliszyn, Solid phase microextraction for determining the distribution of chemicals in aqueous matrices. Anal. Chem. 1997, 69, 597.
| Solid phase microextraction for determining the distribution of chemicals in aqueous matrices.Crossref | GoogleScholarGoogle Scholar | 1:CAS:528:DyaK2sXmtVynuw%3D%3D&md5=6eaf4a8f2e67911d607b5393ea6988d9CAS |
[27] K. F. Poon, P. K. S. Lam, M. H. W. Lam, Determination of polynuclear aromatic hydrocarbons in human blood serum by proteolytic digestion – direct immersion SPME. Anal. Chim. Acta 1999, 396, 303.
| Determination of polynuclear aromatic hydrocarbons in human blood serum by proteolytic digestion – direct immersion SPME.Crossref | GoogleScholarGoogle Scholar | 1:CAS:528:DyaK1MXmsFWktrY%3D&md5=6599f7f26f5b8ec47d93b740c57a560cCAS |
[28] C. Basheer, H. K. Lee, Hollow fiber membrane-protected solid-phase microextraction of triazine herbicides in bovine milk and sewage sludge samples. J. Chromatogr. A 2004, 1047, 189.
| 1:CAS:528:DC%2BD2cXntFCisrs%3D&md5=9dba16aa008997edbd65b4a3c59d0d47CAS | 15460248PubMed |