

Lead solubility in seawater: an experimental study
Brad M. Angel A , Simon C. Apte A C , Graeme E. Batley A and Mark D. Raven BA CSIRO Land and Water, Locked Bag 2007, Kirrawee, NSW 2232, Australia.
B CSIRO Land and Water, Gate 4, Waite Road, Urrbrae, SA 5064, Australia.
C Corresponding author. Email: simon.apte@csiro.au
Environmental Chemistry 13(3) 489-495 https://doi.org/10.1071/EN15150
Submitted: 14 July 2015 Accepted: 15 September 2015 Published: 30 November 2015
Journal Compilation © CSIRO Publishing 2016 Open Access CC BY-NC-ND
Environmental context. Many trace metals including lead are only sparingly soluble in seawater and may exist in both dissolved and particulate forms (e.g. as precipitates). Aquatic organisms may experience different toxic effects from exposure to dissolved and particulate trace metals. This study reports the limits to lead solubility in seawater that influence the exposure to these forms of lead in the field and the laboratory.
Abstract. A combination of laboratory investigations and thermodynamic modelling were conducted in order to gain an understanding of the factors controlling lead solubility in seawater. In experiments where increasing amounts of lead were added to seawater (in order to avoid supersaturation) and equilibrated for up to 28 days, the maximum solubility was ~2 mg L–1 (pH 8.15, 22 °C). However, at higher added lead concentrations, which caused the rapid formation of lead precipitates, the solution chemistry became dynamic and the observed solubility was markedly lower, varying with both reaction time and precipitate concentration. For instance, when seawater solutions were spiked with 10 mg L–1 of total lead, precipitation occurred immediately and only 1.6 mg L–1 of dissolved lead was measured after 1 h, with this concentration decreasing to 1.3 mg L–1 after 28 days. The solubility of lead in artificial seawater (0.68 mg L–1) was much lower than in natural seawater. This difference was attributed to the significant role played by natural organic matter in complexing dissolved lead. X-Ray diffraction and elemental analysis data suggest that the phase controlling lead solubility is a previously unidentified lead chlorocarbonate, which rapidly transforms to hydrocerussite on washing with deionised water. These observations are of particular relevance to toxicity tests where organisms are exposed to wide ranges of metal concentrations in order to obtain dose–response curves.
Additional keywords: metal solubility, precipitation, speciation.
Introduction
Given its known toxicity to a wide range of organisms, including humans, lead is regarded as an element of potential concern in aquatic environments and has been the focus of several ecotoxicity studies. Despite many papers on the cycling and distribution of lead in marine waters,[1–3] there have been few studies of its solubility in seawater and the composition of precipitates that form when solubility limits are exceeded. One can assume that this is because of the low concentrations of lead observed in marine systems. Dissolved lead concentrations in marine waters typically range from 1 to 36 ng L–1 in the open ocean[4] and between 50 and 300 ng L–1 in coastal waters that are affected by anthropogenic activities.[5] These concentrations are well below levels of regulatory concern. For instance, the Australia and New Zealand marine water quality guideline (for 95 % species protection) for lead in marine waters is 4.4 µg L–1.[6]
Nevertheless, lead solubility becomes a significant issue in the field of ecotoxicology. In order to obtain a dose–response curve, test solutions are prepared that often span a very wide concentration range. If the amount of metal added results in solution concentrations exceeding the solubility limit, then precipitation is predicted to occur, although the kinetics of precipitation are often complex and the degree of precipitation observed will depend on the duration of the toxicity test. Practically, this introduces many problems in understanding the concentration and form of metals that organisms are exposed to. Both dissolved and particulate metal species may be toxic and the contributions of these forms to toxicity will likely change with time.
Lead is a rather unusual metal because the inorganic speciation is not dominated by one ligand, but by both chloride and carbonate.[7] Apart from soluble chloro- and carbonato-complexes, mixed-ligand complexes such as Pb(CO3)Cl– are also present in seawater.[7] In alkaline, non-saline waters, experimental studies suggest that hydrocerussite, Pb3(CO3)2(OH)2, is the most important phase determining lead solubility[8,9]; however, this has not been demonstrated for seawater.
Key data from lead ecotoxicity studies with various marine organisms that include comments on solubility and precipitation are summarised in Table 1. From this compilation, it is clear that toxicity tests have been conducted using solutions that exceed the solubility limit and contain particulate forms of lead. Two approaches are used in solubility studies to determine solubility limits and extract thermodynamic data. An excess of preformed precipitates or minerals may be equilibrated with seawater and dissolved metal concentrations measured periodically. When the dissolved concentrations plateau, this is assumed to be the limit of solubility. Alternatively, progressively increasing increments of inorganic metal solutions can be added to seawater, equilibrated for a set time period and dissolved concentrations measured. At some point, sufficient metal will be added and precipitates will form. It is assumed that the solubility limit is independent of the mass of precipitate in solution. The choice of experimental timescale is dependent on the use of the information. For example, processes occurring over periods of 1 to 30 days are relevant for informing ecotoxicity tests because most are conducted over timescales of no more than several days, although chronic fish tests go for >21 days. For the understanding of biogeochemical cycles and mineral formations, however, much longer timescales are appropriate. In his classic work on metal precipitation in natural seawater, conducted over 50 years ago, Krauskopf[10] determined the solubility of lead to be between 0.3 and 0.7 mg L–1. Savenko and Shatalov[11] measured the solubility of selected lead minerals such as lead chromate and lead hydroxychloride in artificial seawater at 22 °C over a range of pH values. The solubility of lead hydroxychloride at pH 8.1 was 0.5 mg L–1. The study by Savenko and Shatalov made assumptions on the lead mineral phases that are important in controlling lead solubility. We are unaware of any recent studies where the composition of precipitates formed when an excess of lead is added to seawater has actually been measured.

|
The aims of the present study were to gain insight into the solubility of lead in seawater. This included investigating the kinetics of lead precipitation over timescales relevant to toxicity testing and the composition of precipitates formed in seawater. The outputs of the current study were intended to inform laboratory ecotoxicology studies where it is necessary to prepare test solutions over a wide range of lead concentrations.
Experimental
General analytical procedures
All plasticware was acid-washed before use by soaking in 10 % (v/v) nitric acid (Tracepur, Merck, Darmstadt, Germany) for 24 h, followed by at least five rinses with deionised water (<0.1 µS cm–1, Milli-Q, Millipore, Sydney, NSW). All chemicals used in the study were of analytical reagent grade or better. Measurements of pH were carried out using a Wissenschaftlich-Technische Werkstattan (WTW, Weilheim, Germany) meter equipped with a pH probe (Orion sure-flow combination pH 9165BN, Sydney, NSW). The pH probe was calibrated against commercially available pH 4.01, 7.00 and 10.01 buffers (Orion Pacific, Sydney, NSW). Seawater used for calibration standards and in the solubility tests was collected from Cronulla, NSW, Australia (35 practical salinity units (PSU), pH 8.15, dissolved organic carbon 1 mg L–1), filtered through 0.45-µm membrane filters (Millipore HA mixed cellulose esters) and stored refrigerated in the dark. Artificial seawater was prepared according to the recipe of Kester et al.[12] Major cation concentrations were checked using inductively coupled plasma atomic emission spectrometry (ICPAES), which confirmed the solution composition was as expected.
Filters used in the filtration procedures detailed below were rinsed with 50 mL of 10 % nitric acid and 100 mL of deionised water. Lead concentrations were determined by ICPAES (Varian730 ES, Melbourne, Vic.) using matrix-matched standards prepared by the addition of MES-04–1 multi-element standard (Accustandard, New Haven, CT) in filtered seawater (Cronulla, NSW) and preserved with 0.2 % nitric acid (Tracepur, Merck). The lead concentration was determined using the ICPAES wavelength line 220.353 nm, and the limit of detection (LOD) for lead was 2 µg L–1 (calculated as three times the standard deviation of the mean seawater blank, n = 18). The quality control and quality assurance for each sample batch analysis included spike controls on at least 10 % of samples as a check of matrix artefacts and analysis of an independent lead standard (Accustandard) as a check of the calibration accuracy.
Lead solubility in seawater
A 1000 mg Pb L–1 stock solution was prepared in a polycarbonate container by dissolving 1.599 g of Pb(NO3)2 (Ajax Finechem, Univar, analytical reagent grade) in 1 L of deionised water. The final pH of this solution was 4.7.
Test solutions were prepared in triplicate in polycarbonate containers. Nominal treatment concentrations of 0.5, 1, 2, 5, 10, 20 and 30 mg Pb L–1 were generated by adding appropriate aliquots (≤6 % of final volume to maintain salinity) of the stock solution to filtered seawater. The treatments were shaken vigorously for 1 min, the pH measured, and the solutions stored at 22 °C in the dark in a temperature-controlled room. Tests were conducted with both natural and artificial seawater. The pH of the test solutions was checked regularly and did not vary significantly from 8.15 ± 0.05. The only exceptions were the solutions containing the highest lead concentrations of 20 and 30 mg L–1, which required addition of a small amount of sodium hydroxide to stabilise the pH and prevent the solutions from becoming acidic.
At selected times (0, 0.08, 0.33, 1, 2, 3, 4, 7, 14, 28 days), the solutions were briefly shaken. For dissolved-lead analysis, subsamples were taken using a syringe (Terumo, Binan, the Philippines) and 0.45-µm filtered (10 % nitric acid-rinsed 0.45-µm cellulose nitrate filter, 25 mm, Sartorius, Minisart, Goettingen, Germany). For the 1, 5 and 20 mg L–1 treatments only, a second subsample was taken and filtered through a 0.025-µm membrane filter (47 mm, mixed cellulose esters, type HA, Millipore). The samples were preserved by acidification to 0.2 % (v/v) with concentrated nitric acid (Tracepur, Merck, Darmstadt, Germany) immediately after filtration.
Lead precipitate composition
The composition was determined of the precipitate formed after time periods ranging from 1.5 h to 7 days following the addition of 30 mg L–1 total lead to seawater. Triplicate 1 L volumes of 30 mg L–1 total lead solutions were prepared and were either centrifuged or filtered onto preweighed membrane filters (47 mm, mixed cellulose esters, 0.45-µm membrane filters type HA, Millipore). The filtration apparatus was then rapidly rinsed with three aliquots of ~20 mL of deionised water while under vacuum to ensure that the precipitate was deposited on the filter and to minimise any residual seawater that would contribute salt-derived ions. Analysis of dissolved lead in the filtrate indicated that only a small amount of lead (<0.15 mg Pb, i.e. less than 0.5 % of the total mass of lead) was lost in the process of rinsing the precipitate to remove salt. The precipitates were dried in a desiccator and reweighed to a constant weight, and the mass of precipitate on the filters determined as the difference in weights before and after filtration.
Selected filters were then removed into acid-washed 50-mL polycarbonate vials and digested in a combination of 5 mL of concentrated nitric acid (Merck, Tracepur) and 5 mL of concentrated hydrochloric acid (Merck, Suprapur) for 48 h at room temperature, after which they were diluted to a final volume of 40 mL using deionised water. The diluted digests were then diluted a further 1000-fold in 2 % v/v nitric acid (Tracepur) and measured by ICPAES using standards that were prepared by the addition of MES-04–1 multi-element standard (Accustandard) in deionised water acidified to 2 % v/v nitric acid (Tracepur). Membrane filter blanks showed no significant metal contribution and spike recoveries of 90–105 % indicated negligible contamination or matrix artefacts during analysis.
In order to measure the chlorine content of the precipitates, an additional digestion was performed that did not contain hydrochloric acid. A volume of 18 mL of deionised water was added to the filter containing precipitate, mixed, and allowed to stand for 2 h to allow hydration, to prevent the passivation of the precipitate by concentrated nitric acid that was observed in preliminary tests. A volume of 2 mL of nitric acid (Tracepur) was then added and the solution mixed for 1 min followed by standing at room temperature for 48 h. The digests were then measured by ICPAES using matrix-matched standards that were prepared by spiking acidified (10 % v/v nitric acid, Merck Tracepur) deionised water with 16.5 g L–1 NaCl (10 g L–1 equivalent Cl, Merck AR grade). Membrane filter blanks showed no significant chlorine contribution and spike recoveries of 91–99 % indicated negligible contamination or matrix artefacts during analysis.
Carbon analysis on dried precipitate samples (110 °C) was performed at Macquarie University, Sydney, using an elemental analyser, Model PE2400 CHNS/O (PerkinElmer, Shelton, CT). Samples were accurately weighed using a PerkinElmer AD-6 ultramicrobalance. The metal, carbon and chlorine contents and mass of precipitate were used to gain information on the likely geochemical composition of the precipitate.
X-Ray diffraction (XRD) analyses were conducted on subsamples of dried precipitate. The fine powders were deposited onto silicon single-crystal low-background holders with light pressure applied to the front of the sample using a glass slide to provide a flat surface for analysis. XRD patterns were measured with a PANalytical X’Pert Pro Multipurpose diffractometer using Fe-filtered Co Kα radiation, auto divergence slit, 1° anti-scatter slit and fast X’Celerator Si strip detector. The diffraction patterns were recorded in steps of 0.016° 2-theta with total counting time of 30 min.
Thermodynamic modelling
Predictions of lead solubility in seawater were performed using Visual Minteq ver. 3.1.[13] The calculations were run with hydrocerussite as the specified precipitating mineral phase. The following input parameters were used: salinity 35 PSU, the major ion composition for surface seawater as summarised by Pilson,[4] temperature 22 °C, ionic strength 0.7. The calculations were run using the thermodynamic constants from the Minteq database without any further modifications. Separate modelling runs were carried out using activity corrections computed using the extended Debye–Hückel equation and the Davies equation. The results generally differed by less than 10 %. Strictly speaking, the use of these activity corrections is limited to dilute solutions. More complex activity corrections based on Pitzer’s equations[14] are appropriate but are not available as part of geochemical speciation codes such as Visual Minteq. Stockdale et al.[14] compared the extended Debye–Hückel and Pitzer-based activity corrections for the calculation of inorganic lead speciation in seawater and found less than 16 % difference between the calculated free ion activities using the two approaches. This level of uncertainty was regarded as being acceptable for chemical modelling as applied in the present study.
Results and discussion
Measured lead solubility in seawater
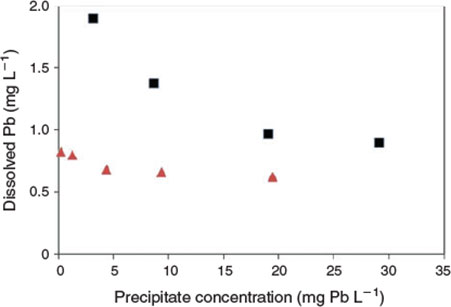
The key experimental data are summarised in Figs 1 and 2. There was very low variability among replicates as indicated by the size of the error bars in both figures. An examination of the changes in dissolved lead concentration in the natural seawater treatment over the course of 28 days revealed some interesting dynamics. At concentrations of up to 2 mg Pb L–1, solution lead concentrations stabilised within 1 h and did not change over the remainder of the 28-day test period. Therefore, 2 mg L–1 was assigned as the apparent maximum solubility (at pH 8.15, 22 °C). At higher total lead concentrations, above 2 mg L–1, the dissolved lead concentration versus time plots (Fig. 1b) were characterised by rapid precipitation and a corresponding decrease in dissolved lead followed by a slower reduction in concentration over the remainder of the experiment. For the 5 and 10 mg Pb L–1 treatments, 85 and 96 % of the precipitate mass was formed in the first hour respectively. The dissolved lead concentrations decreased to well below the maximum solubility limit of 2 mg L–1. For example, for the 10 mg L–1 treatment, the dissolved lead concentration was 1.5 mg L–1 after 1 day and decreased to 1.3 mg L–1 after 28 days. For the 20 mg L–1 treatment, dissolved lead concentration was 1 mg L–1 after 7 days. The apparent relationship between solubility limit and the concentration of lead precipitate in the solutions (Fig. 3) was not expected and may be associated with changes in mineral phases with time (see below) or adsorption of dissolved lead species onto the newly formed precipitates. It would appear that at total lead concentrations of less than 30 mg L–1, the solubility limit is dependent on the concentration of precipitate. A similar relationship has recently been observed for dissolved aluminium precipitation in seawater[15]; however, the trends in the lead data were not as pronounced as those found for aluminium. Colloidal lead species were not detected in the test solutions (1, 5 and 20 mg Pb L–1) as indicated by similar dissolved lead concentrations in the <0.025- and <0.45-µm size fractions (Table S1).
|
|
|
Much lower lead solubilities were observed in the same experiments conducted using artificial seawater (Fig. 2). Based on the 1 mg L–1 added lead treatment, the maximum solubility (after 7 days) in this matrix was 0.78 mg L–1. However, at higher added lead concentrations, the same trends as observed for natural seawater were apparent, with decreases in dissolved lead concentrations to well below the maximum limit (Fig. 3). For 20 mg L–1 added lead, the determined solubility limit was 0.63 mg L–1 (after 7 days). In this series of tests, significant adsorption of lead to container walls was observed. For the 30 mg L–1 treatment, 3.5 mg L–1 of lead was recovered from the container walls by filling the emptied container with 10 % nitric acid following removal of all precipitates by rinsing empty containers with 3 × 500 mL of treatment filtrate. However, these losses should not affect the observed solubility of lead. No significant losses were observed in the natural seawater treatment and this was attributed to the presence of natural organic matter coatings on the container walls that prevented lead adsorption.
A possible explanation for the difference in lead solubility between the two water types is complexation by natural dissolved organic matter, which may increase metal solubility beyond that measured in purely inorganic solutions. Unfortunately, there is only limited information on the complexation of lead by natural organic matter in seawater. The concentration of strong organic ligands that can complex dissolved lead (lead complexing capacity) as measured by metal titrations utilising differential pulse anodic stripping voltammetry (DPASV) in coastal waters is typically less than 2.5 µg L–1[2,3,16,17] and is insufficient to explain the marked difference in solubility. An alternative possibility is the role played by weak binding sites that become important once the strong ligands are saturated. Dissolved organic matter (DOM) is known to be polydisperse and contains both strong and weak metal-binding sites.[18] Once the strong binding sites are saturated, weak binding sites may play an important role in metal complexation and will hence influence the measured solubility. Louis et al.[18] measured the proton-binding capacity of marine DOM isolated from seawater samples. Based on their value of 445 mequiv mol–1 C and a dissolved organic carbon (DOC) concentration of 1 mg C L–1 for the natural seawater used in the present study, this would suggest a proton binding capacity of 37 µM. This compares with 6.4 µM (1.32 mg L–1) of lead, which is the difference between the solubilities observed in natural and artificial seawaters. Assuming that the proton-binding capacity gives some indication of the weak binding capacity of marine DOM, this would suggest that the binding of lead in the form of weak complexes with DOM is a feasible explanation of the differences in the data.
Precipitate identification
Precipitates collected at 1.5 h, 24 h and 7 days after lead addition were analysed for their elemental content and mineral composition by XRD. Following the spiking of seawater with 31.5 mg Pb L–1, the lead underwent rapid precipitation, with a total precipitate concentration of 39.8 ± 0.3 mg L–1 measured after 7 days. The particulate lead comprised 97.1 % of the total lead spiked into seawater, indicating a good mass balance. When dilute hydrochloric acid was added to the precipitate, there was noticeable effervescence, confirming the presence of carbonate.
The results of the elemental analyses along with the elemental compositions of common lead minerals are presented in Table 2. The carbon content of the precipitates was quite constant at 3.3 to 3.4 %, which equates to a carbonate concentration between 16.5 and 17.0 %. There was little variation in carbon content between samples collected at 1.5 h, 24 h and 7 days after lead addition. There was also no significant difference between natural seawater and artificial seawater. Lead concentrations (Table 2) varied from 77.9 to 86.5 %. The high lead concentrations measured in some of the samples may reflect measurement errors associated with the small masses of precipitates that were collected and the dilutions required for measurement by ICPAES. Analysis of precipitate digests by ICPAES indicated that the concentrations of sodium, calcium, magnesium, potassium, sulfur and trace metals were low (<0.6 %) for all time points. The sodium concentrations were used to estimate the concentration of chlorine associated with sodium chloride (present through the carry-over of seawater), which was then subtracted from the total chlorine concentration.
|
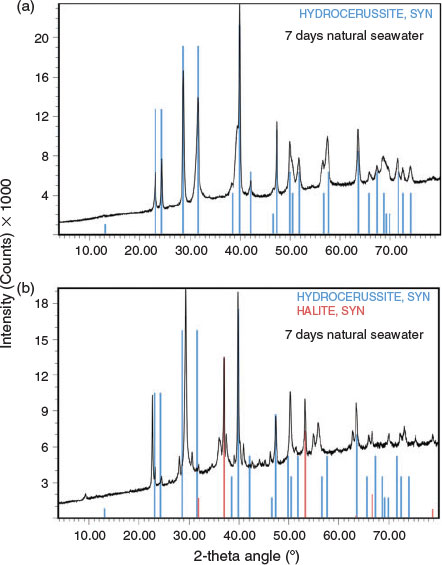
XRD data are summarised in Table 3, Fig. 4 and Fig. S1. The data showed some interesting trends. Initially, the data were analysed as a time series because changes in mineral composition were expected with time. However, the data did not reveal any notable temporal trends. Instead, it was found that the diffraction patterns obtained were dependent on the chlorine content of the precipitate. The presence of hydrocerussite was only confirmed for the three precipitates having the lowest chlorine content. Carry-over was observed as witnessed by the presence of halite in the diffraction pattern having the highest chloride composition. However, the concentration of chlorine measured in the precipitates was generally higher than could be accounted for by the measured sodium concentrations (sodium chloride was assumed to be in the solid phase). This provided a line of evidence that chlorine was being incorporated into the lead mineral structure and was released during the washing procedure. Phosgenite (Pb2(CO3)Cl2) is a known lead chlorocarbonate mineral; however, the XRD data did not match library data for this mineral. It was therefore hypothesised that, in seawater, a metastable chlorocarbonate lead mineral forms that is rapidly converted into hydrocerussite during washing of the precipitate with deionised water:

The theoretical elemental composition of this phase is given in Table 2. The proposed structure is a chlorine-containing analogue of hydrocerussite. Further work is under way to confirm the identity of this mineral phase.

|
|
Modelling of lead solubility in seawater
When using speciation models to predict metal solubility, there is a need to select the precipitating phase and in doing so, assumptions are often made based on best professional judgement. In addition, many of the phases represented in thermodynamic modelling databases are highly crystalline and may not be representative of the precipitates that form over short timescales. These factors may cause significant discrepancies between experimentally determined and predicted solubilities.
The solubility limit for lead in seawater (pH 8.15, 22 °C) predicted using Visual Minteq, assuming hydrocerussite as the precipitating phase, was 0.06 mg L–1. This value was in the same range as the predicted solubility of hydrocerussite in freshwaters (pH 8.2, 50 mg L–1 total inorganic carbon) of 0.052 mg L–1.[9] Nevertheless, the predicted solubility was significantly lower than the experimentally determined solubility limits measured in both natural and artificial seawater. Similar discrepancies between predicted and observed solubilities of hydrocerussite have been observed by other workers. For instance, Noel et al.,[9] using a flow-through system, measured the solubility of hydrocerussite as 0.166 mg L–1 (pH 8.5, inorganic carbon 50 mg L–1), which was higher than the value of 0.041 mg L–1 predicted by the computer speciation program MINEQL. As indicated by the precipitate composition studies, the form of lead in seawater appears to be a chlorocarbonate of previously unidentified composition and this may explain the inaccuracy of the modelling predictions.
Conclusions
The solubility studies illustrated the complexity of lead precipitation in natural seawater. A maximum solubility limit (at pH 8.15 and 22 °C) of ~2 mg L–1 was identified, below which no particulate or colloidal species were present and dissolved (<0.45 µm) concentrations remained stable for up to 28 days. The maximum solubility measured in artificial seawater (0.78 mg L–1) was, however, much lower. This was attributed to the effects of natural organic matter, specifically weak binding sites. In both matrices, the dissolved lead concentrations in seawater were dependent on the concentration of precipitate present in the test solutions, decreasing as the precipitate concentration increased. Filtration studies showed that the colloidal lead fraction was insignificant. The composition of the precipitate formed is likely to be a metastable lead chlorocarbonate, which rapidly transforms to hydrocerussite when it is removed from the seawater matrix.
These findings have particular relevance for laboratory toxicity tests where there is a need to prepare lead concentrations in test solutions that span several orders of magnitude (see Table 1). Clearly, at total lead concentrations exceeding 2 mg L–1, organisms will be exposed to a mixture of dissolved and particulate forms whose concentrations change depending on the total lead concentration. This reinforces the need to monitor concentrations of dissolved and particulate lead in the toxicity test exposure system over time, in order to relate metal form to observed toxicity. The kinetics of precipitation are also an important consideration; however, in the case of lead in seawater, precipitation was rapid, with >85 % of the precipitate mass forming within the first hour. It is advisable, therefore, for solutions to be equilibrated for this period of time before the addition of test organisms.
It should be noted that algal toxicity tests represent a special case because nutrients such as phosphate are added to seawater solutions in order to ensure optimum growth conditions. This modification of the seawater matrix lowers the solubility limit of metals that form precipitates with the added components. For example, the addition of phosphate to algal toxicity tests is likely to reduce lead solubility through the formation of lead phosphate minerals. Overall, the study highlights the need for experimental determination of solubility and characterisation of the mineral phases that precipitate from solution.
Acknowledgements
The authors thank Professor Peter Campbell (Institut National de la Recherche Scientifique, INRS, Canada) for over 25 years of stimulating discussions and helpful advice covering all aspects of environmental chemistry and ecotoxicology. Dr Chris McRae, Macquarie University, NSW, Australia, is thanked for the elemental analyses.
References
[1] B. K. Schaule, C. C. Patterson, Lead concentrations in the north-east Pacific: evidence for global anthropogenic perturbations. Earth Planet. Sci. Lett. 1981, 54, 97.| Lead concentrations in the north-east Pacific: evidence for global anthropogenic perturbations.Crossref | GoogleScholarGoogle Scholar | 1:CAS:528:DyaL3MXlt1Sktbs%3D&md5=0e550fbf16b66db1ee745f1dc2eee3beCAS |
[2] F. L. L. Muller, Interactions of copper, lead and cadmium with the dissolved, colloidal and particulate components of estuarine and coastal waters. Mar. Chem. 1996, 52, 245.
| Interactions of copper, lead and cadmium with the dissolved, colloidal and particulate components of estuarine and coastal waters.Crossref | GoogleScholarGoogle Scholar | 1:CAS:528:DyaK28XjsFOntb8%3D&md5=f7484f59854ce2d0b41003cc5cad5b78CAS |
[3] G. Capodaglio, K. H. Coale, K. W. Bruland, Lead speciation in surface waters of the eastern North Pacific. Mar. Chem. 1990, 29, 221.
| Lead speciation in surface waters of the eastern North Pacific.Crossref | GoogleScholarGoogle Scholar | 1:CAS:528:DyaK3cXkvVCgtbY%3D&md5=482beb1cfc81b529e699a863836a862eCAS |
[4] M. E. Q. Pilson, An Introduction to the Chemistry of the Sea, 2nd edn 1998 (Cambridge University Press: New York).
[5] W. J. Davis, Contamination of coastal versus open ocean surface waters: a brief meta-analysis. Mar. Pollut. Bull. 1993, 26, 128.
| Contamination of coastal versus open ocean surface waters: a brief meta-analysis.Crossref | GoogleScholarGoogle Scholar | 1:CAS:528:DyaK3sXksl2mu7c%3D&md5=270de05c845a00bade54d94aa060d15dCAS |
[6] Australian and New Zealand guidelines for fresh and marine water quality 2000 (Australia and New Zealand Environment and Conservation Council (ANZECC); and Agricultural and Resource Management Council of Australia and New Zealand (ARMCANZ): Canberra, ACT).
[7] R. J. Woosley, F. J. Millero, Pitzer model for the speciation of lead chloride and carbonate complexes in natural waters. Mar. Chem. 2013, 149, 1.
| Pitzer model for the speciation of lead chloride and carbonate complexes in natural waters.Crossref | GoogleScholarGoogle Scholar | 1:CAS:528:DC%2BC3sXisF2rtrs%3D&md5=deed526574ab98655cc6c1f79aa79949CAS |
[8] D. Marani, G. Macchi, M. Pagano, Lead precipitation in the presence of sulphate and carbonate: testing thermodynamic predictions. Water Res. 1995, 29, 1085.
| Lead precipitation in the presence of sulphate and carbonate: testing thermodynamic predictions.Crossref | GoogleScholarGoogle Scholar | 1:CAS:528:DyaK2MXktV2itbw%3D&md5=824787dd621cbb095b753f3c333407c1CAS |
[9] J. D. Noel, Y. Wang, D. E. Giammar, Effect of water chemistry on the dissolution rate of the lead corrosion product hydrocerussite. Water Res. 2014, 54, 237.
| Effect of water chemistry on the dissolution rate of the lead corrosion product hydrocerussite.Crossref | GoogleScholarGoogle Scholar | 1:CAS:528:DC%2BC2cXkt12mu7o%3D&md5=36745ae1617b177e962b834c7a7add14CAS | 24576699PubMed |
[10] K. B. Krauskopf, Factors controlling the concentration of thirteen trace metals in seawater. Geochim. Cosmochim. Acta 1956, 9, 1.
| Factors controlling the concentration of thirteen trace metals in seawater.Crossref | GoogleScholarGoogle Scholar | 1:CAS:528:DyaG28XktlWgsw%3D%3D&md5=0ce8f17002175201166074b918021297CAS |
[11] V. S. Savenko, I. A. Shatalov, Solubility of minerals and forms of lead existence in seawater. Oceanology 2000, 40, 491.
[12] D. R. Kester, I. W. Duedall, D. N. Connors, R. M. Pytkowicz, Preparation of artificial seawater. Limnol. Oceanogr. 1967, 12, 176.
| Preparation of artificial seawater.Crossref | GoogleScholarGoogle Scholar | 1:CAS:528:DyaF2sXhtFylur0%3D&md5=a36a7ec97053b17c4a61856b69e2f00cCAS |
[13] J. P. Gustafsson, Visual Minteq ver. 3.1. Available at http://vminteq.lwr.kth.se [Verified 14 May 2015].
[14] A. Stockdale, E. Tipping, J. Hamilton-Taylor, S. Lofts, Trace metals in the open oceans: speciation modelling based on humic-type ligands. Environ. Chem. 2011, 8, 304.
| Trace metals in the open oceans: speciation modelling based on humic-type ligands.Crossref | GoogleScholarGoogle Scholar | 1:CAS:528:DC%2BC3MXptVWrsbc%3D&md5=79d2c4570666578baa92db699bb728f0CAS |
[15] B. M. Angel, S. C. Apte, G. E. Batley, L. A. Golding, Geochemical controls on aluminium concentrations in coastal waters. Environ. Chem. 2015, [Published online 15 September 2015]
| Geochemical controls on aluminium concentrations in coastal waters.Crossref | GoogleScholarGoogle Scholar |
[16] P. B. Kozelka, S. Sanudo-Wilhelmy, A. R. Flegal, K. W. Bruland, Physicochemical speciation of lead in south San Francisco Bay. Estuar. Coast. Shelf Sci. 1997, 44, 649.
| Physicochemical speciation of lead in south San Francisco Bay.Crossref | GoogleScholarGoogle Scholar | 1:CAS:528:DyaK2sXkslaiu7o%3D&md5=5057db745b11b6619355e4df9155e98eCAS |
[17] M. L. Wells, P. B. Kozelka, K. W. Bruland, The complexation of ‘dissolved’ Cu, Zn, Cd and Pb by soluble and colloidal organic matter in Narragansett Bay, RI. Mar. Chem. 1998, 62, 203.
| The complexation of ‘dissolved’ Cu, Zn, Cd and Pb by soluble and colloidal organic matter in Narragansett Bay, RI.Crossref | GoogleScholarGoogle Scholar | 1:CAS:528:DyaK1cXlt1ajs7Y%3D&md5=033bc32070d18bb90400af3a78f4d201CAS |
[18] Y. Louis, C. Garnier, V. Lenoble, D. Omanovic, S. Mounier, I. Pizeta, Characterisation and modelling of marine dissolved organic matter interactions with major and trace cations. Mar. Environ. Res. 2009, 67, 100.
| Characterisation and modelling of marine dissolved organic matter interactions with major and trace cations.Crossref | GoogleScholarGoogle Scholar | 1:CAS:528:DC%2BD1MXhtlOks7Y%3D&md5=e8f0d8fc3dfa897e09d064c2356b7ad7CAS | 19135243PubMed |
[19] W. H. Tan, L. H. Lim, The tolerance to and uptake of lead in the green mussel, Perna viridis (L.). Aquaculture 1984, 42, 317.
| The tolerance to and uptake of lead in the green mussel, Perna viridis (L.).Crossref | GoogleScholarGoogle Scholar | 1:CAS:528:DyaL2MXht1Krs7g%3D&md5=4917a7cbf5e03f629b8c90a1f05ac42aCAS |
[20] D. Taylor, B. G. Maddock, G. Mance, The acute toxicity of nine ‘grey list’ metals (arsenic, boron, chromium, copper, lead, nickel, tin, vanadium and zinc) to two marine fish species: dab (Limanda limanda) and grey mullet (Chelon labrosus). Aquat. Toxicol. 1985, 7, 135.
| The acute toxicity of nine ‘grey list’ metals (arsenic, boron, chromium, copper, lead, nickel, tin, vanadium and zinc) to two marine fish species: dab (Limanda limanda) and grey mullet (Chelon labrosus).Crossref | GoogleScholarGoogle Scholar | 1:CAS:528:DyaL28Xhs1arsw%3D%3D&md5=4d01ee8082029566922be19511b5ca06CAS |
[21] P.-C. Liu, J.-C. Chen, Effects of heavy metals on the hatching rates of brine shrimp Artemia salina cysts. J. World Aquacult. Soc. 1987, 18, 78.
| Effects of heavy metals on the hatching rates of brine shrimp Artemia salina cysts.Crossref | GoogleScholarGoogle Scholar | 1:CAS:528:DyaL2sXlvFantbY%3D&md5=856b22ee5bfb8e2286727dbf4ac967fdCAS |
[22] S. M. Lussier, J. H. Gentile, J. Walker, Acute and chronic effects of heavy metals and cyanide on Mysidopsis bahia (Crustacea: Mysidacea). Aquat. Toxicol. 1985, 7, 25.
| Acute and chronic effects of heavy metals and cyanide on Mysidopsis bahia (Crustacea: Mysidacea).Crossref | GoogleScholarGoogle Scholar | 1:CAS:528:DyaL28XhvVOk&md5=906fb60fbfb2f899dd6548370ea19f97CAS |
[23] G. R. W. Denton, C. Burdon-Jones, Environmental effects on toxicity of heavy metals to two species of tropical marine fish from northern Australia. Chem. Ecol. 1986, 2, 233.
| Environmental effects on toxicity of heavy metals to two species of tropical marine fish from northern Australia.Crossref | GoogleScholarGoogle Scholar | 1:CAS:528:DyaL28XksFGqur4%3D&md5=256435ddfa8d8638b6b284725ab81f80CAS |
[24] K. P. Gowrinathan, V. N. R. Rao, Physiological responses of some planktonic diatoms to heavy metals. Indian J. Microbiol. 1989, 29, 293.