

Isotopically modified silver nanoparticles to assess nanosilver bioavailability and toxicity at environmentally relevant exposures
Marie-Noële Croteau A E , Agnieszka D. Dybowska B , Samuel N. Luoma A C , Superb K. Misra B D and Eugenia Valsami-Jones B DA US Geological Survey, 345 Middlefield Road, MS 496, Menlo Park, CA 94025, USA.
B Department of Earth Sciences, Natural History Museum, Cromwell Road, London, SW7 5BD, UK.
C John Muir Institute of the Environment, University of California, One Shields Avenue, Davis, CA 95616, USA.
D School of Geography, Earth and Environmental Sciences, University of Birmingham, Birmingham, B15 2TT, UK.
E Corresponding author: mcroteau@usgs.gov
Environmental Chemistry 11(3) 247-256 https://doi.org/10.1071/EN13141
Submitted: 24 July 2013 Accepted: 1 November 2013 Published: 20 May 2014
Environmental context. Predicting the environmental implications of nanotechnology is complex in part because of the difficulty in studying nanoparticle uptake in organisms at environmentally realistic exposures. Typically, high exposure concentrations are needed to detect accumulation and effects. We use labelled Ag nanoparticles to determine whether Ag bioaccumulation responses are linear over concentrations likely to occur in the environment, and whether concentration-dependent changes in agglomeration and dissolution affect bioavailability.
Abstract. A major challenge in understanding the environmental implications of nanotechnology lies in studying nanoparticle uptake in organisms at environmentally realistic exposure concentrations. Typically, high exposure concentrations are needed to trigger measurable effects and to detect accumulation above background. But application of tracer techniques can overcome these limitations. Here we synthesised, for the first time, citrate-coated Ag nanoparticles using Ag that was 99.7 % 109Ag. In addition to conducting reactivity and dissolution studies, we assessed the bioavailability and toxicity of these isotopically modified Ag nanoparticles (109Ag NPs) to a freshwater snail under conditions typical of nature. We showed that accumulation of 109Ag from 109Ag NPs is detectable in the tissues of Lymnaea stagnalis after 24-h exposure to aqueous concentrations as low as 6 ng L–1 as well as after 3 h of dietary exposure to concentrations as low as 0.07 μg g–1. Silver uptake from unlabelled Ag NPs would not have been detected under similar exposure conditions. Uptake rates of 109Ag from 109Ag NPs mixed with food or dispersed in water were largely linear over a wide range of concentrations. Particle dissolution was most important at low waterborne concentrations. We estimated that 70 % of the bioaccumulated 109Ag concentration in L. stagnalis at exposures <0.1 µg L–1 originated from the newly solubilised Ag. Above this concentration, we predicted that 80 % of the bioaccumulated 109Ag concentration originated from the 109Ag NPs. It was not clear if agglomeration had a major influence on uptake rates.
Introduction
The environmental risk of silver nanoparticles (Ag NPs) is a highly topical focus of concern. Their production and use continue to increase, but much remains to be learned about their environmental fate and effects. In particular, there is little information on their bioavailability and toxicity at concentrations that are likely to be seen in the environment. Modelling studies estimate that Ag NPs could be expected in natural waters at concentrations of tens of nanograms per litre[1,2] and Ag concentrations in the environment range from a few nanograms per litre to a few micrograms per litre, at the most.[3] Yet, most ecotoxicological studies addressing questions related to their bioaccumulation and toxicity utilise exposure concentrations orders of magnitude higher, that is milligrams per litre.[4–7]
High exposure concentrations are usually deemed necessary in order to trigger measureable adverse effects from aqueous Ag exposures.[5–7] Although such studies demonstrate the likelihood of effects from Ag NP exposure, there are several reasons to suspect that they may not provide an adequate view of either bioaccumulation or the environmental thresholds at which adverse effects might be expected. First, a few studies have shown that toxic effects are also possible at low concentrations (µg L–1) of Ag NPs.[8,9] Second, biological responses as a function of Ag NP dose may not be linear over a wide range of concentrations because of nanoparticle-specific and concentration-dependent processes such as dissolution[10,11] or aggregation.[12–14] Third, it is well known that organisms inherently have pre-existing concentrations of essential elements, and that this natural background impedes detection of bioaccumulation at environmentally relevant exposure concentrations.[15,16] Furthermore, the uncertainties that come with detecting a small excess of bioaccumulation by subtraction between two larger numbers (i.e. pre- and post-exposure concentrations) especially add to potential errors in determinations of bioaccumulation and the uptake rates that ultimately determine bioaccumulation.[17] The degree to which background concentrations of non-essential elements like Ag add uncertainties to determinations of uptake rates and adverse effects has not been studied, however. Fourth, using low exposure concentrations is especially important in maintaining the biological health of organisms when characterising physiological processes such as those governing metal uptake and loss rates. That is, use of non-stressed organisms is preferred to use of organisms physiologically and biochemically stressed by high metal exposures.[18,19]
One option to circumvent the confounding influences of high metal exposures is application of tracer techniques.[20–22] The most common types of tracers are radioisotopes[23] and enriched stable isotopes.[20,24] Both share similar advantages such as low detection limits and the ability to discriminate tracer from background concentrations. However, complicated logistics, handling and waste issues as well as the lack of suitable radioisotopes can be a problem when using radioisotope tracers. This is especially problematic for experimentation with nanoparticles. Enriched stable isotopes have the potential to overcome many of these shortcomings. They have been employed to define metal bioaccumulation processes[20,25,26] and to evaluate bioavailability and toxicity.[21,26–28] Recently, enriched stable metal isotopes have been used in the synthesis of nanoparticles composed of the essential metals Cu and Zn, which provided enhanced sensitivity when evaluating the rates at which these particles delivered Cu and Zn to humans,[29] and to invertebrates.[15,16,27,30,31] Here we describe for the first time stable isotope labelling for citrate-coated Ag nanoparticles using Ag that was 99.7 % 109Ag (109Ag NPs). We used the freshwater snail (Lymnaea stagnalis) to characterise their bioaccumulation and toxicity at concentrations orders of magnitude lower than that employed in many previous studies, thereby demonstrating that stable isotope labelling can enhance detection sensitivity of Ag uptake. These organisms are somewhat tolerant to Ag, but more sensitive to Ag NPs in diet.[32] With this new technique, heretofore difficult process-oriented questions can be addressed, such as whether Ag bioaccumulation responses are linear over the full range of concentrations likely to occur in different environments, and whether concentration-dependent changes in processes such as agglomeration and dissolution affect bioaccumulation across wide concentration ranges.
Methodology
Experimental organisms
Freshwater snails (Lymnaea stagnalis) were reared in the laboratory in moderately hard water (MHW, 96 mg L–1 NaHCO3, 60 mg L–1 CaSO4·2H2O, 60 mg L–1 MgSO4, 4 mg L–1 KCl, pH 7.8[33]). To determine background Ag concentrations, 50 snails of varying sizes (mean soft tissue dry weight ranging from 0.2 to 33 mg) were randomly sampled and individually frozen. To characterise 109Ag uptake after exposure to 109Ag+ (added as 109AgNO3) and 109Ag NPs, 220 snails (mean soft tissue dry weight of 4.0 ± 0.3 mg, 95 % confidence interval, CI) were transferred to a 10-L glass aquarium filled with MHW 3 days prior to each experiment. Food was withheld during this period.
Synthesis of isotopically modified Ag NPs
109Ag NPs capped with citrate were synthesised after reduction of silver salts in sodium citrate, as described by Croteau et al.,[32] except that isotopically enriched Ag nitrate was used as the precursor. Specifically, isotopically enriched Ag (109Ag enriched at 99 %) in metal nitrate form (solid) was purchased from Trace Sciences International (Wilmington, DE, USA). NaBH4 (0.6 mL of 10 mM) was added to a mixture of sodium citrate (20 mL of 1.25 mM) and 109AgNO3 (0.5 mL of 10 mM). All chemicals used (except for 109AgNO3) were of analytical grade and purchased from Sigma–Aldrich (St Louis, MO, USA). The mixture was vigorously stirred for 24 h at room temperature followed by 7-day aging in darkness (without stirring). Particles were then washed (with 0.15 mM Na–citrate) by centrifugation at 35 000 rpm (at 17 °C for 3 h) using an L8-80M Beckman Coulter Ultracentrifuge (J6-MI, Beckman Coulter Inc. USA). The concentrated stock suspension was kept in a tightly closed container protected from the light. The total Ag concentration (109Ag + 107Ag) in the stock suspension (20 mg L–1) was determined by inductively coupled plasma–mass spectrometry (ICP-MS, see section below). Synthesis of such labelled Ag NPs is discussed in more detail, including aspects of yield, reproducibility and cost, by Laycock et al.[34] Briefly, the synthesis protocol used in this study provides a high yield (on average 78 % as estimated by Laycock et al.[34]). This is important because of the considerably higher cost of highly enriched 109AgNO3 (used as a precursor in the synthesis) compared to ‘regular’ AgNO3. With such a good yield, the cost of producing 1 mg of 109Ag NPs is ~US$5.
NP characterisation
The size and morphology of the NPs was evaluated using transmission electron microscopy (TEM, Hitachi H1700, 100 kV, Hitachi, Japan). Particles were counted manually on digital images (at least 100 particles) to provide the average size. Samples for TEM imaging were prepared by depositing a droplet of undiluted 109Ag NP suspension on a 300-mesh carbon-coated Cu grid (Agar Scientific, Stansted, UK) and allowing it to dry for 24 h at room temperature. The composition of the 109Ag NPs was confirmed by X-ray diffraction (XRD) using an Enraf Nonius (Rotterdam, the Netherlands) coupled with an INES CPS 120 position sensitive detector with CoKα radiation. Phase identification was performed using the STOE powder diffraction software (STOE & Cie GmbH, Darmstadt, Germany) search and match feature with the ICDD database. The UV-Vis absorption spectra of the 109Ag NPs were collected in the range 300 to 600 nm on a Shimadzu 1800 UV-Vis instrument (Shimadzu Corporation, Kyoto, Japan) using undiluted 109Ag NPs. The surface charge was estimated from measurements of electrophoretic mobility on an undiluted 109Ag NP suspension (25 °C, pH 7.6) using a Malvern Zetasizer Nano (Malvern Instruments Ltd, Malvern, UK) equipped with a He-Ne 633-nm laser.
Reactivity and dissolution studies
The aggregation of the 109Ag NPs was evaluated at 15 °C by dynamic light scattering (DLS) in MHW and deionised water (DIW). To match as closely as possible the exposure concentrations used in the biological experiments, the lowest particle concentrations at which agglomeration could be tested was ascertained by testing 109Ag NP concentrations varying from 10 to 1000 µg L–l. The lowest 109Ag NP concentration at which sufficient signal for the DLS measurements was obtained was 100 µg L–1. Further tests were thus performed at this concentration. The size and surface charge of 109Ag NPs dispersed in solution were monitored at regular time intervals (every hour) for up to 24 h. Prior to each measurement, aliquots were vortexed for 30 s and transferred to either a disposable sizing cuvette or a zeta cell. Measurements were conducted using a 173° backscatter angle of detection, with five replicate measurements taken at each time interval.
The dissolution of the 109Ag NPs was measured over a period of 7 days in MHW. Suspensions of 109Ag NPs (10, 100 and 1000 µg L–1) were placed in 60-mL dark plastic bottles (Nalgene, Rochester, NY, USA) that were incubated at 20 °C in the dark on an orbital shaker (IKA KS125, Ika Instruments, Staufen, Germany) at 200 rpm. Total 109Ag concentrations were measured (samples were acidified with concentrated HNO3 to a final acid strength of 2 % before ICP-MS analysis) in the samples immediately after suspensions were prepared and indicated that target NP concentrations were reached within 15 %. Aliquots (5 mL) were taken after 0, 4, 7, 24, 48, 96 and 170 h for the highest concentration (1 mg L–1), and after 24, 72 and 120 h for the lower starting concentrations (10 and 100 µg L–1). Samples were inserted into Amicon Ultra-15 centrifugal filtration cartridges (3 kDa, Millipore, Billerica, MA, USA) and centrifuged for 30 min at 6000g at 20 °C (5810R Eppendorf Centrifuge, Eppendorf AG, Germany). The dissolved 109Ag concentration was determined in the filtrate using ICP-MS (Agilent 7700×, Agilent Technologies, USA, limit of detection (LOD) of 0.08 µg L–1). Blanks were included to control for potential contamination from reagents and containers. Samples were run in triplicate (i.e. at each time point three independent samples were taken for each starting NP concentration). All samples were kept in the dark to minimise Ag losses by photo-reduction. The recovery of dissolved Ag under the experimental conditions was assessed using AgNO3 (100 µg L–1) by measuring the dissolved Ag concentration at 0, 24 and 72 h.
Waterborne uptake experiments
Waterborne uptake experiments were conducted to characterise 109Ag uptake after exposure to 109Ag NPs dispersed in MHW as well as to determine the rate constant of uptake from water (kuw). In addition, a waterborne uptake experiment was conducted with isotopically enriched 109Ag to characterise 109Ag uptake from 109Ag+ (added as isotopically enriched 109AgNO3) in MHW at concentrations below 0.1 µg L–1. Speciation modelling (using PHREEQC, USGS, USA[35]) indicated that 89 % of the total Ag added as AgNO3 occurred as Ag+ in MHW. The averaged snail dry weight varied among experiments from 2.4 to 6.0 mg. For each experiment, snails (n = 10) were randomly transferred to acid-washed high density polyethylene (HDPE) containers filled with 1 L of MHW spiked with different concentrations of either 109Ag NPs or 109AgNO3. Silver exposure concentrations ranged from 6 ng L–1 to 4 µg L–1 for 109Ag NPs and from 10 ng L–1 to 0.2 µg L–1 for 109AgNO3, covering the range of concentrations that might be expected in nature.[3] Snails were not fed during the 24-h exposure period to minimise faecal scavenging. The exposure was short enough to estimate unidirectional influx but long enough to ensure sufficient Ag accumulation for accurate detection. After exposure, snails were removed from the experimental media, rinsed in ultrapure water and frozen. Before and after the exposure, water samples (2 mL) were taken from each vial after gentle stirring, and acidified with concentrated nitric acid (Baker Ultrex II grade, 2 % final concentration).
Dietborne uptake experiments
Dietborne uptake experiments were conducted to characterise 109Ag uptake rates after exposure to 109Ag NPs in diet as well as to determine rate constants of uptake from food (kuf). We used the benthic diatom Nitzschia palea as a food source. Diatoms were grown axenically for several generations in an S-diatom medium.[36] They were harvested onto 1.2-µm Isopore membrane filters (Millipore) and rinsed with soft water[33] to make algal mats. We employed the protocol described by Croteau et al.[27] to present the algae in a form the snails would ingest. Briefly, we serially diluted suspensions of 109Ag NPs (Table S1 of the Supplementary material), which were poured onto algal mats and filtered through under low vacuum (<1333 Pa) to deposit particles. Small sections of the filters holding the diatoms amended with 109Ag NPs were sampled and dried for 24 h at 40 °C before metal analysis. Total 109Ag concentrations achieved in the diatoms ranged from 46 ng g–1 to 3 µg g–1, representing a range of Ag concentrations that can be found in sediments in nature (i.e. from less than 0.1 µg g–1 in pristine environments to up to 10 µg g–1 in contaminated systems[3]).
At each concentration, 10 acclimated snails were exposed to diatoms amended with 109Ag NPs for 3 h. Typically, L. stagnalis avidly graze films of deposited diatoms.[21,27,32] Exposure was shorter than gut residence time,[25] which minimises the confounding influences of efflux and isotope recycling. The short exposures also allow determination of food ingestion rates and Ag assimilation efficiency. Snails were exposed to the labelled food in 150-mL acid-washed polypropylene vials that were partially submerged in a 40-L glass tank filled with 20-L of MHW. The animals were allowed to ingest a bolus of labelled food, and then removed, rinsed with MHW, placed individually in acid-washed enclosures and fed unlabelled food (lettuce) ad libitum for 48 h. The label retained after complete gut clearance defined ‘assimilation’.[37] After this depuration period, snails were removed from enclosures and frozen. Faeces produced by each snail were collected, placed in acid-washed Teflon vials and dried for 24 h at 40 °C for metal analysis. Aliquots of water (2 mL) were taken immediately after labelled feeding, as well as at the beginning and the end of depuration. Water samples were acidified with concentrated nitric acid (Baker Ultrex II grade, 2 % final concentration).
Sample preparation and analysis
To minimise inadvertent metal contamination, labware, vials and Teflon sheeting were soaked for at least 24 h in acid (15 % nitric and 5 % hydrochloric), rinsed several times in ultrapure water and dried under a laminar-flow hood before use.
Partially thawed L. stagnalis were dissected to remove soft tissue, placed individually on a piece of acid-washed Teflon sheeting and allowed to dry at 40 °C for 3 days. Dried snails, faeces and diatoms were weighed and digested in concentrated nitric acid, following the protocol described in Croteau et al.[27] Similar weight samples of the certified reference material DOLT-3 (dogfish liver, National Research Council Canada) were submitted to the same digestion procedure during each analytical run. All samples, blanks and standards were analysed for the naturally occurring stable isotopes of Ag by ICP-MS (Perkin Elmer, Elan 6000, Waltham, MA, USA). Two analytical replicates were measured for each sample. A replicate consisted of 15 individual measurements that were averaged. External standards, serially diluted from ultra-pure, single-element stock, were used to create calibration curves for each isotope. To account for instrument drift and change in sensitivity, internal standardisation was performed by addition of germanium to all samples and standards, but not the calibration blanks. The method detection limit for 107Ag and 109Ag in solution was 0.02 µg L–1, which translates into an Ag tissue concentration of 0.01 µg g–1 (i.e. 2.25 mL of digested sample per 5 mg of dry weight). Measured Ag concentrations in the DOLT-3 were consistently within the certified values. We also reanalysed one of our standards after every 10 samples to ensure that deviations from the standard value were less than 10 % for the analysed Ag isotopes.
Calculation of accumulated tracer concentration
We used an isotope tracing technique that allows tracking of newly accumulated tracers, independently from background levels.[20] Briefly, the relative abundance of 109Ag tracer (i.e. p109) is determined using the signal intensities of each Ag isotope in the calibration standards (Eqn 1). p109 averaged 0.4843 ± 0.0072 (standard deviation) for batches of samples analysed on different days.
Concentrations of tracer in the experimental organism ([109Ag]ê) are calculated as the product of p109 and the total Ag concentrations inferred by the ICP-MS software from the tracer intensity ([T109Ag]):

The pre-existing concentration (background) of Ag ([109Ag]ê0) that occurred in each exposed snail is calculated as the product of p109 and the total Ag concentrations inferred from the intensity of the most abundant Ag isotope (107Ag):

The net tracer uptake (Δ([109Ag]ê) is derived from the total experimental Ag concentration ([109Ag]ê, Eqn 2) minus the pre-existing concentration of tracer ([109Ag]ê0, Eqn 3):

Derivation of uptake rate constant, assimilation efficiency and ingestion rate
The uptake rate constant from solution (kuw, L g–1 day–1) was determined from the slope of the linear regression between 109Ag influx into the snail’s soft tissues and the total 109Ag exposure concentrations ([109Ag]water) (data from the linear portion of the curve). The uptake rate constant from food (kuf, g g–1 day–1) was determined from the slope of the linear regression between 109Ag influx into the snail’s soft tissues and the total dietary 109Ag exposure concentrations (data from the linear portion of the curve). Silver uptake from food was also characterised by the 109Ag assimilation efficiency (AE, unitless) and the food ingestion rates (IR, g g–1 day–1). Each was estimated from a mass-balance of 109Ag recovered in the snail’s soft tissues (109Agsnail, ng) and in the faeces (109Agfaeces, ng) after depuration. Silver AE for each experimental organism was calculated using Eqn 5, and food IR during the labelled feeding was determined using Eqn 6:
where [109Ag]diatoms (ng g–1) is the measured 109Ag concentration in the diatoms mixed with the 109Ag NPs, wtsnail is the snail’s dry weight (g) and T is the exposure duration (days).
Results
Particle characterisation and reactivity studies
The mean particle size as determined from TEM images was 14.4 ± 4.6 nm (Fig. 1a, b). The 109Ag NPs were very stable, as indicated by high zeta potential values (–47 mV). The XRD pattern confirms the presence of metallic Ag with no additional phases detected (Fig. 1c). The UV-Vis spectrum shows the appearance of a plasmon resonance peak at a wavelength characteristic of nanosized Ag (Fig. 1d).

|
Dissolution of 109Ag NPs was assessed at three starting concentrations: 10, 100 and 1000 µg L–1. At the highest tested concentration, apparent equilibrium was reached after 24 h of incubation, which represented up to 2 % of the initial mass of 109Ag NPs (Fig. 2a). Slightly higher dissolution was observed in experiments with lower starting concentrations of 109Ag NPs (inset Fig. 2a). Specifically, 6.9 and 6.2 % of the initial mass of 109Ag NPs dissolved at 10 and 100 µg L–1 respective starting Ag NPs concentrations.
|
Total 109Ag concentration (i.e. particle and dissolved forms) measured in the dissolution experiments with 10 and 100 µg L–1 particle loading declined by 10-fold after 24 h of incubation (data not shown). Loss of particles and dissolved Ag by sorption onto the container walls might explain Ag loss at low 109Ag NP starting concentrations. As a result, the dissolved Ag fraction for a particle loading of 10 and 100 µg L–1 might be underestimated. Tests with Ag in the ionic form (added as AgNO3) at a nominal concentration of 100 µg L–1 (measured concentration 93 µg L–1) showed no loss of dissolved Ag by sorption onto the container walls (i.e. total Ag concentration remained constant at 93 ± 0.7 μg L–1, n = 3, measured at time 0, 24 and 72 h). Dissolved Ag loss was also negligible at the stage of centrifugal filtration in the experiments conducted with Ag added as AgNO3 (i.e. Ag concentration in the filtrates remained constant at 88 ± 0.9 µg L–1, n = 3, measured at 0, 24 and 72 h).
Aggregation of 109Ag NPs (100 µg L–1) in DIW and MHW was tested by measuring the hydrodynamic particle diameter and surface charge. The initial particle dispersal (within 30 min) was similar in DIW and MHW (Fig. 2b). Particle destabilisation appeared immediately after dilution in both media and may be attributable to weak binding of the citrate on the nanoparticle surface, which may have led to the loss of the capping agent. After 30 min, the average particle size (30 nm) was similar between dispersions in both DIW and in MHW. However, at a longer time scale (up to 24 h), a consistent and almost linear increase of the hydrodynamic particle size (from 35 to 110 nm, Fig. 2c) was observed in MHW, indicating some particle aggregation. The surface charge of the particles changed from –27.5 ± 2.7 mV when dispersed in DIW to approximately –20 mV when dispersed in MHW, thus indicating a relatively stable suspension given the relatively low ionic strength of the dispersion medium (~0.004 M).
Ag background concentrations in snails
Snail Ag burden increased linearly with size (R2 = 0.88, P < 0.001, Fig. S1 of the Supplementary material). The slope of the linear relationship indicates that the snail Ag background concentration is 0.12 ± 0.01 µg g–1, which is consistent with the previous report of Ag background concentration in individuals of that species reared in similar laboratory conditions.[32]
Waterborne exposures
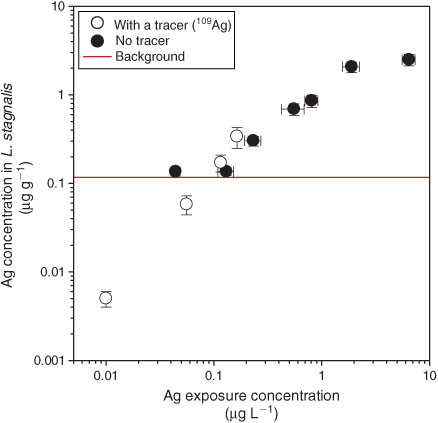
Snails exposed to Ag added as AgNO3 at concentrations of less than 0.15 µg L–1 did not accumulate Ag outside that of the background (solid symbols, Fig. 3). One possible interpretation is that Ag uptake did not begin below a threshold Ag concentration of 0.15 µg L–1. But when snails were exposed to isotopically enriched 109Ag, which allowed correction for snail Ag background, a linear uptake as a function of concentration was evident from concentrations as low as 10 ng L–1 (open symbols, Fig. 3). The uptake rate constant from water (kuw ± 95 % CI) for 109Ag+ was 1.8 ± 0.6 L g–1 day–1. The absence of Ag uptake at low concentrations in the experiments that did not use the stable isotope tracer (solid symbols, Fig. 3) was caused by an inability to differentiate newly taken up Ag from background Ag in the organism. Comparable Ag uptake rates were measured with and without using a tracer at the two moderately high exposures (0.1–0.2 µg L–1).
|
Snails exposed to 109Ag NPs dispersed in MHW at a concentration of 6 ng L–1 accumulated 1 ng of 109Ag per gram of tissue (open symbols, Fig. 4a). This accumulation was detectable only because the Ag NPs were labelled with isotopically enriched 109Ag. Exposure concentrations nearly two orders of magnitude higher were required to detect Ag uptake in L. stagnalis after exposure to unlabelled citrate-capped Ag NPs (solid symbols, Fig. 4a). Exposing snails to increasing concentrations of 109Ag NPs dispersed in MHW showed that 109Ag from the nanoparticles was accumulated over a wide range of concentrations, i.e. from the background Ag expected in a pristine environment to concentrations deemed ‘environmentally extreme’, i.e. above a few micrograms per litre.[3] Although a notable break in the relationship between 109Ag influx and concentration appeared at exposure concentrations slightly lower than 0.1 µg L–1, a statistically significant linear relationship (P < 0.001) was observed over the entire range of data (compilation for three experiments). The kuw for 109Ag NPs was 0.52 ± 0.03 L g–1 day–1 when using the entire dataset whereas kuw varied from 0.51 to 0.85 L g–1 day–1 for each experiment. This variability appears related to the size of the organisms (Fig. S2 of the Supplementary material). The size dependence of kuw suggests a greater sensitivity of young snails to waterborne Ag (Fig. S2).
|
Dietary exposures
As low as 1 ng g–1 of newly accumulated Ag was detectable in L. stagnalis soft tissues when dietary Ag exposure was ~40 ng g–1. Exposure concentrations 40-times higher are required to detect Ag uptake from unlabelled Ag NPs (Fig. 5). That is, in the absence of a tracer, the lowest detectable Ag uptake into L. stagnalis soft tissues (160 ng g–1) was achieved at a dietary Ag concentration of ~2 µg g–1, which is equivalent to the Ag concentration found in a contaminated sediment or benthic microflora.[38] This tissue concentration (160 ng g–1) represents ~0.2 ng of Ag (for the size and weight of snails used in these experiments), which is 50-times higher than what can be detected using 109Ag NPs. Variability in Ag uptake rates among individuals was considerably less in the 109Ag NP experiments. Dietary uptake of Ag from 109Ag NPs was reasonably linear over a very wide range of concentrations, i.e. from 45 ng g–1 to 3 µg g–1. The rate constant of Ag uptake from food (kuf ± 95 % CI) for the 109Ag NPs was 0.05 ± 0.01 g g–1 day–1, which is only 6 % of the rate constant of uptake for dietary Ag (i.e. diatoms pre-exposed to AgNO3) under the same conditions (kuf of 0.81 ± 0.03 g g–1 day–1).[32]
|
Silver from the 109Ag NPs was efficiently assimilated by L. stagnalis when mixed with diatoms. Silver AE (% ± s.d.) varied from 39 ± 7 to 61 ± 6 (Table S2 of the Supplementary material). A similar range of Ag AEs has been reported for L. stagnalis exposed to higher concentrations of unlabelled Ag NPs in their diet (45–64 %).[32] Food IR did not vary among exposure concentrations when snails ingested diatoms mixed with 109Ag NPs (Table S2). Specifically, food IR (±s.d.) averaged 0.11 ± 0.04 g g–1 day–1 when exposure concentrations ranged from 1 to 3 µg g–1. It was not possible to perform mass-balance calculations for the lowest exposure concentrations (<1 µg g–1) as no tracer was detected in the faeces.
Discussion
Ag NP dissolution and aggregation
Dissolution of Ag NPs has been extensively studied, in particular for citrate-coated Ag NPs, as citrate is one of the most common capping agents used in the synthesis of Ag NPs.[39–43] Dissolution rates of Ag from citrate Ag NPs vary widely, however. For example, Liu and Hurt[40] reported a complete dissolution of Ag NPs and thus concluded that citrate-coated Ag NPs will not be persistent in environmental compartments containing dissolved oxygen. In contrast, Kittler et al.[41] observed dissolution ranging from 10 to 70 % depending on temperature and the initial particle concentration. However, comparison of dissolution among studies even for particles with the same coating is complicated because of differences in primary particle size, particle concentration, the physico-chemical characteristics of the dissolution media (e.g. ionic strength, the presence of organic matter, temperature, pH), as well as by the methodology used to measure dissolution.[43–46] Our results indicated that dissolution of 109Ag NPs was relatively low in MHW. However, the proportion of dissolved 109Ag estimated using a starting 109Ag NP concentration of 1000 µg L–1 might be an underestimation of the dissolved fraction at lower Ag NP concentrations such as those used in our biological experiments (i.e. from 6 ng L–1 to 4 µg L–1). Using a very simple matrix (0.05 M NaNO3) and Ag concentrations ranging from 0.5 to 2.7 µg L–1 and from 32 to 130 µg L–1, Hadioui et al.[46] showed an increase in the proportion of dissolved Ag with decreasing Ag NP concentration. Because determining dissolution at such low concentrations is analytically challenging, it remains unclear if the same trends would be observed in more complex media where Ag NP agglomeration, Ag complexation or Ag precipitation may occur.
Although particle aggregation occurred over the course of our biological experiments (Fig. 2c), most of the 109Ag NPs remained suspended in MHW for the duration of the experiments. Despite a 3-fold increase in particle size (from 35 to 110 nm over 24 h), the aggregate size remained relatively small and within the nanosize regime. The influence of the ionic strength (IS) of the dispersion medium on the aggregation of citrate-coated Ag NPs has been reported in several studies. For example, El Badawy et al.[47] observed a 50-fold increase in average particle size of citrate-capped Ag NPs (TEM size 20 nm) when dispersed in 100 mM NaNO3 and an 80-fold increase when dispersed in 100 mM Ca(NO3)2. Aggregation of the particles was more affected by the presence of divalent cations such as Ca and Mg.[48] Li and Lehnart[43] also observed a significant increase in hydrodynamic particle size (10-fold within 6 h and micrometer sized aggregates formed within 24 h) of citrate-coated Ag NPs (82 nm, DLS size) upon dispersion in natural surface water (pH 7.7, IS ~9.9 mM). An even more drastic increase in Ag NP size was observed by Zhang et al.[45] who reported a 150-fold increase in particle size of 20 nm for citrate-coated AgNPs upon dispersion in quarter-strength Hoagland medium (IS ~7.4 mM). Li et al.[49,50] reported critical coagulation concentrations (CCCs) of 40 (IS ~40 mM) and 2 mM (IS ~6 mM) for citrate-coated Ag NPs in monovalent (NaCl, NaNO3) and divalent electrolytes (CaCl2). The ionic strength of the MHW (~4 mM) is well below the CCC reported by Li et al.,[49,50] suggesting that aggregation was less likely. In addition, there is some evidence in the literature that the concentration of nanoparticles also affects their aggregation with higher aggregation observed at higher concentrations because of a higher probability of particle collisions.[12,14]
Effect of aggregation and dissolution on bioavailability
Ag NPs are typically stabilised against aggregation by adsorption or attachment of organic compounds, which thus act as capping agents. However, these coatings, if bound to the surface by simple electrostatic forces, can be easily removed once particles are dispersed into experimental media, with possible effects on nanoparticle stability and bioavailability.[51] For example, aggregation of Ag NPs has been linked to a loss of antibacterial activity,[52,53] and has led to the hypothesis that aggregation of Ag NPs mitigates toxicity for natural bacterial assemblages.[4] The Ag bioaccumulation data reported here for L. stagnalis suggests that observed or potential changes in aggregation over the wide concentration range tested did not have much effect on 109Ag NP bioavailability. It should be noted that, in the present study, it was not possible to measure particle aggregation at the low concentration range used in the biological experiments (i.e. below 100 µg L–1). A more direct study of how agglomeration and aggregation influences bioavailability is certainly warranted and should include determinations of changes in particle size over a wide concentration range, along with direct determinations of how toxicity or bioavailability changes.
Dissolution may have influenced Ag bioavailability to L. stagnalis, especially at low waterborne exposure concentrations (<0.1 µg L–1). We modelled that influence by assuming that 7 % of each total Ag concentration (from 109Ag NPs) had dissolved during the 24-h exposure to 109Ag NPs dispersed in MHW, based upon the observation that 109Ag NPs were marginally soluble at 1000 µg L–1 and only slightly more soluble down to 10 µg L–1 (Fig. 2a). Influx of 109Ag in L. stagnalis (109Aginflux) from the dissolved 109Ag was predicted using the first terms of Eqn 7 where kuwAg+ and kuwAgNP are the rate constants of uptake for 109Ag+ and 109Ag NPs, and [109Ag]ns and [109Ag NPs] are the concentration of the newly solubilised 109Ag and 109Ag NPs.

where kuwAg+ × [109Ag]ns is the contribution of dissolved 109Ag and kuwAg NP × [109Ag NPs] is the contribution of 109Ag NPs.
As shown by the dotted line in Fig. 4a, the predicted 109Ag influxes in L. stagnalis from exposure to newly solubilised 109Ag match the observed influx when exposure concentrations are below ~0.1 µg L–1. As exposure concentrations increase into the range where solubility was directly tested, the proportion of uptake explained by the dissolved 109Ag declines.
We also used Eqn 7 to determine the contribution of 109Ag NP uptake by subtracting the predicted 109Ag influx after dissolved 109Ag exposure (above) from the observed 109Ag influx (Fig. 4a). Comparing the relative contribution of each 109Ag form to the overall 109Ag influx in L. stagnalis, we found that nearly 70 % of the observed 109Ag bioaccumulation at the low exposure concentrations (i.e. <0.1 µg L–1) can be explained by uptake of dissolved 109Ag from newly solubilised 109Ag (Fig. 4b). Considering the recent evidence that points towards a significant increase in the proportion of dissolved fraction relative to the nanoparticulate fraction at low nanoparticle concentrations (at least in simple media[46]), it seems that direct Ag NP uptake from water may not be the most important source of Ag for the biota at environmentally realistic exposure concentrations (i.e. <0.1 µg L–1), at least in L. stagnalis. At exposure concentrations higher than 0.1 µg L–1, we estimated that 80 % of the bioaccumulated 109Ag concentration in L. stagnalis originated from the 109Ag NPs (Fig. 4b). Higher dissolution of Ag from Ag NPs (the above predictions assumed 7 % dissolution) would decrease the importance of Ag NP uptake. The break in the linear uptake of 109Ag in L. stagnalis after 109Ag NP exposure at concentrations ranging from 43 to 76 ng L–1 (Fig. 4a) suggests that Ag bioaccumulation processes may be driven by dissolution at low concentrations but by processes more complex than simple dissolution of Ag from Ag NPs at higher concentrations.
Background metal concentrations
Background metal concentrations can impede detection of metal uptake after environmentally realistic exposures. For example, Dybowska et al.[15] showed that dietary Zn concentrations as high as 5000 µg g–1 are required to detect Zn accumulation in the snail L. stagnalis beyond that of the background. However, an exposure concentration of 5000 µg g–1 represents a Zn concentration above the highest observed in polluted environment.[38] The present study shows that this limitation applies not only to essential trace elements like Zn and Cu, but also to rare and non-essential trace elements like Ag. For example, the Ag background concentration of freshwater snails reared in the laboratory is ~0.1 µg g–1, whereas that of field collected animals is typically higher.[54,55] Background metal concentrations thus need to be accounted for whether animals are collected from nature or cultured in the laboratory. This is especially important when using low exposure concentrations because erroneous conclusions might be inferred. For example, a lack of detectable accumulation after exposure to a low metal concentration might be incorrectly ascribed to low metal bioavailability or physiologically regulated uptake processes.
One option to circumvent the confounding influences of background concentrations is to determine metal concentration in a subsample of unexposed organisms (for example, the controls) and subtract this ‘background’ from the concentration measured for each experimental organism. Although used frequently, this approach has several caveats, among which (i) individual variability in the background metal concentration, which can be as high as 75 %,[16] is ignored, thereby generating large errors, especially at low exposure concentrations, (ii) the net concentration taken up at low exposure levels is a small difference between two larger numbers, adding uncertainty to the interpretation, (iii) as a result, environmental studies are forced to use high exposure concentrations that are atypical of environmental conditions to allow detection above background and (iv) performing mass-balance calculations is a challenge when the ‘newly accumulated’ metal concentrations can’t be accurately detected in faecal material and surrounding media.
Advantages of using a tracer
The number of ecotoxicological studies involving engineered Ag NPs has increased dramatically in recent years. However, the difficulties noted above and the need to trigger detectable effects have meant that much of the available literature is based on unrealistically high exposure concentrations.[4–7] Although the use of unrealistically high exposure concentrations can provide worst-case exposure scenarios, atypical behaviour and properties of NPs at high concentrations like aggregation[12–14] make this assumption questionable.
As a result of the ability to circumvent the confounding influences of background Ag concentrations, the use of stable isotope tracers allowed study of the bioaccumulation of Ag NPs down to extremely low exposure concentrations. Ag has only two natural stable isotopes, i.e. 107Ag and 109Ag whose relative abundances are 51.8 and 48.2 %,[55] which is the most unfavourable scenario for tracing. However, overcoming the limitations posed by the snail natural Ag background concentration is possible when isotopically enriched Ag is used as a tracer. As shown in Fig. 3 (white circles), exposing snails for 24 h to aqueous Ag in the form of isotopically enriched 109Ag at concentrations as low as 10 ng L–1 yielded detectable Ag accumulation into snail’s soft tissues. Similarly, the use of labelled Ag NPs allowed detection of as little as 3 pg of newly accumulated 109Ag in the snails’ soft tissues after 24-h exposure to 109Ag NPs dispersed in water at a concentration of 6 ng L–1 (Fig. 4a, white circles). The capability to detect low accumulated Ag concentrations in tissues also allows characterisation of the physiological mechanisms governing Ag uptake in non-stressed organisms, i.e. in organisms whose physiological and biochemical processes are not already altered by an excessive Ag exposure dose.[18,19]
Moreover, comparing mass-balance calculations performed using a tracer to those obtained using unlabelled Ag NPs raises the question of how reliable are conclusions on Ag bioavailability drawn after low exposures without using a tracer approach. For example, Croteau et al.[32] concluded that food palatability decreased with increasing concentrations of unlabelled Ag NPs in a diet. However, our results rather suggest that whenever there are Ag NPs in the diet, at concentrations that are environmentally relevant, food palatability is impaired but not in a concentration-dependent manner. Specifically, food IR averaged 0.11 g g–1 day–1 for the three exposure concentrations for which mass-balance calculations could be performed (Table S2). This averaged food IR is lower than the feeding rates reported for ‘unchallenged’ L. stagnalis (control) that can vary from 0.5 to 0.9 g g–1 day–1.[25] A low-threshold particle-specific feeding inhibition, that is not concentration-dependent, has been observed whenever Cu-bearing Fe-Al particles were mixed in the diet of L. stagnalis.[21] A possible explanation for the discrepancy in the food IR estimates at low Ag NP concentrations for the labelled and non-labelled particles includes the difference in the detection limits of the two approaches. There is a 50-fold difference in the smallest amount of Ag that can be detected when a tracer is used or not (Table S3 of the Supplementary material). As a result, more uncertainty surrounds mass-balance calculations performed close to detection limits, especially in the absence of a tracer.
Conclusions
Silver uptake rates in L. stagnalis from citrate-capped 109Ag NPs from food and water are statistically linear over concentrations ranging from close to the natural background of Ag to concentrations unlikely to occur in even the most contaminated environments. However, Ag uptake rates in L. stagnalis fluctuate notably when exposures ranged from 43 to 76 ng L–1. We ascribe this ‘break’ in the linearity of the relationship to a shift from uptake of mostly dissolved Ag (at the lower concentrations) to uptake from mostly Ag NPs (at higher concentrations). Increased dissolution in the extremely low concentration range tested (i.e. <0.1 µg L–1) could potentially influence bioavailability, but no such increase was necessary to explain the present results. Chemical determinations (e.g. centrifugal ultrafiltration techniques, ion-exchange resin, single particle ICP-MS) of these processes in relevant media and at relevant concentrations are essential in future studies[46] but are often quite challenging without tracers. In lieu of integrated chemical and biological data, it is probably best to be cautious when assuming the degree of dissolution or aggregation at different concentrations and, in particular, the influences of either on bioavailability. Chemical data alone are not necessarily predictive of influences on bioavailability; direct biological studies are required. The stable isotope tracing approach provides a powerful tool to better investigate bioavailability at environmentally realistic concentrations.
Acknowledgements
The authors are grateful to Dan Cain and three anonymous reviewers for reviewing the manuscript. The authors also acknowledge funding from the joint US-EPA (Research Program Grant RD-834557501-0) and UK-NERC (NE/F005008/1) as well as the Toxic Substance Hydrology Program of the US Geological Survey and the Facility for Environmental Nanoscience Analysis and Characterisation (FENAC).
References
[1] F. Gottschalk, T. Sonderer, R. W. Scholz, B. Nowack, Modeled environmental concentrations of engineered nanomaterials (TiO2, ZnO, Ag, CNT, fullerenes) for different regions. Environ. Sci. Technol. 2009, 43, 9216.| Modeled environmental concentrations of engineered nanomaterials (TiO2, ZnO, Ag, CNT, fullerenes) for different regions.Crossref | GoogleScholarGoogle Scholar | 1:CAS:528:DC%2BD1MXhtlyhtL%2FP&md5=a8a5454d70978de5af6ee6d145a26961CAS | 20000512PubMed |
[2] F. Gottschalk, T. Y. Sun, B. Nowack, Environmental concentrations of engineered nanomaterials: review of modeling and analytical studies. Environ. Pollut. 2013, 181, 287.
| Environmental concentrations of engineered nanomaterials: review of modeling and analytical studies.Crossref | GoogleScholarGoogle Scholar | 1:CAS:528:DC%2BC3sXhtFSlsrfP&md5=7be267556cba6b63f2cffd78eb64df51CAS | 23856352PubMed |
[3] S. N. Luoma, Old problems or new challenges, in PEN 15 – Silver nanotechnologies and the environment 2008 (Woodrow Wilson International Center for Scholars). Available at http://www.nanotechproject.org/process/assets/files/7036/nano_pen_15_final.pdf [Verified 19 December 2013].
[4] A. Bradford, R. D. Handy, J. W. Readman, A. Atfield, M. Muhling, Impact of silver nanoparticle contamination of natural bacterial assemblages in estuarine sediments. Environ. Sci. Technol. 2009, 43, 4530.
| Impact of silver nanoparticle contamination of natural bacterial assemblages in estuarine sediments.Crossref | GoogleScholarGoogle Scholar | 1:CAS:528:DC%2BD1MXlt1SgurY%3D&md5=cfa973ebd665d74830f7b7c63e3b57cfCAS | 19603673PubMed |
[5] P. V. Asharani, Y. L. Wu, Z. Gong, S. Valiyaveettil, Toxicity of silver nanoparticles in zebrafish models. Nanotechnology 2008, 19, 1.
[6] O. Choi, T. E. Clevenger, B. Deng, R. Y. Surampalli, L. Ross, Z. Hu, Role of sulfide and ligand strength in controlling nanosilver toxicity. Water Res. 2009, 43, 1879.
| Role of sulfide and ligand strength in controlling nanosilver toxicity.Crossref | GoogleScholarGoogle Scholar | 1:CAS:528:DC%2BD1MXktVCmtb0%3D&md5=c5c4b2970d344e4830a7adb4f756ac72CAS | 19249075PubMed |
[7] J. N. Meyer, C. A. Lord, X. Y. Yang, E. A. Turner, A. R. Badireddy, S. M. Marinakos, A. Chilkoti, M. R. Wiesner, M. Auffan, Intracellular uptake and associated toxicity of silver nanoparticles in Caenorhabditis elegans. Aquat. Toxicol. 2010, 100, 140.
| Intracellular uptake and associated toxicity of silver nanoparticles in Caenorhabditis elegans.Crossref | GoogleScholarGoogle Scholar | 1:CAS:528:DC%2BC3cXhtFGjs7bI&md5=40459a41abbeb56b27471610585121bdCAS | 20708279PubMed |
[8] K. J. Lee, P. D. Nallathamby, L. M. Browning, C. J. Osgood, X.-H. N. Xu, In vivo imaging of transport and biocompatibility of single silver nanoparticles in early development of zebrafish embryos. ACS Nano 2007, 1, 133.
| In vivo imaging of transport and biocompatibility of single silver nanoparticles in early development of zebrafish embryos.Crossref | GoogleScholarGoogle Scholar | 1:CAS:528:DC%2BD2sXhtFSnsL%2FF&md5=616c585701371085f8c3a940a3ea9749CAS | 19122772PubMed |
[9] A. H. Ringwood, M. McCarthy, T. C. Bates, D. L. Carroll, The effects of silver nanoparticles on oyster embryos. Mar. Environ. Res. 2010, 69, S49.
| The effects of silver nanoparticles on oyster embryos.Crossref | GoogleScholarGoogle Scholar | 1:CAS:528:DC%2BC3cXht1OgtLjK&md5=b9a47a3b81a02d0749b34a87c01c6e78CAS | 19913905PubMed |
[10] P. Borm, F. C. Klaessing, T. D. Landry, B. Moudgil, J. Pauluhn, K. Thomas, R. Trottier, S. Wood, Research strategies for safety evaluation of nanomaterials, Part V. Role of dissolution in biological fate and effects of nanoscale particles. Toxicol. Sci. 2005, 90, 23.
| Research strategies for safety evaluation of nanomaterials, Part V. Role of dissolution in biological fate and effects of nanoscale particles.Crossref | GoogleScholarGoogle Scholar |
[11] N. M. Franklin, N. J. Rogers, S. C. Apte, G. E. Batley, G. E. Gadd, P. S. Casey, Comparative toxicity of nanoparticulate ZnO, bulk ZnO, and ZnCl2 to a freshwater microalga (Pseudokirchneriella subcapitata): the importance of particle solubility. Environ. Sci. Technol. 2007, 41, 8484.
| Comparative toxicity of nanoparticulate ZnO, bulk ZnO, and ZnCl2 to a freshwater microalga (Pseudokirchneriella subcapitata): the importance of particle solubility.Crossref | GoogleScholarGoogle Scholar | 1:CAS:528:DC%2BD2sXhtlWqs7fF&md5=e1d09d97f81f4af57461dee3fda4397cCAS | 18200883PubMed |
[12] N. Maximova, O. Dahl, Environmental implications of aggregation phenomena: current understanding. Curr. Opin. Colloid Interface Sci. 2006, 11, 246.
| Environmental implications of aggregation phenomena: current understanding.Crossref | GoogleScholarGoogle Scholar | 1:CAS:528:DC%2BD28Xht1WltLfJ&md5=b4340dcc4bdfa51d8d21ad1e57249981CAS |
[13] T. Phenrat, N. Saleh, K. Sirk, R. D. Tilton, G. V. Lowry, Aggregation and sedimentation of aqueous nanoscale zerovalent iron dispersions. Environ. Sci. Technol. 2007, 41, 284.
| Aggregation and sedimentation of aqueous nanoscale zerovalent iron dispersions.Crossref | GoogleScholarGoogle Scholar | 1:CAS:528:DC%2BD28XhtlCit7nJ&md5=37c25286b70e843ec7c9d65450ba0592CAS | 17265960PubMed |
[14] M. Baalousha, Aggregation and disaggregation of iron oxide nanoparticles: influence of particle concentration, pH and natural organic matter. Sci. Total Environ. 2009, 407, 2093.
| Aggregation and disaggregation of iron oxide nanoparticles: influence of particle concentration, pH and natural organic matter.Crossref | GoogleScholarGoogle Scholar | 1:CAS:528:DC%2BD1MXit1Sjtb0%3D&md5=15fb8a6d2577e2d5c29fbf6d2f99c636CAS | 19059631PubMed |
[15] A. D. Dybowska, M.-N. Croteau, S. K. Misra, D. Berhanu, S. N. Luoma, P. Christian, P. O'Brien, E. Valsami-Jones, Synthesis of isotopically modified ZnO nanoparticles and their potential as nanotoxicity tracers. Environ. Pollut. 2011, 159, 266.
| Synthesis of isotopically modified ZnO nanoparticles and their potential as nanotoxicity tracers.Crossref | GoogleScholarGoogle Scholar | 1:CAS:528:DC%2BC3cXhsVahtbbJ&md5=12a90971ba4a12e2c21e19e620d086b1CAS | 20940078PubMed |
[16] S. K. Misra, A. D. Dybowska, D. Berhanu, M.-N. Croteau, S. N. Luoma, A. R. Boccaccini, E. Valsami-Jones, Isotopically modified nanoparticles for enhanced detection in bioaccumulation studies. Environ. Sci. Technol. 2012, 46, 1216.
| Isotopically modified nanoparticles for enhanced detection in bioaccumulation studies.Crossref | GoogleScholarGoogle Scholar | 1:CAS:528:DC%2BC3MXhsFygt7nM&md5=6e8853378afe863c963c87923be87ce1CAS | 22148182PubMed |
[17] S. N. Luoma, P. S. Rainbow, Why is metal bioaccumulation so variable? Biodynamics as a unifying concept. Environ. Sci. Technol. 2005, 39, 1921.
| Why is metal bioaccumulation so variable? Biodynamics as a unifying concept.Crossref | GoogleScholarGoogle Scholar | 1:CAS:528:DC%2BD2MXhsF2ntLY%3D&md5=49d172ac5f9cf8e286b6c9b841488fbfCAS | 15871220PubMed |
[18] G. Blackmore, W.-X. Wang, Uptake and efflux of Cd and Zn by the green mussel Perna viridis after metal preexposure. Environ. Sci. Technol. 2002, 36, 989.
| Uptake and efflux of Cd and Zn by the green mussel Perna viridis after metal preexposure.Crossref | GoogleScholarGoogle Scholar | 1:CAS:528:DC%2BD38XmsVGisg%3D%3D&md5=bebe9998f3cfe9ab02b781e25833389fCAS | 11918030PubMed |
[19] D. S. Shi, G. Blackmore, W.-X. Wang, Effects of aqueous and dietary preexposure and resulting body burden on silver biokinetics in the green mussel Perna viridis. Environ. Sci. Technol. 2003, 37, 936.
| Effects of aqueous and dietary preexposure and resulting body burden on silver biokinetics in the green mussel Perna viridis.Crossref | GoogleScholarGoogle Scholar | 1:CAS:528:DC%2BD3sXms1yrug%3D%3D&md5=5ba4adfd427922f42de01dbab5104571CAS |
[20] M.-N. Croteau, S. N. Luoma, B. R. Topping, C. B. Lopez, Stable metal isotopes reveal copper accumulation and loss dynamics in the freshwater bivalve Corbicula. Environ. Sci. Technol. 2004, 38, 5002.
| Stable metal isotopes reveal copper accumulation and loss dynamics in the freshwater bivalve Corbicula.Crossref | GoogleScholarGoogle Scholar | 1:CAS:528:DC%2BD2cXmvVyqtbw%3D&md5=b3f909f30533a0f940634ae7b327e778CAS | 15506192PubMed |
[21] M.-N. Croteau, D. J. Cain, C. C. Fuller, Novel and nontraditional use of stable isotope tracers to study metal bioavailability from natural particles. Environ. Sci. Technol. 2013, 47, 3424.
| 1:CAS:528:DC%2BC3sXjsVWrtLk%3D&md5=3dfc6a4b4f26613239864978b70aa592CAS | 23458345PubMed |
[22] W.-X. Wang, N. S. Fisher, S. N. Luoma, Kinetic determinations of trace element bioaccumulation in the mussel Mytilus edulis. Mar. Ecol. Prog. Ser. 1996, 140, 91.
| Kinetic determinations of trace element bioaccumulation in the mussel Mytilus edulis.Crossref | GoogleScholarGoogle Scholar | 1:CAS:528:DyaK28XmtlKjt70%3D&md5=751aa0518b18041ed77a474dbff5ceffCAS |
[23] R. Cornelis, Use of radiochemical methods as tools for speciation purposes in environmental and biological sciences. Analyst 1992, 117, 583.
| Use of radiochemical methods as tools for speciation purposes in environmental and biological sciences.Crossref | GoogleScholarGoogle Scholar | 1:CAS:528:DyaK38Xis1Oquro%3D&md5=7d616ef2b0836d257c288245034b4c67CAS | 1580405PubMed |
[24] S. Stürup, H. R. Hansen, P. Gammelgarrd, Application of enriched stable isotopes as tracers in biological systems: a critical review. Anal. Bioanal. Chem. 2008, 390, 541.
| Application of enriched stable isotopes as tracers in biological systems: a critical review.Crossref | GoogleScholarGoogle Scholar | 17917720PubMed |
[25] M.-N. Croteau, S. N. Luoma, B. Pellet, Determining metal assimilation efficiency in aquatic invertebrates using enriched stable metal isotope tracers. Aquat. Toxicol. 2007, 83, 116.
| Determining metal assimilation efficiency in aquatic invertebrates using enriched stable metal isotope tracers.Crossref | GoogleScholarGoogle Scholar | 1:CAS:528:DC%2BD2sXlsFKjt70%3D&md5=9d4587e3e8ba042713e34ef85c7cc13cCAS | 17467071PubMed |
[26] D. J. Cain, M.-N. Croteau, S. N. Luoma, Bioaccumulation dynamics and exposure routes of Cd and Cu among species of aquatic mayflies. Environ. Toxicol. Chem. 2011, 30, 2532.
| Bioaccumulation dynamics and exposure routes of Cd and Cu among species of aquatic mayflies.Crossref | GoogleScholarGoogle Scholar | 1:CAS:528:DC%2BC3MXhtl2gur%2FK&md5=6c4e58dd6f9e7ec97ec4c9a202ead67aCAS |
[27] M.-N. Croteau, A. D. Dybowska, S. N. Luoma, E. Valsami-Jones, A novel approach reveals that zinc oxide nanoparticles are bioavailable and toxic after dietary exposures. Nanotoxicology 2011, 5, 79.
| A novel approach reveals that zinc oxide nanoparticles are bioavailable and toxic after dietary exposures.Crossref | GoogleScholarGoogle Scholar | 1:CAS:528:DC%2BC3MXhtVKqsrvI&md5=3379a0b752337de8e4a8a4756aadb045CAS | 21417690PubMed |
[28] D. J. Cain, M.-N. Croteau, C. C. Fuller, Dietary bioavailability of Cu adsorbed to colloidal hydrous ferric oxide. Environ. Sci. Technol. 2013, 47, 2869.
| Dietary bioavailability of Cu adsorbed to colloidal hydrous ferric oxide.Crossref | GoogleScholarGoogle Scholar | 1:CAS:528:DC%2BC3sXitl2ks7c%3D&md5=febf28cded63b430debed55a800c20e9CAS | 23402601PubMed |
[29] B. Gulson, M. McCall, M. Korsch, L. Gomez, P. Casey, Y. Oytam, A. Taylor, M. McCulloch, J. Trotter, L. Kinsley, G. Greenoak, Small amounts of zinc oxide particles in sunscreens applied outdoors are absorbed through human skin. Toxicol. Sci. 2010, 118, 140.
| Small amounts of zinc oxide particles in sunscreens applied outdoors are absorbed through human skin.Crossref | GoogleScholarGoogle Scholar | 1:CAS:528:DC%2BC3cXhtlSmtbnE&md5=f1bf11b9fce05478984ee16b95691081CAS | 20705894PubMed |
[30] F. Larner, Y. Dogra, A. Dybowska, J. Fabrega, B. Stolpe, L. J. Bridgestock, R. Goodhead, D. J. Weiss, J. Moger, J. R. Lead, E. Valsami-Jones, C. R. Tyler, T. S. Galloway, M. Rehkamper, Tracing bioavailability of ZnO nanoparticles using stable isotope labeling. Environ. Sci. Technol. 2012, 46, 12137.
| Tracing bioavailability of ZnO nanoparticles using stable isotope labeling.Crossref | GoogleScholarGoogle Scholar | 1:CAS:528:DC%2BC38XhsVyltb7F&md5=a3d8653c7725588a2074147f2d1c7197CAS | 23050854PubMed |
[31] F. R. Khan, A. Laycock, A. Dybowska, F. Larner, B. D. Smith, P. S. Rainbow, S. N. Luoma, M. Rehkamper, E. Valsami-Jones, Stable isotope tracer to determine uptake and efflux dynamics of ZnO nano- and bulk particles and dissolved Zn to an estuarine snail. Environ. Sci. Technol. 2013, 47, 8532.
| 1:CAS:528:DC%2BC3sXhtVWhurzJ&md5=b8362b5b25c17114c1fea03b3e1f5cf4CAS | 23802799PubMed |
[32] M.-N. Croteau, S. K. Misra, S. N. Luoma, E. Valsami-Jones, Silver bioaccumulation dynamics in a freshwater invertebrate after aqueous and dietary exposures to nanosized and ionic Ag. Environ. Sci. Technol. 2011, 45, 6600.
| Silver bioaccumulation dynamics in a freshwater invertebrate after aqueous and dietary exposures to nanosized and ionic Ag.Crossref | GoogleScholarGoogle Scholar | 1:CAS:528:DC%2BC3MXosVSrsr8%3D&md5=e530ba987072b8b611f3a72f2ed26bc2CAS | 21667957PubMed |
[33] Methods for Measuring the Acute Toxicity pf Effluents and Receiving Waters to freshwater and Marine Organisms, EPA-821-R-02–012 2002 (US Environmental Protection Agency: Washington, DC).
[34] D. L. Parkust, C. A. J. Appelo, User’s guide to PHREEQC (version 2) – a computer program for speciation, batch-reaction, onedimensional transport, and inverse geochemical calculations. Water Resources Investigative Report 99–4259 1999 (US Geological Survey, Denver, CO).
[35] E. C. Irving, D. J. Baird, J. M. Culp, Ecotoxicological responses of the mayfly Baetis tricaudatus to dietary and waterborne cadmium: implications for toxicity testing. Environ. Toxicol. Chem. 2003, 22, 1058.
| 1:CAS:528:DC%2BD3sXjtFCmsro%3D&md5=8e32d9ab4ee381a91e97077dedb3c608CAS | 12729215PubMed |
[36] W.-X. Wang, N. S. Fisher, Assimilation efficiencies of chemical contaminants in aquatic invertebrates: a synthesis. Environ. Toxicol. Chem. 1999, 18, 2034.
| Assimilation efficiencies of chemical contaminants in aquatic invertebrates: a synthesis.Crossref | GoogleScholarGoogle Scholar | 1:CAS:528:DyaK1MXls1Sqs7g%3D&md5=737d8b3c49ae3f256416bff18e94b265CAS |
[37] S. N. Luoma, P. S. Rainbow, Metal Contamination in Aquatic Environments: Science and Lateral Management 2008 (Cambridge University Press: Cambridge, UK).
[38] R. C. Doty, T. R. Tshikhudo, M. Brust, D. G. Fernig, Extremely stable water-soluble Ag nanoparticles. Chem. Mater. 2005, 17, 4630.
| Extremely stable water-soluble Ag nanoparticles.Crossref | GoogleScholarGoogle Scholar | 1:CAS:528:DC%2BD2MXntVChtr4%3D&md5=8c5d336b3ec66a1e3ab7fc7a0e340f09CAS |
[39] J. Liu, R. Hurt, Ion release kinetics and particle persistence in aqueous nano-silver colloids. Environ. Sci. Technol. 2010, 44, 2169.
| Ion release kinetics and particle persistence in aqueous nano-silver colloids.Crossref | GoogleScholarGoogle Scholar | 1:CAS:528:DC%2BC3cXit1Wqsrc%3D&md5=eda8eefb62b5e038312ad7a39ce5d935CAS | 20175529PubMed |
[40] S. Kittler, C. Greulich, J. Diendorf, M. Koller, M. Epple, Toxicity of silver nanoparticles increases during storage because of slow dissolution under release of silver ions. Chem. Mater. 2010, 22, 4548.
| Toxicity of silver nanoparticles increases during storage because of slow dissolution under release of silver ions.Crossref | GoogleScholarGoogle Scholar | 1:CAS:528:DC%2BC3cXpsV2ltbo%3D&md5=22d2ff31e22b7d8515908241adbb5e5aCAS |
[41] J. Y. Liu, D. A. Sonshine, S. Shervani, R. H. Hurt, Controlled release of biologically active silver from nanosilver surfaces. ACS Nano 2010, 4, 6903.
| Controlled release of biologically active silver from nanosilver surfaces.Crossref | GoogleScholarGoogle Scholar | 1:CAS:528:DC%2BC3cXhtlaitb3L&md5=f74a2c9fb88e9b8a96314791af98dfb3CAS |
[42] X. A. Li, J. J. Lenhart, Aggregation and dissolution of silver nanoparticles in natural surface water. Environ. Sci. Technol. 2012, 46, 5378.
| Aggregation and dissolution of silver nanoparticles in natural surface water.Crossref | GoogleScholarGoogle Scholar | 1:CAS:528:DC%2BC38XlsFemsLk%3D&md5=609388f4bb944bc4f5c354e4018e892fCAS |
[43] C. M. Ho, S. K. W. Yau, C. N. Lok, M. H. So, C. M. Che, Oxidative dissolution of silver nanoparticles by biologically relevant oxidants: a kinetic and mechanistic study. Chem. Asian J. 2010, 5, 285.
| Oxidative dissolution of silver nanoparticles by biologically relevant oxidants: a kinetic and mechanistic study.Crossref | GoogleScholarGoogle Scholar | 1:CAS:528:DC%2BC3cXhsVGqsLY%3D&md5=9f8694e62338e431765a66c0ca056615CAS | 20063340PubMed |
[44] W. Zhang, Y. Yao, N. Sullivan, Y. Chen, Modeling the primary size effects of citrate-coated silver nanoparticles on their ion release kinetics. Environ. Sci. Technol. 2011, 45, 4422.
| Modeling the primary size effects of citrate-coated silver nanoparticles on their ion release kinetics.Crossref | GoogleScholarGoogle Scholar | 1:CAS:528:DC%2BC3MXltVGgsb0%3D&md5=dbb9e1cadbe810bbc0df0c57b73c3d95CAS | 21513312PubMed |
[45] M. Hadioui, S. Leclerc, K. J. Wilkinson, Multimethod quantification of Ag+ release from nanosilver. Talanta 2013, 105, 15.
| Multimethod quantification of Ag+ release from nanosilver.Crossref | GoogleScholarGoogle Scholar | 1:CAS:528:DC%2BC3sXmt1WjurY%3D&md5=a2cd9d269a709af1c2d216816cd619e6CAS | 23597981PubMed |
[46] A. M. El Badawy, T. D. Luxton, R. G. Silva, K. G. Scheckel, M. T. Suidan, T. M. Talaymat, Impact of environmental conditions (pH, ionic strength, and electrolyte type) on the surface charge and aggregation of silver nanoparticles suspensions. Environ. Sci. Technol. 2010, 44, 1260.
| Impact of environmental conditions (pH, ionic strength, and electrolyte type) on the surface charge and aggregation of silver nanoparticles suspensions.Crossref | GoogleScholarGoogle Scholar | 1:CAS:528:DC%2BC3cXptl2qtg%3D%3D&md5=6edf1d6fd0c8d4db699b6aca49a9f591CAS | 20099802PubMed |
[47] K. A. Huynh, K. L. Chen, Aggregation kinetics of citrate and polyvinylpyrrolidone coated silver nanoparticles in monovalent and divalent electrolyte solutions. Environ. Sci. Technol. 2011, 45, 5564.
| Aggregation kinetics of citrate and polyvinylpyrrolidone coated silver nanoparticles in monovalent and divalent electrolyte solutions.Crossref | GoogleScholarGoogle Scholar | 1:CAS:528:DC%2BC3MXmvVWkurw%3D&md5=8a7b8461f4e3ad391fdbbb7119cdbcecCAS | 21630686PubMed |
[48] X. A. Li, J. J. Lenhart, H. W. Walker, Dissolution-accompanied aggregation kinetics of silver nanoparticles. Langmuir 2010, 26, 16690.
| Dissolution-accompanied aggregation kinetics of silver nanoparticles.Crossref | GoogleScholarGoogle Scholar | 1:CAS:528:DC%2BC3cXht1ahtbbN&md5=5bdfe4601f8800f0443d5ed66c43294dCAS |
[49] X. A. Li, J. J. Lenhart, H. W. Walker, Aggregation kinetics and dissolution of coated silver nanoparticles. Langmuir 2012, 28, 1095.
| Aggregation kinetics and dissolution of coated silver nanoparticles.Crossref | GoogleScholarGoogle Scholar | 1:CAS:528:DC%2BC3MXhsF2lsLvL&md5=67c234af5c1b3e895d938921df686cd0CAS |
[50] C. Levard, E. M. Hotze, G. V. Lowry, G. E. Brown, Environmental transformations of silver nanoparticles: impact on stability and toxicity. Environ. Sci. Technol. 2012, 46, 6900.
| Environmental transformations of silver nanoparticles: impact on stability and toxicity.Crossref | GoogleScholarGoogle Scholar | 1:CAS:528:DC%2BC38XitlGjt7o%3D&md5=4dae6e02caa0d9ab4a861e91882a1b9dCAS | 22339502PubMed |
[51] C. N. Lok, C. M. Ho, R. Chen, Q. Y. He, W. Y. Yu, H. Sun, P. K. H. Tam, J. F. Chiu, C. M. Che, Silver nanoparticles: partial oxidation and antibacterial activities. J. Biol. Inorg. Chem. 2007, 12, 527.
| Silver nanoparticles: partial oxidation and antibacterial activities.Crossref | GoogleScholarGoogle Scholar | 1:CAS:528:DC%2BD2sXkvVaitLc%3D&md5=4edecd2af31c043e8d3dcccd68d342feCAS | 17353996PubMed |
[52] L. Kvitek, A. Panacek, J. Soukupova, M. Kolar, R. Vecerova, R. Prucek, M. Holecova, R. Zboril, Effect of surfactants and polymers on stability and antibacterial activity of silver nanopartciles (NPs). J. Phys. Chem. C 2008, 112, 5825.
| Effect of surfactants and polymers on stability and antibacterial activity of silver nanopartciles (NPs).Crossref | GoogleScholarGoogle Scholar | 1:CAS:528:DC%2BD1cXjsF2rsL0%3D&md5=f70b0937c1446fdc3b7100e6247fef3fCAS |
[53] F. R. Khan, S. K. Misra, J. Garcia-Alonso, B. D. Smith, S. Strekopytov, P. S. Rainbow, S. N. Luoma, E. Valsami-Jones, Bioaccumulation dynamics and modeling in an estuarine invertebrate following aqueous exposure to nanosized and dissolved silver. Environ. Sci. Technol. 2012, 46, 7621.
| Bioaccumulation dynamics and modeling in an estuarine invertebrate following aqueous exposure to nanosized and dissolved silver.Crossref | GoogleScholarGoogle Scholar | 1:CAS:528:DC%2BC38XosFersrg%3D&md5=99eb60bd4c9ee5e253469d3e0566f06fCAS | 22697255PubMed |
[54] C. L. Brown, F. Parchaso, J. K. Thompson, S. N. Luoma, Assessing toxicant effects in a complex estuary: a case of study of effects of silver on reproduction in the bivalve, Potamocorbula amurensis, in San Francisco Bay. Hum. Ecol. Risk Assess. 2003, 9, 95.
| Assessing toxicant effects in a complex estuary: a case of study of effects of silver on reproduction in the bivalve, Potamocorbula amurensis, in San Francisco Bay.Crossref | GoogleScholarGoogle Scholar | 1:CAS:528:DC%2BD3sXitlWjt70%3D&md5=ee3ed45fef9ed3e8eaf78c5b761cf2a4CAS |
[55] J. K. Böhlke, J. R. de Laeter, P. De Bièvre, H. Hidaka, H. S. Peiser, K. J. R. Rosman, P. D. P. Taylor, Isotopic compositions of the elements, 2001. J. Phys. Chem. Ref. Data 2005, 34, 57.
| Isotopic compositions of the elements, 2001.Crossref | GoogleScholarGoogle Scholar |