

DNA sequences from three genomes reveal multiple long-distance dispersals and non-monophyly of sections in Australasian Plantago (Plantaginaceae)
Mei Lin Tay A C , Heidi M. Meudt A B , Philip J. Garnock-Jones A and Peter A. Ritchie AA School of Biological Sciences, Victoria University of Wellington, PO Box 600, Wellington 6140, New Zealand.
B Museum of New Zealand, Te Papa Tongarewa, PO Box 467, Wellington 6140, New Zealand.
C Corresponding author. Email: meilin.tay@gmail.com
Australian Systematic Botany 23(1) 47-68 https://doi.org/10.1071/SB09040
Submitted: 15 September 2009 Accepted: 18 December 2009 Published: 17 February 2010
Abstract
We examined the geographic origins and taxonomic placements of New Zealand and Australian Plantago (Plantaginaceae) by using molecular phylogenetic data. Plantago comprises over 200 species distributed worldwide. Analyses of three markers from the nuclear (ITS), chloroplast (ndhF–rpl32) and mitochondrial (coxI) genomes showed that the New Zealand species form three distinct, well supported clades that are not each others’ closest relatives, and were each derived relative to the sampled Australian species. Therefore, at least three long-distance directional dispersal events into New Zealand can be inferred for Plantago, likely from Australian ancestors. This result differs from the biogeographic pattern often reported for New Zealand plant genera of a single dispersal event followed by rapid radiation, and may be attributed to ready biotic dispersal of mucilaginous seeds and habitat similarities of the Australasian species. Molecular dating placed the arrival time and diversification of the New Zealand species between 2.291 and 0.5 million years ago, which coincides with the geological dates for the uplift of mountain ranges in New Zealand. The mitochondrial DNA substitution rate of the Australasian clade relative to the rest of the genus is discussed, as well as implications of the non-monophyly of sections Oliganthos, Mesembrynia and Plantago within subgenus Plantago.
Additional keywords: biogeography, cpDNA, dispersal, molecular dating, molecular phylogeny, mtDNA, nrDNA.
Introduction
Plant biogeography in the southern hemisphere has garnered much attention since early studies by Hooker (1853), Darwin (1859) and others. In particular, increased use of molecular phylogenetics since the 1990s has allowed for large-scale evolutionary studies in the region (e.g. Sanmartín and Ronquist 2004; Sytsma et al. 2004; Sanmartín et al. 2007). Recent studies have revealed that long-distance dispersal in the southern hemisphere is far more common than previously thought (Winkworth et al. 1999, 2002b) and that directional dispersal from west to east is common (west wind drift; Winkworth et al. 2002b; Muñoz et al. 2004; Sanmartín et al. 2007).
As an important part of the southern hemisphere, Australasia in particular has been shown to have been strongly influenced by biotic dispersal. Many phylogenetic studies have found that several Australian and New Zealand groups have closely related species or species complexes, suggesting recent or frequent dispersal or both (Breitwieser et al. 1999; von Hagen and Kadereit 2001; Wagstaff et al. 2002; Smissen et al. 2003; Meudt and Simpson 2006; Ford et al. 2007; Perrie and Brownsey 2007; Perrie et al. 2007). Groups with dispersible propagules might have repeatedly crossed the Tasman Sea (e.g. Drosera, Rivadavia et al. 2003). Consistent with the west wind drift, long-distance dispersal appears to be more common from Australia to New Zealand (Wagstaff et al. 1999; Wagstaff and Wege 2002; Ford et al. 2007), although there have been a few well supported cases of dispersals in the other direction (Wagstaff and Garnock-Jones 2000; Lockhart et al. 2001; Wagstaff et al. 2002; Wanntorp and Wanntorp 2003; Meudt and Bayly 2008).
New Zealand especially poses interesting questions in biogeography, taxonomy and evolution because of its isolation (2000 km from the nearest major landmass), its continental geology and mostly Mesozoic age of its rocks, the relationships of its biota with the animals and plants of other regions (Darlington 1965; Nelson 1975; Trewick et al. 2007; McDowall 2008), and geological evidence of extensive submergence of the landmass during the Oligocene (Pole 1994; Cooper and Cooper 1995; Trewick et al. 2007). Recent literature (e.g. Winkworth et al. 1999; Stöckler et al. 2002; Wagstaff et al. 2002; Knapp et al. 2005, 2007) suggests that the origins of New Zealand flora may be the result of a mixture of older vicariance and more recent long-distance dispersal events. For the latter, a common pattern observed is a single dispersal event followed by rapid radiation (Wagstaff and Garnock-Jones 1998; Winkworth et al. 1999; Perrie et al. 2003; Albach et al. 2005; Meudt and Simpson 2006; Ford et al. 2007). Despite increasing numbers of molecular studies involving New Zealand plants, general evolutionary and biogeographic patterns of the New Zealand flora are still not well known, particularly those regarding species in the alpine region (Lockhart et al. 2001).
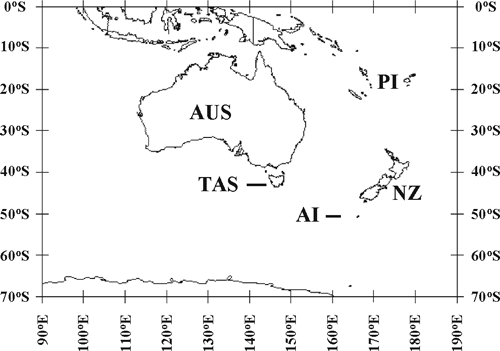
Plantago is a large worldwide genus in the family Plantaginaceae, with more than 200 species. They are found on most continents and many oceanic islands and range from widespread, weedy species to specialised island endemics. Within Australasia (Fig. 1), there are 32 described species, native to New Zealand (8 species and 2 subspecies; Sykes 1988, 1998; Rahn 1996) and Australia (24 spp.; Briggs 1992). There is also a 16-ploid entity from New Zealand that probably represents an undescribed species, tag-named P. sp. ‘Sylvester’ (Groves and Hair 1971). In New Zealand, species of Plantago are distributed widely across both the North and South Islands; whereas in Australia, they are found on the mainland south of 25°S, and in Tasmania. Australasian species of Plantago also occur on offshore islands; e.g. P. aucklandica is endemic to the Auckland Islands, and P. triantha is native to the Auckland Islands and Tasmania. Plants are mostly small rosette herbs and are usually found in damp areas (such as seepage areas and near bogs, tarns and river edges) from alpine regions to lowland and coastal herbfields. Flowers are wind-pollinated and are either solitary or clustered into spicate inflorescences.
|
Rahn (1996) grouped all species of Plantago into six subgenera and several sections on the basis of phylogenetic analysis of morphological data. According to his study, all 32 Australasian species belong to the large subgenus Plantago (comprising 133 species in total); however, they were placed in three different sections within it (Rahn 1996). Thus, section Mesembrynia has 32 species, 20 of which are Australasian (3 from New Zealand, 17 from Australia), and 12 others are from Tonga (1), Amsterdam & St Paul Islands in the Indian Ocean (2), New Guinea (3) and Eurasia (6) (although the inclusion of these six Eurasian species in this section ‘may be incorrect’, K. Rahn, pers. comm., cited in Rønsted et al. 2002: 333). Section Oliganthos has 23 species and is further subdivided into three series, namely series Oliganthos (8 spp., 7 South American and 1 Tasmanian), series Carpophorae (2 Andean spp.) and series Microcalyx (13 spp., 4 each from New Zealand and New Guinea, and 5 from Australia). Only 2 of the 42 species in section Plantago are Australasian (P. aucklandica from the Auckland Islands and P. hedleyi from Lord Howe Island), with the rest of the species from Eurasia, Oceania and the Americas. The remaining two sections Micropsyllium and Virginica (6 and 28 spp., respectively) are largely American sections, and contain no Australasian species.
According to Rahn’s morphological phylogenetic analysis, within a monophyletic subgenus Plantago, sections Micropsyllium, Oliganthos and Virginica were monophyletic, whereas section Mesembrynia was paraphyletic (with sect. Virginica nested within it) and section Plantago was paraphyletic relative to all the other sections (Rahn 1996). None of the sections that comprise Australasian species has a unique synapomorphy. Section Oliganthos was differentiated by few flowers (usually 1–3) which also occurs in subgenera Littorella and Psyllium. Sections Mesembrynia and Virginica are linked by the presence of an apical fifth seed (or at least its upper compartment), although neither section has a synapomorphy. Section Plantago is differentiated by many crowded flowers on the spike, although Rahn (1996) considered this character pleisiomorphic. Rahn (1996) noted that species relationships and infrageneric classification within subgenus Plantago were especially difficult to resolve and uncertain because of a lack of morphological characters, although he did note the likely close affinity of species from the largely southern hemisphere sections Mesembrynia and Oliganthos. With respect to the biogeography of these southern hemisphere species, Rahn (1996) suggested that the current distribution was achieved through vicariance and subsequent extinctions.
A molecular phylogenetic analysis of ITS and trnL-F sequences from 57 Plantago species representing all subgenera and most sections (see Rønsted et al. 2002) tested Rahn’s morphological groups and biogeographic hypotheses. In the study of Rønsted et al., subgenus Plantago was monophyletic (as were three other subgenera as defined by Rahn) although relationships among the 19 species of subgenus Plantago sampled were not well supported. The four species of section Mesembrynia sampled (P. debilis from Australia, P. raoulii and P. spathulata from New Zealand, and P. stauntonii from the Amsterdam & St Paul Islands) formed a highly supported monophyletic group in this clade, whereas the two sampled species from section Oliganthos (P. uniglumis and P. rigida from South America) were not monophyletic and were in unresolved positions near the section Virginica clade. A more recent study using a nuclear-encoding single-copy gene, SUC1 (Ishikawa et al. 2009), sampled 18 of the 19 individuals of subgenus Plantago included in Rønsted et al. (2002), plus four additional species including P. depressa and P. camtschatica, two Asian species of section Mesembrynia. The topology of their phylogeny was similar to that in Rønsted et al. (2002) although with higher resolution and support values (Ishikawa et al. 2009). With respect to biogeography, both Rønsted et al. (2002) and Ishikawa et al. (2009) inferred that the distribution of these southern hemisphere species, and indeed of the genus as a whole, was largely influenced by long-distance dispersal.
Another study included seven different species of Plantago from sections Mesembrynia and Oliganthos in their molecular phylogenetic analyses of ITS sequences of 23 species of Plantago and three species of the closely related genus Littorella (Hoggard et al. 2003). In that study, subgenus Plantago (14 sampled species) was highly supported as monophyletic, although relationships within subgenus Plantago were not well resolved or supported by high bootstrap values. The six Australasian species from sections Mesembrynia (P. tasmanica, P. daltonii, P. euryphylla and P. hispida, all from Australia) and Oliganthos (P. paradoxa, Australia, and P. triandra, New Zealand) formed a monophyletic group within that clade, although the two sections were not monophyletic (Hoggard et al. 2003). In fact, section Mesembrynia was polyphyletic because the Asian species, P. camtschatica, was more closely related to P. sparsiflora from the USA (sect. Plantago) than to the Australian species of section Mesembrynia.
Thus, 14 of 56 species (25%) of sections Mesembrynia and Oliganthos, including only 9 of 32 (28%) of Australasian species of Plantago, have been included in three different molecular phylogenies (two with non-overlapping sampling), and there has been little resolution or support for their evolutionary relationships. We obtained molecular sequence data from 21 Australasian species (including 12 species that had not been included in previous studies) to investigate biogeographic patterns of Plantago within Australasia, with a particular focus on resolving relationships among all the New Zealand species. In increasing taxonomic sampling and adding novel molecular data from all three genomes, we will also make a significant contribution towards the bigger goal of achieving a molecular phylogeny for the southern hemisphere species and indeed all species of the large, worldwide genus Plantago.
Materials and methods
Molecular techniques
Tissue samples were either preserved in silica gel from field collections, or were obtained from existing herbarium specimens. After manual disruption of dried tissue with a pestle and mortar, DNA extractions were performed with either the DNEasy Plant Mini kit (Qiagen, Hilden, Germany) or by a cetyltrimethylammonium bromide (CTAB) protocol modified from Doyle and Doyle (1990).
The use of different markers from several genomes may provide insights into events such as hybridisation, introgression, reticulation and incomplete lineage sorting if these have occurred in the past (Vriesendorp and Bakker 2005). We chose the internal transcribed spacers (ITS) from nuclear rDNA (nrDNA), ndhF–rpl32 spacer from chloroplast DNA (cpDNA) and coxI from mitochondrial DNA (mtDNA) from a primer assay to elucidate the evolutionary history of the Australasian species of Plantago. The mtDNA region is particularly interesting for Plantago because unprecedented elevated rates of mtDNA evolution have been reported in the genus (Cho et al. 2004), whereas the mitochondrial genome is normally characterised by slow rates of evolution in plants (Wolfe et al. 1987).
The primers used to amplify the ITS region (ITS1, 5.8s nrDNA and ITS2), ndhF–rpl32 spacer region, and coxI mitochondrial gene, respectively, were as follows: ITS28CC–CGCCGTTACTAGGGGAATCCTTGTAAG (Wagstaff and Garnock-Jones 1998) and ITS5–GGAAGTAAAAGTCGTAACAAGG (White et al. 1990); ndhF–AAAGGTATKATCCAYGMATATT and rpl32R–AATATCCCTTYYTTTTCCAA from (Shaw et al. 2007); and coxIF4–GGATATCTAGGYATGGTTTATGC and coxIR3–AAGCTGGAGGACTTTGTAC (Cho et al. 2004). PCR amplification was performed by using a final volume of 25 μL of the following: 16.35 μL water, 1× ThermoPol reaction buffer (10 mm KCl, 10 mm (NH4)2SO4, 20 mm TRIS–HCl (pH 8.8), 2 mm MgSO4, 0.1% Triton X-100) (New England BioLabs, Ipswich, MA), 0.4 mg mL–1 BSA, 250 μmol dNTPs, 10 pmol each primer, 0.75 U of Taq DNA polymerase (New England BioLabs), and 0.4 μL DNA template. The amplification was carried out with a thermocycling profile of an initial 2 min at 94°C, followed by 30 cycles of 1 min at 94°C, 1.5 min at 50°C, 1 min at 72°C, and ending with a final extension time of 5 min at 72°C. This PCR protocol was used to successfully amplify regions for all primer pairs. PCR products were visualised on 1.5% agarose gels before being purified with the High Pure PCR Purification Kit (Roche Diagnostics, Manheim, Germany). The purified PCR products were sequenced in both directions with an ABI3730 Genetic Analyzer (Applied Biosystems, Melbourne) by the Allan Wilson Centre Genome Service (Massey University, Palmerston North, New Zealand).
Study group and taxonomic sampling
Plantago samples for the study were collected from wild populations across New Zealand and Australia. Location of samples, along with voucher information and GenBank accession numbers are presented in Table 1. DNA sequences were obtained for all nine native New Zealand species (including the tag-named P. sp. ‘Sylvester’), and 12 of the 24 native Australian species from subgenus Plantago sections Oliganthos (9 spp.), Mesembrynia (11 spp.) and Plantago (1 sp.). Sequences were also obtained for five introduced Plantago species that have established in New Zealand, including two from subgenus Plantago (P. major, section Plantago, and P. australis, section Virginica), two from the sister subgenera of subgenus Plantago (P. coronopus, subgenus Coronopus, and P. lanceolata, subgenus Albicans; Rønsted et al. 2002), and P. sp., an unidentified and possibly newly introduced species in New Zealand. New Zealand species Veronica hookeriana and V. salicornioides (Garnock-Jones et al. 2007) were used as distant outgroups because Veronica is a close relative of Plantago (Rønsted et al. 2002; Cho et al. 2004). This sampling strategy resulted in datasets comprising 36 individuals, representing 27 species of Plantago and two species of Veronica (only 35 individuals were included in the ndhF–rpl32 dataset because V. salicornioides was not able to be sequenced for this marker). All sequences in these datasets have been deposited in GenBank (Table 1). A concatenated dataset of the 35 individuals common to all three datasets was compiled by combining sequences from all three regions.

|
In addition, an expanded ITS dataset was also assembled, comprising 252 sequences, including 239 from Plantago, 10 from Littorella, one from Aragoa and two from Veronica. Of these, 100 sequences were downloaded from GenBank (see Appendix 1), 36 were generated for the previous dataset (Table 1) and 116 were generated for a separate study on evolutionary patterns and species boundaries of the New Zealand Plantago species from multiple individuals and populations of each of the New Zealand species (Tay 2008; M. L. Tay, H. M. Meudt, P. J. Garnock-Jones and P. Ritchie, unpubl. data). After removing identical sequences to improve the efficiency of the analyses, the expanded ITS dataset had 177 sequences. Compilation of this dataset allowed for the first time simultaneous analysis of all the sequences used in Rønsted et al. (2002) and Hoggard et al. (2003), plus our newly generated sequences. This resulted in the best available sampling for phylogenetic analysis of subgenus Plantago (32% of species included in the present study) and sections Mesembrynia and Oliganthos (45%). Specifically, within subgenus Plantago, the following were included: sections Mesembrynia (47%), Oliganthos (42%), Plantago (26%), Micropsyllium (50%) and Virginica (18%).
Dataset alignment and analyses
MEGA ver. 3.1 (Kumar et al. 2004) was used to assemble forward and reverse sequences for a given DNA marker for each individual, and then to align individual sequences with one another. Characteristics of the individual sequence datasets were examined with MEGA ver. 3.1 and DAMBE ver. 4.5.9 (Xia and Xie 2001).
Analyses were performed individually on each of the five datasets (ITS, coxI, ndhF–rpl32, concatenated and expanded ITS). Preliminary analyses of our datasets suggested that gaps are informative and should be included in the dataset. Gaps were coded by a modified complex indel coding (MCIC) method using SeqState ver. 1.32 (Müller 2005) because MCIC has been found to outperform other gap-coding methods (Simmons et al. 2007). The ITS dataset had 26 indel characters, the ndhF–rpl32 region had 36 indel characters, and there were no indels in the coxI dataset. The concatenated dataset included 61 indel characters because an indel was present in the ITS sequence of Veronica salicornioides but the sequence was not included in the concatenated dataset. Ambiguous characters in the datasets were excluded from phylogenetic analyses. The final concatenated dataset comprised 2194 bp (2255 bp when indel characters were included as coded characters). The expanded ITS dataset comprised 656 bp (733 bp when indel characters were included as coded characters).
The substitution model for each dataset was selected with Modeltest ver. 3.7 (Posada and Crandall 1998), using the Akaike information weights criterion (AIC) because it has advantages over the hierarchical likelihood ratio test (Posada and Buckley 2004). Maximum parsimony (MP) and maximum likelihood (ML) analyses were conducted on all datasets (ML analyses were not conducted for the expanded ITS dataset) using PAUP* ver. 4.0b10 (Swofford 2002). Heuristic searches were conducted under an MP criterion by using 10 000 replicates of random sequence addition and tree-bisection–reconnection (TBR) branch swapping, with a maximum of 10 000 trees. For ML analyses, 100 replicates of random sequence addition and TBR branch swapping were implemented. Non-parametric bootstrap support was assessed with 200 replicates for all of the analyses, with random sequence addition and TBR branch swapping (or subtree pruning and regrafting, SPR, for the expanded ITS dataset only).
Heuristic searches were conducted on all five datasets with MrBayes ver. 3.1.1 (Huelsenbeck and Ronquist 2001), with each dataset analysed initially with four chains and 500 000 generations (1 000 000 for the expanded ITS dataset). Additional generations were added as needed, to reach a standard deviation of split frequencies of <0.01, which ensures that the runs have converged on a stationary distribution. For the concatenated dataset, two separate analyses were conducted to check the suitability of the models applied to data with potentially very different evolutionary patterns. First, one model was used across the whole dataset, and then a partitioned dataset was used such that separate models were used for each dataset as recommended by Modeltest. For each run, 25% of the trees were excluded as burn-in.
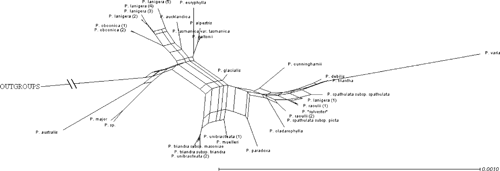
Topological congruence was examined first by visually comparing trees generated from the ITS, coxI and ndhF–rpl32 datasets for each analysis. A partition–homogeneity (ILD) test was also run in PAUP* (1000 replicates, TBR branch swapping, 100 random replicates of random taxa addition, and maximum of 10 000 trees) for all combinations of datasets. Additionally, a supertree network approach (McBreen and Lockhart 2006) was used to identify the strongest phylogenetic signal within each of the individual datasets. Supertree networks were constructed from ML trees from the three datasets with SplitsTree ver. 4.8 (Huson and Bryant 2006).
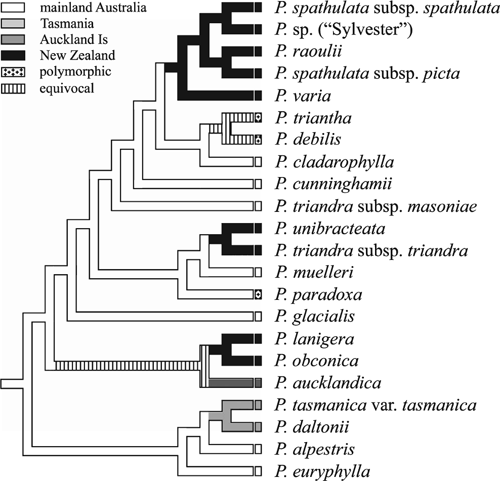
Characters such as geographic distributions, ploidy levels and key features of the sections of subgenus Plantago were mapped onto the concatenated tree (Fig. 2) with MacClade ver. 4.08 (Maddison and Maddison 2005), to investigate evolutionary patterns and taxonomic significance. For geographic distributions, we used the following four areas: mainland Australia (we did not attempt a finer resolution into biogeographic areas within this region because our sample did not include all the species present and because our question of interest was dispersal to New Zealand), Tasmania, Auckland Islands and New Zealand.
|
Molecular dating
An ITS dataset consisting of 38 individuals, including representatives from each Plantago and Veronica species collected for the present study and several species each of Aragoa and Littorella obtained from GenBank, was used to date nodes for the Australasian species (see Appendix 2). ITS sequences were used only because ITS sequences (but not the other markers) for Littorella and Aragoa are readily available on GenBank. A likelihood ratio test showed that the ITS sequences did not evolve in a clock-like manner (Felsenstein 1981); thus, BEAST ver. 1.4.6 (Drummond and Rambaut 2007) was used to implement a relaxed-clock model (Drummond et al. 2006) to estimate divergence times for the lineages in the dataset. Monophyletic groups with high support in the ML tree were set up as groups for dating nodes with BEAUti ver. 1.4.6 (Drummond and Rambaut 2007).
Analyses in BEAST were conducted with 10 000 000–20 000 000 runs, until estimated sample sizes (ESS) for each parameter were large enough. A GTR + I + G model was implemented in all cases as recommended by Modeltest. TRACER ver. 1.4 (Drummond and Rambaut 2007) was used to analyse results. Visual comparison of the trees reconstructed by BEAST showed identical topology of the ITS tree reconstructed by using ML analysis in all cases.
To obtain estimates for the divergence dates of Australasian species, two different (secondary) calibration points were used. First, the dates 5.47 million years ago for the radiation of the Plantago–Littorella group and 7.1 million years ago since the divergence of this group and Aragoa (see Rønsted et al. 2002) were used. These dates had been estimated previously by using a non-parametric rate smoothing approach on an ITS molecular phylogeny calibrated with the age of New Amsterdam, an oceanic island that arose 0.5–0.7 million years ago and to which P. stauntonii subsequently dispersed (Rønsted et al. 2002). (Although a more direct dating approach would be ideal, unfortunately we were unable to directly calibrate the tree based on this particular node as the placement of P. stauntonii was not resolved in our ITS phylogeny.)
Second, we used the date estimate of 2.766 (±0.08) million years ago for the split of the Plantago–Littorella group from Aragoa. We estimated this date by downloading the dataset used by Rønsted et al. (2002) and running BEAST with their tree calibrated to the age of New Amsterdam for P. stauntonii. It is important to note that the non-parametric rate smoothing method used to estimate rates of evolution in Rønsted et al. (2002) may produce results different from those with BEAST analyses, and indeed this is the case here for the age of the Plantago–Littorella and Aragoa split (7.1 million years ago v. 2.8 million years ago). Thus, we re-ran the BEAST analysis on our dataset with this newly estimated divergence date (2.766 (±0.08) million years ago) and compared the date of divergence recovered for Australasian Plantago to those estimated previously.
Results
Dataset statistics
Inspection of the three datasets revealed that the ndhF–rpl32 dataset had more variable sites than did the ITS and coxI datasets, and a lower percentage of parsimony-informative sites than did the ITS dataset (see Table 2 for a summary of statistics for all datasets). All individuals sequenced had unique ITS (n = 36) and ndhF–rpl32 (n = 35) sequences, whereas only 15 of 36 individuals had unique sequences for coxI. Some Australian species had coxI sequences identical to those of some New Zealand species (P. muelleri was identical to P. triandra and P. unibracteata; P. debilis and P. triantha were identical to P. raoulii and P. spathulata subsp. picta; and P. euryphylla and P. glacialis were identical to P. lanigera, P. novae-zelandiae, P. obconica and P. aucklandica). Chi-square tests of all base frequencies showed a significant base heterogeneity for only the ndhF–rpl32 dataset and among variable sites for the coxI dataset. In the ITS dataset, some sequences had a few ambiguous sites that may have resulted from multiple copies of the rDNA array in the genome.

|
Partition-homogeneity (ILD) tests indicated that the datasets were not congruent for ITS + ndhF–rpl32 + coxI (P-value = 0.001), ITS + coxI (P = 0.002), ITS + ndhF–rpl32 (P = 0.001) and ndhF–rpl32 + coxI (P = 0.016). Out of these, the organellar DNA datasets (ndhF–rpl32 and coxI) showed the least conflict. Visual analysis of the topology and the SplitsTree graph (refer to Appendix 3) indicated that four species (Plantago muelleri, P. paradoxa, P. triandra and P. unibracteata) were providing conflicting signals among the regions. This may be the cause of the low P-values of the ILD test. However, we found that the three datasets were still significantly incongruent when ILD tests were run excluding these four species. Although traditionally used to check congruence of phylogenies from different regions, the ILD test has been shown to be highly inaccurate even when the topologies of trees are congruent (Reeves et al. 2001; Yoder et al. 2001) and may continue to indicate conflict even after the incongruent sequences are removed (Manos et al. 1999). Thus, analyses were carried out using the concatenated dataset because the individual tree topologies were not vastly different, there were no highly supported clades that were incongruent with each other, and there was low support for the placement of the conflicting species in the ITS and coxI trees.
Phylogenetic analyses
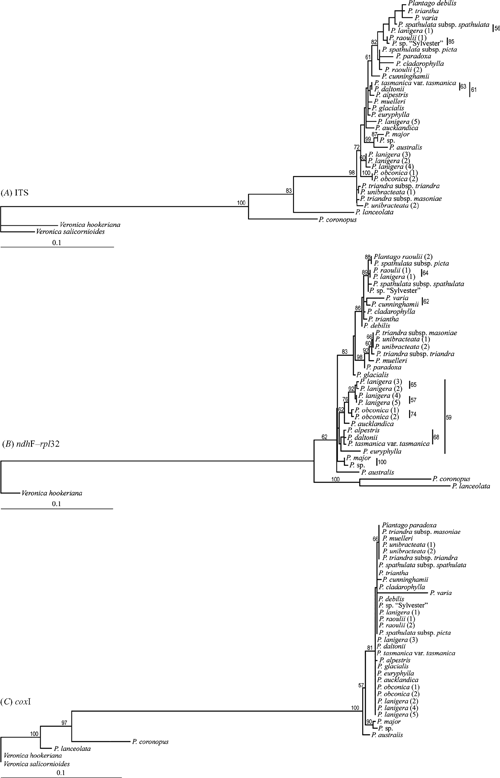
Topologies of trees reconstructed by using different tree-construction methods were very similar for each of the datasets. Additionally, using one model v. individual models for each molecular marker in MrBayes resulted in trees with similar topology (data not shown). The posterior probabilities (PP) for trees reconstructed using a Bayesian inference of phylogeny were found to be similar to bootstrap (BP) support values obtained with ML, and higher than those obtained with MP. Trees reconstructed with ML are presented here for the concatenated dataset (Fig. 2) and the individual ITS, coxI and ndhF–rpl32 datasets (Fig. 3), and a Bayesian 50% majority rule tree is presented for the expanded ITS dataset (Fig. 4). Support values <50% were considered low support and are not shown in the figures. Support values are considered high if they are >70% for the MP and ML bootstrap analyses, and >95% for MrBayes analyses.
|
|
Concatenated dataset
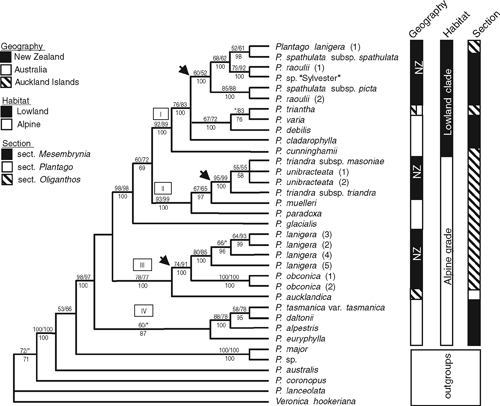
Multiple clades were resolved with good support in the trees reconstructed from the concatenated dataset (Fig. 2). The Australasian species form a highly supported clade (98/97/100 MP BP/ML BP/Bayesian PP support values), comprising four highly supported monophyletic groups.
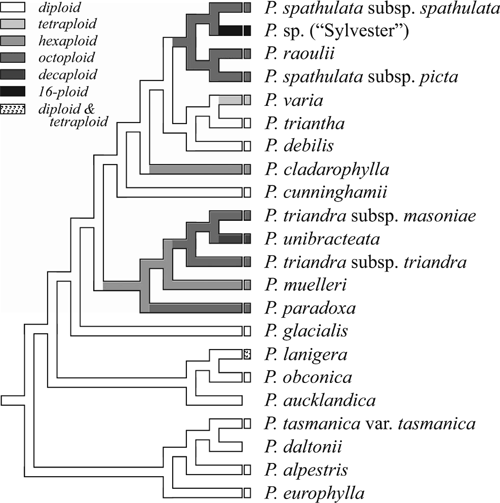
Clade IV (60/<50/87) comprises four Australian species from section Mesembrynia and is sister to the rest of the clades. Clade III (78/77/100) comprises two New Zealand species from section Oliganthos series Microcalyx (P. lanigera and P. obconica), which together are sister to P. aucklandica (section Plantago) from the Auckland Islands. This clade is sister to the rest of the Australasian species. Australian species P. glacialis (section Oliganthos series Microcalyx) is sister to Clades I and II (99/98/100). Clade I (92/89/100) comprises New Zealand and Australian species from section Mesembrynia plus P. triantha (section Oliganthos series Oliganthos), whereas Clade II (93/99/100) comprises solely New Zealand and Australian species from section Oliganthos series Microcalyx. Clades I and II each contain a grade of Australian species at the base of a New Zealand clade. In addition, Clade I is a group of Australasian Plantago found in lowland areas, whereas Clades II, III and IV, along with P. glacialis, are found in alpine and subalpine areas.
Sequences from multiple individuals of Plantago raoulii and P. lanigera, and of subspecies of P. spathulata and P. triandra, do not form monophyletic groups matching the circumscriptions of those species (Fig. 2). This is being investigated in a separate study focusing on taxonomic issues and relationships of individuals of New Zealand species at the population level (M. L. Tay, H. M. Meudt, P. J. Garnock-Jones and P. Ritchie, unpubl. data). The supernetwork constructed using SplitsTree has a topology similar to the concatenated tree (see Appendix 3), with the same four distinct groups visible, and some uncertainties regarding the placement of the species within Clade II, which was expected owing to conflict between the phylogenetic trees reconstructed from the three datasets.
Individual datasets
Overall, the individual ML trees and the concatenated ML tree revealed similar species groupings. However, some differences were evident and are noted below. The placement of close outgroups in the ITS ML tree (Fig. 3A) differs from the concatenated tree (Plantago lanceolata and P. coronopus have switched positions). P. major, P. sp. and P. australis form a clade that is nested within the Australasian species, as opposed to forming a grade at the base of the Australasian clade in the concatenated phylogeny. The ingroup clades are similar except that P. muelleri and P. paradoxa do not form a clade with P. unibracteata and P. triandra. Instead, P. unibracteata and P. triandra are placed at the base of the tree, whereas P. muelleri and P. paradoxa are placed as sister species to other Australian species further up in the tree. Furthermore, P. debilis, P. varia and P. triantha form a clade with P. spathulata subspecies spathulata. The placements of P. muelleri, P. paradoxa, P. debilis and P. varia in the ITS tree are incongruent with the concatenated tree and both organellar DNA trees.
The close outgroups (P. lanceolata and P. coronopus) are sister species in the ndhF–rpl32 ML tree (Fig. 3B). This differs from the ITS, coxI and concatenated ML trees. It is worth noting that the topology of the trees reconstructed using the concatenated dataset most closely resembled that of the ndhF–rpl32 trees. This is likely to be because there is more phylogenetic signal in the ndhF–rpl32 dataset.
There was very little resolution in the ML analysis of the coxI dataset (Fig. 3C), with only two Australasian nodes resolved and only one with good bootstrap support (81 BP). Interestingly, this moderately supported clade (P. paradoxa, P. triandra, P. muelleri and P. unibracteata) is also present in the ndhF–rpl32 dataset and in the concatenated dataset, and is the clade that causes conflict between the ITS tree and the organellar DNA trees. The other nodes within the Australasian groups are poorly resolved and may suggest either a recent separation of Australian and New Zealand taxa, or the unsuitability of this marker for reconstructing the phylogeny of this group of plants. Finally, a peculiar pattern found in the coxI ML tree is a long branch separating the ingroup Plantago species from the outgroup Plantago species and an unexpectedly short branch length between Plantago as a whole and the Veronica outgroup. In contrast, the ITS and ndhF–rpl32 datasets have short branches between the ingroup species and a long branch between Plantago as a whole and Veronica. There is also a long branch leading to P. varia in the coxI tree that is not evident in the other two phylogenies.
Expanded ITS dataset
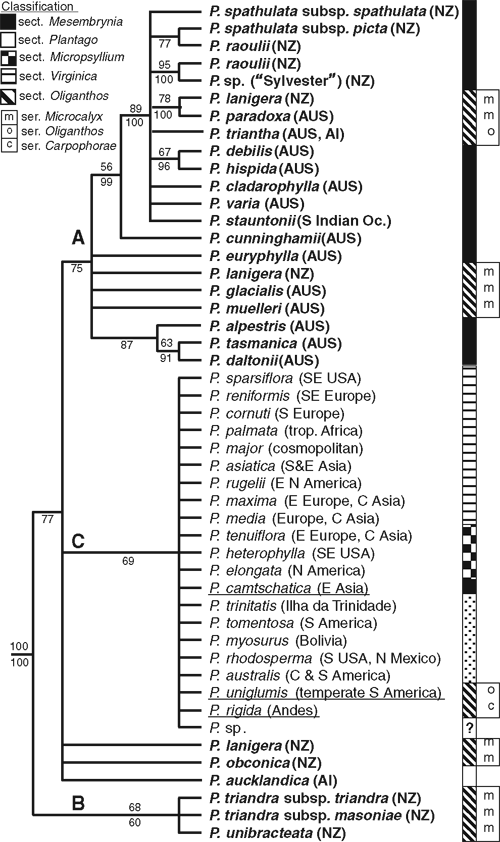
A simplified tree showing the main topological features of the Bayesian 50% majority rule consensus tree of the expanded ITS dataset is shown in Fig. 4, with MP bootstrap support values and posterior probabilities (the tree in its entirety can be found in Appendix 2 (O) of Tay, 2008). Subgenus Plantago was monophyletic with high support (98/100 MP BP/Bayesian PP support values) and can be further subdivided into three clades that were not highly supported, and, interestingly, do not correspond to sections as currently circumscribed. The relationships of these clades relative to one another, and of species within each clade, were not well resolved. Clade A (<50/75) comprised species of sections Mesembrynia and Oliganthos, including most of the Australasian species from Clades I, II and IV in the concatenated ML tree (Fig. 2) (plus P. stauntonii). Clade B (51/60) contained P. triandra and P. unibracteata (which were also part of Clade II in the concatenated ML tree). The three remaining Australasian species (P. obconica, P. lanigera and P. aucklandica), which comprised Clade III from the concatenated ML tree, were unresolved within subgenus Plantago. Finally, Clade C (<50/69) comprised a mixture of species from sections Plantago, Virginica, Micropsyllium, as well as the two sampled South American species of section Oliganthos (P. uniglumis and P. rigida) and one Asian species of section Mesembrynia (P. camtschatica).
Molecular dating
Monophyletic groups with strong support were used to derive dates for molecular dating. These were (1) a clade containing all of the Plantago, Littorella and Aragoa species, (2) a clade of all the Plantago and Littorella species, (3) a clade with all ingroup Plantago but excluding P. coronopus and P. lanceolata, and (4) Clade I from the ML concatenated tree, excluding P. cunninghamii. Molecular dating of the ITS dataset with BEAST, using dates previously estimated by Rønsted et al. (2002) provided a date of 2.291 (±0.0039) million years ago for the divergence of the clade comprising the Australasian Plantago species, P. major, and P. sp., whereas the node of Clade I (excluding P. cunninghamii) was dated to 1.520 (±0.030) million years ago. Re-estimating rates with BEAST instead of rate smoothing (as in Rønsted et al. 2002) provided an estimate of 0.943 (±0.02) million years ago for the divergence of the clade with all Australasian Plantago, P. major and P. sp. and 0.5 million years ago (±0.01) for the node of Clade I (excluding P. cunninghamii). These analyses thus provide a range of possible dates of origin for the Australasian species.
Discussion
The aim of the present study was to investigate biogeographic patterns and species relationships for the Australasian species of Plantago. The concatenated dataset of regions from the three genomes used in the study was able to resolve most of the relationships among the Australasian species, and will be discussed further below together with the findings of the expanded ITS dataset.
Biogeography of Australasian Plantago
Evidence for multiple trans-Tasman dispersals was found. In the concatenated tree (Figs 2, 6), three New Zealand clades are nested within the Australasian group, and the nodes of the New Zealand clades are placed in a more recently derived position than are the nodes of the Australian species. This pattern suggests at least three independent long-distance dispersal events to New Zealand, each of which has given rise to a small species radiation there. On the basis of the current sampling, all three dispersals appear to be from Australia to New Zealand. Two additional dispersals involving the Auckland Islands’ species are likely. First, the location of the ancestor of P. aucklandica is equivocal in Fig. 6 (P. aucklandica and the P. lanigera/obconica clade share a common ancestor that originated in Australia; however, the following three explanations, each requiring two dispersals, are possible: Australia–New Zealand–Auckland Is; Australia–Auckland Is–New Zealand; or Australia–Auckland Is and Australia–New Zealand). Second, it seems likely that P. triantha dispersed to the Auckland Islands from Tasmania. Such west–east dispersal is congruent with expectations because of prevailing westerly winds (west wind drift; Raven 1973; Winkworth et al. 2002b; Sanmartín et al. 2007). Although material of South American, Pacific and Asian species of sections Oliganthos and Mesembrynia was unavailable for the current study, the expanded ITS analysis (Fig. 4) included P. uniglumis (AY101875, section Oliganthos, South America), P. rigida (AY101876, AF313037; section Oliganthos, South America) and P. camtschatica (AJ548971; section Mesembrynia, Asia). These three species were more closely related to species from section Plantago, Virginica and Micropsyllium than to the Australasian species from sections Mesembrynia and Oliganthos (albeit with PP support values <95%). The topology of Ishikawa et al. (2009) also agrees with this result. Although sampling of additional DNA markers and species of subgenus Plantago –particularly from southern hemisphere sections Oliganthos and Mesembrynia – is needed to confirm the origin and direction of these dispersal events, the present results are nevertheless unambiguous in supporting multiple dispersals of Plantago into New Zealand.
The finding of multiple dispersals across the Tasman Sea differs from the common pattern of a single dispersal event followed by rapid radiation that is found in many other New Zealand plant genera (Wagstaff and Garnock-Jones 1998; Winkworth et al. 1999; Perrie et al. 2003; Albach et al. 2005; Meudt and Simpson 2006). If the inference of dispersal from Australia to New Zealand is correct, the three dispersal events reflect two independent dispersals to the alpine and/or subalpine region in New Zealand (including the subantarctic islands) and one to the lowlands, where in each case the closest Australian relative is also from similar habitats. One explanation for this pattern is that the New Zealand species may have evolved from a common ancestor that had already established in that bioclimatic zone (i.e. alpine to alpine, lowland to lowland), which may have increased the success of establishment in New Zealand. Such ‘biome conservatism’ has been recently shown to be very common in southern hemisphere plants, particularly those dispersing from Australia to New Zealand (Crisp et al. 2009). The lowland Australasian species form a clade that is nested within an alpine clade, which suggests that following arrival in Australasia, alpine Plantago groups have subsequently dispersed to lowland and coastal regions (Fig. 2).
The unusual finding of multiple dispersals in Australasian Plantago fits in with the evolutionary history of the genus. The fact that there are many cosmopolitan species in Plantago, and that even small oceanic islands have a mixture of native and introduced species from the genus indicates that the plants are capable of dispersal over long distances and establishment. Within the Australasian taxa, species are commonly distributed across geographic barriers that often separate other biota, such as the Cook Strait in New Zealand, which separates the North and South Islands, and Bass Strait, which separates Tasmania from Australia. Although dispersal has been postulated for many species of Plantago (Rønsted et al. 2002; Dunbar-Co et al. 2008), the dispersal mechanisms of the Australasian species are largely unknown. It has been hypothesised that the seeds, which exude adhesive mucilage in many Plantago species when wetted, could be dispersed by sticking to a vector such as oceanic birds (Rønsted et al. 2002). We have noted extremely powerful adhesive exudates for the wetted seeds of several New Zealand species of Plantago (P. J. Garnock-Jones, pers. obs.). Other Plantago species, such as P. lagopus, have hairs on their capsules, which have been shown to facilitate overland dispersal by sticking to the coat of migrating ungulates (Manzano and Malo 2006).
There was a noticeable lack of sequence divergence between the Australian and New Zealand species, as has been found in previous studies (Rønsted et al. 2002; Hoggard et al. 2003). This is especially evident in analysis of the coxI dataset, where several Australian and New Zealand species even share identical sequences, suggesting recent diversification of the Australasian species. Molecular dating suggests that the timing of arrival and diversification of the New Zealand species (estimated here to be between 2.291 (±0.0039) and 0.5 (±0.01) million years ago) coincides with the geological dates of the uplift of the New Zealand mountains during the last 5 million years (Winkworth et al. 2002a).
Polyploid evolution
Chromosome numbers are diverse in Plantago and have an assumed base chromosome number of x = 6 (although x = 4 and x = 5 are also present in the genus; Briggs 1973; Rahn 1996). Australasian Plantago are a prime example of this diversity, with six levels of ploidy recorded (2n = 12, 24, 36, 48, 60 and 96; Groves and Hair 1971; Briggs 1973; Dawson 1989). Within Australasia, the alpine grade is mostly diploid, although hexa-, octo- and decaploids occur in Clade II (Fig. 5). Most species of the lowland clade are polyploids, including tetra-, hexa-, octo- and 16-ploids, although diploidy is presumed ancestral in the clade (Fig. 5). Thus, polyploid series appear to have evolved at least four times in Australasian Plantago. Interestingly, polyploidy does not appear to have played a major role in the evolutionary history outside of subgenus Plantago, so its importance within sections Oliganthos and Mesembrynia from the southern hemisphere (Rahn 1984) is of great interest. Ishikawa et al. (2009) were able to show that, of the species they sampled within subgenus Plantago, one is of autopolyploid origin and 10 are of allopolyploid origin, including P. spathulata and P. raoulii. We are currently counting chromosomes to resolve several variable and unknown species in New Zealand (B. Murray, H. M. Meudt, P. J. Garnock-Jones and M. L. Tay, unpubl. data), and further studies to determine the nature of the New Zealand polyploids are also planned (B. Murray, pers. comm.).
|
|
Taxonomic implications
The phylogeny reconstructed from the concatenated dataset revealed that within subgenus Plantago, sections Plantago, Mesembrynia and Oliganthos, and series Microcalyx are probably not monophyletic (Fig. 2). Our highly supported phylogeny builds on results from previous studies (Rønsted et al. 2002; Hoggard et al. 2003) to refute the morphological sectional classifications within subgenus Plantago (Rahn 1996). This was accomplished by significantly increasing sampling within sections Mesembrynia (12/32 sampled) and Oliganthos (9/24, including 7 individuals from series Microcalyx that are included for the first time) and improving resolution and support values on the tree via the use of three different DNA markers from all three genomes.
Flower number was an important character in Rahn’s (1996) sectional classification within subgenus Plantago, in which section Oliganthos was distinguished by its few-flowered inflorescences, whereas section Plantago has many crowded flowers (Rahn 1996). Our results showed that a reduction in the flower number is likely to have evolved on several occasions and is thus the result of convergence (see species labelled section Oliganthos in Fig. 2). In addition, Rahn (1996) observed that although New Zealand members of section Mesembrynia sometimes can have a reduced number of flowers (not shown in Fig. 2), the flowers are densely crowded, unlike in section Oliganthos. This character incongruence also indicates the homoplastic nature of these floral characters. The presence of an apical third compartment in the fruit, which was thought to be synapomorphic for sections Mesembrynia + Virginica, also appears to have evolved multiple times within the subgenus (see species labelled section Mesembrynia in Fig. 2) and elsewhere in the genus. Thus, none of the morphological characters used to define these sections appears to be useful from a taxonomic point of view. However, while we recommend rejection of the current sectional classification within subgenus Plantago (Rahn 1996), we do not propose a replacement system here. A much more detailed molecular phylogenetic study of subgenus Plantago, including many more of its 133 species and additional DNA markers, is warranted.
For the New Zealand species, many of which had not been sequenced before the present study, some discrepancies between current taxonomic classifications and the reconstructed phylogeny, and other interesting species relationships, deserve mention here. First, the two subspecies of P. spathulata do not form a monophyletic group. Sykes (1988) noted that the main difference between the two is a persistent taproot in subsp. picta, although they may also be differentiated by hairs either on the keels or margins of bracts and sepals (Moore 1961). Additional samples of both subspecies should be sequenced and added to the phylogeny to determine whether subsp. picta should be recognised at species rank, as it was originally described. Second, P. obconica is placed next to P. lanigera in the phylogeny, and does not appear to be closely related to P. triandra as hypothesised by Sykes (1988) when he described the species. This grouping is evident in all three sequenced regions, thus providing strong support for the relationship. Third, the undescribed polyploid P. sp. ‘Sylvester’ appears to be closely related to P. raoulii, with which it may share many morphological similarities (M. L. Tay, H. M. Meudt and P. J. Garnock-Jones, pers. obs.); however, sequences from more samples are needed to determine placement of this species within the phylogeny. Finally, in the present study, we could not differentiate between P. lanigera and P. novae-zelandiae as described by Sykes (1988) and Spence and Sykes (1989) by using either morphological characters or molecular data, and hence we have identified the five individuals sampled in the present study as P. lanigera. Because of character similarities, and the fact that these two entities have highly overlapping distributions and comprise both diploid and tetraploid individuals (Spence and Sykes 1989), we are conducting further studies to delimit species in this complex.
Incongruence of phylogenies from nuclear DNA and organellar DNA
In the present study, trees reconstructed using regions from the three different genomes yielded similar topologies, although there were a few discrepancies. The Australian species P. muelleri and P. paradoxa, and the New Zealand species P. triandra and P. unibracteata appear to have conflicting evolutionary histories of nuclear and organellar genomes. The four species form a clade in the ndhF–rpl32 tree and the tree of the concatenated dataset, whereas they are interspersed among other Australasian species in the ITS tree. One explanation for this conflict may be hybridisation, which is not surprising because the group is relatively young. Hybridisation is not uncommon in Plantago (Dunbar-Co et al. 2008), although we consider it unlikely to occur across the Tasman Sea which separates these Australian and New Zealand species. Other processes such as incomplete lineage sorting cannot be discounted. However, additional analyses using our expanded ITS dataset (M. L. Tay, H. M. Meudt, P. J. Garnock-Jones and P. Ritchie, unpubl. data) suggested that the lack of resolution in phylogenetic analyses of this region, which do not resolve the placement of P. triandra and P. unibracteata, may be the most likely explanation for the conflict. Sequencing of additional nuclear regions may be able to further separate patterns formed from incomplete lineage sorting from reticulate evolution (e.g. Morgan-Richards et al. 2009).
Elevated substitution rates of mtDNA in Australasian Plantago?
The elevated rates of mtDNA substitutions in Plantago that were reported by Cho et al. (2004) are not evident within the Australasian clade. There was a long branch between the close Plantago outgroups and the ingroup Plantago, with a short branch between Plantago and Veronica in the coxI marker (Fig. 3). The opposite was found in the ITS and ndhF–rpl32 phylogenies. Branch lengths are very short within the clades containing the Australasian species for all three regions, with the sole exception of a long branch leading to Plantago varia in the coxI tree. This finding of long branch lengths between the close Plantago outgroups and the ingroup clade may be a result of recent rapid radiations, a process common in endemic New Zealand groups (Wagstaff and Garnock-Jones 1998; Heenan et al. 2002; Murray et al. 2004); or an increased substitution rate in coxI along the stem of the Australasian clade that has subsequently decreased within the Australasian clade. Elevated rates of mtDNA evolution have been previously reported in some lineages of Plantago (Cho et al. 2004), and offer a more plausible explanation for this finding than an unusually rapid radiation, because there is no evidence of reciprocal lowered substitution rates in ITS or ndhF–rpl32 sequences in the Australasian species as would be expected for such a radiation. P. varia seems to represent a reversal to rapid coxI substitution rates in an Australasian species, and deserves further investigation.
Conclusions
In summary, the present study has shown evidence for an uncommon pattern of at least three independent long-distance dispersal events of Plantago to New Zealand, which, on the basis of current sampling, are hypothesised to have originated in Australia. In all cases, the ancestors of these species in New Zealand appear to have dispersed to habitats similar to those their relatives occupy in Australia. We speculate that multiple dispersals might have been facilitated by sticky seed exudates. By using molecular dating, the node of the Australasian clade was estimated to be between 2.291 and 0.5 million years ago, coinciding with the uplift of the mountain ranges in New Zealand. Following establishment in Australasia, the alpine species appear to have subsequently shifted to lowland habitats. The phylogeny was also able to provide insights into species relationships, highlighting the need for taxonomic revisions in several cases.
While we have obtained sequences for most of the Australasian species, sequences for the remaining Australian species, and in particular others from South America and New Guinea, will be invaluable for elucidating a more complete picture of the biogeography of Plantago in the southern hemisphere. Additional nuclear regions (e.g. SUC1, Ishikawa et al. 2009) may help further resolve the phylogeny and determine whether the incongruence found in the present study could be explained by hybridisation or other processes such as incomplete lineage sorting. Further, sequencing of the coxI region from other Plantago species would verify whether the high rate of mtDNA evolution has slowed down in other lineages that are outside of Australasia. Last, we have shown that several taxonomic revisions are needed at the level of species in New Zealand as well as at section and subgenus levels in the genus as a whole. Integration of molecular data with the large morphological dataset from Rahn (1996) will be a powerful tool in investigating species relationships, especially those among closely related species with short branch lengths (e.g. Hardy et al. 2008).
Acknowledgements
The authors thank Lara Shepherd, Vincent Woo and Stephanie Greaves at the Victoria University Molecular Ecology Laboratory, and Lesley Milicich for technical support. We also thank Barbara Briggs, Lara Shepherd, Leon Perrie, Bill Malcolm, Nancy Malcolm, Kerry Ford, Colin Ogle, Peter Heenan, Peter Lockhart, Barry Sneddon, Mike Thorsen, Peter Beveridge, Rodney Lewington, Ines Schönberger and Rewi Elliot for help with sample collection; and Barbara Briggs (National Herbarium of New South Wales) and Allan Herbarium (CHR), Landcare Research, Lincoln, Canterbury, for supplying information about morphology and geographic distributions of Plantago during the course of this research. For financial support, we acknowledge the following: the Morton family (the Alison Morton Postgraduate Scholarship for Ecology and Marine Biology), New Zealand Foundation for Research Science and Technology through the Defining New Zealand’s Land Biota OBI, the Wellington Botanical Society, and Victoria University of Wellington (the VUW Post Graduate Scholarship for Masters Study, VUW Small Grants Scheme).
Albach DC,
Utteridge T, Wagstaff SJ
(2005) Origin of Veroniceae (Plantaginaceae, formerly Scrophulariaceae) on New Guinea. Systematic Botany 30, 412–423.
| Crossref | GoogleScholarGoogle Scholar |

Breitwieser I,
Glenny D,
Thorne A, Wagstaff SJ
(1999) Phylogenetic relationships in Australasian Gnaphalieae (Compositae) inferred from ITS sequences. New Zealand Journal of Botany 37, 399–412.
Briggs BG
(1973) Chromosomal studies on Plantago in Australia. Contributions from the NSW National Herbarium 4, 399–405.
Cho Y,
Mower JP,
Qiu YL, Palmer JD
(2004) Mitochondrial substitution rates are extraordinarily elevated and variable in a genus of flowering plants. Proceedings of the National Academy of Sciences, USA 101, 17741–17746.
| Crossref | GoogleScholarGoogle Scholar |
CAS |
Cooper A, Cooper RA
(1995) The Oligocene bottleneck and New-Zealand biota: genetic record of a past environmental crisis. Proceedings of the Royal Society of London. Series B. Biological Sciences 261, 293–302.
| Crossref | GoogleScholarGoogle Scholar |
CAS |
Crisp MD,
Arroyo MTK,
Cook LG,
Gandolfo MA,
Jordan GJ,
McGlone MS,
Weston PH,
Westoby M,
Wilf P, Linder HP
(2009) Phylogenetic biome conservatism on a global scale. Nature 458, 754–756.
| Crossref | GoogleScholarGoogle Scholar |
CAS |
PubMed |
Dawson MI
(1989) Contributions to a chromosome atlas of the New Zealand flora – 30 miscellaneous species. New Zealand Journal of Botany 27, 163–165.
Doyle JJ, Doyle JD
(1990) Isolation of plant DNA from fresh tissue. Focus 12, 13–15.
Drummond AJ, Rambaut A
(2007) BEAST: Bayesian evolutionary analysis by sampling trees. BMC Evolutionary Biology 7, 214.
| Crossref | GoogleScholarGoogle Scholar | PubMed |
Drummond AJ,
Ho SYW,
Phillips MJ, Rambaut A
(2006) Relaxed phylogenetics and dating with confidence. PLoS Biology 4, 699–710.
| Crossref | GoogleScholarGoogle Scholar |
CAS |
Dunbar-Co S,
Wieczorek AM, Morden CW
(2008) Molecular phylogeny and adaptive radiation of the endemic Hawaiian Plantago species (Plantaginaceae). American Journal of Botany 95, 1177–1188.
| Crossref | GoogleScholarGoogle Scholar |
CAS |
Felsenstein J
(1981) Evolutionary trees from DNA-sequences – a maximum-likelihood approach. Journal of Molecular Evolution 17, 368–376.
| Crossref | GoogleScholarGoogle Scholar |
CAS |
PubMed |
Ford KA,
Ward JM,
Smissen RD,
Wagstaff SJ, Breitwieser I
(2007) Phylogeny and biogeography of Craspedia (Asteraceae: Gnaphalieae) based on ITS, ETS and psbA–trnH sequence data. Taxon 56, 783–794.
Garnock-Jones PJ,
Albach DC, Briggs BG
(2007) Botanical names in southern hemisphere Veronica (Plantaginaceae): sect. Detneria, sect. Hebe, and sect. Labiatoides. Taxon 56, 571–582.
Groves BE, Hair JB
(1971) Contributions to a chromosome atlas of the New Zealand flora – 15 miscellaneous families. New Zealand Journal of Botany 9, 569–575.
Hardy CR,
Moline P, Linder HP
(2008) A phylogeny for the African Restionaceae and new perspectives on morphology’s role in generating complete species phylogenies for large clades. International Journal of Plant Sciences 169, 377–390.
| Crossref | GoogleScholarGoogle Scholar |
Heenan PB,
Mitchell AD, Koch M
(2002) Molecular systematics of the New Zealand Pachycladon (Brassicaceae) complex: generic circumscription and relationship to Arabidopsis sens. lat. and Arabis sens. lat. New Zealand Journal of Botany 40, 543–562.
Hoggard RK,
Kores PJ,
Molvray M,
Hoggard GD, Broughton DA
(2003) Molecular systematics and biogeography of the amphibious genus Littorella (Plantaginaceae). American Journal of Botany 90, 429–435.
| Crossref | GoogleScholarGoogle Scholar |
Huelsenbeck JP, Ronquist F
(2001) MRBAYES: Bayesian inference of phylogenetic trees. Bioinformatics 17, 754–755.
| Crossref | GoogleScholarGoogle Scholar |
CAS |
PubMed |
Huson DH, Bryant D
(2006) Application of phylogenetic networks in evolutionary studies. Molecular Biology and Evolution 23, 254–267.
| Crossref | GoogleScholarGoogle Scholar |
CAS |
PubMed |
Ishikawa N,
Yokoyama J, Tsukaya H
(2009) Molecular evidence of reticulate evolution in the subgenus Plantago (Plantaginaceae). American Journal of Botany 96, 1627–1635.
| Crossref | GoogleScholarGoogle Scholar |
CAS |
Knapp M,
Stöckler K,
Havell D,
Delsuc F,
Sebastiani F, Lockhart PJ
(2005) Relaxed molecular clock provides evidence for long-distance dispersal of Nothofagus (southern beech). PLoS Biology 3, 38–43.
| Crossref | GoogleScholarGoogle Scholar |
CAS |
Knapp M,
Mudaliar R,
Havell D,
Wagstaff SJ, Lockhart PJ
(2007) The drowning of New Zealand and the problem of Agathis. Systematic Biology 56, 862–870.
| Crossref | GoogleScholarGoogle Scholar | PubMed |
Kumar S,
Tamura K, Nei M
(2004) MEGA3: Integrated software for molecular evolutionary genetics analysis and sequence alignment. Briefings in Bioinformatics 5, 150–163.
| Crossref | GoogleScholarGoogle Scholar |
CAS |
PubMed |
Lockhart PJ,
McLenachan PA,
Havell D,
Glenny D,
Huson D, Jensen U
(2001) Phylogeny, radiation, and transoceanic dispersal of New Zealand alpine buttercups: molecular evidence under split decomposition. Annals of the Missouri Botanical Garden 88, 458–477.
| Crossref | GoogleScholarGoogle Scholar |
Manos PS,
Doyle JJ, Nixon KC
(1999) Phylogeny, biogeography, and processes of molecular differentiation in Quercus subgenus Quercus (Fagaceae). Molecular Phylogenetics and Evolution 12, 333–349.
| Crossref | GoogleScholarGoogle Scholar |
CAS |
PubMed |
Manzano P, Malo JE
(2006) Extreme long-distance seed dispersal via sheep. Frontiers in Ecology and the Environment 4, 244–248.
| Crossref | GoogleScholarGoogle Scholar |
McBreen K, Lockhart PJ
(2006) Reconstructing reticulate evolutionary histories of plants. Trends in Plant Science 11, 398–404.
| Crossref | GoogleScholarGoogle Scholar |
CAS |
PubMed |
McDowall RM
(2008) Process and pattern in the biogeography of New Zealand – a global microcosm? Journal of Biogeography 35, 197–212.
| Crossref |
Meudt HM, Bayly MJ
(2008) Phylogeographic patterns in the Australasian genus Chionohebe (Veronica s.l., Plantaginaceae) based on AFLP and chloroplast DNA sequences. Molecular Phylogenetics and Evolution 47, 319–338.
| Crossref | GoogleScholarGoogle Scholar |
CAS |
PubMed |
Meudt HM, Simpson BB
(2006) The biogeography of the austral, subalpine genus Ourisia (Plantaginaceae) based on molecular phylogenetic evidence: South American origin and dispersal to New Zealand and Tasmania. Biological Journal of the Linnean Society. Linnean Society of London 87, 479–513.
| Crossref | GoogleScholarGoogle Scholar |
Morgan-Richards M,
Smissen RD,
Shepherd LD,
Wallis GP,
Hayward JJ,
Chan C-h,
Chambers GK, Chapman HM
(2009) A review of genetic analyses of hybridisation in New Zealand. Journal of the Royal Society of New Zealand 39, 15–34.
Müller K
(2005) SeqState: primer design and sequence statistics for phylogenetic DNA datasets. Applied Bioinformatics 4, 65–69.
| Crossref |
PubMed |
Muñoz J,
Felicísimo AM,
Cabezas F,
Burgaz AR, Martínez I
(2004) Wind as a long-distance dispersal vehicle in the southern hemisphere. Science 304, 1144–1147.
| Crossref | GoogleScholarGoogle Scholar | PubMed |
Murray BG,
Datson PM,
Lai EL,
Sheath KM, Cameron EK
(2004) Polyploidy, hybridization and evolution in Pratia (Campanulaceae). New Zealand Journal of Botany 42, 905–920.
Nelson GJ
(1975) Review: Biogeography, the vicariance paradigm, and continental drift. Systematic Zoology 24, 490–504.
| Crossref | GoogleScholarGoogle Scholar |
Perrie LR, Brownsey PJ
(2007) Molecular evidence for long-distance dispersal in the New Zealand pteridophyte flora. Journal of Biogeography 34, 2028–2038.
| Crossref | GoogleScholarGoogle Scholar |
Perrie LR,
Brownsey P,
Lockhart PJ,
Brown EA, Large MF
(2003) Biogeography of temperate Australasian Polystichum ferns as inferred from chloroplast sequence and AFLP. Journal of Biogeography 30, 1729–1736.
| Crossref | GoogleScholarGoogle Scholar |
Perrie LR,
Bayly MJ,
Lehnebach CA, Brownsey PJ
(2007) Molecular phylogenetics and molecular dating of the New Zealand Gleicheniaceae. Brittonia 59, 129–141.
| Crossref | GoogleScholarGoogle Scholar |
Pole M
(1994) The New-Zealand flora – entirely long-distance dispersal. Journal of Biogeography 21, 625–635.
| Crossref | GoogleScholarGoogle Scholar |
Posada D, Buckley TR
(2004) Model selection and model averaging in phylogenetics: advantages of akaike information criterion and Bayesian approaches over likelihood ratio tests. Systematic Biology 53, 793–808.
| Crossref | GoogleScholarGoogle Scholar | PubMed |
Posada D, Crandall KA
(1998) MODELTEST: testing the model of DNA substitution. Bioinformatics (Oxford, England) 14, 817–818.
| Crossref | GoogleScholarGoogle Scholar |
CAS |
PubMed |
Rahn K
(1984)
Plantago sect. Oliganthos in southern South America, a taxonomic revision. Nordic Journal of Botany 4, 601–627.
| Crossref | GoogleScholarGoogle Scholar |
Rahn K
(1996) A phylogenetic study of the Plantaginaceae. Botanical Journal of the Linnean Society 120, 145–198.
Raven PH
(1973) Evolution of subalpine and alpine plant groups in New Zealand. New Zealand Journal of Botany 11, 177–200.
Reeves G,
Chase MW,
Goldblatt P,
Rudall P,
Fay MF,
Cox AV,
Lejeune B, Souza-Chies T
(2001) Molecular systematics of Iridaceae: evidence from four plastid DNA regions. American Journal of Botany 88, 2074–2087.
| Crossref | GoogleScholarGoogle Scholar |
CAS |
Rivadavia F,
Kondo K,
Kato M, Hasebe M
(2003) Phylogeny of the sundews, Drosera (Droseraceae), based on chloroplast rbcL and nuclear 18S ribosomal DNA sequences. American Journal of Botany 90, 123–130.
| Crossref | GoogleScholarGoogle Scholar |
CAS |
Rønsted N,
Chase MW,
Albach DC, Bello MA
(2002) Phylogenetic relationships within Plantago (Plantaginaceae): evidence from nuclear ribosomal ITS and plastid trnL-F sequence data. Botanical Journal of the Linnean Society 139, 323–338.
| Crossref | GoogleScholarGoogle Scholar |
Sanmartín I, Ronquist F
(2004) Southern hemisphere biogeography inferred by event-based models: plant versus animal patterns. Systematic Biology 53, 216–243.
| Crossref | GoogleScholarGoogle Scholar | PubMed |
Sanmartín I,
Wanntorp L, Winkworth RC
(2007) West wind drift revisited: testing for directional dispersal in the Southern Hemisphere using event-based tree fitting. Journal of Biogeography 34, 398–416.
| Crossref | GoogleScholarGoogle Scholar |
Shaw J,
Lickey EB,
Schilling EE, Small RL
(2007) Comparison of whole chloroplast genome sequences to choose noncoding regions for phylogenetic studies in angiosperms: the tortoise and the hare III. American Journal of Botany 94, 275–288.
| Crossref | GoogleScholarGoogle Scholar |
CAS |
Simmons MP,
Müller K, Norton AP
(2007) The relative performance of indel-coding methods in simulations. Molecular Phylogenetics and Evolution 44, 724–740.
| Crossref | GoogleScholarGoogle Scholar |
CAS |
PubMed |
Smissen RD,
Garnock-Jones PJ, Chambers GK
(2003) Phylogenetic analysis of ITS sequences suggests a Pliocene origin for the bipolar distribution of Scleranthus (Caryophyllaceae). Australian Systematic Botany 16, 301–315.
| Crossref | GoogleScholarGoogle Scholar |
CAS |
Spence JR, Sykes WR
(1989) Are Plantago novae-zelandiae L.Moore and P. lanigera Hook.f. (Plantaginaceae) different? New Zealand Journal of Botany 27, 499–502.
Stöckler K,
Daniel IL, Lockhart PJ
(2002) New Zealand Kauri (Agathis australis (D.Don) Lindl., Araucariaceae) survives Oligocene drowning. Systematic Biology 51, 827–832.
| Crossref | GoogleScholarGoogle Scholar | PubMed |
Sykes WR
(1988) Notes on New Zealand Plantago Species. New Zealand Journal of Botany 26, 321–323.
Sytsma KJ,
Litt A,
Zijhra ML,
Pires JC,
Nepokroeff M,
Conti E,
Walker J, Wilson PG
(2004) Clades, clocks, and continents: historical and biogeographical analysis of Myrtaceae, Vochysiaceae, and relatives in the southern hemisphere. International Journal of Plant Sciences 165, S85–S105.
| Crossref | GoogleScholarGoogle Scholar |
CAS |
Trewick SA,
Paterson AM, Campbell HJ
(2007) Hello New Zealand. Journal of Biogeography 34, 1–6.
| Crossref | GoogleScholarGoogle Scholar |
von Hagen KB, Kadereit JW
(2001) The phylogeny of Gentianella (Gentianaceae) and its colonization of the southern hemisphere as revealed by nuclear and chloroplast DNA sequence variation. Organisms, Diversity & Evolution 1, 61–79.
| Crossref | GoogleScholarGoogle Scholar |
Vriesendorp B, Bakker FT
(2005) Reconstructing patterns of reticulate evolution in angiosperms: what can we do? Taxon 54, 593–604.
Wagstaff SJ, Garnock-Jones PJ
(1998) Evolution and biogeography of the Hebe complex (Scrophulariaceae) inferred from ITS sequences. New Zealand Journal of Botany 36, 425–437.
Wagstaff SJ, Garnock-Jones PJ
(2000) Patterns of diversification in Chionohebe and Parahebe (Scrophulariaceae) inferred from ITS sequences. New Zealand Journal of Botany 38, 389–407.
Wagstaff SJ, Wege J
(2002) Patterns of diversification in New Zealand Stylidiaceae. American Journal of Botany 89, 865–874.
| Crossref | GoogleScholarGoogle Scholar |
Wagstaff SJ,
Heenan PB, Sanderson MJ
(1999) Classification, origins, and patterns of diversification in New Zealand Carmichaelinae (Fabaceae). American Journal of Botany 86, 1346–1356.
| Crossref | GoogleScholarGoogle Scholar |
CAS |
PubMed |
Wagstaff SJ,
Bayly MJ,
Garnock-Jones PJ, Albach DC
(2002) Classification, origin, and diversification of the New Zealand hebes (Scrophulariaceae). Annals of the Missouri Botanical Garden 89, 38–63.
| Crossref | GoogleScholarGoogle Scholar |
Wanntorp L, Wanntorp H-E
(2003) The biogeography of Gunnera L.: vicariance and dispersal. Journal of Biogeography 30, 979–987.
Winkworth RC,
Robertson AW,
Ehrendorfer F, Lockhart PJ
(1999) The importance of dispersal and recent speciation in the flora of New Zealand. Journal of Biogeography 26, 1323–1325.
| Crossref | GoogleScholarGoogle Scholar |
Winkworth RC,
Grau J,
Robertson AW, Lockhart PJ
(2002a) The origins and evolution of the genus Myosotis L. (Boraginaceae). Molecular Phylogenetics and Evolution 24, 180–193.
| Crossref | GoogleScholarGoogle Scholar | PubMed |
Winkworth RC,
Wagstaff SJ,
Glenny D, Lockhart PJ
(2002b) Plant dispersal NEWS from New Zealand. Trends in Ecology & Evolution 17, 514–520.
| Crossref | GoogleScholarGoogle Scholar |
Wolfe KH,
Li WH, Sharp PM
(1987) Rates of nucleotide substitution vary greatly among plant mitochondrial, chloroplast, and nuclear DNAs. Proceedings of the National Academy of Sciences, USA 84, 9054–9058.
| Crossref | GoogleScholarGoogle Scholar |
CAS |
Xia X, Xie Z
(2001) DAMBE: software package for data analysis in molecular biology and evolution. Journal of Heredity 92, 371–373.
| Crossref | GoogleScholarGoogle Scholar |
CAS |
PubMed |
Yoder AD,
Irwin JA, Payseur BA
(2001) Failure of the ILD to determine data combinability for slow loris phylogeny. Systematic Biology 50, 408–424.
| Crossref | GoogleScholarGoogle Scholar |
CAS |
PubMed |

|

|

|
|