

Ammonia volatilisation losses from urea applied to acidic cropping soils is regulated by pH buffering capacity
L. O. Hearn A B * , L. Barton A , G. D. Schwenke C and D. V. Murphy A D
A SoilsWest, School of Agriculture and Environment, The University of Western Australia, Crawley, WA 6009, Australia.
B Agriculture Victoria Research, Horsham, Vic. 3400, Australia.
C New South Wales Department of Primary Industries, Tamworth Agricultural Institute, Calala, NSW 2340, Australia.
D SoilsWest, Centre for Sustainable Farming Systems, Food Futures Institute, Murdoch University, Murdoch, WA 6150, Australia.
Soil Research 61(7) 685-696 https://doi.org/10.1071/SR23044
Submitted: 10 March 2023 Accepted: 24 July 2023 Published: 8 August 2023
© 2023 The Author(s) (or their employer(s)). Published by CSIRO Publishing. This is an open access article distributed under the Creative Commons Attribution-NonCommercial-NoDerivatives 4.0 International License (CC BY-NC-ND)
Abstract
Context: Ammonia (NH3) volatilisation can be a significant nitrogen (N) loss pathway in the grains industry following the surface broadcast application of urea. However, the extent of urea volatilisation from acidic soils and the soil properties that regulate this N loss pathway have not been investigated widely.
Aims: We conducted a laboratory incubation experiment to measure NH3 volatilisation loss potential following the broadcast application of urea prills (1–2 mm diameter; 50 kg N ha−1) onto moistened acidic and neutral cropping soils, sampled from four long-term cropping research sites.
Methods: The selected soils varied in pH, clay content, organic carbon, pH buffering capacity (pHBC) and cation exchange capacity. Volatilised NH3 was captured in a phosphoric acid trap after 7, 14 and 21 days and then measured using colorimetric analysis. We compared the measured NH3 losses with predicted NH3 losses derived from an existing empirical NH3 volatilisation prediction model.
Key results: Of the applied urea-N, 0.9–25% was volatilised. Cumulative NH3 losses were strongly related (R2 = 0.77) with soil pHBC derived from a pedotransfer function. The existing NH3 loss model generally had poor predictive capacity (RMSE = 34%).
Conclusions: Using clay content as a surrogate variable for pHBC in the predictive model for sandy kaolinitic soils where it is largely a function of organic carbon content can cause poor estimates of NH3 volatilisation loss potential.
Implications: Grain production on sandy, acidic soils with low pHBC could lead to substantial NH3 volatilisation losses if urea is broadcast.
Keywords: acid soils, ammonia volatilisation, cation exchange capacity, cropping systems, kaolinitic clay, nitrogen fertiliser, organic carbon, pH buffering capacity.
Introduction
With the global population approaching an expected 9 billion by 2050 (Keating et al. 2014), nitrogen (N) fertiliser use has escalated to intensify food and fibre production to meet food production demands (Randive et al. 2021). Specifically, there has been a shift towards urea use as the world’s most popular nitrogenous fertiliser, with consumption increasing more than 100-fold in the past four decades (Glibert 2017). However, the worldwide reliance on urea application contributes to the increasing release of reactive N into the atmosphere. Volatilisation is a significant pathway for gaseous N loss of ammonia (NH3) from the soil, whereby differences in gaseous NH3 concentrations between the soil surface and atmosphere cause NH3 to diffuse from the soil into the atmosphere (Ma et al. 2021). Global reports of NH3 volatilisation losses following urea application onto arable land range from 0.1% to 64% of the applied N (Pan et al. 2016). The extent of this loss depends on several key environmental, agronomic and soil factors that influence NH3 availability and mobility (Schwenke et al. 2014; Janke et al. 2021; Klimczyk et al. 2021).
The release of NH3 into the atmosphere decreases fertiliser N use efficiency, with various environmental and health implications (Bolan et al. 2004; Sommer et al. 2004), including the formation of poor air quality when atmospheric NH3 reacts with acidic compounds to form ammonium aerosols (Ti et al. 2019), soil acidification and eutrophication of water bodies following deposition (Sutton et al. 1992). In addition, the deposition of atmospheric NH3 onto soils can indirectly contribute to nitrous oxide emissions, a potent greenhouse gas (IPCC 2006). As demand from consumers and policy frameworks increasingly pressure agricultural production systems to account for and actively engage in mitigating production pollution (IPCC 2014), accurate nutrient loss prediction tools are required to identify regions and soils most susceptible to NH3 loss.
A soil’s capacity to resist the localised alkalising effect of urea hydrolysis plays an important role in determining whether an acidic or neutral soil is conducive to substantial NH3 volatilisation. The pH shift following hydrolysis varies between soil types and is regulated by the soil’s pH buffering capacity (pHBC) – the soil’s capacity to resist a shift in pH with the addition of acidity or alkalinity (Wong et al. 2013). Soil pHBC encapsulates the soil’s total acidity, comprising exchangeable and non-exchangeable titratable acidity from dissolution/precipitation reactions and protonation/deprotonation of weak acids from variable charged surfaces, such as clay minerals and organic matter (Aitken et al. 1990; Conyers et al. 2000). The alkalising effect of urea hydrolysis can increase soil pH by two units in some instances (Black et al. 1985), temporarily shifting the equilibrium reaction (Eqn 1) to prefer NH3 production. The NH3 generated may then be volatilised from the soil surface.
Urea hydrolysis consumes two moles of H+ (per mole of urea applied) from the immediate soil surrounding the urea prill to form a ‘fertosphere’ (Ferguson et al. 1984). This localised pH shift can extend up to 35–45 mm from the prill in heavy clay soil (Janke et al. 2021) and up to 30 mm in silt loam soil (Black et al. 1987). In an acidic soil with high pHBC, positively charged sesquioxides that dissociate to form H+ ions or the deprotonation of weakly acidic functional groups from organic matter (carboxylic and phenolic groups) buffer the consumed acidity (Curtin and Trolove 2013). This buffering capacity maintains the original soil pH so that ammoniacal N preferentially remains as NH4+ with negligible risk of volatilisation loss in acidic soils (Vlek et al. 1981). In contrast, in soils with a low pHBC, there is a high potential for NH3 loss as the rise in pH shifts the equilibrium reaction (Eqn 1), increasing the NH3 concentration in the soil solution. For example, Fillery and Khimashia (2016) reported that 26% of urea-N applied to a low-pHBC sandy loam soil with a pH (CaCl2) of 5.5 was lost as NH3-N through volatilisation. However, the extent to which NH3 volatilisation occurs from acidic, poorly buffered soils is not widely recognised and warrants further investigation.
Mechanistic (Izaurralde et al. 1990; Nyord et al. 2008; Macnack et al. 2013; Smith et al. 2020) and empirical models (Fillery and Khimashia 2016) have been developed to predict NH3 loss following N fertiliser application. Fillery and Khimashia (2016) used soil characteristics (pH and clay content), fertiliser type, climate and a collection of crop-based scaling factors to empirically predict expected NH3 losses following urea and ammonium-based fertiliser application to cropping soils. The model used easily obtainable soil parameters. For example, clay content was used as a surrogate variable for pHBC. Comparing estimated and actual NH3 losses from published field studies demonstrated strong predictive capacity (Fillery and Khimashia 2016). However, using clay content, rather than soil organic carbon, as a surrogate for pHBC across all soil types is not always appropriate. For example, using organic carbon content in place of clay content has been demonstrated to more accurately represent pHBC in soils dominant in 1:1 kaolinitic clay mineralogy (Moore 2001), where the organic carbon content can provide 300 times more pHBC than kaolinitic clay content (Bache 1988). Therefore, using clay content as the surrogate variable for pHBC in the Fillery and Khimashia (2016) predictive model has the potential to overestimate NH3 volatilisation losses from soils predominantly containing kaolinitic clay.
Southwestern Australia is a significant grain production region with approximately 8.5 million hectares cropped annually (Harries et al. 2021), with Tenosols, Chromosols and Sodosols the dominant soil types throughout the cropping region (Ma et al. 2022). Acidic topsoils [pH(CaCl2) < 5.5] characterise more than 70% of the region’s arable land (Gazey et al. 2013), with urea application widely relied on as an inorganic N fertiliser to support crop production. Few studies have investigated the risk of NH3 volatilisation loss from urea applied to acidic soils (Fillery and Khimashia 2016; Ohnemus et al. 2021).
We conducted a laboratory incubation experiment to control/omit influential environmental factors such as weather events (rain and dew), evaporation, wind speed and plant cover and, thus, focus on the role of soil chemical and physical properties on NH3 volatilisation loss potential. The study aimed to (1) investigate NH3 loss potential of acidic and neutral pH cropping soils, (2) investigate the predictive capacity of selected soil chemical and physical properties on cumulative NH3 volatilisation loss and (3) evaluate the predictive capacity of the Fillery and Khimashia (2016) NH3 volatilisation prediction model for estimating the NH3 loss potential of these soils.
Materials and methods
Study site and sample collection
Soil samples (0–50 mm) were collected between December 2018 and April 2019 from four long-term cropping research sites in southwestern Australia (Table 1), established to investigate the effects of different land management practices on soil properties and crop growth (Fisk et al. 2015; Betti et al. 2017; Sarker et al. 2018; Azam and Gazey 2021). Land management practices included liming, stubble management (crop residue retained or burnt), organic matter addition and clay incorporation (Table 1), with three to four replicate field plots per treatment. A randomised block design was used at each study location. Soil sampling for this study was restricted to the surface from each plot, as the NH3–NH4+ equilibrium reaction following hydrolysis of surface applied urea is a localised reaction occurring within a 30–45 mm radius from the urea granule (Black et al. 1987; Janke et al. 2021).
| Soil sites | Merredin L | Merredin B | Buntine | Badgingarra |
|---|---|---|---|---|
| GPS location (latitude and longitude) | 31°48′S, 118°21′E | 31°49′S, 118°21′E | 30°01′S, 116°34′E | 30°14′S, 115°31′E |
| Annual rainfall (mm) (2018)A | 325 mm | 325 mm | 285 mm | 538 mm |
| Australian soil classificationB | Yellow Orthic Acidic Tenosol | Red Dermosol | Regolithic Yellow-Orthic Tenosol | Bleached Tenosol |
| Land management investigated | Lime incorporation | Crop stubble management | Organic matter (OM) addition | Clay incorporation |
| Treatments established | 2008–2018 | 1987–2014 | 2003–2006 | 2016–2019 |
| Treatments | Lime (94.9% neutralising value, 99% of particles <0.5 mm) applied at 0, 2, 4 or 6 t ha−1, then offset ploughed to 10–15 cm depth. Before liming, the site was ripped to 50 cm. Three replicates per treatment. | Crop stubble either burnt prior to drill sowing or retained as standing stubble after harvest. Three replicates per treatment. | Soil tilled to 10 cm depth annually using offset discs. Till (T) + OM tilled with 20 t ha−1 barley, canola and oat chaff in 2003, 2006, 2010 and 2012, OM+ Rundown (R) treated with chaff and tilled in 2003 and 2006 but no further OM additions. Three replicates per treatment. | Clay-rich subsoil incorporated to 10–12 cm depth at 0, 150 and 250 t ha−1 using offset discs. Three replicates per treatment. |
| Cropping practices | Wheat–barley–canola rotation cropping system | Legume–wheat continuous cropping system | Lupin–wheat–wheat rotation cropping system | Lupin grown in year before treatment followed by barley |
| Reference | Azam and Gazey (2021) | Sarker et al. (2018) | Fisk et al. (2015) | Betti et al. (2017) |
AAnnual rainfall data (Commonwealth Bureau of Meteorology 2018).
BIsbell and The National Committee on Soil and Terrain (2021).
Experimental design and approach
We compared the different soils to assess how different soil parameters [clay content, organic carbon, cation exchange capacity (CEC), initial soil pH and pHBC] influence NH3 volatilisation loss potential. The laboratory experiment included soils collected from the four long-term field experiments described above. Each field site included two to four treatments depending on location (Table 1), resulting in 12 field treatments with three to four replicates per treatment, totalling 43 soil samples. Urea prills (1–2 mm diameter) were surface applied to each soil sample at two rates: 0 (control) or 50 kg N ha−1. In southwestern Australia, 50 kg N ha−1 is a typical N fertiliser rate for cereal and oilseed crops (Harries et al. 2021).
Measuring NH3 volatilisation
To measure NH3 volatilisation, 150 g of soil (<2 mm; equivalent to ~20 mm depth) was weighed into a 1-L plastic container (90 mm diameter, 100 mm height) before adding deionised water to wet the soil to 60% of maximum water holding capacity (WHC) (Table 2). This soil water content was expected to be sufficient for the urea to undergo hydrolysis without forming a film of water on the soil surface that would impede gas exchange between the soil surface and container headspace. The soil was lightly compacted to form a flat soil surface after being evenly wetted and left to equilibrate for 8 h at 18°C. Urea prills [50 kg N ha−1, ~3 prills (1–2 mm diameter) per treatment] were then evenly applied to the soil surface before placing a phosphoric acid trap (10 mL of 9.8% v/v H3PO4 in a 30-mL beaker) within the plastic container and sealing with an airtight lid (Fig. 1). The phosphoric acid trap was secured 60 mm above the soil surface using a wire scaffold to make available the entire soil surface area of the incubation container. The incubation was conducted in a controlled temperature room at 24°C for 3 weeks, with the phosphoric acid trap changed every 7 days. No further water was applied to the soil surface, simulating the surface broadcast application of urea to moist soils in the absence of rainfall events.
| SiteA control | Treatment variations | |||
|---|---|---|---|---|
| Merredin L | 0 t ha−1 lime incorporation | 2 t ha−1 lime incorporation | 4 t ha−1 lime incorporation | 6 t ha−1 lime incorporation |
| pH (CaCl2) | 5.00 (0.22) | 6.2 (0.18) | 6.3 (0.26) | 6.4 (0.15) |
| CEC (cmol(+) kg−1) | 4.61 (0.27) | 2.38 (0.61) | 5.49 (0.59) | 5.50 (1.32) |
| Organic carbon (%) | 1.11 (0.08) | 0.93 (0.14) | 1.05 (0.11) | 1.09 (1.09) |
| Clay (%) | 8.39 (2.22) | 6.72 (4.62) | 6.54 (0.56) | 7.67 (3.59) |
| pHBC (cmol H+ kg−1 per pH unit) | 1.11 (0.05) | 1.09 (0.05) | 1.07 (0.06) | 1.11 (0.15) |
| WHC (g H2O g−1) | 0.29 (0.02) | 0.32 (0.09) | 0.32 (0.50) | 0.33 (0.02) |
| SiteA control | Treatment variations | |||
|---|---|---|---|---|
| Merredin B | Burnt stubble | Unburnt stubble | ||
| pH (CaCl2) | 5.5 (0.06) | 5.50 (0.06) | ||
| CEC (cmol(+) kg−1) | 9.92 (0.45) | 10.15 (0.34) | ||
| Organic carbon (%) | 0.78 (0.06) | 0.83 (0.05) | ||
| Clay (%) | 19.82 (4.47) | 19.31 (2.29) | ||
| pHBC (cmol H+ kg−1 per pH unit) | 1.15 (0.12) | 1.18 (0.03) | ||
| WHC (g H2O g−1) | 0.38 (0.01) | 0.39 (0.01) | ||
| SiteA control | Treatment variations | |||
|---|---|---|---|---|
| Buntine | T + Soil | T + OM + R | T + OM | |
| pH (CaCl2) | 6.10(0.20) | 6.3(0.17) | 6.3 (0.23) | |
| CEC (cmol(+) kg−1) | 3.76 (0.31) | 3.78 (0.07) | 5.38 (0.77) | |
| Organic carbon (%) | 0.78 (0.05) | 0.89 (0.05) | 1.31 (0.27) | |
| Clay (%) | 4.49 (0.88) | 7.91 (0.13) | 7.54 (0.38) | |
| pHBC (cmol H+ kg−1 per pH unit) | 0.89 (0.01) | 1.01 (0.02) | 1.18 (0.14) | |
| WHC (g H2O g−1) | 0.30 (0.01) | 0.31 (0.01) | 0.35 (0.01) | |
| SiteA control | Treatment variations | |||
|---|---|---|---|---|
| Badgingarra | 0 t ha−1 clay | 150 t ha−1 clay | 250 t ha−1 clay | |
| pH (CaCl2) | 6.40 (0.05) | 6.50 (0.10) | 6.50 (0.06) | |
| CEC (cmol(+) kg−1) | 2.56 (0.39) | 2.54 (0.27) | 2.81 (0.20) | |
| Organic carbon (%) | 0.58 (0.08) | 0.58 (0.04) | 0.59 (0.06) | |
| Clay (%) | 2.74 (0.43) | 1.99 (1.74) | 3.48 (0.43) | |
| pHBC (cmol H+ kg−1 per pH unit) | 0.70 (0.06) | 0.72 (0.03) | 0.75 (0.04) | |
| WHC (g H2O g−1) | 0.29 (0.02) | 0.29 (0.01) | 0.30 (0.01) | |
Values are means (and standard deviations) of three replicates.
CEC, cation exchange capacity; pHBC, pH buffering capacity; WHC, water holding capacity; T, tilled; OM, organic matter; R, rundown.
AAll long-term research cropping sites are described in Table 1.
Incubation apparatus (sealed 1-L container) for capturing volatilised NH3 using a suspended 10-mL phosphoric acid trap (9.8 v/v %). Incubations were conducted in a controlled temperature room at 24°C.
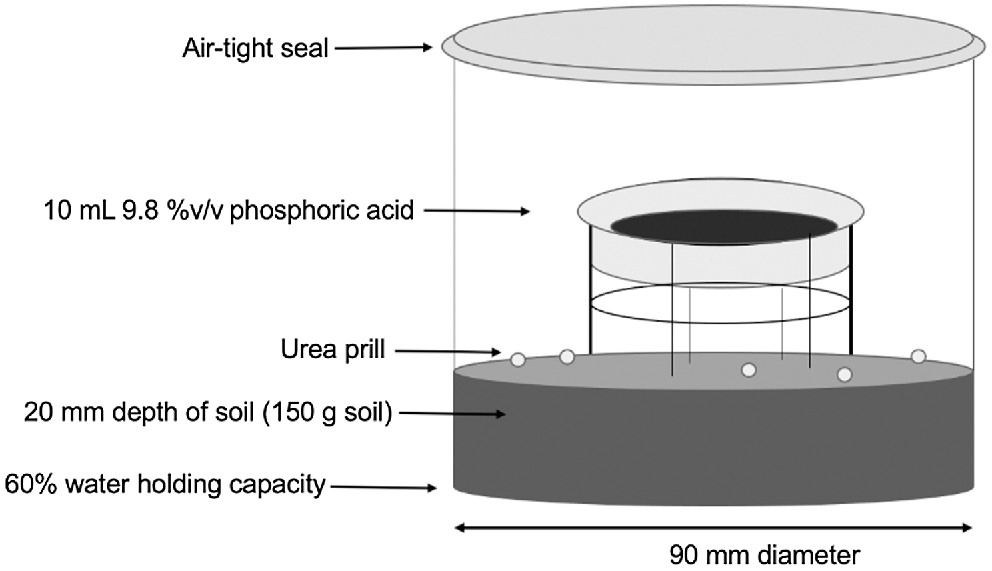
Volatilisation of NH3 was measured in the laboratory using phosphoric acid to ‘trap’ the NH3 volatilised from the urea applied to the soil surface. The apparatus used was based on Sunderlage and Cook (2018) (Fig. 1), but with the soil surface area increased from 1810 mm2 to 6362 mm2 and an acid solution (10 mL of 9.8% v/v phosphoric acid) instead of an acid-soaked cotton pad. The NH3 in the container headspace has a high affinity for the phosphoric acid trap, where it is reduced to NH4+ in solution. The stoichiometric capacity of the phosphoric acid solution was sufficient to ensure that if all the applied urea-N volatilised within the closure period the acid trap would not become saturated from captured volatilised NH3 in the headspace (Ndegwa et al. 2009). Colourimetric analysis using a flow injection analyser (Lachat Instruments, Loveday, CO, USA; Method 10-107-06-2-O: Ammonia in surface water and wastewater) determined the amount of NH3 captured by the phosphoric acid solution. The NH3 volatilisation loss was calculated as the amount of N trapped in the phosphoric acid solution, expressed as a percentage of the applied N.
Soil physical and chemical analysis
Soil properties were determined using air-dried soil samples (<2 mm) stored at room temperature. The gravimetric water content of air-dried soils was calculated as the mass difference between air-dried soil samples before and after oven drying at 105°C for 24 h. Soil pH(CaCl2) was measured in a 1:5 soil and 0.01 M CaCl2 suspension using a glass electrode (Rayment and Lyons 2010). Soil WHC (g H2O g−1 soil) was calculated as the difference in mass of soils at saturation [determined using a porous ceramic plate technique (Cresswell and Hamilton 2002)] and after oven drying at 105°C for 24 h.
Clay percentage (particle size < 2 μm) was measured by a direct sampling pipette method using Stokes Law that determines clay fraction settling times at a given depth and temperature (Cresswell and Hamilton 2002). Pre-treatments included (1) digestion with hydrogen peroxide to remove organic carbon, (2) chemical dispersion using sodium hexametaphosphate and (3) 10 min of vigorous agitation using a milkshake blender (Klute 1986).
The CEC was measured using a 1:10 extraction solution of 0.1 M ammonium chloride and 0.1 M barium chloride to displace exchangeable cations (Ca2+, Mg2+, Na+, K+ and Al3+). The cations were measured using inductively coupled plasma spectroscopy (Rayment and Lyons 2010). The low electrical conductivity readings for the samples meant that a pre-wash for soluble salts was not needed. The sum of exchangeable cations [cmol(+) kg−1 soil] (Ca2+, Mg2+, Na+, K+ and Al3+) was the effective soil CEC (Rayment and Lyons 2010). Total organic carbon was measured using the wet oxidation dichromate method (Rayment and Lyons 2010).
Soil pHBC was calculated using a pedotransfer function (Eqn 2) (Moore 2001) with coefficients calibrated for soils of the southwestern Australian agricultural region (R2 = 0.86) as follows:
where OC% is the Walkley–Black percentage organic carbon content, clay% is the soil clay fraction (particle size < 2 μm) and Al is exchangeable aluminium (meq 100 g−1).
Statistical analysis
All data were statistically analysed using the R software program (ver. 4.1.0 GUI). Simple linear regressions of NH3 volatilisation losses versus soil properties were formed to determine suitable function relationships. Pearson’s correlation was used to analyse the relationship between soil properties and NH3 volatilisation potential. ANOVA and Tukey’s post hoc test compared NH3 volatilisation losses between each long-term research cropping site. Principal components analysis biplot based on Euclidian distance dissimilarity measures determined the presence of multicollinearity between the soil properties and identified suitable explanatory variables for the multiple regression model to predict NH3-N volatilisation loss potential. A multiple log-linear regression was used to model the relationship between NH3 volatilisation and measured soil properties, with the response variable (NH3-N loss as % of N applied) transformed using a natural logarithm. A Breusch–Pagan test (P > 0.05) confirmed the assumption of equal variance of residuals for all transformed relations, and a Ramsey regression equation specification error test confirmed the correctness of functional form for the multiple log-linear regression (P < 0.05). A root mean square error (RMSE) analysis compared the predicted NH3 volatilisation potentials using the Fillery and Khimashia (2016) model with the measured NH3 volatilisation losses from the incubation experiment.
Results
Soil physical and chemical properties
The four long-term research cropping sites provided a wide distribution of soil properties influencing soil NH3 volatilisation potentials (Table 2). Range of organic carbon content was 0.58–1.31%, CEC was 2.38–10.15 cmol(+) kg−1 soil, clay content was 1.99–19.48% and pHBC was 0.70–1.11 cmol H+ kg−1 soil per pH unit.
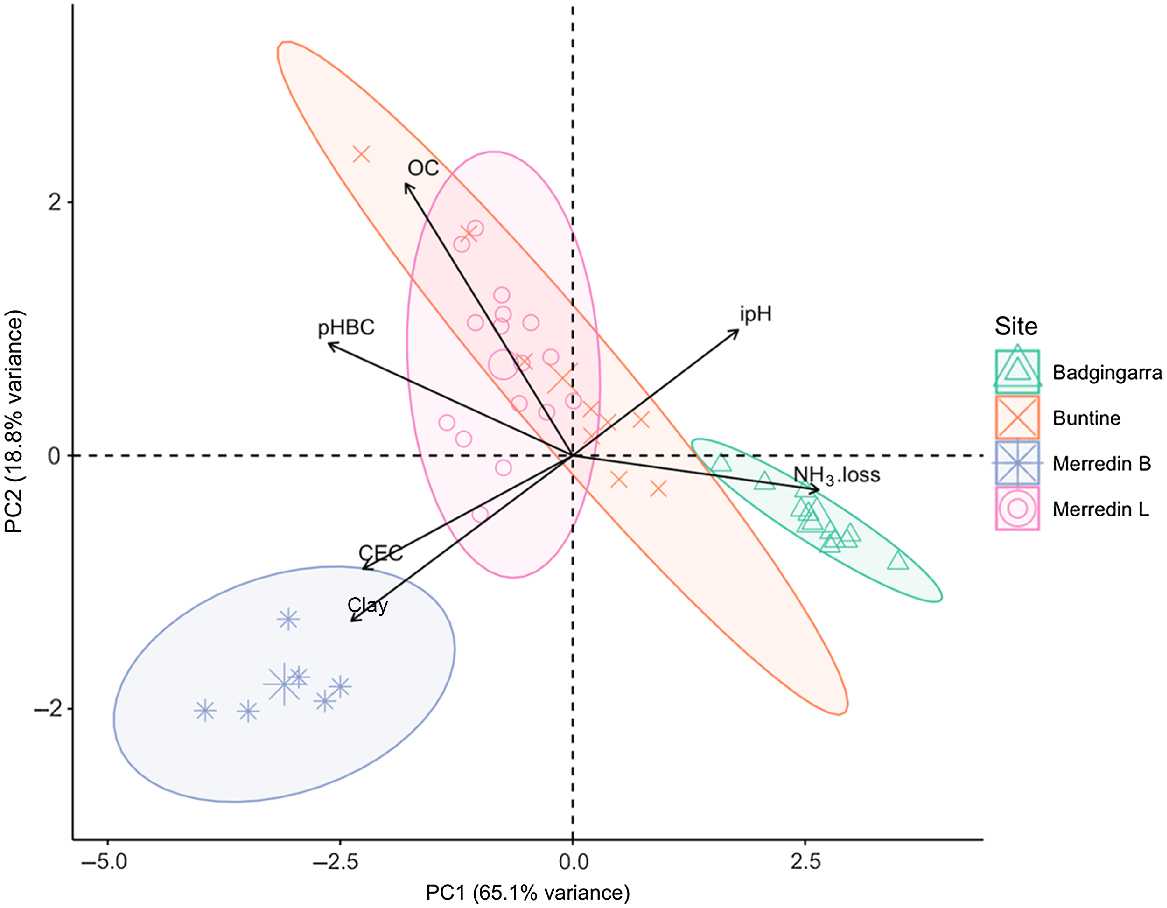
A biplot cluster analysis represents differences in soil physical and chemical properties at each field site, where Euclidian distances between sample site points indicate sample dissimilarity – the further the distance between points, the more dissimilar (Fig. 2). Badgingarra and Merredin B sites had exclusive clustering in the biplot distribution, with dissimilar soil parameters to the other two sites. The Badgingarra site had the lowest soil pHBC, clay content, CEC and organic carbon content of all sampling sites, while Merredin B had the highest soil clay content, pHBC and CEC. The Buntine site had the widest ellipse, indicating the greatest variance in soil properties between samples from one site, reflecting the persistence of the historic organic matter addition treatment.
Principal components analysis based on Euclidian distance dissimilarity ordination plot showing the interaction between NH3-N loss (NH3.loss) from southwestern Australia cropping soils and various soil properties [clay content (clay), cation exchange capacity (CEC), pH buffering capacity (pHBC), organic carbon (OC) and initial pH(CaCl2) (ipH)]. PC1 and PC2 represent 85.89% of data variance, with the percent variance explained by each coordinate axis. Bold ellipses encapsulate the variance within each experimental cropping site (see Table 1 for details) in relation to PC1 and PC2 at a 95% confidence interval.
NH3 volatilisation
Total NH3 loss after 3 weeks ranged from 0.9% (Merredin B, unburnt treatment) to 25% (Badgingarra, 0 t ha−1 clay treatment) of N applied (Table 3). Cumulative NH3 volatilised from surface broadcast urea (50 kg N ha−1) varied significantly between all field sites (P < 0.001) (Table 4). No NH3 was detected from the N fertiliser treatments after 2 weeks of incubation or from the nil N fertilised treatments during the 3 weeks of incubation.
| Site | Plot treatment | Week 1 | Week 2 | Week 3 | Total | PredictedA |
|---|---|---|---|---|---|---|
| Merredin L | 0 t ha−1 lime | 3.2 (1.5) | 1.3 (0.9) | n.d. | 7.3 (2.2) | 20.3 (0.8) |
| 2 t ha−1 lime | 6.2 (0.5) | 1.8 (0.9) | n.d. | 6.7 (0.9) | 20.9 (0.1) | |
| 4 t ha−1 lime | 6.0 (1.2) | 1.6 (0.6) | n.d. | 6.5 (1.1) | 21.0 (0.2) | |
| 6 t ha−1 lime | 6.4 (2.1) | 1.2 (0.9) | n.d. | 7.6 (2.8) | 20.6 (1.24) | |
| Merredin B | Burnt stubble | 0.8 (0.2) | 0.6 (0.1) | n.d. | 1.4 (0.3) | 16.4 (1.8) |
| Unburnt stubble | 0.6 (0.3) | 0.5 (0.4) | n.d. | 0.9 (0.6) | 16.5 (0.8) | |
| Buntine | T + Soil | 10.6 (2.5) | 1.1 (0.4) | n.d. | 11.6 (2.5) | 21.7 (0.3) |
| T + OM + R | 13.4 (1.4) | 0.5 (0.2) | n.d. | 13.9 (1.5) | 20.5 (0.1) | |
| T + OM | 6.9 (0.5) | 0.2 (0.1) | n.d. | 7.1 (0.6) | 20.7 (0.1) | |
| Badgingarra | 0 t ha−1 clay | 23.4 (4.2) | 1.8 (0.9) | n.d. | 25.2 (10.6) | 22.3 (0.2) |
| 150 t ha−1 clay | 19.6 (5.4) | 3.5 (2.7) | n.d. | 23.1 (12.4) | 22.5 (0.6) | |
| 250 t ha−1 clay | 21.9 (5.7) | 1.9 (0.9) | n.d. | 23.7 (6.1) | 22.0 (0.1) |
Values are means (and standard deviations) of three replicates.
T, tilled; OM, organic matter; R, rundown; n.d., none detected.
APredicted NH3 loss using the Fillery and Khimashia (2016) NH3 loss model.
| ANOVA | |
|---|---|
| F-statistic | 85.46 |
| P-value | <0.001 |
| d.f. | 3 |
| Tukey’s post hoc test pairwise comparisonA | Confidence interval difference in % NH3-N loss |
|---|---|
| Buntine – Badgingarra | (−17.43, −9.42) *** |
| Merredin B – Badgingarra | (−27.61, −18.52) *** |
| Merredin L – Badgingarra | (−20.88, −13.94) *** |
| Merredin B – Buntine | (−14.43, −4.85) *** |
| Merredin L – Buntine | (−7.78, −0.21) * |
| Merredin L – Merredin B | (1.30, 10.00) *** |
ATukey’s multiple comparisons of means 95%
confidence interval with significant P-values indicated as * <0.05, ** <0.01 and *** <0.001.
Relationship between NH3 volatilisation and soil properties
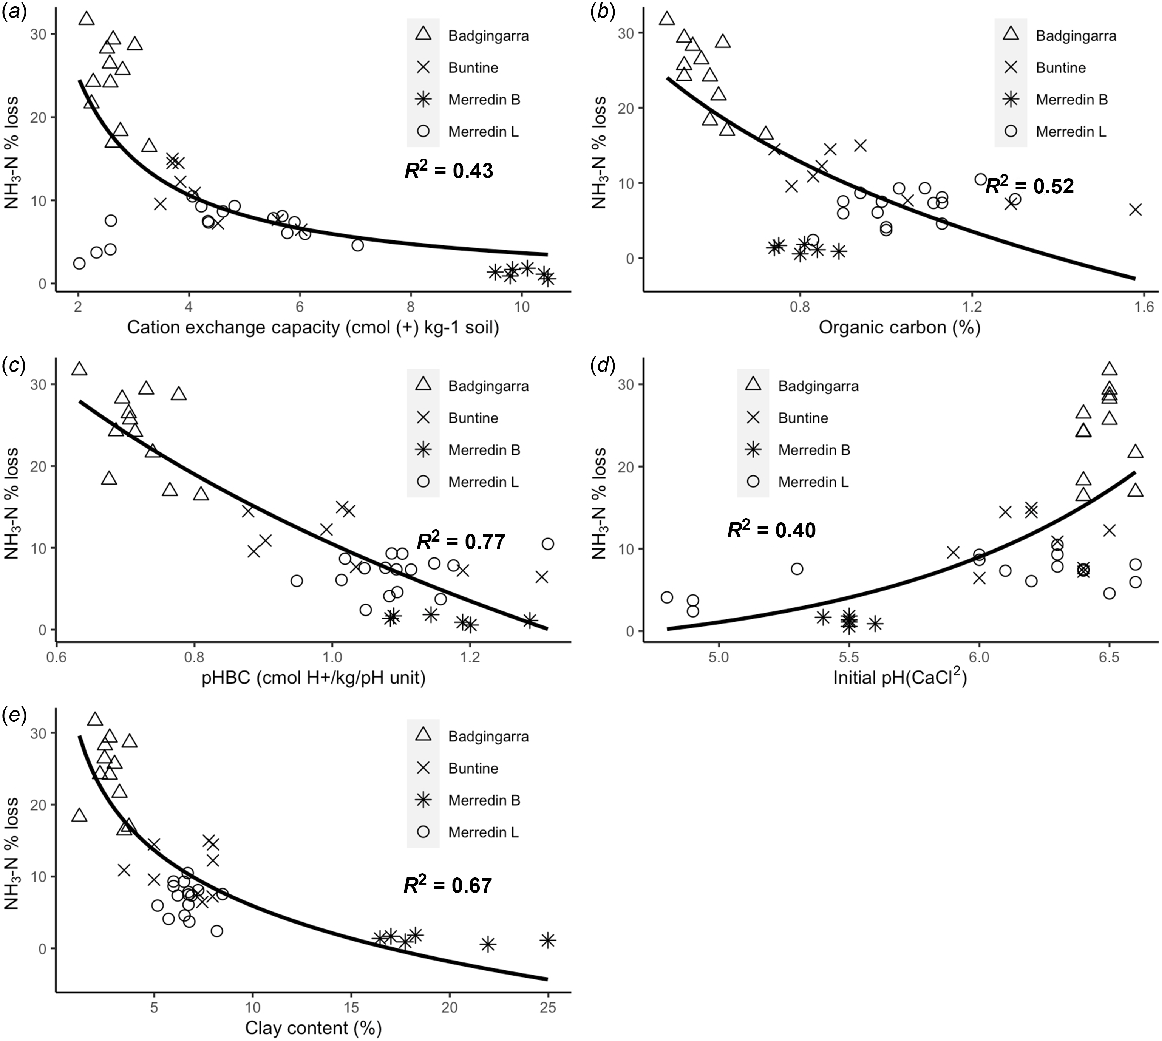
All measured soil properties were significantly correlated with total NH3 volatilisation losses (P < 0.05) (Table 5). Soil pHBC most strongly related to NH3 volatilisation losses (R2 = 0.77). Negative relationships between NH3 volatilisation losses and organic carbon, CEC, clay content and pHBC demonstrated that these soil properties helped prevent NH3 volatilisation (Table 5, Fig. 3). In contrast, initial pH had a weak positive relationship with NH3 volatilisation.
| Soil propertyA | % N-NH3 loss | Clay | CEC | OC | pH(CaCl2) | pHBC |
|---|---|---|---|---|---|---|
| % N-NH3 loss | 1 | – | – | – | – | – |
| Clay | −0.69*** | 1 | – | – | – | – |
| CEC | −0.68*** | 0.88*** | 1 | – | – | – |
| OC | −0.65*** | 0.19 | 0.28 | 1 | – | – |
| pH (CaCl2) | 0.61*** | −0.57*** | −0.30* | −0.13 | 1 | – |
| pHBC | −0.86*** | 0.66*** | 0.61*** | 0.83*** | −0.49*** | 1 |
CEC, cation exchange capacity; OC, organic carbon; pHBC, pH buffering capacity.
Tukey’s multiple comparisons of means 95% confidence interval with significant P-values indicated as * <0.05, ** <0.01 and *** <0.001.
A43 soils collected from four long-term research cropping sites as described in Table 1.
Exponential regressions between NH3 volatilisation losses (% N applied) and soil physiochemical properties: (a) cation exchange capacity, (b) pH (CaCl2), (c) clay content, (d) organic carbon content and (e) pH buffering capacity (pHBC). Cumulative NH3 volatilisation of southwestern Australia cropping soils was measured for 3 weeks after applying 50 kg N ha−1 as urea prills to the surface of soils wetted to 60% water holding capacity.
Analysing the soil properties as multiple log-linear regression to predict NH3 volatilisation rates identified organic carbon, CEC and soil pH(CaCl2) with the highest prediction capacities (adjusted R2 = 0.92, P < 0.001; Table 6). The independence of these explanatory variables is described by the perpendicular vector angles between soil properties organic carbon, CEC and soil pH in the principal components biplot (Fig. 2). Soil pHBC and clay percentage were omitted from the equation as they demonstrated multicollinearity with organic carbon and CEC properties, respectively. Each soil property included in the multiple linear-log regression had significant regression coefficients (Table 5). The multi log-linear regression equation follows:
where NH3-N% loss is the cumulative percentage NH3-N loss of the applied N over 3 weeks, OC is soil organic carbon percentage of the soil sample and pH is pH(CaCl2) of the soil sample.
| EstimateA | s.e. | ||
|---|---|---|---|
| Intercept | −2.42*** | (0.617) | |
| OC | −0.430** | (0.186) | |
| CEC | −0.261*** | (0.019) | |
| Initial pH | 1.00*** | (0.092) | |
| F-statistic | 162.5 | ||
| P | <0.001 | ||
| d.f. | 39 | ||
| Reset test (P-value) | 0.791 | ||
| Breusch–Pagan test (P-value) | 0.09 | ||
| Adjusted R2 | 0.920 | ||
| Observations | 43 | ||
Significant P-values indicated as ** <0.01 and *** <0.001.
AMultiple log-linear regression explanatory variable coefficient estimates from NH3 volatilisation losses.
Predictive capacity of the NH3 volatilisation prediction model
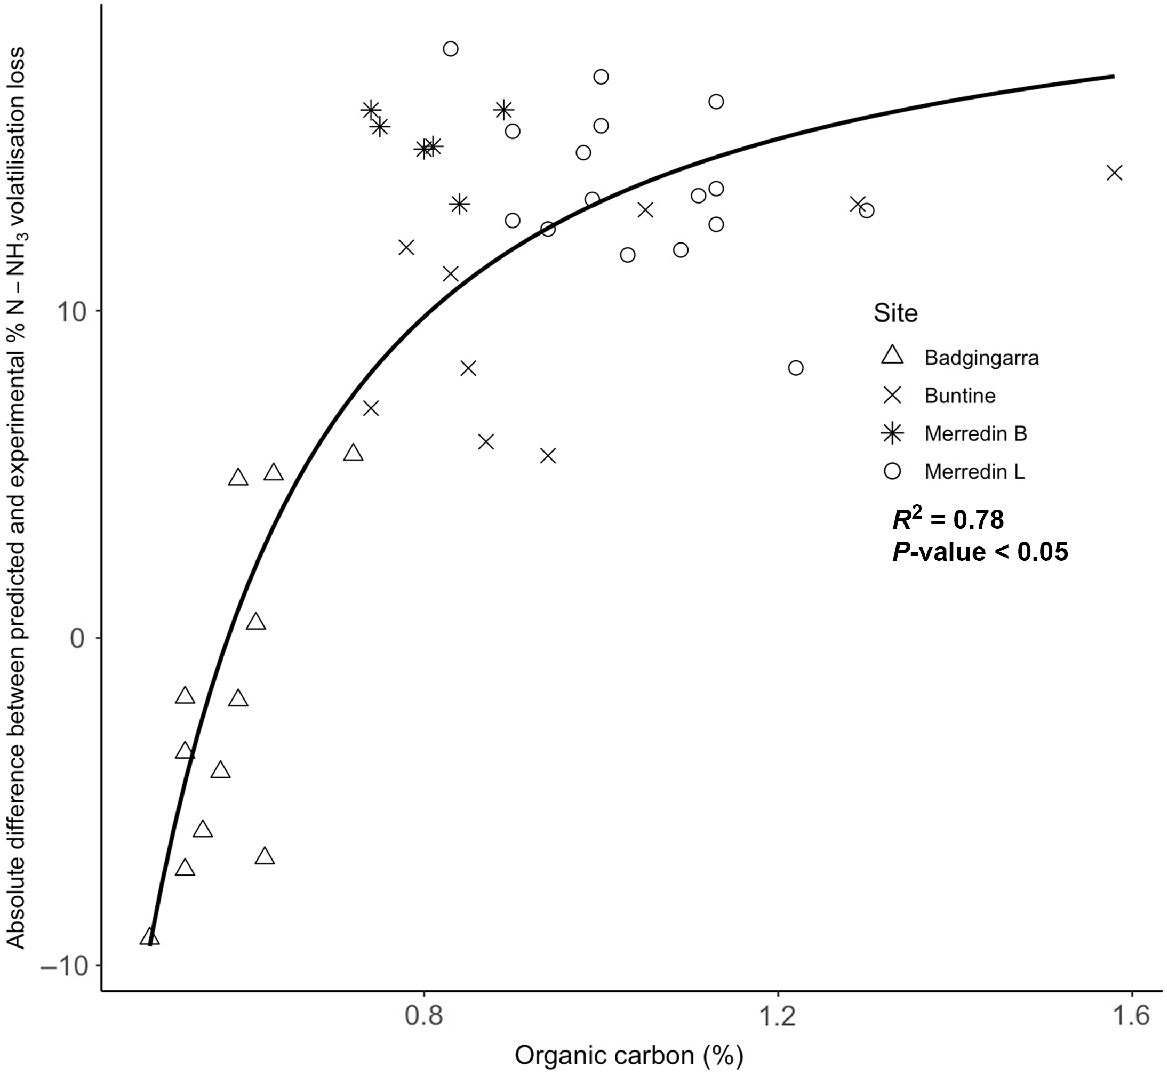
The measured cumulative NH3 volatilisation losses were poorly correlated with the predicted NH3 volatilisation loss potential using the predictive model of Fillery and Khimashia (2016). The RMSE of 36% indicated that the model had poor predictive power in estimating NH3 volatilisation losses from some of these soils, with predicted NH3 volatilisation rates with range of 14.4–23.5%. In contrast, the range of experimental volatilisation losses was 0.9–25.2% (Table 3). The comparison analysis demonstrated that the model overestimated the NH3 loss potentials for all field site soils except for Badgingarra. A positive exponential relationship occurred between organic carbon content and the difference between experimental and model-predicted NH3 volatilisation values (R2 = 0.78, P < 0.05; Fig. 4).
Exponential regression between organic carbon (%) and the error variance between predicted and observed experimental NH3 volatilisation losses from southwestern Australian cropping soils. Predicted NH3 volatilisation losses were calculated using the model developed by Fillery and Khimashia (2016).
Discussion
NH3 volatilisation from urea applied to sandy/sandy loam acidic soils
Volatilisation of NH3 is not an agronomic concern exclusive to alkaline soils. Our study indicated that acidic soils with low pH buffering capacities could be subject to substantial NH3 volatilisation losses. Importantly, the extent of NH3 volatilisation in this laboratory study indicated that the susceptibility of NH3-N losses from acidic to neutral soils is highly variable, ranging from negligible, <1–25% (Table 3). The greatest loss potential of 25% of applied NH3-N occurred for the Badgingarra sandy soil [pH(CaCl2) 6.5], comparable to the 27% measured loss in a field experiment following surface application of urea to an acidic sandy loam [pH(CaCl2) 5.5] in the central grain belt of southwestern Australia (Fillery and Khimashia 2016). These values are some of the highest NH3 volatilisation losses recorded from Australian cropping soils where urea has been applied (Barton et al. 2022).
Investigating the NH3 volatilisation loss potentials of soils across a wide pH range, including acidic soils in this study and studies by Fillery and Khimashia (2016) and Ohnemus et al. (2021), has indicated that acidic soils are not only at risk to NH3 volatilisation but could have the greatest NH3 loss potential. Collectively these findings challenge current views that the magnitude of NH3 volatilisation loss is greater when applying urea to alkaline soils (pH > 7) than acidic soils (Ernst and Massey 1960; Zhenghu and Honglang 2000; Hutchings et al. 2019). Past evaluation of NH3 loss potential assumed all soils have a constant pH buffering capacity with a uniform pH shift following urea hydrolysis. Our study highlights that poorly buffered acidic soils can be subject to substantial NH3 losses, likely driven by a severe pH shift as a consequence of poor pH buffering. Recently, Ohnemus et al. (2021) proposed that the greatest NH3 loss potentials from soils with an initial pH in the range of 5.0–6.5 occur due to the lower CEC typical of many soils within this acidic pH range. Our results support this finding in some instances; however, there is large variability in NH3 loss potentials from soils across this acidic to neutral pH range (Fig. 3), suggesting that initial pH is likely not the main regulatory factor determining NH3 loss potential. Thus, relying on pH as an indicator for evaluating NH3 loss potential could be misleading.
Three main reasons restrict the predictive capacity of initial pH: (1) initial soil pH is a temporal indication of risk in a system that is potentially subject to a significant pH change following urea hydrolysis (Black et al. 1985), (2) initial soil pH typically does not represent the peak pH evolved to or duration of the peak following urea hydrolysis (Ohnemus et al. 2021) and (3) pH evolution following urea hydrolysis is highly variable between soil types as it relates to soil pHBC (Ferguson et al. 1984; Izaurralde et al. 1987). These factors significantly impact the amount of NH3 available in the soil system and are, thus, likely to have caused the soil property of initial pH to be the weakest regulatory property of NH3 loss assessed in our study (R2 = 0.40), demonstrated by the observed variance in volatilisation responses at the same initial pH. For example, at an initial pH of 6.2, Merredin L soil had 6% NH3 losses compared to 14.5% from Buntine soil. As soil pH does not remain constant during urea hydrolysis, we suggest basing a greater predictive capacity for NH3 volatilisation loss on soil properties that represent the soil’s pH response to the urea hydrolysis reaction.
Regulation of NH3 volatilisation by soil properties
Volatilisation loss of NH3 is regulated by a complex collection of physical and chemical soil interactions (O’Toole et al. 1985; Ohnemus et al. 2021). Controlled laboratory conditions can exclude the influences of environmental and agronomic regulatory parameters, isolating the regulatory influence of physical and chemical soil properties on NH3 volatilisation losses. Our study found the strongest predictive capacity when NH3 loss potential was considered a function of multiple regulatory parameters, using a multiple log-linear regression model (Eqn 3) (R2 = 0.92). The regression model combined the influences of organic carbon content, CEC and initial soil pH on NH3 loss potential. The function comprises three properties that represent three main regulatory mechanisms of NH3 volatilisation potential: (1) soil capacity to buffer the alkalising urea hydrolysis reaction (Fillery and Khimashia 2016), i.e. soil pHBC, (2) soil’s affinity for complexing NH4+ (Baldock et al. 2009), i.e. soil CEC and (3) pH dissociation preference for NH3 or NH4+ availability (Freney et al. 1983), i.e. soil pH. While this laboratory study investigated the NH3 volatilisation potential under controlled environmental conditions, it offers insights into the soil properties that regulate NH3 losses from acidic soils, a rarely considered factor compared to alkaline cropping soils (Barton et al. 2022).
Soil pHBC had the strongest capacity for predicting NH3 volatilisation potential in this study (R2 = 0.77) (Fig. 2). Soil pHBC was determined using a pedotransfer function (Eqn 2) that considered the proton adsorbing and releasing capacities of aluminium oxides, organic carbon content and clay content (Moore 2001). Other studies have recognised pHBC as an explanatory variable for NH3 volatilisation risk (Freney et al. 1983; Kissel et al. 2008; Fillery and Khimashia 2016); however, using a pedotransfer function to define soil pHBC is a novel method for assessing NH3 volatilisation loss potential. While the pedotransfer function method improves access by removing the lengthy analytical titration method of Aitken and Moody (1994), it is limited by the lack of universal application that the titration method provides, requiring region-specific functions that recognise differences in clay mineralogy and organic carbon functional groups (Wong and Wittwer 2009). For example, Coleman and Thomas (1964) demonstrated that a pHBC pedotransfer function developed for northeastern Australian soils overestimated the pHBC of southwestern Australia soils by two- to three-fold. This overestimation was attributed to differences in silicate clay structure and organic matter functional groups specific to geomorphic and climate regions (Wong and Wittwer 2009). Further research into methods as universal as Aitken and Moody’s (1994) titration method but as time efficient as Moore’s (2001) pedotransfer function would help improve access to soil pHBC data, providing a more accurate assessment in determining associated NH3 loss potential than the weaker regulatory property of initial pH.
Predictive capacity of an NH3 volatilisation model
The predictive model of Fillery and Khimashia (2016) tended to overestimate NH3 losses from the urea applied to acid and neutral soils in the present study. The model best predicted NH3 losses from the Badgingarra soils (<5.5% overestimation) as the site with the lowest organic carbon content. For the remaining sites, NH3 loss predictions were overestimated by up to 18% (Fig. 3). The overestimation of NH3 losses appears to be a consequence of excluding organic carbon content as a regulatory parameter in the NH3 loss prediction model by Fillery and Khimashia (2016) (Fig. 4).
Variance in the model’s predictive capacity across different soil types likely reflects the assignment of clay content as a surrogate for soil pHBC, which assumes that all clays provide uniform pHBCs. However, clay types differ in their layer silicate structure and abundance of sesquioxide complexes, both of which affect the pHBC (Weaver et al. 2004; Wong et al. 2013). Therefore, the model’s pHBC factor does not always accurately represent actual soil pHBC and misrepresents the NH3 volatilisation inhibitory capacity of the soil. For example, soils dominant in 2:1 clay types (e.g. smectite and vermiculite) have pHBC strongly related to clay content (Moore 2001), whereas 1:1 clay soils have pHBC strongly related to organic carbon content. Poor estimation of NH3 loss potential in kaolinitic soils with medium to high organic carbon contents (i.e. >1.0%) could be a trade-off that comes with using accessible input variables to assess NH3 volatilisation loss potential in the Fillery and Khimashia (2016) predictive model. Future work should incorporate an improved method for estimating or directly measuring pHBC. Better estimation could be gained by adopting pedotransfer functions to estimate pHBC or including more soil properties that account for pHBC, such as organic carbon content or recognise the different buffering capacities of clay mineralogy. Model updates should then be validated in the field, including environmental parameters that regulate volatilisation losses.
Conclusion
Broadcast application of urea onto acidic and neutral soils could cause substantial N losses via NH3 volatilisation, with poorly pH-buffered soils the most at risk. The extent of NH3 loss varied considerably between soil types as a response to various soil properties (soil organic carbon content, CEC, initial soil pH, pHBC and clay content). The variability in NH3 loss potentials across soil types within a small pH range demonstrates that the current reliance on initial soil pH as an indicator for NH3 loss potential can be misleading, highlighting the importance of NH3 volatilisation predictive models that incorporate multiple regulatory factors to increase predictive capacity. Within the grains industry, the accuracy of predicting NH3 loss potential from acidic soils using current predictive models must be considered to increase our understanding of where best to employ NH3 volatilisation mitigation practices.
Acknowledgements
The authors thank C. Brouwer for technical support. Comments from the two anonymous reviewers improved the manuscript.
References
Aitken RL, Moody PW (1994) The effect of valence and Ionic-strength on the measurement of pH buffer capacity. Soil Research 32, 975-984.
| Crossref | Google Scholar |
Aitken RL, Moody PW, McKinley PG (1990) Lime requirement of acidic Queensland soils. I. Relationships between soil properties and pH buffer capacity. Soil Research 28, 695-701.
| Crossref | Google Scholar |
Azam G, Gazey C (2021) Slow movement of alkali from surface-applied lime warrants the introduction of strategic tillage for rapid amelioration of subsurface acidity in south-western Australia. Soil Research 59, 97-106.
| Crossref | Google Scholar |
Bache BW (1988) Measurements and mechanisms in acid soils. Communications in Soil Science and Plant Analysis 19(7–12), 775-792.
| Crossref | Google Scholar |
Baldock JA, Grundy MJ, Webb MJ, Wong MTF, Griffin T, Broos K (2009) Building a foundation for soil condition assessment. CSIRO Land and Water. doi:10.25919/5c65acb82caf5
Barton L, Hoyle FC, Grace PR, Schwenke GD, Scanlan CA, Armstrong RD, Bell MJ (2022) Soil nitrogen supply and N fertilizer losses from Australian dryland grain cropping systems. Advances in Agronomy 174, 1-52.
| Crossref | Google Scholar |
Black AS, Sherlock RR, Smith NP, Cameron KC, Goh KM (1985) Effects of form of nitrogen, season, and urea application rate on ammonia volatilisation from pastures. New Zealand Journal of Agricultural Research 28, 469-474.
| Crossref | Google Scholar |
Black AS, Sherlock RR, Smith NP (1987) Effect of urea granule size on ammonia volatilization from surface-applied urea. Fertilizer Research 11, 87-96.
| Crossref | Google Scholar |
Bolan NS, Saggar S, Luo J, Bhandral R, Singh J (2004) Gaseous emissions of nitrogen from grazed pastures: processes, measurements and modelling, environmental implications, and mitigation. Advances in Agronomy 84, 37-120.
| Crossref | Google Scholar |
Coleman NT, Thomas GW (1964) Buffer curves of acid clays as affected by the presence of ferric iron and aluminum. Soil Science Society of America Journal 28, 187-190.
| Crossref | Google Scholar |
Commonwealth Bureau of Meteorology (2018) Recent and historic rainfall maps. Available at http://www.bom.gov.au/climate [Viewed 10 August 2021]
Conyers MK, Helyar KR, Poile GJ (2000) pH buffering: the chemical response of acidic soils to added alkali. Soil Science 165, 560-566.
| Crossref | Google Scholar |
Curtin D, Trolove S (2013) Predicting pH buffering capacity of New Zealand soils from organic matter content and mineral characteristics. Soil Research 51, 494-502.
| Crossref | Google Scholar |
Ernst JW, Massey HF (1960) The effects of several factors on volatilization of Ammonia formed from urea in the soil. Soil Science Society of America Journal 24, 87-90.
| Crossref | Google Scholar |
Ferguson RB, Kissel DE, Koelliker JK, Basel W (1984) Ammonia volatilization from surface-applied urea: effect of hydrogen ion buffering capacity. Soil Science Society of America Journal 48, 578-582.
| Crossref | Google Scholar |
Fillery IRP, Khimashia N (2016) Procedure to estimate ammonia loss after N fertiliser application to moist soil. Soil Research 54, 1-10.
| Crossref | Google Scholar |
Fisk LM, Maccarone LD, Barton L, Murphy DV (2015) Nitrapyrin decreased nitrification of nitrogen released from soil organic matter but not amoA gene abundance at high soil temperature. Soil Biology and Biochemistry 88, 214-223.
| Crossref | Google Scholar |
Gazey C, Andrew J, Griffin E (2013) Soil acidity. In ‘Report card on sustainable natural resource use in agriculture’. (Department of Agriculture and Food: Western Australia) Available at https://www.agric.wa.gov.au [Verified 15 September 2021]
Glibert PM (2017) Eutrophication, harmful algae and biodiversity – challenging paradigms in a world of complex nutrient changes. Marine Pollution Bulletin 124, 591-606 PMID:.
| Crossref | Google Scholar | PubMed |
Harries M, Flower KC, Scanlan CA (2021) Sustainability of nutrient management in grain production systems of south-west Australia. Crop and Pasture Science 72, 197-212.
| Crossref | Google Scholar |
Hutchings N, Webb J, Amon B (2019) Crop production and agricultural soils. In ‘EMEP/EEA emission inventory guidebook 2019’. (Publications Office of the European Union: Luxembourg) https://doi.org/10.2800/293657
IPCC (2006) N2O emissions from managed soils, and CO2 emissions from lime and urea application. In ‘2006 IPCC guidelines for national greenhouse gas inventories. Vol. 4. Agriculture, forestry and other land use’. (Eds HS Eggleston, L Buendia, K Miwa, T Ngara, K Tanabe) pp. 1–54. (IGES: Hayama, Japan)
Izaurralde RC, Kissel DE, Cabrera ML (1987) Titratable acidity to estimate ammonia retention. Soil Science Society of America Journal 51, 1050-1054.
| Crossref | Google Scholar |
Izaurralde RC, Kissel DE, Cabrera ML (1990) Simulation model of banded ammonia in soils. Soil Science Society of America Journal 54, 917-922.
| Crossref | Google Scholar |
Janke C, Fujinuma R, Moody P, Bell M (2021) Biochemical changes and distribution of nitrogen from bands of stabilised N-fertilizers in contrasting soils. Geoderma 382, 114770.
| Crossref | Google Scholar |
Keating BA, Herrero M, Carberry PS, Gardner J, Cole MB (2014) Food wedges: framing the global food demand and supply challenge towards 2050. Global Food Security 3, 125-132.
| Crossref | Google Scholar |
Klimczyk M, Siczek A, Schimmelpfennig L (2021) Improving the efficiency of urea-based fertilization leading to reduction in ammonia emission. Science of The Total Environment 771, 145483 PMID:.
| Crossref | Google Scholar | PubMed |
Ma R, Zou J, Han Z, Yu K, Wu S, Li Z, Zhu-Barker X (2021) Global soil-derived ammonia emissions from agricultural nitrogen fertilizer application: a refinement based on regional and crop-specific emission factors. Global Change Biology 27, 855-867 PMID:.
| Crossref | Google Scholar | PubMed |
Ma Q, Bell R, Scanlan C, Neuhaus A (2022) Long-term rundown of plant-available potassium in Western Australia requires a re-evaluation of potassium management for grain production: a review. Crop & Pasture Science 73, 981-996.
| Crossref | Google Scholar |
Macnack NE, Chim BK, Raun WR (2013) Applied model for estimating potential ammonia loss from surface-applied urea. Communications in Soil Science and Plant Analysis 44, 2055-2063.
| Crossref | Google Scholar |
Ndegwa PM, Vaddella VK, Hristov AN, Joo HS (2009) Measuring concentrations of ammonia in ambient air or exhaust air stream using acid traps. Journal of Environmental Quality 38, 647-653 PMID:.
| Crossref | Google Scholar | PubMed |
Nyord T, Schelde KM, Søgaard HT, Jensen LS, Sommer SG (2008) A simple model for assessing ammonia emission from ammoniacal fertilisers as affected by pH and injection into soil. Atmospheric Environment 42, 4656-4664.
| Crossref | Google Scholar |
Ohnemus T, Spott O, Thiel E (2021) Spatial distribution of urea induced ammonia loss potentials of German cropland soils. Geoderma 394, 115025.
| Crossref | Google Scholar |
O’Toole P, McGarry SJ, Morgan MA (1985) Ammonia volatilization from urea-treated pasture and tillage soils: effects of soil properties. Journal of Soil Science 36, 613-620.
| Crossref | Google Scholar |
Pan B, Lam SK, Mosier A, Luo Y, Chen D (2016) Ammonia volatilization from synthetic fertilizers and its mitigation strategies: a global synthesis. Agriculture, Ecosystems & Environment 232, 283-289.
| Crossref | Google Scholar |
Randive K, Raut T, Jawadand S (2021) An overview of the global fertilizer trends and India’s position in 2020. Mineral Economics 34, 371-384.
| Crossref | Google Scholar |
Sarker JR, Singh BP, Dougherty WJ, Fang Y, Badgery W, Hoyle FC, Dalal RC, Cowie AL (2018) Impact of agricultural management practices on the nutrient supply potential of soil organic matter under long-term farming systems. Soil and Tillage Research 175, 71-81.
| Crossref | Google Scholar |
Schwenke GD, Manning W, Haigh BM (2014) Ammonia volatilisation from nitrogen fertilisers surface-applied to bare fallows, wheat crops and perennial-grass-based pastures on Vertosols. Soil Research 52, 805-821.
| Crossref | Google Scholar |
Smith AP, Johnson IR, Schwenke G, Lam SK, Suter HC, Eckard RJ (2020) Predicting ammonia volatilization from fertilized pastures used for grazing. Agricultural and Forest Meteorology 287, 107952.
| Crossref | Google Scholar |
Sommer SG, Schjoerring JK, Denmead OT (2004) Ammonia emission from mineral fertilizers and fertilized crops. Advances in Agronomy 82, 557-622.
| Crossref | Google Scholar |
Sunderlage B, Cook RL (2018) Soil property and fertilizer additive effects on ammonia volatilization from urea. Soil Science Society of America Journal 82, 253-259.
| Crossref | Google Scholar |
Sutton MA, Moncrieff JB, Fowler D (1992) Deposition of atmospheric ammonia to moorlands. Environmental Pollution 75, 15-24 PMID:.
| Crossref | Google Scholar | PubMed |
Ti C, Xia L, Chang SX, Yan X (2019) Potential for mitigating global agricultural ammonia emission: a meta-analysis. Environmental Pollution 245, 141-148 PMID:.
| Crossref | Google Scholar | PubMed |
Vlek PLG, Fillery IRP, Burford JR (1981) Accession, transformation, and loss of nitrogen in soils of the arid region. Plant and Soil 58, 133-175.
| Crossref | Google Scholar |
Weaver AR, Kissel DE, Chen F, West LT, Adkins W, Rickman D, Luvall JC (2004) Mapping soil pH buffering capacity of selected fields in the coastal plain. Soil Science Society of America Journal 68, 662-668.
| Crossref | Google Scholar |
Wong MTF, Wittwer K (2009) Positive charge discovered across Western Australian wheatbelt soils challenges key soil and nitrogen management assumptions. Soil Research 47, 127-135.
| Crossref | Google Scholar |
Wong MTF, Webb MJ, Wittwer K (2013) Development of buffer methods and evaluation of pedotransfer functions to estimate pH buffer capacity of highly weathered soils. Soil Use and Management 29, 30-38.
| Crossref | Google Scholar |
Zhenghu D, Honglang X (2000) Effects of soil properties on ammonia volatilization. Soil Science and Plant Nutrition 46, 845-852.
| Crossref | Google Scholar |