

Predicting Octanol–Water Partition Coefficients of Fluorinated Drug-Like Molecules: A Combined Experimental and Theoretical Study
Ying Min Wu A , Yuvixza Lizarme Salas A , Yun Cheuk Leung A , Luke Hunter A B and Junming Ho A B
A B
A School of Chemistry, University of New South Wales, Sydney, NSW 2052, Australia.
B Corresponding authors. Email: l.hunter@unsw.edu.au; junming.ho@unsw.edu.au
Australian Journal of Chemistry 73(8) 677-685 https://doi.org/10.1071/CH19648
Submitted: 13 December 2019 Accepted: 6 February 2020 Published: 14 May 2020
Journal Compilation © CSIRO 2020 Open Access CC BY-NC
Abstract
In this paper, a dataset of 11 fluorinated compounds containing a variety of functional groups (amides, esters, indoles, and ethers) as well as mono, gem-difluoro, erythro-difluoro, and threo-difluoro patterns were synthesised and their octanol–water partition coefficients (log P) were measured using a shake-flask method. The resulting data was used to assess the performance of several popular empirical fragment-based methods as well as quantum chemical implicit solvent models (SMD and SM12). Overall, the empirical miLOGP, ALOGPS, and ALOGP methods performed the best with a mean absolute deviation (MAD) of ~0.25 log units, while the best performing implicit solvent model SMD has a slightly higher MAD of 0.36 log units. Based on the present work and previous studies, the miLOGP and ALOGP empirical methods are recommended for fast and moderately accurate prediction of log P for neutral organic solutes.
Introduction
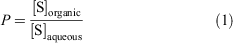
Lipophilicity refers to the tendency of a compound to partition into a non-polar organic phase compared with an aqueous phase. Therefore, it is an important physicochemical parameter for any drug molecule as it has many implications in drug solubility, bioavailability, and toxicity. The lipophilicity of a drug can directly affect its absorption, distribution, metabolism, and excretion (ADME) pathways in the body and is therefore a key consideration in the overall pharmacokinetic profile. The most common quantitative measure of lipophilicity is the partition coefficient P (usually expressed as the logarithm log P) where P represents the ratio of concentrations of a solute (S) in two immiscible or partially miscible solvents (Eqn 1). The 1-octanol and water system is traditionally used as 1-octanol is considered to be an effective mimic of the phospholipid membrane.[1]
The log P value of a compound is commonly used in medicinal chemistry and pharmacology as one of a set of properties that can predict oral bioavailability. Lipinski’s ‘rule of five’ states that the log P should be in the range of 0–5 if the drug is to have a chance of being orally absorbed.[2] As such, an accurate estimation of log P is central to the discovery and development of successful drug molecules. It should be noted that because many drug molecules contain ionisable groups, the lipophilicity of these compounds are better described by the distribution coefficient log D, which also accounts for all ionised and neutral species at a given pH.
In addition to the standard shake flask method, there are various other techniques including photometry, gas chromatography (GC), high-performance liquid chromatography (HPLC), and NMR spectroscopy for the measurement of log P.[3,4] An advantage of chromatographic techniques is that they can be automated for high-throughput applications. This approach requires a calibration curve where the relationship between log P and retention time is known.[5] A key underlying assumption in this approach is that the intermolecular interactions that contribute to retention in the column is similar to those responsible for 1-octanol and water partition; this may not always be the case.[6] Furthermore, many of these methods rely on UV-vis detection which hampers the measurements of non-UV active compounds.
Despite the availability of different approaches to measuring log P, the number of compounds for which log P measurements are needed is significantly higher compared with the available experimental log P data.[2] As noted above, this is due in part to the fact that experimental determination of log P normally entails synthesis, purification, and are less straightforward for non-UV-active and sparingly soluble compounds.[7,8] As such, computational prediction of log P values represents an attractive alternative to experiment. Currently, the most popular methods for fast log P predictions are empirical fragment-based approaches. These models consider the molecule as a collection of atoms or functional groups, and the overall log P is assembled from a pre-determined contribution from each fragment. Typically, these contributions are determined from fitting to experimental data and empirical fragment-based methods differ in terms of the method used for fitting to experimental data (e.g. linear regression, neural networks), size and diversity of the training set, and size of the fragments.[9] These empirical methods are highly efficient and they are usually available to users through free-to-use servers such as Molinspiration,[10] SwissADME,[11,12] and VCClab.[13]
Other commonly used computational methods include physics-based solvent models, which can be further categorised into implicit and explicit solvent models. These models work by calculating the transfer free energy (ΔGtransfer) between water and 1-octanol which is related to the log P as shown in Eqn 2:
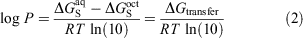
where ΔGS refers to the solvation free energy of the solute. In implicit solvent models, the solute is placed inside a molecule-shaped cavity embedded in a polarisable dielectric medium that represents the solvent in an averaged and structure-less manner.[14,15] These models contain parameters, e.g. atomic radii used to construct the cavity, which have been optimised at relatively modest levels of theory to reproduce experimental data. For this reason, they are computationally efficient and moderately accurate across a broad range of neutral solutes. On the other end of the spectrum, explicit solvent models involve simulation of the solute in a periodic box of solvent molecules whereby the solute, solvent degrees of freedom, and their interactions are modelled explicitly.[16–18] While these are usually carried out using molecular mechanics force fields, these models still come with a significant increase in computational time and resources compared with implicit solvent models.[19]
All three classes of methods, particularly fragment-based methods, have been widely used for the prediction of log P, although direct comparisons of these methods on a common dataset is relatively scarce. Recent work by the Ho and Spoel groups have indicated that empirical methods perform unexpectedly well, even when applied to relatively ‘exotic’ molecules outside of their training set,[20,21] and that their performance are comparable if not superior to physics-based implicit and explicit solvent models. Similar observations were made in the very recent SAMPL6 Partition Coefficient Challenge where several empirical methods ranked highly in this challenge.[22]
The focus in this paper is to assess the performance of empirical fragment-based and physics-based QM implicit solvent models for predicting the log P of fluorinated drug-like molecules. This is particularly important in medicinal chemistry because fluorination is often used as a strategy to improve the biochemical properties of drug candidates.[23–25] While the effects of fluorination on lipophilicity using simple model compounds is well understood, the link between fluorination and lipophilicity for more complex and conformationally flexible molecules is less straightforward. Notably, the presence of other polar functional groups such as hydroxy and carbonyl groups can significantly change the overall polarity.[26] Müller et al. have identified flaws with existing generalised rules for predicting the effect of fluorination on log P, and have instead identified two competing effects that influence lipophilicity, such as changes in polarity (as the C–F bond is highly polarised) and the hydrophobicity of the surface (non-polarisable fluorine atoms).[27] To this end, this paper reports the synthesis and shake-flask log P measurements of a library of flexible molecules with diverse fluorination patterns. This information is used to benchmark a range of computational models with the view to identifying a robust method for the log P prediction of novel fluorinated compounds.
Results and Discussion
Dataset and Synthesis
A library of 11 fluorinated compounds containing a variety of scaffold structures and fluorination patterns is shown in Fig. 1. All of these compounds were secured through chemical synthesis. Some of the library compounds (i.e. M1–M6) were prepared specifically for this project; see Experimental. The other library compounds (i.e. LT1, LT2, LE1, IT1, IE1) were available in-house from a separate research project on bacterial quorum sensing inhibition,[28] the details of which will be reported elsewhere.

|
Experimental log P Measurements
The shake-flask and 19F NMR method developed by Linclau et al. was used to determine the log P values for the compounds in this study.[29] This method has several advantages, notably the compensation effect of the determination of a ratio, where systematic errors are eliminated (see experimental details) and there is no requirement to control the absolute amounts of material or NMR aliquot volumes. Also, analytes can in principle be investigated even if they are only minor components of mixtures, assuming that the solutions are ideal.
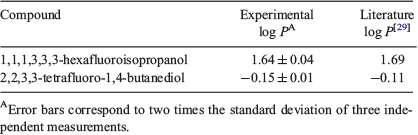
The protocol and data processing reported by Linclau et al. goes to sophisticated lengths to optimise the NMR method and ensure excellent repeatability (± 0.01 log units).[29] However, these careful parameters may not be practical or efficient for chemists seeking fast acquisition and results. We tested a modified procedure which involved a shorter partitioning time (stir and settle for 1 h each) and employed routine NMR acquisition parameters. This potential time-saving method was tested in triplicate with two literature compounds with known log P values: 1,1,1,3,3,3-hexafluoroisopropanol and 2,2,3,3-tetrafluoro-1,4-butanediol. The fluorinated internal standard used for these log P calculations was 2,2,2-trifluoroethanol (TFE). The experimental log P values were determined (Table 1) and the results indicate that the modified technique is valid and has good reproducibility, albeit with a slightly larger error compared with the original protocol. The effect of the number of NMR scans (NS) was also investigated, and minimal difference in log P (±0.01 log units) was observed between 128 and 256 scans by 19F{1H} NMR spectroscopy. Therefore, these control tests indicate that our ‘accelerated’ procedure is capable of reproducing literature values to within 0.05 log units while significantly reducing the time needed for the log P measurements.
|
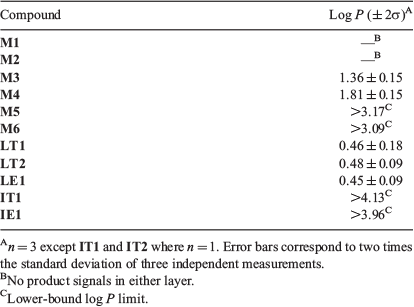
Having established an efficient and reproducible method for log P measurement, this procedure was applied to the collection of 11 fluorinated molecules (Fig. 1) and the data is presented in Table 2. It was not possible to obtain a measurement for aldehydes M1 and M2 presumably because the aldehydes reacted with water during partitioning; however, any distinct 19F signals from this could not be identified.
|
For M5, M6, IT1, and IE1, it was also not possible determine an exact log P because these compounds were only observable in the organic layer. While the simplified NMR method used in this project reduces valuable spectrometer time, it may limit the detection for very lipophilic or hydrophilic compounds. Therefore, the measureable log P window is smaller than reported in the literature. Linclau et al. report that this method is valid for compounds with log P values ± ~3, with the maximum log P measured in the study being 3.21 log units employing 32768 scans with no replicates.[29] This indicates that detection of highly lipophilic compounds by 19F NMR spectroscopy is difficult under even carefully optimised conditions. Therefore, it is concluded that the Linclau technique may not applicable for very lipophilic compounds including M5, M6, IT1, and IE1.
In order to get a lower-bound value (i.e. the lowest possible log P value for M5, M6, IT1, and IE1), the limit of detection was determined for the specific NMR instrument. Serial dilutions of the reference compound TFE in water were conducted, simulating the shake-flask water layer. Each dilution was measured with the same NMR parameters (NS = 256) and aliquot volumes (0.4 mL in 0.1 mL acetone-d6). The limit of detection where no TFE resonance was observed by NMR analysis was concluded to be 1.37 × 10⁻⁵ mmol mL−1. Since TFE contains three chemically equivalent fluorine atoms and the shake-flask protocol uses 2 mL of water, this was taken into account and the limit of detection of M5 and M6 was determined to be 9.15 × 10⁻⁶ mmol mL−1. With this detection limit determined, ρaq could be inferred (see experimental details) and used to calculate the lower-bound log P values of 3.17, 3.09, 4.13, and 3.96 for M5, M6, IT1, and IE1 respectively. An assumption made in this step is that the intensities of signals in 19F NMR spectra correspond exactly to the relative number of fluorine atoms that are responsible for said signals.
Experimental log P values for M3 and M4 were determined to be 1.36 ± 0.15 and 1.81 ± 0.15 respectively (Table 2). The large error bars for these two measurements can be attributed to the poor signal to noise ratio (S/N) in the water layers, which caused difficulty when integrating signals. The recommended S/N for quantitative analysis is recommended to be above 300 : 1;[29] however, both water layers of M3 and M4 were significantly below this (~70 : 1 on average). Comparing M3 and M4, it can be seen that incorporating a second fluorine atom increases the log P by 0.45 log units. This is consistent with the results of Linclau et al. who compared several monofluorinated compounds with the analogous gem-difluorinated compounds and found that the addition of the second fluorine generally increased the log P by between 0.19 to 0.48 log units.[26,27,29] Müller et al. have rationalised this trend using vector analysis (Fig. 2): adding a second fluorine atom gives a fairly modest increase in polarity since the two C–F dipoles are not parallel, and counteracting this increase in dipole is a larger molecular volume which makes the surface more hydrophobic overall.[27]
|
Finally, the three lactone diastereomers (LT1, LT2, and LE1) were found to have log P values that are very similar to one another (Table 2), suggesting that the lipophilicity is not strongly affected by the fluorine stereochemistry in this scaffold.
Definition of an Acceptable Error Margin
Before we examine the computational calculations, it is important to first define what is considered an acceptable error margin for the computational models. As noted in Eqn 2, the log P is related to the transfer free energy which is simply the difference in solvation free energies in 1-octanol and water. Typically, implicit solvent models can predict the solvation free energies of neutral solutes in aqueous and organic solvents to within 5 kJ mol−1 of experiment[30,31] so the transfer free energy is estimated to have an error bar of no less than 10 kJ mol−1 or 1.75 log units at room temperature. However, a recent study by one of us has found that many implicit solvent models incur errors of the same sign in both solvents which means there should be some cancellation of errors in the calculated transfer free energy.[20] In particular, the mean absolute error in calculated transfer free energies and the standard deviation in the error were ~1.94 and 1.67 kJ mol−1 respectively, averaged over five different implicit solvent models. If we assume the error is normally distributed, then the error is ~1.94 ± 3.34 kJ mol−1 based on the 95 % confidence interval (2σ). Thus, the 5.28 kJ mol−1 should be considered as the upper boundary of the error margin for implicit solvent models and this translates to ~1 log unit. Finally, we note that the errors in empirical models are typically estimated through cross-validation studies and will vary between models. For this reason, we define 1 log unit to be the acceptable error margin for all models.
Conformational Searches
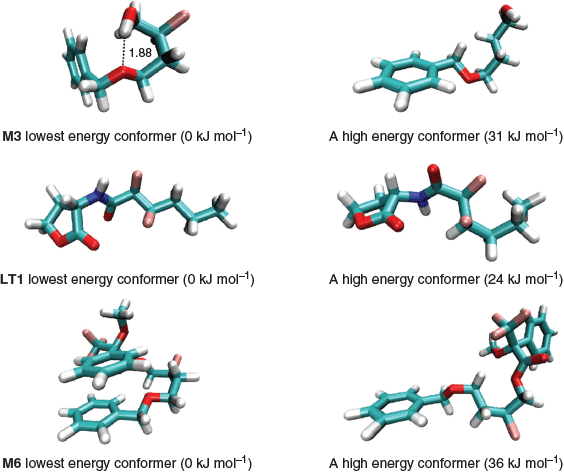
The compounds in Fig. 1 are conformationally flexible and systematic conformer searches were carried out to locate their lowest energy conformers in water and 1-octanol using the SMD implicit solvent model. This entails the consideration of all rotatable bonds in the molecule and generating a pool of conformers by rotating about these bonds at 120° or 180° resolution. Generated conformers that result in two or more short inter-atomic distances are removed and the rest are subject to geometry optimisation at the M06-2X/6-31G(d) level of theory (see Experimental).
This is an important step because the energies of the conformers can span a range as large as 30 kJ mol−1 so choosing the incorrect conformer may introduce an error of more than 5 log units in the calculated log P. This is because a 6 kJ mol−1 error in ΔGtransfer (see Eqn 2) translates to an error of 1 log unit at 298 K. In most cases, the implicit solvent calculations predict that the molecules adopt the same lowest energy conformer in water and in 1-octanol, and Fig. 3 depicts the lowest energy conformer and a high energy one for M3, M6, and LT1. As shown, the lowest energy conformers are typically characterised by intramolecular hydrogen bonding or aromatic π-stacked interactions and it is not always straightforward to predict the lowest energy conformers on the basis of chemical intuition. In this work, all log P calculations are based on the lowest energy conformer located in the respective phases. This approach is a good approximation to Boltzmann averaging over energetically low-lying conformers because the Boltzmann average will be dominated by the lowest energy conformer. To illustrate this point, we considered a hypothetical molecule with Nconf and Nconf’ number of conformers in 1-octanol and water respectively. Eqn 3 shows the Boltzmann average for the solution phase energies in 1-octanol and water and the transfer free energy can be calculated from the difference in the two averaged energies. In the extreme case where all Nconf and Nconf’ conformers were degenerate, the error of not performing a Boltzmann average is at most RTln(Nconf’/Nconf). Thus, it is reasonable to base the log P calculation using lowest energy conformers in the respective phases.
|
Error: Incorrect filename or format (CH19648_E3.gif). Please check out
Assessment of Computational Methods
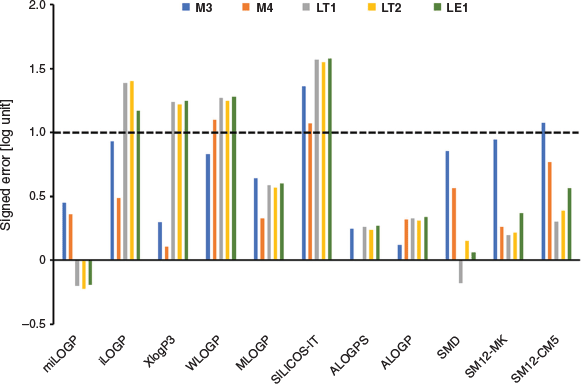
For the dataset of 11 molecules, theoretical values of log P were obtained using both empirical fragment-based methods and QM implicit solvent models. These values are provided in Table 3, while Fig. 4 presents the signed error in the calculations for the five compounds with well defined log P measurements. As shown, the best performing empirical methods are miLOGP, ALOGPS, and ALOGP where the deviations are consistently below 0.5 log units. Interestingly, XLOGP3, which was previously identified as a reasonably robust method for predicting the log P of simple fluorinated compounds,[20–22] displayed a mean absolute deviation (MAD) of 0.82 and maximum absolute deviation (ADmax) of 1.25 log units, which is beyond the acceptable error range. This highlights one of the limitations of empirical methods as their performance can be less predictable when they are applied to molecules dissimilar to those in their training set, e.g. conformationally flexible fluorinated molecules. Furthermore, these methods (with the exception of iLOGP) cannot differentiate between diastereomers but this is normally not a problem because the difference in log P for stereoisomers are generally well within our defined error margin. Nonetheless, we note that miLOGP, ALOGPS, and ALOGP were also previously found to perform very well in the prediction of log P of relatively smaller organic molecules, and it is encouraging that these models retain a similar level of accuracy when applied to more complex molecules in this study. Notably, for the 11 protein kinase inhibitor-like small molecules in the SAMPL6 log P challenge, miLOGP and ALOGP scored an MAD of 0.49 and 0.32 log units respectively.[22]

|
|
Of the implicit solvent models, the SMD model performed the best with the lowest MAD value of 0.36 log units, although its maximum absolute deviation is about two times larger than the best performing empirical models. The results here echo the observations from several recent studies where physics-based implicit and explicit solvent models do not necessarily yield more accurate log P predictions compared with empirical models.[20,21] An important consideration when evaluating the performance of empirical models is whether there is significant overlap between the test and training sets. Given that this is the first time experimental log P values have been reported for the novel fluorinated molecules in this study, the miLOGP, ALOGP, and ALOGPS can be considered to be reasonably robust.
Fig. 4 shows the signed errors (calculated minus experiment) for all the models. It is interesting to note that with the exception of miLOGP and SMD, the deviations between calculations and experiment are quite systematic in that the calculations consistently overestimate experimental values, i.e. more positive log P values. An explanation for this observation, at least for the implicit solvent models, is that we have assumed that water and 1-octanol are completely immiscible. This is not necessarily the case, and there have been suggestions that the calculation of solvation free energies in ‘wet’ 1-octanol may improve the calculated log P values.[32,33] This would require explicit solvent simulations or a more sophisticated implicit solvent model such as COSMO-RS[34,35] where the water content in the 1-octanol layer can be varied, and it is of interest to examine the effect of ‘wet’ 1-octanol on the accuracy of calculated log P in the future.
For the compounds with estimated lower-bound log P values (M5, M6, IT1, and IE1), it appears that the calculated log P values are in accord with the experimental observation that these molecules are significantly more lipophilic compared with the other molecules in the dataset. Notably, the predictions by the best performing models (miLOGP, ALOGPS, ALOGP, and SM12-MK) all predict that the log P of these compounds are at least 4 log units (i.e. outside of the reported detection limit for the 19F NMR technique), and the four models agree to within 1 log unit.
Summary and Conclusions
There is currently a bewildering array of log P prediction methods in the literature, especially empirical models that have been trained on very large datasets of experimental data. One of the aims of this work is to identify robust computational methods that can provide relatively accurate and fast estimates of log P for fluorinated drug-like compounds. Using the dataset of 11 fluorinated molecules synthesised in this work, we were able to determine the log P values of five of these compounds (and we made lower-bound estimates of log P for another four compounds). The experimental data was used to validate computational models. To our surprise, three of the empirical fragment-based methods (miLOGP, ALOGPS, and ALOGP) outperformed the physics-based QM implicit solvent models, and were able to predict the log P to within 1 log unit of the experimental values measured in this study. This finding is consistent with our recent work where we assessed the performance of physics-based implicit and explicit solvent models for the log P prediction of more than 90 fluorinated and non-fluorinated organic molecules.[20] When we consider these results collectively, it appears that the ALOGP and miLOGP are reasonably robust empirical methods and are recommended for not only fluorinated compounds but also general neutral organic solutes.
Experimental and Computational Details
General Synthetic Methods
All reactions were performed in oven-dried glassware under a nitrogen atmosphere, unless stated otherwise. All commercial reagents and solvents were used as received. Anhydrous solvents were obtained from a solvent purification system and dried over 4 Å molecular sieves. Purified water was obtained from a Millipore Milli-Q plus system. Solution phase reactions were monitored by TLC using Merck aluminium backed silica gel 60 F254 (0.2 mm) TLC plates. TLC spots were visualised under short-wave UV light (254 nm) and potassium permanganate stain. Purification by flash chromatography was performed using Davisil 40–63 mesh silica gel. Eluent systems are quoted as volume-to-volume ratios. NMR spectra were obtained using a Bruker Avance III 300 MHz or 400 MHz with Cryoprobe spectrometer at 298 K unless otherwise stated. 1H, 13C{1H}, 19F, and 19F{1H} NMR spectra were analysed and assigned where possible by Bruker Topspin software and internally calibrated by residual solvent peaks. HRMS results were recorded at the Bioanalytical Mass Spectrometry Facility (BMSF) at UNSW using an Orbitrap LTQ XL ion trap MS in positive or negative ion mode with an electrospray ionisation (ESI) ion source.
(S)-4-(Benzyloxy)-2-fluorobutanal (M1) and 4-(Benzyloxy)-2,2-difluorobutanal (M2)
Step 1: To a solution of oxalyl chloride (0.4 mL, 5.0 mmol) in dry DCM (3.6 mL) at –78°C was added DMSO (0.5 mL, 6.7 mmol). After 20 min, a solution of 4-(benzyloxy)butan-1-ol (0.5 g, 2.8 mmol) in dry DCM (1.2 mL) was added dropwise to the reaction mixture before being left to stir for 2 h at –78°C. Triethylamine (1.6 mL, 11 mmol) was added and the reaction was warmed to room temperature and diluted with DCM (4 mL). The organic layer was washed with saturated NH4Cl solution (5 mL) and water (3 × 5 mL), dried over MgSO4, filtered, and concentrated under reduced pressure. The crude product was purified by flash chromatography eluting with hexane/EtOAc (85 : 15) to yield 4-(benzyloxy)butanal as a green oil (2.21 g, 71 %). δH (400 MHz, CDCl3) 9.78 (t, J 1.6, 1H, CHO), 7.37–7.27 (m, 5H, ArH), 4.49 (s, 2H, PhCH2), 3.51 (t, 2H, J 6.0, BnOCH2), 2.55 (dt, J 7.1, 1.5, 2H, CH2CHO), 1.95 (q, J 13.2, 7.1, 2H, CH2CH2CHO). δC (100 MHz, CDCl3) 202.3 (CHO), 138.3 (ArCquat), 128.4 (meta-ArC), 128.4 (para-ArC), 127.6 (ortho-ArC), 73.0 (PhCH2), 69.2 (BnOCH2), 41.0 (CH2CHO), 22.6 (CH2CH2CHO); spectroscopic data in accordance with literature values.[36]
Step 2: A solution of 4-(benzyloxy)butanal (200 mg, 1.12 mmol) and (S)-α,α-bis[3,5-bis(trifluoromethyl)phenyl]-2-pyrrolidinemethanol trimethylsilyl ether[37] (6.5 mg, 0.011 mmol) in methyl tert-butyl ether (MTBE) (1.5 mL) was stirred at room temperature for 15 min. N-Fluorobenzenesulfonimide (NFSI) (233 mg, 0.748 mmol) was then added and the reaction mixture stirred at room temperature for 6 h. Pentane (6 mL) was then added and the white precipitate was filtered off. The filtrate was concentrated under a stream of N2 gas to yield a mixture of the title compounds as a yellow oil (90 mg). Data for M1: δF (376 MHz, CDCl3) –203.1 (m, 1F). δF,H (376 MHz, CDCl3) –203.1 (s, 1F). Data for M2: δF (376 MHz, CDCl3) –109.2 (m, 2F). δF,H (376 MHz, CDCl3) –109.2 (s, 2F).
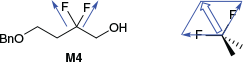
(S)-4-(Benzyloxy)-2-fluorobutan-1-ol (M3) and 4-(Benzyloxy)-2,2-difluorobutan-1-ol (M4)
A mixture of M3 and M2 (200 mg) was dissolved in MeOH (6 mL) and cooled to 0°C. NaBH4 (113 mg, 2.99 mmol) was added in portions, and the mixture was stirred at room temperature for 30 min. The reaction was quenched with KHSO4 (1 M, 5 mL) and extracted with diethyl ether (3 × 5 mL). The combined organic layers were washed with water, dried over MgSO4, filtered, and concentrated under vacuum. The crude product was purified by flash chromatography eluting with hexane/EtOAc (95 : 5 → 9 : 1). Data for M3: yellow oil (50.6 mg, 23 % over two steps from 4-(benzyloxy)butanal, 97 % ee); [α]D −21.0 (c 0.0045, MeOH). νmax (neat)/cm−1 2919, 2853, 1736, 1280, 1171, 1031. δH (400 MHz, CDCl3) 7.38–7.27 (m, 5H, ArH), 4.86–4.68 (dm, 1H, 3JHF 48.9, CHF), 4.52 (s, 2H, PhCH2), 3.80–3.57 (m, 4H, 2 × CH2), 2.07–1.86 (m, 4H). δC (100 MHz, CDCl3) 137.9, 128.5 (d, J 3.03), 127.8, 127.7, 91.9 (d, J 170), 73.2 (d, J 13.0), 70.4, 65.6 (d, J 6.0), 64.8 (d, J 22.3), 62.8, 31.6 (d, J 20.6), 30.2, 26.7. δF (376 MHz, CDCl3) –190.6 (m, 1F). δF,H (376 MHz, CDCl3) –190.6 (s, 1F). m/z (ESI, +ve) 221.0957; C11H15FO2Na+ [M+Na+] requires 221.0954. Data for M4: light yellow oil (11.9 mg, 5 % over two steps from 4-(benzyloxy)butanal). δF (376 MHz, CDCl3) –104.3 (m, 2F). δF,H (376 MHz, CDCl3) –104.3 (s, 2F).
(S)-4-(Benzyloxy)-2-fluorobutyl-(S)-3,3,3-trifluoro-2-methoxy-2-phenylpropanoate (M5)
To a stirred solution of M3 (10 mg, 50 µmol) in DCM (0.8 mL) was added (S)-α-methoxy-α-trifluoromethylphenylacetic acid (36.6 mg, 156 µmol), N,N′-Dicyclohexylcarbodiimide (DCC) (323 mg, 156 µmol), and 4-dimethylaminopyridine (DMAP) (19 mg, 156 µmol). The solution was then stirred for 3 days at room temperature and monitored by 19F NMR spectroscopy until full conversion was observed. The residual solid was filtered off and the solvent evaporated to yield crude M5 (3 mg). δF (376 MHz, CDCl3) –71.6 (s, CF3), –189.0 (m, CHF). δF,H (376 MHz, CDCl3) –71.6 (s, CF3), –188.9 (s, CHF M5).
(S)-4-(Benzyloxy)-2-fluorobutyl-(R)-3,3,3-trifluoro-2-methoxy-2-phenylpropanoate (M6)
To a stirred solution of M3 (10 mg, 50 µmol) in DCM (0.8 mL) was added racemic α-methoxy-α-trifluoromethylphenylacetic acid (36.6 mg, 156 µmol), DCC (323 mg, 156 µmol), and DMAP (19 mg, 156 µmol). The solution was then stirred for 10 days at room temperature and monitored by 19F NMR spectroscopy until full conversion. The residual solid was filtered off and the solvent evaporated to yield a mixture of M5 and M6 (3 mg). Data for M6: δF (376 MHz, CDCl3) –189.0 (m). δF,H (376 MHz, CDCl3) –189.1 (s, CHF).
Experimental Measurement of log P
For the library of 11 compounds, experimental log P values were determined through the shake-flask method developed by Linclau and co-workers with slight alterations.[29] Thus, the compound of interest (1–15 mg) and 2,2,2-trifluoroethanol (1–10 mg) were dissolved in 1-octanol (2 mL) and water (2 mL). The resulting biphasic mixture was stirred at room temperature for 1 h and left to settle for 1 h. An aliquot (0.4 mL) from each layer was transferred to two NMR tubes. Acetone-d6 (0.1 mL) was added to each tube, and the 19F{1H} NMR spectrum of each solution was recorded using a Bruker Avance III 300 MHz or 400 MHz instrument with 128 or 256 scans. Standard NMR data processing techniques such as zero filling, phasing, and baseline correction were applied appropriately.
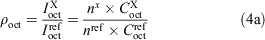
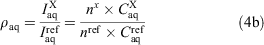
The integration peaks of compound of interest (X) and reference (ref) were determined for each phase to give the ratios ρoctanol and ρwater (Eqn 4a). These ratios correspond to the concentrations (C) in the respective layers. If the peaks represented a different number (n) of fluorine substituents, then a correction factor was applied (Eqn 4b).
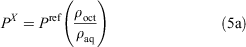
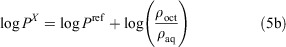
The ratio of the ρoct and ρaq values are equal to the ratio of the respective partition coefficient (P) values (Eqn 5a). Finally, the log P value of the unknown compound can be obtained by adding the logarithm of the ratio of the measured ρ values to the literature log P value of the reference compound (Eqn 5b).
Computational Details
A range of fragment-based approaches were used to calculate the log P, each with different methods and training sets. A brief description of each method used is given below.
miLOGP
This is a fragment-based approach developed by Molinspiration in 2005.[10] This method calculates log P from the sum of group or fragment contributions and correction factors. The training set contains over 12000 mostly drug-like molecules.
iLOGP
This is an implicit log P method developed by Daina and co-workers in 2014.[11,12,38] iLOGP is a physics-based method and hence is considered an implicit solvent model that has been trained on over 17550 molecules.
XLOGP3
This is an atom-based method developed by Cheng and co-workers in 2007.[11,12,39] XLOGP3 is an additive model which uses a total of 87 atom or group types and two correction factors as descriptors. It is calibrated on a training set of 8199 organic compounds through linear regression analysis.
WLOGP
WLOGP is an atom-based method developed by SwissADME based on the fragmental system developed by Wildman and Crippen.[11,12] The training set contains 9920 molecules and 68 atomic contributions.
MLOGP
This is a topological method developed by Moriguchi in 1992.[2,11,12] This model involves 13 parameters describing the topology of the molecular structure and a regression constant. This model was trained on 1230 molecules with experimental log P values.
SILICOS-IT
This is a hybrid fragment/topological approach developed by Silicos-it and available on SwissADME.[11,12] The descriptors are obtained from least-squares fitting against 23455 molecules from the PHYSPROP database.
ALOGPS
This is a topological approach developed by Tetko and co-workers in 2001.[13,40] The model uses 75 electro-topological state indices which are used in a group contribution manner and neural network modelling. The training set consists of 12908 molecules from the PHYSPROP database.
ALOGP
This is an atom-based approach developed by Ghose and Crippen in 1986.[41,42] This method was trained on 893 molecular structures.
All QM implicit solvent models were applied at the levels of theory that are consistent with their parameterisation. The SMD, SM12-MK, and SM12-CM5 solvation free energies were obtained at the M062X/6-31G(d) level of theory. Geometry optimisation and systematic conformer searches were carried out to locate the global minimum energy conformer in 1-octanol and water simulated using the SMD model. The SM12-MK and SM12-CM5 values were obtained from single-point calculations on the lowest energy conformer found from SMD geometries. Vibrational analysis confirmed that all optimised geometries have zero imaginary frequencies and are true minimum energy structures. SMD electronic structure calculations and geometry optimisations were carried out using the Gaussian16[43] program, while SM12 calculations were performed using QChem5.2.[44]
Supplementary Material
M06-2X/6-31G(d) Cartesian coordinates of all the lowest energy conformers used to evaluate log P are available on the Journal’s website.
Conflicts of Interest
The authors declare no conflicts of interest.
Acknowledgements
JH thanks the Australian Research Council for funding (DE160100807) and UNSW for a Faculty of Science Research Grant. The authors acknowledge the Australian National Computational Infrastructure, UNSW, Intersect NSW and Pawsey Supercomputing Centre for generous allocation of computing resources.
References
[1] X. Liu, B. Testa, A. Fahr, Pharm. Res. 2011, 28, 962.| Crossref | GoogleScholarGoogle Scholar | 21052797PubMed |
[2] C. A. Lipinski, F. Lombardo, B. W. Dominy, P. J. Feeney, Adv. Drug Deliv. Rev. 1997, 23, 3.
| Crossref | GoogleScholarGoogle Scholar |
[3] M. H. M. Klose, S. Theiner, H. P. Varbanov, D. Hoefer, V. Pichler, M. Galanski, S. M. Meier-Menches, B. K. Keppler, Inorganics 2018, 6, 130.
| Crossref | GoogleScholarGoogle Scholar |
[4] C. Liang, J. Qiao, H. Lian, J. Chromatogr. A 2017, 1528, 25.
| Crossref | GoogleScholarGoogle Scholar | 29103597PubMed |
[5] S. K. Poole, C. F. Poole, J. Chromatogr. B Analyt. Technol. Biomed. Life Sci. 2003, 797, 3.
| Crossref | GoogleScholarGoogle Scholar | 14630140PubMed |
[6] C. F. Poole, A. D. Gunatilleka, S. K. Poole, Adv. Chromatogr. 2000, 40, 159.
| 10740741PubMed |
[7] E. Baka, J. E. A. Comer, K. Takács-Novák, J. Pharm. Biomed. Anal. 2008, 46, 335.
| Crossref | GoogleScholarGoogle Scholar | 18055153PubMed |
[8] J. Alsenz, M. Kansy, Adv. Drug Deliv. Rev. 2007, 59, 546.
| Crossref | GoogleScholarGoogle Scholar | 17604872PubMed |
[9] R. Mannhold, G. I. Poda, C. Ostermann, I. V. Tetko, J. Pharm. Sci. 2009, 98, 861.
| Crossref | GoogleScholarGoogle Scholar | 18683876PubMed |
[10] Molinspiration Cheminformatics, Calculation of Molecular Properties and Bioactivity Score. Available at https://www.molinspiration.com/ (accessed 5 July 2019).
[11] A. Daina, O. Michielin, V. Zoete, Sci. Rep. 2017, 7, 42717.
| Crossref | GoogleScholarGoogle Scholar | 28256516PubMed |
[12] Swiss Institute of Bioinformatics, SwissADME. Available at http://www.swissadme.ch/ (accessed 5 October 2019).
[13] VCCLAB, Virtual Computational Chemistry Laboratory. Available at http://www.vcclab.org/ (accessed 19 October 2019).
[14] C. J. Cramer, D. G. Truhlar, Chem. Rev. 1999, 99, 2161.
| Crossref | GoogleScholarGoogle Scholar | 11849023PubMed |
[15] J. Tomasi, B. Mennucci, R. Cammi, Chem. Rev. 2005, 105, 2999.
| Crossref | GoogleScholarGoogle Scholar | 16092826PubMed |
[16] B. Chen, J. I. Siepmann, J. Am. Chem. Soc. 2000, 122, 6464.
| Crossref | GoogleScholarGoogle Scholar |
[17] N. M. Garrido, A. J. Queimada, M. Jorge, E. A. Macedo, I. G. Economou, J. Chem. Theory Comput. 2009, 5, 2436.
| Crossref | GoogleScholarGoogle Scholar | 26616624PubMed |
[18] M. Soroush Barhaghi, C. Luyet, J. J. Potoff, Mol. Phys. 2019, 117, 3827.
| Crossref | GoogleScholarGoogle Scholar |
[19] R. E. Skyner, J. L. McDonagh, C. R. Groom, T. Van Mourik, J. B. O. Mitchell, Phys. Chem. Chem. Phys. 2015, 17, 6174.
| Crossref | GoogleScholarGoogle Scholar | 25660403PubMed |
[20] V. Kundi, J. Ho, J. Phys. Chem. B 2019, 123, 6810.
| Crossref | GoogleScholarGoogle Scholar | 31343883PubMed |
[21] D. van der Spoel, S. Manzetti, H. Zhang, A. Klamt, ACS Omega 2019, 4, 13772.
| Crossref | GoogleScholarGoogle Scholar | 31497695PubMed |
[22] M. Işık, D. Levorse, D. L. Mobley, T. Rhodes, J. D. Chodera, bioRxiv 2019, 757393.
| Crossref | GoogleScholarGoogle Scholar |
[23] K. L. Kirk, Org. Process Res. Dev. 2008, 12, 305.
| Crossref | GoogleScholarGoogle Scholar |
[24] K. Müller, C. Faeh, F. Diederich, Science 2007, 317, 1881.
| Crossref | GoogleScholarGoogle Scholar | 17901324PubMed |
[25] E. P. Gillis, K. J. Eastman, M. D. Hill, D. J. Donnelly, N. A. Meanwell, J. Med. Chem. 2015, 58, 8315.
| Crossref | GoogleScholarGoogle Scholar | 26200936PubMed |
[26] D. O’Hagan, R. J. Young, Angew. Chem. 2016, 55, 3858.
| Crossref | GoogleScholarGoogle Scholar |
[27] K. Müller, Chim. Int. J. Chem. 2014, 68, 356.
| Crossref | GoogleScholarGoogle Scholar |
[28] Y. L. Salas, Stereoselective Fluorination as a Conformational Tool in a Series of Structurally Related Bioactive Molecules 2019, Ph.D. thesis, UNSW Sydney, Australia.
[29] B. Linclau, Z. Wang, G. Compain, V. Paumelle, C. Q. Fontenelle, N. Wells, A. Weymouth-Wilson, Angew. Chem. Int. Ed. 2016, 55, 674.
| Crossref | GoogleScholarGoogle Scholar |
[30] C. J. Cramer, D. G. Truhlar, Acc. Chem. Res. 2008, 41, 760.
| Crossref | GoogleScholarGoogle Scholar | 18512970PubMed |
[31] A. Klamt, B. Mennucci, J. Tomasi, V. Barone, C. Curutchet, M. Orozco, F. J. Luque, Acc. Chem. Res. 2009, 42, 489.
| Crossref | GoogleScholarGoogle Scholar | 19222200PubMed |
[32] B. Chen, J. Ilja Siepmann, J. Phys. Chem. B 2006, 110, 3555.
| Crossref | GoogleScholarGoogle Scholar | 16494411PubMed |
[33] S. A. Best, K. M. Merz, C. H. Reynolds, J. Phys. Chem. B 1999, 103, 714.
| Crossref | GoogleScholarGoogle Scholar |
[34] A. Klamt, G. Schüürmann, J. Chem. Soc., Perkin Trans. 2 1993, 799.
| Crossref | GoogleScholarGoogle Scholar |
[35] A. Klamt, Wiley Interdiscip. Rev. Comput. Mol. Sci. 2018, 8, 1.
| Crossref | GoogleScholarGoogle Scholar |
[36] J. R. Frost, C. M. Pearson, T. N. Snaddon, R. A. Booth, R. M. Turner, J. Gold, D. M. Shaw, M. J. Gaunt, S. V. Ley, A. Callipeltosides, Chem. – Eur. J. 2015, 21, 13261.
| Crossref | GoogleScholarGoogle Scholar | 26230615PubMed |
[37] M. Marigo, D. Fielenbach, A. Brauntonn, A. Kjærsgaard, K. A. Jorgensen, Angew. Chem. Int. Ed. 2005, 44, 3703.
| Crossref | GoogleScholarGoogle Scholar |
[38] A. Daina, O. Michielin, V. Zoete, J. Chem. Inf. Model. 2014, 54, 3284.
| Crossref | GoogleScholarGoogle Scholar | 25382374PubMed |
[39] T. Cheng, Y. Zhao, X. Li, F. Lin, Y. Xu, X. Zhang, Y. Li, R. Wang, L. Lai, J. Chem. Inf. Model. 2007, 47, 2140.
| Crossref | GoogleScholarGoogle Scholar | 17985865PubMed |
[40] I. V. Tetko, V. Y. Tanchuk, J. Chem. Inf. Comput. Sci. 2002, 42, 1136.
| Crossref | GoogleScholarGoogle Scholar | 12377001PubMed |
[41] A. K. Ghose, V. N. Viswanadhan, J. J. Wendoloski, J. Phys. Chem. A 1998, 102, 3762.
| Crossref | GoogleScholarGoogle Scholar |
[42] MarvinSketch 18.16.0 2018 (ChemAxon: Boston, MA).
[43] M. J. Frisch, G. W. Trucks, H. B. Schlegel, G. E. Scuseria, M. A. Robb, J. R. Cheeseman, G. Scalmani, V. Barone, G. A. Petersson, H. Nakatsuji, X. Li, M. Caricato, A. V. Marenich, J. Bloino, B. G. Janesko, R. Gomperts, B. Mennucci, H. P. Hratchian, J. V. Ortiz, A. F. Izmaylov, J. L. Sonnenberg, D. Williams-Young, F. Ding, F. Lipparini, F. Egidi, J. Goings, B. Peng, A. Petrone, T. Henderson, D. Ranasinghe, V. G. Zakrzewski, J. Gao, N. Rega, G. Zheng, W. Liang, M. Hada, M. Ehara, K. Toyota, R. Fukuda, J. Hasegawa, M. Ishida, T. Nakajima, Y. Honda, O. Kitao, H. Nakai, T. Vreven, K. Throssell, J. A. Montgomery, Jr, J. E. Peralta, F. Ogliaro, M. J. Bearpark, J. J. Heyd, E. N. Brothers, K. N. Kudin, V. N. Staroverov, T. A. Keith, R. Kobayashi, J. Normand, K. Raghavachari, A. P. Rendell, J. C. Burant, S. S. Iyengar, J. Tomasi, M. Cossi, J. M. Millam, M. Klene, C. Adamo, R. Cammi, J. W. Ochterski, R. L. Martin, K. Morokuma, O. Farkas, J. B. Foresman, D. J. Fox, Gaussian 16, Revision C.01 2016 (Gaussian, Inc., Wallingford CT).
[44] Y. Shao, Z. Gan, E. Epifanovsky, A. T. B. Gilbert, M. Wormit, J. Kussmann, A. W. Lange, A. Behn, J. Deng, X. Feng, et al. Mol. Phys. 2015, 113, 184.
| Crossref | GoogleScholarGoogle Scholar |