

Dissolution and solubility of the arsenate–phosphate hydroxylapatite solid solution [Ca5(PxAs1–xO4)3(OH)] at 25°C
Xuehong Zhang A , Yinian Zhu A B , Honghu Zeng A , Dunqiu Wang A , Jie Liu A , Huili Liu A , Meifang Qian A and Liwei Xu AA College of Environmental Science and Engineering, Guilin University of Technology, Jian-Gan Road 12, Guilin 541004, P.R. China.
B Corresponding author. Email: zhuyinian@glite.edu.cn
Environmental Chemistry 8(2) 133-145 https://doi.org/10.1071/EN10102
Submitted: 14 September 2010 Accepted: 13 December 2010 Published: 2 May 2011
Journal Compilation © CSIRO Publishing 2011 Open Access CC BY-NC-ND
Environmental context. Apatites form a large family of minerals and compounds that can incorporate a variety of ions, including arsenate that can substitute for phosphate. Apatites may therefore control the concentration of arsenic in some aqueous environments. This manuscript describes the synthesis and characterisation of the arsenate–phosphate hydroxylapatite solid solution and the solid solution–aqueous solution interaction.
Abstract. Nine different members of the arsenate–phosphate hydroxylapatite solid solution [Ca5(PxAs1–xO4)3(OH)] were prepared and characterised by various techniques, and then dissolution of the synthetic solids was studied at 25°C and pH 2 in a series of batch experiments. The concentrations of aqueous arsenate species increased rapidly at the beginning of the dissolution and reached a steady-state after 480 h. The concentrations of aqueous phosphate species increased very fast initially and reached a peak value within the first hour of dissolution and then declined slowly with time and remained constant after 240–360 h. The solubility of the Ca5(PxAs1–xO4)3(OH) solid solution increased and its stability decreased with an increase in the mole fraction of Ca5(AsO4)3(OH). The dissolution followed or slightly overshot the Lippmann solutus curve, then approached the solutus curve. The Ca5(AsO4)3(OH)-poor solid solution was in equilibrium with the arsenate-rich aqueous solution.
Additional keywords: aqueous solution, evolution, Lippmann diagram, reaction path.
Introduction
Calcium phosphate hydroxylapatite [Ca5(PO4)3(OH)] is a naturally occurring material as a major component of animal bones and teeth.[1] On the industrial front it is being used as luminophosphors and as raw materials for the manufacture of several phosphatic fertilisers.[2,3] Hydroxylapatite shows a high capacity for substitutions of Ca and PO43– by other cations and anions due to its crystal structure and chemical composition,[4] significant among which from the point of view of arsenic poisoning being the substitution of PO43– by AsO43– resulting in the formation of its isomorph, arsenate hydroxylapatite (AsHAP).[5–7]
Arsenic toxicity is a global health problem affecting many millions of people.[8] Occurrences of dissolved arsenic in surface and ground waters and observed adverse health effects have emphasised the need for better understanding of reactions that govern arsenic mobility in the environment.[9] The presence of dissolved phosphate in many natural settings raises the possibility that intermediate compositions between Ca5(PO4)3(OH) and Ca5(AsO4)3(OH) may form in preference to endmember compositions.[9] Arsenic concentrations in phosphate minerals are variable but can reach high concentrations, for example up to 1000 mg kg–1 in apatite.[10] Mining, milling, transporting of phosphate ores, manufacturing of phosphate fertilisers and using phosphate fertilisers containing arsenic are ways in which the workers, public and the environment are exposed to the enhanced natural toxicity hazard of arsenic and other trace metals.[11,12]
Arsenate is isostructural and isoelectronic with phosphate, which may facilitate arsenic(V) removal from water and wastewater using hydroxylapatite.[13] The existing literature confirms the occurrence of this substitution reaction spread over the entire compositional range and can be utilised to throw light on its mechanism to arrive at the possibility of removal of incorporated arsenic.[2] Arsenic sequestration by compound formation produces a low-solubility apatite-like structure of the general form Ca10(AsxPyO4)6(OH)2.[14]
Solid solutions are geochemically and environmentally important because the interaction of dissolved toxic metals with minerals frequently results in the precipitation of metal-bearing solid solutions on the mineral surfaces or in rock or sediment pores. As a result, metals can be removed from natural waters and the thermodynamic properties of these solid solutions have a vital influence on the transport and fate of toxic metals in the environment.[15] Some synthesis experiments at ambient temperatures were conducted to evaluate the conditions of formation and solubilities of different calcium arsenates.[11,16,17] Hydroxylapatite (HAP) is one of the most stable forms of calcium phosphate and exhibits a low solubility (Ksp =10–53.02–10–53.51); however, the solubility of AsHAP [Ca5(AsO4)3(OH)] is significantly greater than that of HAP,[11,18–22] which suggested that phosphate substitution in the arsenate compound could significantly reduce their solubilities.[21–24]
The thermodynamic properties of solid solutions have a vital influence on the transport and fate of toxic metals in the environment. Therefore, a thorough knowledge of the thermodynamics of materials containing mixed crystals allows us to optimise passive and permeable remediation barriers and other environmental technologies.[15] The study of solid solution–aqueous solution (SSAS) systems has garnered much attention from environmental geochemists because they have been demonstrated to play major roles in the mobility of dissolved metals in contaminated environments.[25] Only a few studies have been carried out on the dissolution and stability of the Ca5(PxAs1–xO4)3(OH) solid solutions, for which little information exists in the literature. Consequently, there are insufficient data upon which to assess the true environmental risk of arsenic posed by these minerals.[5]
In the present study, a series of the Ca5(PxAs1–xO4)3(OH) solid solutions (AsPHA) with different P/(P+As) atomic ratios were prepared by a precipitation method. The resulting solid solution particles were characterised by various techniques. This paper reports the results of a study that monitors the dissolution and release of constituent elements from synthetic arsenate-phosphate hydroxylapatite solid solutions using batch dissolution experiments. The SSAS reaction paths are also discussed using the Lippmann diagram to evaluate the potential effect of such solid-solutions on the mobility of arsenic in the environment.
Experimental methods
Solid preparation and characterisation
The experimental details for the preparation of the samples by precipitation were based on the following equation: 5Ca2++3XO43– + OH– = Ca5(XO4)3(OH). Where X = phosphorus or arsenic for the endmembers and (P+As) for the solid solutions.
The Ca5(PxAs1–xO4)3(OH) solid solutions (AsPHA) were synthesised by controlled mixing of a slurry of 100-mL 0.5-M Ca(OH)2 and a solution of 60-mL 0.5-M H3PO4 and H3AsO4, so that a Ca/(P+As) molar ratio in the mixed solution was 1.67. Reagent grade chemicals and ultrapure water were used for the synthesis and all experiments. The amounts of H3PO4 and H3AsO4 were varied in individual syntheses to obtain synthetic solids with different mole fractions of Ca5(PO4)3(OH) (Table 1). The initial solutions were slowly mixed in a covered beaker over a course of 10 min at room temperature (23 ± 1°C). The resulting solution was kept at 70°C and stirred at a moderate rate (100 rpm) using a stirrer bar. After a week, the precipitates were allowed to settle. The resultant precipitates were then washed thoroughly with ultrapure water and dried at 110°C for 24 h.

|
The compositions of the samples were determined. The residual calcium, phosphate and arsenate concentrations in the decanted solutions were analysed to calculate the compositions of the precipitates. In addition, ~10 mg of sample was digested in 20 mL of 1-M HNO3 solution, and then diluted to 100 mL with ultrapure water. It was analysed for Ca and As using a PE Model AAnalyst 700 atomic absorption spectrometer (PerkinElmer, Waltham, MA, USA), phosphate using an ion chromatography (Metrohm 790, Metrohm AG, Herisau, Switzerland) or a PE Lambda 20 UV-visible spectrometer (PerkinElmer). All synthetic solids were characterised by powder X-ray diffraction (XRD) with an X’Pert PRO diffractometer (PANalytical B.V., Almelo, the Netherlands) using Cu Kα radiation (40 kV and 40 mA). The XRD measurements for unit cell parameter calculation were performed within a 2θ range 10–80° with a scanning rate of 0.10° min–1. Crystallographic identification of the synthesised apatites was accomplished by comparing the experimental XRD patterns to standards compiled by the International Center for Diffraction Data (ICDD), which were card #00-009-0432 for hydroxylapatite and #00-033-0265 calcium arsenate hydroxide. The morphology was analysed by scanning electron microscopy (Jeol JSM-6380LV, Japan Electron Optics Ltd., Tokyo). The samples were measured in a form of KBr pellets over the range of 4000–400 cm–1 using a FT-IR spectrophotometer (Nicolet Nexus 470, Thermo Fisher Scientific Inc., Waltham, MA, USA).
Dissolution experiments
Half a gram of the synthetic solid was placed in a 250-mL polypropylene bottle. HNO3 solution (150 mL, 0.01 M) was added into each bottle. The bottles were capped and placed in a temperature-controlled water bath (25°C). Water samples (3 mL) were taken from each bottle on 16 occasions (1 h, 3 h, 6 h, 12 h, 1 day, 2 days, 3 days, 5 days, 10 days, 15 days, 20 days, 30 days, 45 days, 60 days, 90 days, 120 days). After each sampling, the sample volume was replaced with an equivalent amount of ultrapure water. The samples were filtered using 0.20-µm pore diameter membrane filters, transferred into 25-mL volumetric flasks and then diluted with 0.2% HNO3 to the mark. Calcium was analysed by using an atomic absorption spectrometer and phosphate using ion chromatography. After 2880-h dissolution, the solid samples were taken from each bottle, washed, dried and characterised using XRD, SEM and FT-IR in the same manner as described above.
Thermodynamic calculations
Associated with each dissolution is an assemblage of solid phases, a solution phase containing dissolved calcium, phosphate, arsenate and a pH value. Assuming equilibrium has been reached, the values of these parameters can be calculated using established theoretical principles.[26,27] In this study, the simulations were performed using PHREEQC (Version 2.15) together with its most complete literature database minteq.v4.dat, which bases on the ion dissociation theory. The input is free-format and uses order-independent keyword data blocks that facilitate the building of models that can simulate a wide variety of aqueous-based scenarios.[26]
The activities of Ca2+(aq), PO43–(aq), AsO43–(aq), and OH–(aq) were calculated by using PHREEQC. The saturation indexes were also calculated with respect to calcium phosphates and arsenates, such as HAP, AsHAP, Ca8(HPO4)2(PO4)4·5H2O, Ca3(AsO4)2, Ca3(AsO4)2·4H2O, Ca4(OH)2(AsO4)2·4H2O, Ca(H2AsO4)2, CaHAsO4, CaHPO4·2H2O, Ca3(PO4)2 and portlandite.
Results and discussion
Solid characterisations
The composition of the synthetic solid depends on the initial Ca : P : As mole ratio in the starting solution. Results suggest that the crystals were almost the intended composition of Ca5(PxAs1–xO4)3(OH). The relative molar ratios of arsenic to phosphorus for all samples were almost the same as those of raw solutions (Table 1). The atomic Ca/(As+P) ratio was 1.67, which corresponds to a stoichiometric ratio of apatite.[20]
XRD, FT-IR and SEM analyses were performed on the solids before and after the dissolution experiments (Figs 1–3). As illustrated in the figures, the results of the analyses on materials before the dissolution were almost indistinguishable from the following reaction. No evidence of other mineral precipitation was observed in the dissolution experiment.
|
|
|
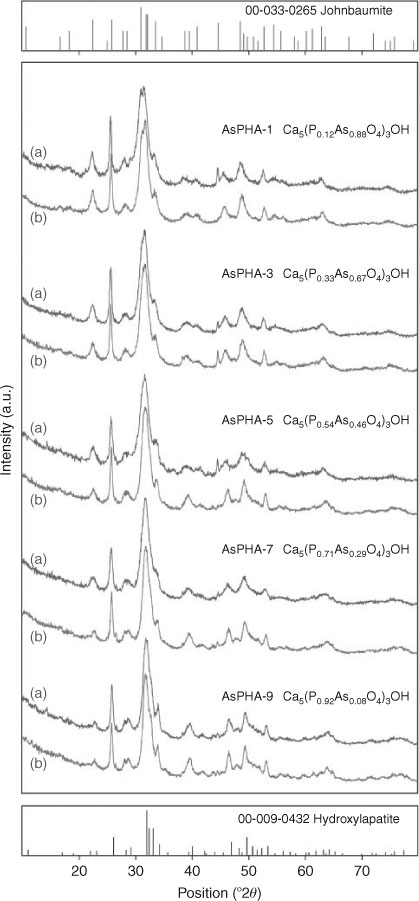
The XRD pattern of the obtained solids indicated the formation of the Ca5(PxAs1–xO4)3(OH) solid solutions, which have the apatite type structure (Fig. 1). They are hexagonal and belong to the space group P63/m.[28] HAP and AsHAP are the two endmembers of a structural family series. When subjected to XRD, they produce the same reflections; but the reflections exist at different two-theta values, i.e. the reflective planes are the same but ‘d’ spacings are different. The incorporation of arsenic in the apatite lattice causes a shift in the ‘d’ spacing.[20] All the compounds have indicated the formation of an apatite phase differing only in reflection location, reflection width and absolute intensity of the diffraction patterns. They show that the obtained crystals consist only of the solid solution phase, which belongs to the apatite type structure. The tetrahedral covalent radius of AsO43– (1.18 Å) being higher than that of PO43– (1.10 Å), the lattice of AsHAP can be supposed to be less firmly bound than that of HAP.[5] The reflection peaks of HAP and AsHAP were slightly different from each other. The reflections of the Ca5(PxAs1–xO4)3(OH) solid solutions shifted gradually to a higher-angle direction when the mole fraction of Ca5(AsO4)3(OH) of the solids decreased.[20]
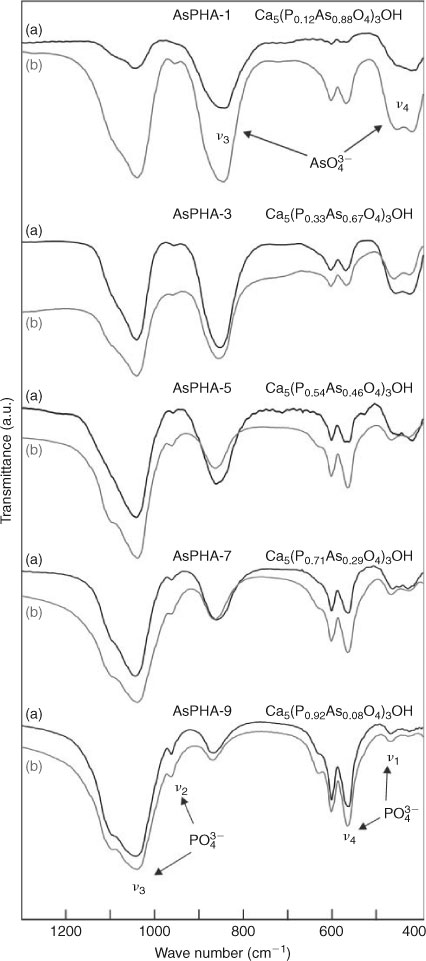
The normal modes of the tetrahedral phosphate ion are: v1, symmetric P–O stretching; v2, OPO bending; v3, P–O stretching; and v4, OPO bending.[29] The infrared spectra of prepared white powders are shown in Fig. 2. The fundamental vibrational modes of PO43– tetrahedra of apatite phase are witnessed in the region at 960–962 cm–1 (ν2), 1036–1041 cm–1 (ν3), 564–571, 602–605 cm–1 (ν4) and 468–471 cm–1 (ν1). The peaks of AsO43– appeared at 842–876 cm–1 (ν3) and 422–432 cm–1 (ν4). The location of the phosphate peaks and the arsenate peaks was noted for the whole series of substituted apatites. The peaks of AsO43– increased and the peaks of PO43– decreased with increasing the As content of samples, i.e. the area of the phosphate peak being gradually suppressed and that of the arsenate peak increased as the proportion of the arsenate increased.[20]
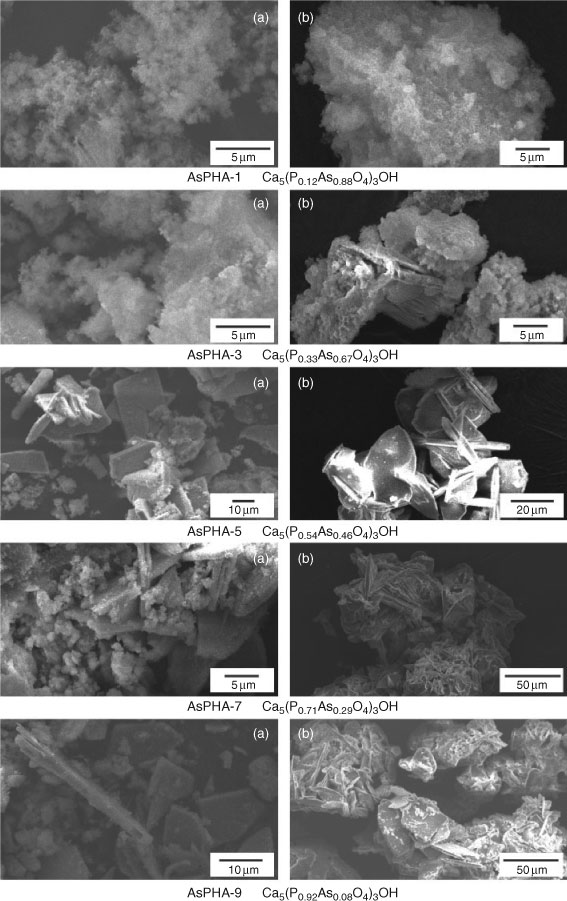
As shown in Fig. 3, SEM observation indicated the solids with high mole fraction of Ca5(AsO4)3(OH) between 0.46 and 1.0 were typically fine crystals (particle size <2 µm). The crystal size obtained in these experiments increases with decreasing mole fraction of Ca5(AsO4)3(OH) in the solid solution. With the mole fraction of Ca5(AsO4)3(OH) between 0 and 0.46, the apatites were large tabular crystals (particle size >10 µm), which do not show the hexagonal or rod shape of the crystals characteristic of apatites.[20]
Evolution of aqueous composition
In general, the aqueous concentrations of elements were strongly dependent on the mole fraction of the endmember Ca5(AsO4)3(OH) in the Ca5(PxAs1–xO4)3(OH) solid solution. Because Ca5(AsO4)3(OH) has a higher solubility than Ca5(PO4)3(OH), the higher the mole fraction of Ca5(AsO4)3(OH) in the Ca5(PxAs1–xO4)3(OH) solid solution, the higher the solubility of the solid solution. In the present experiment, the dissolution occurred primarily within the first 480 h. After 480 h, the dissolution rate declined rapidly and a steady-state condition was achieved (Fig. 4). The aqueous pH values increased with the increasing dissolution time rapidly in the first hour and reached stable values (Fig. 4). The aqueous Ca concentrations increased rapidly at the beginning of the dissolution and reached a peak value in 3–6 h, and then declined. After 48–72-h dissolution, the aqueous Ca concentrations increased slowly once again and achieved an equilibrium state after 240 h (Fig. 4). The concentrations of aqueous phosphate species increased very fast at the beginning of dissolution and reached a peak value within the first hour of dissolution. After that, the concentrations of aqueous phosphate species declined rapidly with time and reached stable values after 240–360-h dissolution (Fig. 4). The concentrations of aqueous arsenate species increased with the increasing dissolution time at the beginning of the dissolution experiment. After reaction for ~480 h, the concentrations remained unaltered (Fig. 4).

|
The final aqueous pH values and the concentrations of aqueous Ca, phosphate and arsenate species were strongly related to the mole fraction of Ca5(PO4)3(OH) in the solid samples (Fig. 5). Generally, the aqueous OH– concentrations increased with the increase in the concentrations of aqueous arsenate species and the decrease in the concentrations of aqueous phosphate species (Fig. 5). This solubility behaviour is consistent with that of phase-pure Ca5(AsO4)3(OH). Ca5(AsO4)3(OH) becomes more soluble at lower pH and less soluble at high pH. Thus, the presence of Ca5(AsO4)3(OH) controls the composition of the solution phase.[11] This is possibly the result of the stronger hydrolisation ability of AsO43– than that of PO43–, i.e. this could be explained on the basis of the higher dissociation constants of H3AsO4 (K1 = 4.0 × 10⁻³, K2 =1.0 × 10⁻⁷ and K3 = 3.2 × 10⁻¹²) over the corresponding values of H3PO4 (K1 = 7.51 × 10⁻³, K2 = 6.33 × 10⁻⁸ and K3 = 4.73 ×10⁻¹³).[5]

|
It is also obvious that there was a steep increase in the amount of dissolved calcium, phosphate and arsenate and the accompanying decrease in solution pH between x = 0.43 (AsPHA-4) and x = 0.71 (AsPHA-7) with peak values at x = 0.54 (AsPHA-5) or x = 0.63 (AsPHA-6) for the aqueous dissolution of the Ca5(PxAs1–xO4)3(OH) solid solutions. This phenomenon was also observed by other researchers.[11] The XRD analysis indicated that the unit cell a and c parameters did not vary completely linearly with the degree of substitution as expected by the Vegard’s Law. The solids with the mole fraction of Ca5(AsO4)3(OH) between 0.46 and 1.0 were typically fine crystals; those with the mole fraction of Ca5(AsO4)3(OH) between 0 and 0.46 large tabular.[20] The expansion of the unit cell in response to AsO4 substitution is primarily a result of an average expansion of the (As,P)O4 tetrahedra. The individual (As,P)–O distances in the averaged (As,P)O4 tetrahedra increase with increasing As content in the Ca5(PxAs1–xO4)3(OH) solid solutions, as expected.[9] However, the (As,P)–O1 distance increases more rapidly with increasing As content until ~2/3 occupancy, after which no further change is observed, indicating a greater distortion in the averaged tetrahedra for intermediate compositions.[9] Expansion of the average size of (As,P)O4 tetrahedra is also reflected in the widely considered metaprism twist angle, giving the rotation of the two triangular faces formed by O1 and O2 about Ca1.[30] The trend of increasing twist with increasing As content up to As fraction 0.66 is consistent with the distortion between the (As,P)–O distances, where the (As,P)–O1 distance increases more rapidly than the (As,P)–O2 distance over the intermediate concentration range, which would serve to accentuate the metaprism twist in this same range.[9] This distortion or twist could result in the increasing of the aqueous solubility of the Ca5(PxAs1–xO4)3(OH) solid solutions in this same range.
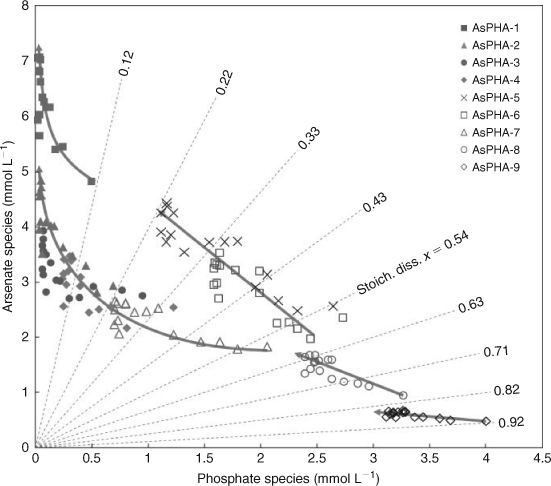
The concentrations of aqueous phosphate and arsenate species for the dissolution results are plotted in Fig. 6. The lines shown represent the pathways of stoichiometric dissolution and the arrows indicate the experimental dissolution pathways. The solid solution samples of AsPHA-1 [Ca5(P0.12As0.88O4)3(OH)], AsPHA-2 [Ca5(P0.22As0.78O4)3(OH)], AsPHA-5 [Ca5(P0.54As0.46O4)3(OH)] and AsPHA-9 [Ca5(P0.92As0.08O4)3(OH)] dissolved stoichiometrically at 25°C before the first samples were taken at 1 h. For the solid solutions of AsPHA-3, AsPHA-4, AsPHA-6, AsPHA-7 and AsPHA-8, the region of stoichiometric dissolution was over before the first samples were taken at 1h. Following the stoichiometric dissolution, the concentrations of aqueous phosphate species decreased and the concentrations of aqueous arsenate species increased for the duration of the experiment. The experimental results indicated that the dissolution was stoichiometric only at the very beginning of the process, and then dissolution became non-stoichiometric and the system underwent a dissolution–recrystallisation process that affects the ratio of the substituting ions in both the solid and the aqueous solution. During the SSAS interaction, the aqueous solution enriched in the more soluble component of the solid solutions, i.e. the endmember Ca5(AsO4)3(OH). On the contrary, the solid enriched in the less soluble component, i.e. the endmember Ca5(PO4)3(OH).
|
Dissolution mechanism
At the fundamental level, reactions between solids and liquids involve a coupled sequence of mass transport, adsorption and desorption phenomena, heterogeneous reaction, chemical transformations of intermediates, and coupled dissolution–recrystallisation processes, etc.[25,31,32] Accompanying the early release of Ca, PO43– and AsO43– was a rapid increase in reacted solution pH from 2.0 to 4.3–5.9 in the first hour of the dissolution experiment. A complete description of the protons consumed during the dissolution must take account of the following reactions: stoichiometric dissolution of the bulk solid; stoichiometric exchange of 2H+ for one Ca; H+ adsorption and desorption on the apatite surface; protonation and complexation of aqueous phosphate and arsenate species in solution.[31,32] The adsorption of protons onto negatively charged oxygen ions of phosphate or arsenate groups of the apatitic Ca5(PxAs1–xO4)3(OH) solid solution could result in transformation of surface PO43– groups into HPO42– or AsO43– groups into HAsO42– and catalyse the dissolution process.[31] Based on the sequence of ionic detachment from the surface to a solution, it is suggested that dissolution of apatite is always non-stoichiometric at the atomic level.[31] When an initial portion of the apatitic Ca5(PxAs1–xO4)3(OH) solid solution had been dissolved, some amount of phosphate was returned from the solution back and adsorbed onto the surface of the solid. As a result, the aqueous phosphate concentration after 1-h dissolution at 25°C started to decrease with time slowly. The adsorption and re-precipitation of arsenate onto the solid surface was significantly weaker than phosphate.
Because of the non-stoichiometric dissolution and secondary dissolution of the Ca5(PxAs1–xO4)3(OH) solid solution (note the increasing calcium and arsenate concentration and the decreasing phosphate concentration in Fig. 4), the possibility exists that the chemical composition at the surface of the solid phase is not directly related to the bulk composition. The surface material is also the material most likely to be in equilibrium with the aqueous phase.[33] The more insoluble Ca5(PO4)3(OH) tended to be removed first in the precipitation process, with the more soluble Ca5(AsO4)3(OH) preferentially concentrated in the later-formed material. This later-formed material was concentrated at the surface of the precipitates. As the initial material equilibrates, the Ca5(PO4)3(OH) fraction increased as a result of non-stoichiometric dissolution.
Saturation with respect to calcium phosphates and arsenates
The thermodynamic analysis could be initiated by assuming the possible pure-phase equilibrium relations.[33] The Pure-phase equilibrium was assessed by calculating the saturation index (SI), defined by SI = log IAP/Ksp, where IAP is the ion activity product (i.e. [Ca2+]5[PO43–]3[OH–] or [Ca2+]5[AsO43–]3[OH–]) and the solubility product Ksp is the thermodynamic-equilibrium constant for the dissolution reaction. If the SI is equal to zero, the aqueous phase is in equilibrium with the solid phase. An SI greater than zero indicates supersaturation, and an SI less than zero indicates undersaturation.
Phosphate minerals are known to be sparingly soluble and HAP is less soluble than arsenate hydroxylapatite (AsHAP). The mean Ksp values were calculated for Ca5(PO4)3(OH) of 10–53.28 (10–53.02–10–53.51) at 25°C and 10–55.73 (10–54.85–10–56.85) at 45°C.[21] The Ksp values 10–53.28 for Ca5(PO4)3(OH) was ~3.72 log units lower than 10–57 reported by Stumm and Morgan.[34] The thermodynamic solubility product for HAP was Ksp =10–58.3 [35] and 10–53.9.[5] Inconsistency in data presented in literature could be due to the failure to achieve equilibrium,[21,31] even though some mineral suspensions were equilibrated for as long as 6 weeks[36] or 120 h[37] before being analysed. Apatite is known to be often non-stoichiometric, specifically Ca deficient. Both the stoichiometric (Ca : P = 1.67) and any non-stoichiometric hydroxylapatite (Ca : P ratio within 1.50–1.67) might be described as the same substance. Values for the log Ksp for HAP with Ca : P = 1.67 have been reported to be approximately –59[38] whereas a value of –42.5 was reported for HAP with Ca : P = 1.5.[39] From the result of a batch dissolution for 6 weeks, the log Ksp = –58 ± 1 for synthetic HAP was obtained by Valsami-Jones et al.[36]
There are few experimental data on the thermodynamic properties of arsenate hydroxylapatite in literature. The mean Ksp value of 10–39.2 was calculated for Ca5(AsO4)3(OH) from the results of the precipitation experiment or 10–41.6 from the results of the dissolution experiment.[17] This value is ~2.08 log units lower than 10–38.04 reported by Bothe and Brown,[27] but it is obviously higher than 10–47.25.[5] The thermodynamic solubility products for Ca5(AsO4)3(OH) were 10–45.20 at 35°C, 10–45.28 at 40°C, 10–45.34 at 45°C and 10–45.46 at 50°C.[18]
Therefore, the Ksp values of 10–57 for HAP[34] and 10–41.68 for AsHAP[17] were used in the calculation using the program PHREEQC in the present study. The calculated saturation indices for Ca5(AsO4)3(OH) show a trend of increasing values as the composition of the solid phases approaches that of the pure-phase endmember, Ca5(AsO4)3(OH), thereby indicating that Ca5(AsO4)3(OH) is not the equilibrium phase at low Ca5(AsO4)3(OH) mole fraction and high Ca5(PO4)3(OH) mole fraction (Fig. 7). After 480 h of dissolution, the saturation indices for Ca5(AsO4)3(OH) showed steady-state behaviour, and at lower Ca5(AsO4)3(OH) mole fractions the SI values were still significantly below the values for pure Ca5(AsO4)3(OH), showing that pure Ca5(AsO4)3(OH) did not control the concentrations of aqueous arsenate species in these samples. This result was consistent with the dissolution of the (Ba,Sr)SO4 precipitates[33] and the Ca5(PxAs1–xO4)3F solid solution.[22]
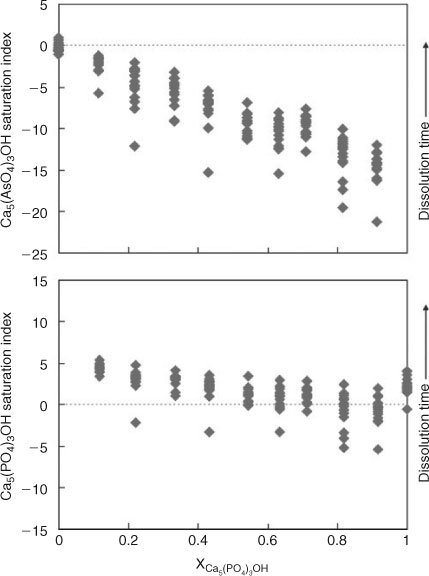
|
The calculated saturation indices for Ca5(PO4)3(OH) show a distinctly different trend than those for Ca5(AsO4)3(OH) (Fig. 7). Generally, the Ca5(PO4)3(OH) saturated index (SI) values decreased as the Ca5(PO4)3(OH) mole fraction increased and show slight oversaturation with respect to pure Ca5(PO4)3(OH) at the end of the dissolution experiment. The results indicated that the concentrations of aqueous arsenate species could not be explained by pure-phase equilibrium with Ca5(AsO4)3(OH) and the concentrations of aqueous phosphate species appeared to be in equilibrium or close to equilibrium with Ca5(PO4)3(OH).
The saturation indexes were also calculated using PHREEQC with respect to calcium phosphates and arsenates other than HAP and AsHAP. The results indicated that all aqueous solutions were always undersaturated with respect to calcium phosphates and arsenates, such as Ca8(HPO4)2(PO4)4·5H2O, Ca3(AsO4)2, Ca3(AsO4)2·4H2O, Ca4(OH)2(AsO4)2·4H2O, Ca(H2AsO4)2, CaHAsO4 and portlandite, with the SI of –15.41 to –2.24, –16.49 to –4.64, –15.79 to –3.94, –27.39 to –10.73, –11.28 to –9.04, –9.90 to –6.38 and –16.71 to –11.90 respectively. For all aqueous solution samples, the saturation indexes with respect to CaHPO4·2H2O were calculated to be –1.29 to –0.26. But the dissolution of the solid solution lead to an increase of supersaturation with respect to Ca3(PO4)2 with the SI of 0.23–4.14. In such a case the dissolution of the solid solution with a Ca/(P+As) ratio of 1.67 would be followed by precipitation of solids with Ca/P ratios of 1.50–1.67. This would lead to a subsequent increase of the Ca/(P+As) ratio in the aqueous solution. The dramatic decay (after the initial rise) in the concentration of phosphate shown in Fig. 4 could be due to the precipitation of minor amounts of calcium phosphate phases with a Ca/P ratio smaller than 1.67.
Construction of Lippmann diagram
Understanding SSAS processes is of fundamental importance. However, in spite of the numerous studies, the availability of thermodynamic data for SSAS systems is still scarce.[25,40] Lippmann extended the solubility product concept to solid solutions by developing the concept of ‘total activity product’ ΣΠSS, which is defined as the sum of the partial activity products contributed by the individual endmembers of the solid solution.[25,40–42] At thermodynamic equilibrium, the total activity product ΣΠeq, expressed as a function of the solid composition, yields Lippmann’s ‘solidus’ relationship. In the same way, the ‘solutus’ relationship expresses ΣΠeq as a function of the aqueous solution composition. The graphical representation of solidus and solutus yields a phase diagram, usually known as a Lippmann diagram.[25,40,42] A comprehensive methodology for describing reaction paths and equilibrium end points in solid-solution aqueous solution systems had been presented and discussed in the literature.[25,40–50]
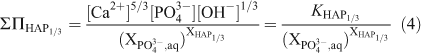
When there are several sites per formula unit for the substituting ions, the relationship between the activities of the components and the molar fractions of the substitution ions can be simplified by considering the chemical formula on a ‘one-substituting-ion’ basis. In the case of the Ca5(PxAs1–xO4)3(OH) solid solution (AsPHA), the formula units of the components are redefined as Ca5/3(PO4)(OH)1/3 (HAP1/3) and Ca5/3(AsO4)(OH)1/3 (AsHAP1/3), which is equivalent to consider the formula unit of the solid solution as Ca5/3(PxAs1–xO4)(OH)1/3 (AsPHA1/3). A Lippmann diagram is based on the total solubility product, ΣΠ, which for the Ca5/3(PxAs1–xO4)(OH)1/3 solid solution (AsPHA1/3) can be written as:
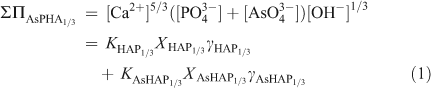
where brackets designate aqueous activity. KHAP1/3 and KAsHAP1/3, XHAP1/3 and XAsHAP1/3, γHAP1/3 and γAsHAP1/3 are the thermodynamic solubility products, the mole fractions (x, 1–x) and the activity coefficients of the Ca5/3(PO4)(OH)1/3 and Ca5/3(AsO4) (OH)1/3 components in the Ca5/3(PxAs1–xO4)(OH)1/3 solid solution. The term [Ca2+]5/3([PO43–]+[AsO43–])[OH–]1/3 is the ‘total solubility product’ ΣΠAsPHA1/3 at equilibrium.[42] This relationship, called the solidus, defines all possible thermodynamic saturation states for the two-component solid solution series in terms of the solid phase composition.[43]
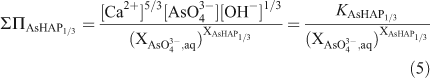
As given by Glynn and Reardon,[42] the equation of the solutus can be given by:
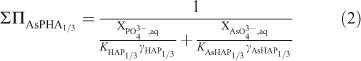
where XPO43–,aq and XAsO43–,aq are the activity fractions for [PO43–] and [AsO43–] in the aqueous phase respectively. This relationship defines all possible thermodynamic saturation states for the two-component solid solution series in terms of the aqueous phase composition.[43]
Identical to the equation for the solid solution curves given by Glynn and Reardon,[42] the total solubility product for the Ca5/3(PxAs1–xO4)(OH)1/3 solid solution at stoichiometric saturation, ΣΠss, can be expressed as:
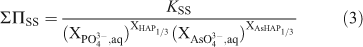
where KSS, [Ca2+]5/3[PO43–]x[AsO43–](1–x)[OH–]1/3, is the stoichiometric saturation constant for the Ca5/3(PxAs1–xO4)(OH)1/3 solid solution.
The total solubility products for the stoichiometric saturation with respect to both pure endmembers, ΣΠHAP1/3 and ΣΠAsHAP1/3, can be described in terms of the endmember solubility products KHAP1/3 and KAsHAP1/3 respectively:
According to the definition of the total solubility product, the ‘total solubility product’ ΣΠAsPHA’ for the formula unit of the solid solution as Ca5(PxAs1–xO4)3(OH) can be calculated from the ‘total solubility product’ ΣΠAsPHA1/3 by
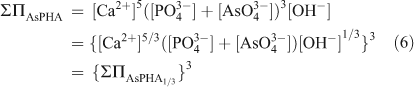
A Lippmann phase diagram for the solid solution as Ca5(PxAs1–xO4)3(OH) is a plot of the solidus and solutus as log ΣΠAsPHA (or log{ΣΠAsPHA1/3}3) on the ordinate versus two superimposed aqueous and solid phase mole fraction scales on the abscissa.
Solid-solution aqueous-solution reaction paths
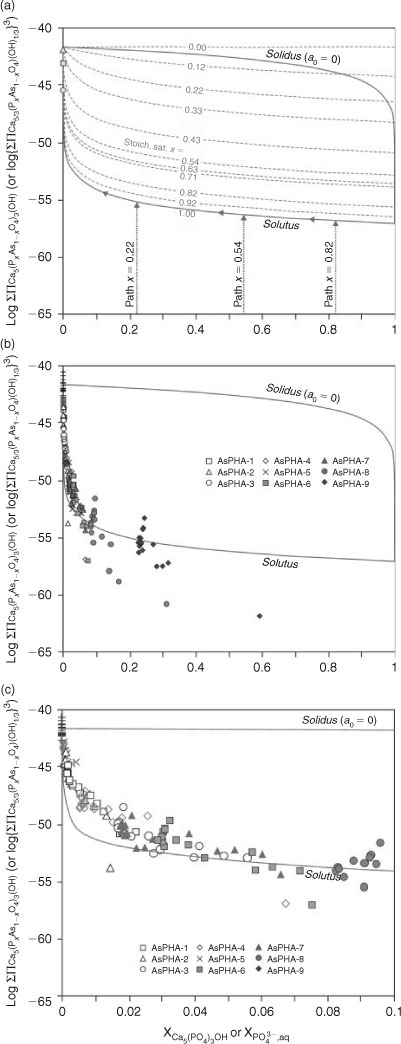
A Lippmann diagram for the Ca5(PxAs1–xO4)3(OH) solid solutions for the ideal case when a0 = 0.0 is shown in Fig. 8. It was constructed using thermodynamic solubility products for Ca5(PO4)3(OH) of 10–57 and Ca5(AsO4)3(OH) of 10–41.6 reported in the previous researches.[17,34] The diagrams contain the solidus (log ΣΠAsPHA v. XHAP1/3 or XHAP) and the solutus (log ΣΠAsPHA v. XPO43–,aq) for the Ca5(PxAs1–xO4)3(OH) solid solution series, and the total solubility product curves at stoichiometric saturation for the nine different members of the arsenate–phosphate hydroxylapatite solid solution (ΣΠSS v. XPO43–,aq; x = 0.12, 0.22, …, 0.92). In addition to the solutus and the solidus, we have plotted the saturation curves for pure endmembers HAP (x = 1.00) and AsHAP (x = 0.00). Also included are the data from our study, plotted as [Ca2+]5([PO43–]+[AsO43–])3[OH–] v. XPO43–,aq.
|
In Fig. 8a, the curve for pure endmember HAP (x = 1.00) is very close to the solutus curve over the entire range of XPO43–,aq. The position of the Lippmann solutus curve is insensitive to the actual thermodynamic mixing properties of the solid-solutions, only the solidus curve is affected in all SSAS systems with large differences in endmember solubility products.[44] The greater the difference in solubility products, the lesser the influence of the excess thermodynamic mixing properties on the position of the solutus curve.[42] Lippmann diagrams resulting from the application of variable solid phase activity coefficients are rather similar to the one depicting ideal solid solution. The only difference is a slight upward convexity of the solidus.[45]
Several hypothetical reaction paths are shown in Fig. 8a, in relation to Lippmann solutus and solidus curves for the Ca5(PxAs1–xO4)3(OH) solid solutions. The reaction path of a stoichiometrically dissolving solid solution moves vertically from the abscissa of a Lippmann diagram, originating at the mole fraction corresponding to the initial solid solution composition.[43] The pathways show initial stoichiometric dissolution up to the solutus curve, followed by non-stoichiometric dissolution along the solutus, towards the more soluble endmember.[44] Paths x = 0.22, x = 0.54 and x = 0.82 illustrate hypothetical reaction paths for the solid solutions Ca5(P0.22As0.78O4)3(OH), Ca5(P0.54As0.46O4)3(OH) and Ca5(P0.82As0.18O4)3(OH) respectively.[44]
The experimental data plotted on Lippmann phase diagrams show that the precipitates either follow or slightly overshoot the Lippmann solutus curve, then approach the solutus curve (Fig. 8b,c), indicating the dissolution path for these precipitates may involve stoichiometric dissolution to the Lippmann solutus curve followed by a possible exchange reaction.[33,44] In general, the location of data points on a Lippmann diagram will depend on the aqueous speciation, degree to which secondary phases are formed, and the relative rates of dissolution and precipitation.[46] As Ca5(PxAs1–xO4)3(OH) dissolves in solution with pH < 7, aqueous PV and AsV are converted primarily into HPO42– and HAsO42– and only a small fractions remain as PO43– and AsO43–. The small values of the activity fractions are a consequence of the PV and AsV speciation and the fractions of total PV and AsV would be orders of magnitude greater. For the plot of the experimental data on the Lippmann diagram, the effect of the aqueous PV and AsV speciation was considered by calculating the activity of PO43– and AsO43– with the program PHREEQC. Our dissolution data indicate a persistent enrichment in the HAP component in the solid phase and a persistent enrichment in the arsenate component in the aqueous phase (Table 1 and Fig. 6). The possibility of formation of a phase close in composition to pure HAP seems unavoidable, given the extremely low solubility of HAP and the large oversaturation with respect to HAP, the relatively high solubility of AsHAP and the undersaturation with respect to AsHAP (Fig. 7).
The large difference between the solubility products of the endmembers involves a strong preferential partitioning of the less soluble endmember towards the solid phase,[40] which explains AsHAP-poor solid solutions are in equilibrium with arsenate-rich aqueous solutions. Therefore, from the point of view of the equilibrium thermodynamics, in solidification–stabilisation of As-containing hazardous wastes and As-contaminated soil using phosphates (apatite), large amount of phosphates (apatite) must be applied in the process to avoid the leaching of arsenic.[22] Although johnbaumite [Ca5(AsO4)3OH] and other calcium arsenates have been considered for safe arsenic disposal, in treating industry and mineral processing wastes with lime, it has been assumed that these solids are extremely insoluble and stable.[11,14,23] The experimental results indicated that johnbaumite [Ca5(AsO4)3OH] is stable under alkaline conditions, and in moderately soluble when compared with hydroxylapatite [Ca5(PO4)3OH]. The use of hydroxylapatite to decrease the arsenate content of contaminated waters is not effective as johnbaumite is much more soluble than the phosphate analogue and substitution of phosphate by arsenate in the apatite lattice can occur only for very high concentrations of arsenate.[23] As a soil amendment, apatite removes many priority metals from solution phase. An exception was arsenate, an oxyanion, which demonstrated slightly reduced retention within the apatite-amended soil.[47] Arsenic typically exists in anionic forms under environmental conditions and apatite is not very effective on arsenic.
Conclusions
During the dissolution of the synthetic Ca5(PxAs1–xO4)3(OH) solid solutions (0–2880 h) at 25°C and initial pH = 2, the concentrations profiles of aqueous calcium, phosphate species and arsenate showed a rapid initial release of constituent ions to solution followed by a decreasing rate of dissolution and eventually, steady-state. The aqueous pH values and the concentrations of aqueous arsenate species increased rapidly at the beginning of the dissolution and reached a steady-state after 1 and 480 h respectively. The aqueous Ca concentrations increased rapidly at the beginning of the dissolution and reached a peak value in 3–6 h, and then declined. After 48–72-h dissolution, the aqueous Ca concentrations increased slowly once again and achieved an equilibrium state after 240 h. The concentrations of aqueous phosphate species increased very fast at the beginning of dissolution and reached a peak value in 1 h and then declined slowly with time and remained constant after 240–360-h dissolution. Generally, the aqueous OH– concentrations increased with the increase in the concentrations of aqueous arsenate species and the decrease in the concentrations of aqueous phosphate species.
The aqueous element concentrations were significantly affected by the mole fraction of Ca5(PO4)3(OH) in the Ca5(PxAs1–xO4)3(OH) solid solutions. There was a steep increase in the amount of dissolved calcium, phosphate and arsenate and the accompanying decrease in solution pH between x = 0.43 and x = 0.71 with peak values at x = 0.54 or x = 0.63 for the aqueous dissolution of the Ca5(PxAs1–xO4)3(OH) solid solutions. The dissolution of the Ca5(PxAs1–xO4)3(OH) solid solutions into an initially dilute aqueous solution was often stoichiometric and followed by the non-stoichiometric dissolution. During the non-stoichiometric dissolution, the concentrations of aqueous phosphate species decreased and the concentrations of aqueous arsenate species increased.
The SSAS reaction paths for the dissolution of the synthetic Ca5(PxAs1–xO4)3(OH) solid solutions were plotted on Lippmann diagrams. Solid phase activity coefficients used in the construction of the Lippmann diagram were calculated with the Guggenheim coefficient of a0 = 0 for an ideal solid solution. It can readily be seen in the Lippmann diagram that the experimental data followed or slightly overshot the Lippmann solutus curve, then approach the solutus curve. According to the Lippmann diagram, AsHAP-poor solid solutions are in equilibrium with arsenate-rich aqueous solutions.
Acknowledgements
The manuscript has greatly benefited from insightful comments by Prof Jon Chorover, Prof Manuel Prieto, Prof Kurt Bucher and two anonymous reviewers. The authors thank the Guangxi Key Laboratory of Environmental Engineering, Protection and Assessment for the research assistance and financial support from the National Natural Science Foundation of China (NSFC40773059), the Special Project of the National Water Pollution Control and Management of China (No.2008ZX07317–02) and the Provincial Natural Science Foundation of Guangxi (GuiKeZi0728222 and 2011GXNSFF018003).
References
[1] I. Manjubala, M. Sivakumar, S. Najma Nikkath, Synthesis and characterisation of hydroxy/fluoroapatite solid solution. J. Mater. Sci. 2001, 36, 5481.| Synthesis and characterisation of hydroxy/fluoroapatite solid solution.Crossref | GoogleScholarGoogle Scholar | 1:CAS:528:DC%2BD3MXptVGgsr4%3D&md5=b010b8a8414f446826d927adbb8e8341CAS |
[2] T. S. B. Narasaraju, D. E. Phebe, Some physico-chemical aspects of hydroxylapatite. J. Mater. Sci. 1996, 31, 1.
| Some physico-chemical aspects of hydroxylapatite.Crossref | GoogleScholarGoogle Scholar | 1:CAS:528:DyaK28XjsFKqtA%3D%3D&md5=501b30e24d450937ad4705bd8b3ff8e7CAS |
[3] M. Masaoka, A. Kyono, T. Hatta, M. Kimata, Single crystal growth of Pb5(PxAs1–xO4)3Cl solid solution with apatite type structure. J. Cryst. Growth 2006, 292, 129.
| Single crystal growth of Pb5(PxAs1–xO4)3Cl solid solution with apatite type structure.Crossref | GoogleScholarGoogle Scholar | 1:CAS:528:DC%2BD28XmsVKisrk%3D&md5=69df5e15ff09b9a58589ef6b49cf5bfcCAS |
[4] A. Onda, S. Ogo, K. Kajiyoshi, K. Yanagisawa, Hydrothermal synthesis of vanadate/phosphate hydroxyapatite solid solutions. Mater. Lett. 2008, 62, 1406.
| Hydrothermal synthesis of vanadate/phosphate hydroxyapatite solid solutions.Crossref | GoogleScholarGoogle Scholar | 1:CAS:528:DC%2BD1cXovFCntQ%3D%3D&md5=730dfd66fd1a37651014e822ae371ed8CAS |
[5] T. S. B. Narasaraju, U. S. Rai, Some thermodynamic aspects of dissolution of solid solutions of hydroxylapatites of phosphorus and arsenic. Can. J. Chem. 1979, 57, 2662.
| Some thermodynamic aspects of dissolution of solid solutions of hydroxylapatites of phosphorus and arsenic.Crossref | GoogleScholarGoogle Scholar | 1:CAS:528:DyaE1MXlsVKlsLg%3D&md5=2b722204852f5f9ad54cc19a47d97770CAS |
[6] E. A. Perseil, P. Blanc, D. Ohnenstetter, As-bearing fluorapatite in manganiferous deposits from St Marcel–Praborna, Val D’Aosta, Italy. Can. Mineral. 2000, 38, 101.
| As-bearing fluorapatite in manganiferous deposits from St Marcel–Praborna, Val D’Aosta, Italy.Crossref | GoogleScholarGoogle Scholar | 1:CAS:528:DC%2BD3cXjsVajtLk%3D&md5=c7282b591281e812a6d2320fd812045cCAS |
[7] M. Kucharski, W. Mroz, J. Kowalczyk, B. Szafirska, M. Gluzinska, Leachability and thermal stability of synthesised and natural svabite. Arch. Metall. 2002, 47, 119..
[8] R. N. Ratnaike, Acute and chronic arsenic toxicity. Postgrad. Med. J. 2003, 79, 391.
| Acute and chronic arsenic toxicity.Crossref | GoogleScholarGoogle Scholar | 1:CAS:528:DC%2BD3sXnsFGru7c%3D&md5=e3d820ba7b7ace38a6f0550b31ce9da3CAS | 12897217PubMed |
[9] Y. J. Lee, P. W. Stephens, Y. Tang, W. Li, B. L. Phillips, J. B. Parise, R. J. Reeder, Arsenate substitution in hydroxylapatite: structural characterization of the Ca5(PxAs1–xO4)3OH solid solution. Am. Mineral. 2009, 94, 666.
| Arsenate substitution in hydroxylapatite: structural characterization of the Ca5(PxAs1–xO4)3OH solid solution.Crossref | GoogleScholarGoogle Scholar | 1:CAS:528:DC%2BD1MXps1emt7k%3D&md5=3f6e66d90117d183b1a820e37ca488b4CAS |
[10] P. L. Smedley, D. G. Kinniburgh, A review of the source, behavior and distribution of arsenic in natural waters. Appl. Geochem. 2002, 17, 517.
| A review of the source, behavior and distribution of arsenic in natural waters.Crossref | GoogleScholarGoogle Scholar | 1:CAS:528:DC%2BD38XhvVSmur0%3D&md5=bee6f2503e0bc328db084535a5edadb4CAS |
[11] J. V. Bothe, P. W. Brown, Arsenic immobilization by calcium arsenate formation. Environ. Sci. Technol. 1999, 33, 3806.
| Arsenic immobilization by calcium arsenate formation.Crossref | GoogleScholarGoogle Scholar | 1:CAS:528:DyaK1MXlvVGjurc%3D&md5=7be585784d35c786e57b62276ae3baadCAS |
[12] E. Fulladosa, J. C. Murat, M. Martinez, I. Villaescusal, Effect of pH on arsenate and arsenite toxicity to luminescent bacteria (Vibrio fischeri). Arch. Environ. Contam. Toxicol. 2004, 46, 176..
| 15106667PubMed |
[13] Y. N. Chen, L. Y. Chai, Y. D. Shu, Study of arsenic(V) adsorption on bone char from aqueous solution. J. Mater. Sci. 2008, 160, 168..
[14] Final Report – Arsenic stabilization research project, Removal of arsenic from waste solutions as storable stable precipitates. Mine waste technology program, Activity IV, Project 5, Report MWTP-82 1998 (MSE-TA: Butte, MT).
[15] U. Becker, M. Prieto, Solid solutions: from theory to experiment. Chem. Geol. 2006, 225, 173.
| Solid solutions: from theory to experiment.Crossref | GoogleScholarGoogle Scholar | 1:CAS:528:DC%2BD28XjsFyntQ%3D%3D&md5=bde268651cc706ab0f73874551ff67c9CAS |
[16] T. Nishimura, R. G. Robins, A re-evaluation of the solubility and stability regions of calcium arsenites and calcium arsenates in aqueous solution at 25°C. Mineral. Proc. Extr. Met. Rev. 1998, 18, 283.
| A re-evaluation of the solubility and stability regions of calcium arsenites and calcium arsenates in aqueous solution at 25°C.Crossref | GoogleScholarGoogle Scholar | 1:CAS:528:DC%2BD3cXlsFymur0%3D&md5=0baedf71b9eee1be96ecf7ff6d8897c4CAS |
[17] Y. Zhu, X. Zhang, Q. Xie, D. Wang, G. Cheng, Solubility and stability of calcium arsenates at 25°C. Water Air Soil Pollut. 2006, 169, 221.
| Solubility and stability of calcium arsenates at 25°C.Crossref | GoogleScholarGoogle Scholar | 1:CAS:528:DC%2BD28XitFCnsg%3D%3D&md5=35fe1179de73dd41a17a70c9cf60ca94CAS |
[18] P. P. Mahapatra, L. M. Mahapatra, B. Mishra, Solubility of calcium hydrogen arsenate in aqueous medium. Indian J. Chem. 1986, 25A, 647.
| 1:CAS:528:DyaL28XkvVGqs7c%3D&md5=6d657c7c29f70b0529a5609ae6990d0aCAS |
[19] S. C. B. Myneni, S. J. Traina, T. J. Logan, G. A. Waychunas, Oxyanion behavior in alkaline environments: Sorption and desorption of arsenate in etringite. Environ. Sci. Technol. 1997, 31, 1761.
| Oxyanion behavior in alkaline environments: Sorption and desorption of arsenate in etringite.Crossref | GoogleScholarGoogle Scholar | 1:CAS:528:DyaK2sXislSltL8%3D&md5=8268825b29f1c5773dcee309dcf7a615CAS |
[20] Y. Zhu, X. Zhang, F. Long, H. Liu, M. Qian, N. He, Synthesis and characterization of arsenate/phosphate hydroxyapatite solid solution. Mater. Lett. 2009, 63, 1185.
| Synthesis and characterization of arsenate/phosphate hydroxyapatite solid solution.Crossref | GoogleScholarGoogle Scholar | 1:CAS:528:DC%2BD1MXjslertbk%3D&md5=561344e30e4f35914cb71be9a0acc87dCAS |
[21] Y. Zhu, X. Zhang, Y. Chen, Q. Xie, J. Lan, M. Qian, N. He, A comparative study on the dissolution and solubility of hydroxylapatite and fluorapatite at 25°C and 45°C. Chem. Geol. 2009, 268, 89.
| A comparative study on the dissolution and solubility of hydroxylapatite and fluorapatite at 25°C and 45°C.Crossref | GoogleScholarGoogle Scholar | 1:CAS:528:DC%2BD1MXhtFOrt7vP&md5=88407651a0c56b707a8a7f2c6d589864CAS |
[22] Y. Zhu, X. Zhang, H. Zeng, H. Liu, N. He, M. Qian, Characterization, dissolution and solubility of synthetic svabite [Ca5(AsO4)3F] at 25–45°C. Environ. Chem. Lett. 2010. [Published online ahead of print 10 April 2010]
[23] M. C. F. Magalhães, P. A. Williams, Apatite group minerals: Solubility and environmental remediation, in Thermodynamics, Solubility and Environmental Issues (Ed. T. M. Letcher) 2007, pp. 327–340 (Elsevier: Amsterdam).
[24] C. M. B. Henderson, A. M. T. Bell, J. M. Charnock, K. S. Knight, R. F. Wendlandt, D. A. Plant, W. J. Harrison, Synchrotron X-ray absorption spectroscopy and X-ray powder diffraction studies of the structure of johnbaumite [Ca10(AsO4)6(OH,F)2] and synthetic Pb-, Sr- and Ba-arsenate apatites and some comments on the crystal chemistry of the apatite structure type in general. Mineral. Mag. 2009, 73, 433.
| Synchrotron X-ray absorption spectroscopy and X-ray powder diffraction studies of the structure of johnbaumite [Ca10(AsO4)6(OH,F)2] and synthetic Pb-, Sr- and Ba-arsenate apatites and some comments on the crystal chemistry of the apatite structure type in general.Crossref | GoogleScholarGoogle Scholar | 1:CAS:528:DC%2BD1MXhtlKnsr3O&md5=54f8561db088a733e65b4032ebc62a8bCAS |
[25] M. Prieto, Thermodynamics of solid solution – aqueous solution systems. Rev. Mineral. Geochem. 2009, 70, 47.
| Thermodynamics of solid solution – aqueous solution systems.Crossref | GoogleScholarGoogle Scholar | 1:CAS:528:DC%2BC3cXnvFGku7o%3D&md5=4d4269f7f97f5295877a99cb0a6faeedCAS |
[26] D. L. Parkhurst, C. A. J. Appelo, User’s Guide to PHREEQC (Version2) – A Computer Program for Speciation, Reaction-Path, Advective-Transport, and Inverse Geochemical Calculations. US Geological Survey Water-Resources Investigations Report 99-4259 1999.
[27] J. V. Bothe, P. W. Brown, The stabilities of calcium arsenates at 23 ± 1°C. J. Hazard. Mater. B 1999, 69, 197.
| The stabilities of calcium arsenates at 23 ± 1°C.Crossref | GoogleScholarGoogle Scholar | 1:CAS:528:DyaK1MXmvVaqsLY%3D&md5=28d86a488abc55337b99ec706db2de14CAS |
[28] J. C. Elliott, Structure and chemistry of the apatites and other calcium orthophosphates, in Studies in Inorganic Chemistry 1994, vol. 18 (Elsevier: Amsterdam).
[29] V. M. Bhatnagar, X-ray and infrared studies of lead apatites. Can. J. Chem. 1971, 49, 662.
| X-ray and infrared studies of lead apatites.Crossref | GoogleScholarGoogle Scholar | 1:CAS:528:DyaE3MXhtFOjtrY%3D&md5=86237ccd43fa0c808cff12c137945aa9CAS |
[30] T. J. White, Z. L. Dong, Structural derivation and crystal chemistry of apatites. Acta Crystallogr. B 2003, 59, 1..
| 12554967PubMed |
[31] S. V. Dorozhkin, A review on the dissolution models of calcium apatites. Prog. Cryst. Gr. Char. Mater. 2002, 44, 45.
| A review on the dissolution models of calcium apatites.Crossref | GoogleScholarGoogle Scholar | 1:CAS:528:DC%2BD38XksVGgtLo%3D&md5=25d78456e8101371f1f3176881299d1aCAS |
[32] C. Chaïrat, E. H. Oelkers, J. Schott, J. E. Lartigue, Fluorapatite surface composition in aqueous solution deduced from potentiometric, electrokinetic, and solubility measurements, and spectroscopic observations. Geochim. Cosmochim. Acta 2007, 71, 5888.
| Fluorapatite surface composition in aqueous solution deduced from potentiometric, electrokinetic, and solubility measurements, and spectroscopic observations.Crossref | GoogleScholarGoogle Scholar |
[33] A. R. Felmy, D. Rai, D. A. Moore, The solubility of (Ba,Sr)SO4 precipitates: Thermodynamic equilibrium and reaction path analysis. Geochim. Cosmochim. Acta 1993, 57, 4345.
| The solubility of (Ba,Sr)SO4 precipitates: Thermodynamic equilibrium and reaction path analysis.Crossref | GoogleScholarGoogle Scholar | 1:CAS:528:DyaK2cXhsVGlsrk%3D&md5=b1b077194d560e5161a06b798c61488bCAS |
[34] W. Stumm, J. J. Morgan, Aquatic Chemistry, Chemical Equilibria and Rates in Natural Waters 1996 (Wiley: New York).
[35] H. McDowell, T. M. Gregory, W. E. Brown, Solubility of Ca5(PO4)3OH in the system Ca(OH)2–H3PO4–H2O at 5, 15, 25, and 37°C. J. Res. Nat. Bur. Stand. 1977, 81, 273..
[36] E. Valsami-Jones, K. W. Ragnarsdottir, A. Putnis, D. Bosbach, A. J. Kemp, G. Cressey, Solubility and ion activity products of calcium phosphate minerals. Chem. Geol. 1998, 151, 215.
| Solubility and ion activity products of calcium phosphate minerals.Crossref | GoogleScholarGoogle Scholar | 1:CAS:528:DyaK1cXmtl2gt78%3D&md5=2b92ac47ee8deb00d7949b40fb69b07aCAS |
[37] M. T. Fulmer, I. C. Ison, C. R. Hankermayer, B. R. Constantz, J. Ross, Measurements of the solubilities and dissolution rates of several hydroxyapatites. Biomaterials 2002, 23, 751.
| Measurements of the solubilities and dissolution rates of several hydroxyapatites.Crossref | GoogleScholarGoogle Scholar | 1:CAS:528:DC%2BD3MXosFKms7k%3D&md5=7106feef2e3417b8bebc7812fc84a2b8CAS | 11771695PubMed |
[38] W. E. Brown, T. M. Gregory, L. C. Chow, Effects of fluoride on enamel solubility and cariostasis. Caries Res. 1977, 11, 118.
| Effects of fluoride on enamel solubility and cariostasis.Crossref | GoogleScholarGoogle Scholar | 318567PubMed |
[39] F. C. M. Driessens, R. M. H. Verbeeck, Metastable states in calcium phosphate – aqueous phase equilibrations. J. Cryst. Growth 1981, 53, 55.
| Metastable states in calcium phosphate – aqueous phase equilibrations.Crossref | GoogleScholarGoogle Scholar | 1:CAS:528:DyaL3MXktlemtL0%3D&md5=b209f0447ede9b7b1063e570609a4706CAS |
[40] M. Prieto, A. Fernández-González, U. Becker, A. Putnis, Computing Lippmann diagrams from direct calculation of mixing properties of solid solutions: Application to the Barite–Celestite System. Aquat. Geochem. 2000, 6, 133.
| Computing Lippmann diagrams from direct calculation of mixing properties of solid solutions: Application to the Barite–Celestite System.Crossref | GoogleScholarGoogle Scholar | 1:CAS:528:DC%2BD3cXkslygurc%3D&md5=d4320351b529cd93f594a01ac86823daCAS |
[41] D. C. Thorstenson, L. N. Plummer, Equilibrium criteria for two component solids reacting with fixed composition in an aqueous-phase; example: the magnesian calcites. Am. J. Sci. 1977, 277, 1203.
| Equilibrium criteria for two component solids reacting with fixed composition in an aqueous-phase; example: the magnesian calcites.Crossref | GoogleScholarGoogle Scholar | 1:CAS:528:DyaE1cXhsFGku7Y%3D&md5=c48a4e82bfa6962168e7e66907c6016fCAS |
[42] P. D. Glynn, E. J. Reardon, Solid-solution aqueous-solution equilibria: thermodynamic theory and representation. Am. J. Sci. 1990, 290, 164.
| Solid-solution aqueous-solution equilibria: thermodynamic theory and representation.Crossref | GoogleScholarGoogle Scholar |
[43] W. A. Kornicker, P. A. Presta, C. A. Paige, D. M. Johnson, O. E. Hileman, W. J. Snodgrass, The aqueous dissolution kinetics of the barium/lead sulfate solid solution series at 25 and 60°C. Geochim. Cosmochim. Acta 1991, 55, 3531.
| The aqueous dissolution kinetics of the barium/lead sulfate solid solution series at 25 and 60°C.Crossref | GoogleScholarGoogle Scholar | 1:CAS:528:DyaK38XhtlOjtbc%3D&md5=e627712d333f12489943d0768f19f012CAS |
[44] P. D. Glynn, E. J. Reardon, L. N. Plummer, E. Busenberg, Reaction paths and equilibrium end-points in solid-solution aqueous-solution systems. Geochim. Cosmochim. Acta 1990, 54, 267.
| Reaction paths and equilibrium end-points in solid-solution aqueous-solution systems.Crossref | GoogleScholarGoogle Scholar | 1:CAS:528:DyaK3cXksVCjur4%3D&md5=26cd7e4886a33640999ce26bae2d47f5CAS |
[45] M. Prieto, A. Putnis, L. Fernández-Díaz, Crystallization of solid solutions from aqueous solutions in a porous medium: Zoning in (Ba,Sr)SO4. Geol. Mag. 1993, 130, 289.
| Crystallization of solid solutions from aqueous solutions in a porous medium: Zoning in (Ba,Sr)SO4.Crossref | GoogleScholarGoogle Scholar | 1:CAS:528:DyaK2cXptFSrtg%3D%3D&md5=77c25ada91a6e90918a2b1124e30b1aeCAS |
[46] D. Baron, C. D. Palmer, Solid solution/aqueous solution interactions between jarosite and its chromate analog. Geochim. Cosmochim. Acta 2002, 66, 2841.
| Solid solution/aqueous solution interactions between jarosite and its chromate analog.Crossref | GoogleScholarGoogle Scholar | 1:CAS:528:DC%2BD38XlvFOnsLc%3D&md5=df6ff905887415a9394e2c75c1997f4bCAS |
[47] W. D. Bostick, R. J. Stevenson, L. A. Harris, D. Peery, J. R. Hall, J. L. Shoemaker, R. J. Jarabek, E. B. Munday, Use of apatite for chemical stabilization of subsurface contaminants. Final report (Work performed under contract DE-AD26-01NT41306) 2003 (US Department of Energy, National Energy Technology Laboratory). Available at http://www.osti.gov/bridge/servlets/purl/820754-Fk9X7K/native/820754.pdf [Verified 17 March 2011].
[48] E. Königsberger, H. Gamsjäger, Comment on ‘Solid-solution aqueous-solution equilibria: thermodynamic theory and representation’ by Glynn P. D. and Reardon E. J. Am. J. Sci. 1992, 292, 199..
[49] C. Monnin, A thermodynamic model for the solubility of barite and celestite in electrolyte solutions and seawater to 200°C and to 1 kbar. Chem. Geol. 1999, 153, 187.
| A thermodynamic model for the solubility of barite and celestite in electrolyte solutions and seawater to 200°C and to 1 kbar.Crossref | GoogleScholarGoogle Scholar | 1:CAS:528:DyaK1MXnsFWjsg%3D%3D&md5=5aedd27561aa5c56bb6082174508483dCAS |
[50] H. Gamsjäger, E. Königsberger, W. Preis, Lippmann diagrams: theory and application to carbonate systems. Aquat. Geochem. 2000, 6, 119.
| Lippmann diagrams: theory and application to carbonate systems.Crossref | GoogleScholarGoogle Scholar |