
East coast lows and extratropical transition of tropical cyclones, structures producing severe events and their comparison with mature tropical cyclones
Jeff Callaghan A *
A *
A Retired. Formerly Bureau of Meteorology, Brisbane, Qld 4001, Australia.
B Postal address: 3/34 Macalister Road, Tweed Heads, NSW 2486, Australia.
Journal of Southern Hemisphere Earth Systems Science 71(3) 229-265 https://doi.org/10.1071/ES21003
Submitted: 10 February 2021 Accepted: 7 September 2021 Published: 16 December 2021
© 2021 The Author(s) (or their employer(s)). Published by CSIRO Publishing on behalf of BoM. This is an open access article distributed under the Creative Commons Attribution-NonCommercial-NoDerivatives 4.0 International License (CC BY-NC-ND)
Abstract
Examination of events occurring over the last 53 years in the Australian Region have revealed in the minds of forecasters a common pattern in the development of severe extratropical cyclones which have affected the sub-tropical and temperate East Coast. To evaluate this theory 20 years of data were systematically examined and showed that this was true. To represent these many cases nine such events which delivered the largest impacts over the 53 years were chosen for study. These extratropical cyclones formed downstream of a tropopause undulation which can be easily identified as a warm region at the 200 hPa-level and the formation zone was in a region of heavy rain embedded in a region of warm air advection at 700 hPa. There were hardly any exceptions to this general rule, and one that occurred is presented and was also one of the most rapidly developing systems. This pattern is then evaluated against tropical cyclone events which move in the Australasian sub tropics and three different scenarios are described and compared with a mature severe tropical cyclone which intensified as it moved into the Australia sub tropics. Hurricane Sandy due to its devastating effect on the US sub-tropics in 2012 is examined as a benchmark case whose impact could affect the Australasian sub tropics in the future as sea levels rise with higher density populations.
Keywords: beach erosion, East coast lows, fatalities, heavy rainfall, ocean damage, tropical cyclones, tropopause undulations, warm air advection.
1 Introduction
The term east coast low (ECL) is generally used in Australia to refer to a low-pressure system with closed cyclonic circulation at sea level that forms and/or intensifies in a maritime environment within the vicinity of the east coast of Australia (e.g. Speer et al. 2009), although it should also be noted that a range of secondary criteria are used in different studies. They can cause significant wind, flood and ocean damage and are often responsible for loss of life. Dowdy et al. (2011, 2013) showed that diagnostic quantities based on geostrophic vorticity and isentropic potential vorticity (PV) provided a good indication of the likely occurrence of east-coast cyclogenesis – for a review of ECLs see Dowdy et al. (2019). The Queensland (Qld) Office of the Bureau of Meteorology examined the vertical structure of many ECLs and extratropical transition (ET) of tropical cyclone (TC) events over the last 50 years (Callaghan 2004, 2005, 2008; Callaghan and Power 2014, 2016). These extensive analyses show that the most common pattern where strong mean sea level (msl) low-pressure systems result from where a tropopause undulation (TU) approaches a developing low-pressure area. Earlier Hirschberg and Fritsch (1991a, 1991b, 1993) identified these phenomena, although there has been little published work since to consolidate this way of thinking.
2 TU and heavy rain
As the TU is one of the most obvious features on a weather chart, being identified as a warm anomaly on the 200 hPa isotherm analysis and covers a large area, this study attempts to rectify this inadequacy. The low-level cyclonic circulation lies mostly to the east or southeast of the TU and warm air advection (WAA) at the 200 hPa level lays over the heavy rain areas of the surface low leading to msl pressure falls. This is consistent with the PV arguments of Hoskins et al. (1985).
There have been numerous papers describing how upper (near 200 hPa) WAA leads to msl pressure falls (Hirschberg and Fritsch 1993; Huo et al. 1995; Rolfson and Smith 1996; Holland 1997; Sinclair and Revell 2000; Strahl and Smith 2001; Zhang and Chen 2012; Chen et al. 2013). The role of the heavy rainfall and associated deep cloud in the 700 hPa WAA region from Hirschberg and Fritsch (1991a, 1991b, 1993) is thought to stop cooling from dry isentropic ascent as the upper flow ascends out of the TU.
The importance of ECLs to heavy rainfall over the eastern seaboard of Australia has been noted previously (e.g. Hopkins and Holland 1997; Pepler and Rakich 2010; Pepler et al. 2013). The heavy rain areas are marked by winds between 850 and 500 hPa which turn anticyclonically with height and have been investigated in a series of papers that related this wind structure with extreme rainfall (Tory 2014; Callaghan and Tory 2014; Callaghan and Power 2016; Callaghan 2017a, 2017b, 2018, 2019b, 2019c, 2021). A representation of the anticyclonic turning of the winds with height using 700 hPa winds and 850–500 hPa vertical wind shears is given in fig. 2 of Callaghan and Power (2016). The observed turning in the wind direction with height results in the vertical wind shear. To the extent that winds are in approximately gradient balance (Tory 2014), the shear barbs are nearly parallel to the 700 hPa isotherms or 850–500 hPa thickness contours, with warm air or high thickness to the left in the southern hemisphere in the direction of the barb. This figure indicates that systems producing rainfall exceeding 25 mm/day are likely to be associated with winds at 700 hPa directed from warm to cooler areas and has a similar relationship to the WAA found in quasi-geostrophic theory. For simplicity below we refer to this wind structure of anticyclonically turning winds as WAA.
Over the years, hundreds of cases were observed where ECLs satisfied the above pattern of formation near the heavy-rain region downstream of a TU. All significant low-pressure events which have affected sub-tropical eastern Australia (including ECLs and TCs) were obtained from Callaghan and Power (2014, supplementary appendix). Obviously, hundreds of cases cannot be presented, so to represent these findings we systematically studied the relationship between the formation of severe low-pressure systems intensifying downstream of a TU and examined all known such systems since the year 2000.
Between 2000 and 2020, 95 lows formed downstream of TUs in the western Coral and Tasman Seas south from Brisbane to Tasmania. The seasonal occurrences of these 95 storms were DJF 12 MAM 29 JJA 36 SON 18, that is most of these occurred in autumn and winter. Appendix 1 contains a list of these 95 storms including their impacts on coastal areas. They were responsible for major flooding south from Brisbane to Gippsland and severe ocean damage and gales between Brisbane and the Tasmanian east coast.
Severe lows over the period 2000–2020 are well represented in the lists of east coast floods (Callaghan and Power 2014), lists of severe ocean damage (Callaghan 2020) and Victorian ECLs (Callaghan 2019a) so studying this 20-year period should represent the period 1967–2020 well. The only events that did not form downstream of TUs were where the TU was already interacting with a TC advancing pole-wards such as ex-TC Oswald 2013 (Leroux et al. 2019). The later part of this paper describes this general interaction in detail. In this study, to represent all cases since 1967, we examined in detail nine of the strongest impacting ECL events since 1967. It is extremely important to show that these nine events are indeed significant, and reasons must be given for their selection. Full details of these nine events are provided in Table 1 with synoptic charts in Appendix 2.

|
3 Data
This report uses data and charts from the Bureau of Meteorology with high-density upper air data available during the years up to the 1990s. More reliance was placed on computer-generated upper data in later years as the computed models improved and radiosonde data density decreased.
Weather map data also came from the National Centres for Environmental Prediction/National Centre for Atmospheric Research (NCEP/NCAR) Reanalysis Project, which is available at available at NCEP/NCAR Reanalysis 1: NOAA Physical Sciences Laboratory (https://psl.noaa.gov/data/gridded/data.ncep.reanalysis.html). Surface wind data over the ocean were obtained from the Advanced Scatterometer (ASCAT) aboard the EUMETSAT METOP satellite (https://manati.star.nesdis.noaa.gov/datasets/ASCATData.php). Wave data were obtained from the Qld Government’s web site (https://apps.des.qld.gov.au/waves/) and the Manly Hydraulics laboratory web site (https://www.mhl.nsw.gov.au/).
Radiosonde data came from Bureau of Meteorology archives and from the Wyoming University web site at http://weather.uwyo.edu/upperair/sounding.html.
Microwave imagery came from the US Naval Research Laboratory Monterey web site at https://www.nrlmry.navy.mil/tc_pages/tc_home.html.
Synoptic observations were sourced from Bureau of Meteorology archives and the excellent web site at www.meteomanz.com/?l=1.
4 Demonstration of common ECL development pattern
The nine cases described in Table 1 demonstrate how low-pressure areas develop into significant ECLs downstream of a TU in an area of 200 and 700 hPa WAA. In the cases with the largest msl pressure falls, the TU was in the vicinity of the cold 700 hPa centre (or in the process of coming close together). This reflects the idealised structure of a cyclonic potential vorticity anomaly (CPV) as described by Hoskins et al. (1985) of a warm upper anomaly lying over a low to mid-level cool anomaly. A notable exception was the 1978 ECL, which had weak msl pressure falls occurring north of a large high with the pressure gradient between the two driving onshore gales onto the New South Wales (NSW) coast, resulting in widespread major flooding.
4.1 Comparison of developing ECLs
Below, these nine storms are described in some more detail along with two more recent events. It would appear the resultant deep low-pressure systems resulted from strong 200 hPa WAA from a TU or the intensification occurring in the vicinity of a vertical CPV centre. Heavy rain was related to the strength of the 700 hPa WAA, higher dewpoints or evidence of low static stability.
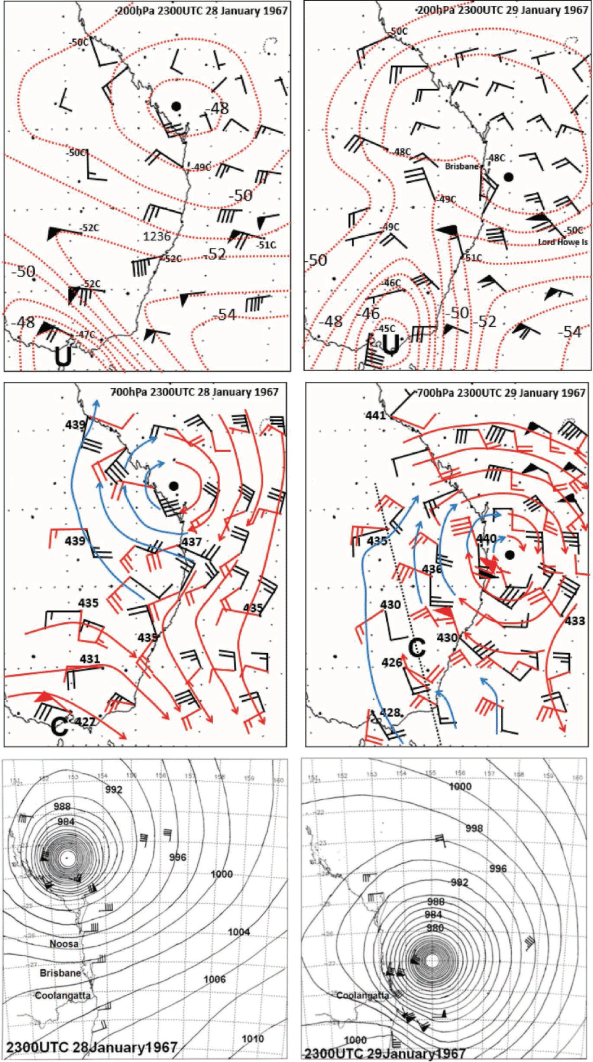
In the June 1967 case, dewpoints offshore at Lord Howe Island were 11–15°C with surface south-easterly winds rather than easterly winds during development of the ECL. A ship reported sea surface temperatures (SSTs) of 23°C just east of Brisbane at the time, which agreed with the reanalysis data. There were strong cool south-south-easterly surface winds south of the intensifying ECL moving over warm SSTs. Deep convection developed and a radar report at 0330UTC 26 June showed embedded echoes to 8 km elevation near 26.7°S, 153.5°E in a generally stratiform rain area. During intensification there was extraordinarily strong 200 hPa WAA with the TU moving close to the ECL at it developed. Strong 700 hPa WAA with heavy 24 h rain to 120 mm southeast Qld and 186 mm mid-north NSW coast.
For the May 1974 development, coastal dewpoints during 25–26 May were around 13°C. Extraordinarily strong 700 hPa WAA at Sydney led into rapid intensification with 700 hPa winds 140/25 m/s crossing 850–500 hPa shears 040/17.5 m/s. There was only moderate 200 hPa WAA but development occurred near a CPV vertical structure. Heaviest 24 h rain for Illawarra at Exeter 274.0 mm 26 May and a moderate flood was reported in the Hawkesbury River.
June 1975 dewpoints were 13–15°C on the NSW coast south of the developing low. Moderate 700 hPa WAA 10 m/s 700 hPa winds crossing 15 m/s 850–500 hPa shears. Extraordinarily strong 200 hPa WAA occurred with rapid deep intensification. There were major floods on the Illawarra and Shoalhaven River.
In March 1978, there was tropical air with dewpoints around 22°C over the NSW coast ahead of the developing low. A large high moved from the Great Australian Bight to over Tasmania as the low moved inland. There was generally weaker 700 hPa WAA with 10–12 m/s 700 hPa winds crossing 7–10 m/s 850–500 hPa shears, and weak 200 hPa WAA. There was slow intensification with strong pressure gradient between low and high as the low moved inland. There were major floods in many coastal rivers.
On 22 June 1998, at Williamtown the dewpoint was 13.3°C with strong 200 hPa WAA during rapid development and increasing WAA 700 hPa during development.
On 27 July 1984, at Williamtown dewpoint was 13.8°C with strong WAA 200 and 700 hPa during rapid development CPV near msl centre at peak intensity.
On June 2007, Newcastle Nobbys Beach had intense rainfall of 59.4 mm in 1 h to 0640UTC 8 June and dewpoints around 11°C. Williamtown had 45.8 mm in 1 h to 0300UTC 8 June in a thunderstorm and dewpoints dropped from 12°C to 9°C. Moderate 200 hPa but strong 700 hPa WAA. Top 24 h rainfall total to 2300UTC 8 June 293.6 mm at Mangrove Mountain.
In the April 2015, storm short-term rainfall records were broken when a convective complex observed by radar moved over the Tocal AWS (near Paterson Hunter Valley) from Dungog (30 km northeast of Tocal) and 205.2 mm was recorded in 3 h to 0000UTC 21 April 2021 following a record 242.6 mm in the 24 h to 2300UTC 20 April 2015. Dewpoints were relatively low ahead of the convection (14°C at Tocal). The 700 hPa wind speeds near Tocal were strong (around 25 m/s) making for strong WAA in the Newcastle area.
There were four fatalities and the NSW SES received 21 506 requests for assistance, and there were 171 flood rescues conducted during the event.
During development of the ECL of 5 June 2016, there was strong 200 and 700 hPa WAA along the NSW coast and dew points of 18–19°C on the coast south of the low as it developed. Averaged across eastern NSW, 5 June 2016 was the wettest day on record with a regional average of 73.11 mm, surpassing the previous record of 68.89 mm set on 19 January 1950. Fig. A9 shows strong 700 hPa rainfall throughout eastern NSW helping sustain such rainfall over a large area.
4.2 ECLs since 2016
Here two recent ECLs are examined which continued the occurrence of record-breaking ECL rainfall events.
During 9–10 February 2020, coastal dewpoints were 19–21°C as the low formed inland from the coast up in the Hunter Valley. There was strong 700 hPa WAA with the winds from 850 hPa up to 500 hPa averaging 20 m/s leading into the low development. A 200 hPa moderate WAA was directed inland west of Sydney. A large swell from the east-southeast (significant wave height of 6.6 m) was directed into Sydney. By 11 February, the SES has attended 12 000 jobs across the state including 254 flood rescues. There was a major flood in the Georges River despite an antecedent dry period. However, SSTs on 9 February were 1–2°C warmer than normal around Sydney (up to 26°C) undoubtably helping the heavy rainfall. An indicator of the spatial extent of the event is that rainfall averaged over the full coastal region of NSW, defined as that part of the state which drains into the Tasman Sea, for 7–13 February 2020 was a record 240.4 mm.
During 19–24 March 2021, a record-breaking coastal rain event occurred, with flooding in most coastal catchments in NSW and some adjacent parts of southeast Qld and eastern Victoria reaching record heights on the Hastings and Manning Rivers (Bureau of Meteorology 2021). This was a prolonged event with two episodes of TU intrusion into NSW. This resulted in the NSW SES handling over 12 000 requests for help and carrying out 1000 flood rescues. In the initial development the 200 hPa WAA from a TU was weak and spread out over much of NSW, while the 700 hPa WAA was focused on the mid-north coast of NSW. This resulted in a transient weak coastal trough rather than a robust ECL.
Warm moist air (dewpoints 19–20°C) was flowing onto the NSW coast on 19 March 2021 as a TU brought a broad area of weak to moderate WAA into eastern NSW. Relatively weak 700 hPa WAA was focused on the NSW mid-north coast. Some extreme rainfall fell on the NSW mid-north coast at Bowraville 124 mm in 1 h to 0100UTC 19 March and Upper Rolland Plains 288.0 mm in 9 h to 0700UTC 19 March. There were factors which made the WAA potent, producing extreme rainfall on the NSW mid-north coast despite the 850–500 hPa winds averaging only about 8–10 m/s. Along with the high dewpoints, a 700 hPa cold pool lay over Taree such that buoyancy was enhanced, which led to the WAA producing more rainfall (Callaghan and Power 2016).
Another TU influenced redevelopment of a low over NSW at 1200UTC 22 March 2021, which sustained the NSW rainfall and ultimately developed into a 985 hPa low off the northeast tip of Tasmania by 1200UTC 24 March 2021. For this region, the week ending 24 March 2021 was the wettest week on record, with a weekly regional average of 252.9 mm, surpassing the previous record of 240.4 mm set from February 2020.
4.3 Hybrid South Australian lows 2016
To help show the widespread nature of the TU low interaction, a recent paper from Quinting et al. (2019) illustrated two extratropical cyclones during May and September 2016 developing explosively over the Great Australian Bight. They were assessed as low-level warm-cored systems and show the CPV structure associated with their development (Fig. 1). At 0600UTC 7 May 2016, the warm 200 hPa centre (left top frame Fig. 1) was collocated with a 700 hPa cold pool (not shown) giving it a CPV structure. The TU (−47°C 200 hPa warm anomaly) and 60 knot (30 m/s) 200 hPa northwest winds directed the WAA down to the developing low whose central pressure fell from 997 hPa at 0600 UTC 7 May to 978 hPa at 0600 UTC 8 May. The lower frame shows another vertical CPV event at 1800UTC 27 September 2016 over the ocean south of the Western Australian coast. The low-pressure system, in response to the WAA from the TU, deepened to less than 985 hPa at 1800 UTC 27 September and the intensification continued until 0600 UTC 28 September when the central pressure reached 973 hPa.

|
4.4 Climatology of high-impact coastal low-pressure systems
A climatology has been constructed for all high-impact events both flooding and ocean damage (including TC events) between Brisbane and Eden (Power and Callaghan 2015; Callaghan 2020). These show that these high-impact events develop more frequently when the Southern Oscillation (SOI) is in a positive phase. Power and Callaghan (2016) showed that the frequency of major flooding in coastal southeast Australia has significantly increased since the late 19th century. Callaghan (2019a) added a Victorian climatology of ECLs affecting that state, and the Victorian 8-year moving average decile-10 rainfall shows the three largest peaks in the 1950s, 1970s and in 2010–2016 during positive phases of the SOI.
4.5 Examples of rapid intensification not downstream of TU
There are exceptions to the processes described above and one was related to the tragic circumstances associated with the Sydney Hobart Yacht Race of 1998. The other was the interaction of ex-TC Oswald with an upper trough (Leroux et al. 2019). In both these cases there were more complex interactions between PV centres near a TU and the msl low-pressure system. The Sydney Hobart Yacht Race storm is described in Appendix 3.
5 ET of TCs changes little in intensity
After interacting with a TU, TCs can produce extreme weather. One way this can happen is that it delays significant weakening as the TCs move into the sub-tropics. In this section the structure of a severe TC (Dinah 1967) as it moved into the sub-tropics and intensified is discussed. This is then compared with two severe TCs Bola (1988) and Drena (1997) for which significant weakening was delayed as they moved over New Zealand.
5.1 Dinah 1967
McAneney et al. (2019) in their study of normalised insurance losses for 1966–2017 showed that TC Dinah when it crossed Fraser Island and came close to the Gold Coast in January 1967 caused losses of 4685 million normalised AUD placing it a close second in TC impacts just behind the infamous Tracy which struck Darwin on Christmas Day 1974.
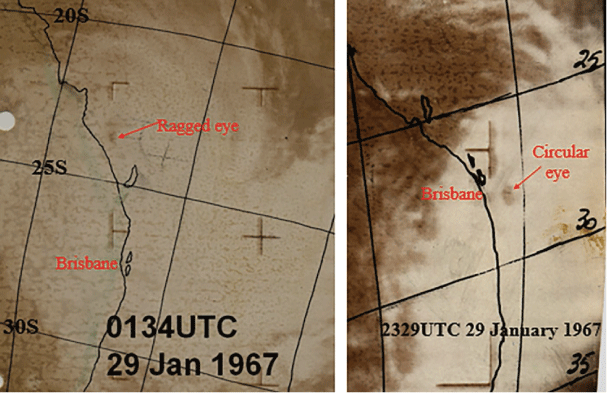
Dinah moved down the coast to the waters east of Brisbane while intensifying east of an upper trough (Fig. 2). The TU for this trough system passed to the south of Melbourne well away from and having no influence on the intensification of the cyclone. The cyclone was embedded in warm air at 200 hPa associated with its own structure. The WAA at 700 hPa at 2300UTC 28 January 1967 (centre left frame) in the vicinity of Dinah was restricted to its western flank as it had weakened over the previous 24 h. It intensified again over the 24 h period in Fig. 2 as it approached the deep trough system and the WAA began to wrap more around its core as the 850–500 hPa shears (temperature and thickness gradient) increased in strength, particularly west and south of its centre. These stronger shears were mostly north-westerly, indicating the colder air being located in the trough region to the west. The WAA at 700 hPa wrapping around TC cores was associated with TC intensification (Callaghan and Tory 2014; Callaghan 2018, 2019b, 2019c). Dinah remained far away from the deep trough system over this period and so was not affected by strong winds over the centre at 200 hPa. As it intensified, the 200 hPa winds near it were of a similar direction and speed as Dinah’s forward progress (north-north-westerly at 11 knots) with the main upper outflow channel to the south. Evidence of its intensification over this period is shown in the rare satellite imagery (Fig. 3) in which a ragged barely-discernible eye evolved into a clear circular eye east of Brisbane. Midway through this period a msl pressure of 944.8 hPa was read in the centre of Dinah on Fraser Island.
|
|
5.2 Bola 1988
From Fig. 4 (top frames) a 200 hPa trough can be seen west of Bola (winds changing from a southerly to northerly direction) and the undulation associated with this trough merged with the warm upper air over TC Bola. A 700 hPa north-westerly to north-easterly flow across the isotherms showed a WAA extended on the east coast of the North Island of New Zealand. At this time the central pressure of Bola was 975 hPa having weakened only slightly from 970 hPa at 1200UTC 4 March 1988. The slow weakening continued and the central pressure of Bola was 980 hPa at 0000UTC 8 March 1988 (lower right frame Fig. 4). Extreme rainfall fell on the east coast of the North Island in the 48 h to 0000UTC 8 March 1988 as Bola approached New Zealand.

|
Cyclone Bola created some of the heaviest rainfall totals for a single storm in the history of New Zealand, one station recorded 419 mm (16.5 in.) in a 24 h period (Sinclair 1993). The maximum rainfall total attributed to the storm was 917 mm (36.1 in.), reported at a station near Tolaga Bay. Storm damage was heaviest in Gisborne, where rain destroyed or damaged several roads and bridges. Flooding killed three people when a car was swept away.
From reanalysis of data at 0000UTC 8 March 1988, Bola was within a 850 hPa warm centre which extended up to middle levels as a thermal ridge and thence to a 200 hPa warm centre, probably making it a deep asymmetric warm system.
5.3 Drena 1997
Upper frames of Fig. 5 show a TU associated with an upper trough merging with the warm air above TC Drena, which was still severe in the sub-tropics at 0000UTC 9 January 1997 with a central pressure 970 hPa. In the following 24 h, a strong WAA was present at 200 hPa ahead of Drena as it moved down towards New Zealand. At 700 hPa (centre frames), a strong WAA was evident east of Drena which extended over New Zealand by 0000UTC 10 January 1997. The msl sequence (lower frames) show Drena growing substantially as it absorbed a small low related to the upper trough. During this process, the central pressure filled to 984 hPa.

|
In New Zealand, TC Drena was responsible for damage to roads, property and agriculture. Three deaths were reported: one man was electrocuted by a fallen powerline and an elderly couple died when their car slid sideways into another car on a road.
A total of 44 homes were flooded and subsequently damaged. In the North Island, trees and powerlines were downed and house roofs were lifted. Widespread damage and flooding was reported in Auckland. Throughout the island, widespread rain and flooding was reported. In addition, Hauraki Gulf measured winds of up to 160 km/h (86 knots).
From reanalysis of data at 0000UTC 10 January 1997, Drena was within a warm ridge from low levels to 200 hPa also probably making it a deep asymmetric warm system.
6 Severe extratropical cyclones after ET following trough interaction which almost destroys the TC
The ET of TCs Lance 1984, Giselle 1968, Audrey 1964 and Herbie 1988 are discussed below.
6.1 ET and WAA
The importance of the low-level WAA in ET has been discussed in the literature. Klein et al. (2000) showed that the distribution of thermal advection contributes significantly to the increase in low-level cyclonic vorticity. Harr and Elsberry (2000) compared strong and weak ET cases. In their weak non-intensifying example, there was a cold mid-latitude cyclone pole-ward of the tropical cyclone and the WAA was about 900 km from the cyclone (their fig. 14c) and well removed from the thermal ridge. Whereas, in their strong case, the WAA maximum was much closer to the cyclone and the axis of the thermal ridge (their fig. 5c). Wernli et al. (2002) discussed how low-level WAA played a crucial role in the development in one of the worst extratropical cyclones to affect Europe, Lothar in December 1999.
6.2 ET of TC Lance
The remnants of TC Lance were a weak low-pressure area with several centres at 1100UTC 7 April 1984 (Fig. 6). However, at upper levels at the time there was a strong TU almost collocated with a 700 hPa cold pool and WAA advection at 200 hPa overlaid strong WAA at 700 hPa near Brisbane. The WAA advection at both levels strengthened over Brisbane in the following 12 h (not shown), while the low-pressure area explosively deepened below 990 hPa as it moved out to sea and it deepened further over the next 24 h.

|
Sustained winds probably reached 65 knots. There was damage to boats on the western side of offshore islands near Brisbane in storm-force westerlies and 20 boats were driven ashore on Moreton Island. On the Gold Coast, the SES estimated 250 houses were unroofed and another 2000 damaged with many losing roofing and sustaining rain damage. Wind drove rain into high-rise buildings at Coolangatta. Huge seas hit the Gold Coast and there were five helicopter rescues to stricken yachts at sea. Inland there was significant wind damage to state forests in the Warwick region of the Darling Downs. There was a major flood at Lismore in northern NSW.
Reanalysis data showed that, as it intensified, the cyclone was in a warm ridge from low levels up to 500 hPa and by 1800UTC 8 April a strong 200 hPa warm centre moved over the system, making it a deep asymmetric warm system.
6.3 ET of TC Giselle
Giselle reached peak intensity as a TC with a central pressure of 982 hPa on 1100UTC 7 April 1968 (Bureau of Meteorology 1969) while 240 km west of Noumea. There was satellite coverage for Giselle and around peak intensity it acquired a cirrus overcast of around 5° latitude extent with some breaks evident. As it progressed south it maintained an extensive cloud mass on its eastern side and a broad band to the south-southeast. At no time was an eye visible.
A TU associated with an upper trough merged with another undulation and the warm air above Giselle in the 24 h from 2300UTC 8 April 1968 (top frames Fig. 7). From the centre frames, the trough at the 700 hPa level amplified with WAA (from winds or height contours crossing isotherms) initially to its east and then wrapping around the southern side of the circulation of Giselle. At the same time, the remnants of Giselle which had a central pressure of around 995 hPa (lower frames) at 2300UTC 8 April 1968 rapidly deepened to below 970 hPa in 24 h.

|
At peak intensity at 2300UTC 9 April 1968, reanalysis showed that the cyclone was in a warm ridge from low levels up to 500 hPa, above which in was under the influence of a cold cyclone so it could be described as a moderately deep asymmetric warm system.
The following information is taken from the official National Institute of Water and Atmospheric Research (NIWA) report found at https://hwe.niwa.co.nz/event/April_1968_New_Zealand_Ex-tropical_Cyclone_Giselle.
Ex-TC Giselle affected every region in New Zealand, with high winds, heavy rain, flooding, landslips and high seas. The inter-islander ‘Wahine’ sank in Wellington Harbour during the storm, with the loss of 51 lives. There were other casualties, one in Northland, three in Wellington due to high winds and a man who went missing on Stewart Island. Weather-related injuries were reported in Waikato, Manawatu-Wanganui and Wellington. Gisborne Aerodrome recorded a peak wind gust of 76 knots (141 km/h) on 10 April, at 050° true. Ohakea recorded a peak wind gust of 84 knots (156 km/h) on 10 April, at 270° true.
The worst damage, however, was in the Wellington region where 3657 insurance claims were made for storm damage. Wellington experienced full hurricane-force winds for several hours on 10 April.
A 7-year-old girl was killed on 10 April by blown roofing iron. An elderly woman died in Wellington on 10 April when her small home was enveloped by wind-whipped flames. An elderly man died after being bowled over by the wind. Gracefield recorded a peak gust of 98 knots (181 km/h) on 10 April, at 210° true. Hawkins Hill recorded gusts of up to 126 knots (235 km/h) on 10 April. Kelburn (elevation 125 m) recorded a peak gust of 107 knots (198 km/h) on 10 April, at 210° true. Kingston received the worst property damage from the storm with 98 houses partly unroofed. Six or more houses in Kingston Heights were virtually demolished, three being torn completely apart and flattened, and 20 others were unroofed. Dozens of houses were left with shattered windows, and light fixtures and other unfixed items were also shattered. Near Oteranga Bay (west of Wellington) gusts of up to 267 km/h (145 knots) were recorded on 10 April. Oteranga Bay (elevation 174 m) recorded a peak gust of 131 knots (243 km/h) on 10 April, at 220° true. Paraparaumu Aerodrome recorded a peak gust of 93 knots (172 km/h) on 10 April, at 210° true. Wellington Harbour recorded winds of 120–160 km/h on 10 April. Wellington Airport recorded a peak gust of 101 knots (187 km/h) on 10 April, at 210° true. Wellington Airport also recorded sustained (10 min mean) wind speeds of 70 knots (130 km/h).
6.3.1 The 1936 cyclone showed that Giselle is not such a unique event to New Zealand
From another NIWA report in 1936 a cyclone formed south of the Solomon Islands on 28 January 1936. On 1 February it was centred near Norfolk Island. It then interacted with a cold front that caused it to intensify prior to hitting the North Island of New Zealand on 1 February. During the night it increased in speed and intensity, with the centre passing over Auckland. By 9 am on the 2 February 1936 it was centred near Kawhia (55 km southwest of Hamilton) and by Monday 3 February 1936 the storm centre had passed over Chatham Island. Reports stated that the barometer at Auckland dropped to 967.5 hPa at the storm’s peak. The official reading however was 974.1 hPa. Twelve people lost their lives and it brought high winds, heavy rain, flooding and rough seas to the whole North Island and Marlborough, which caused widespread damage. Damage was reported to exceed 1 billion 2008 NZD.
6.4 ET TC Audrey
Audrey tracked from the Gulf of Carpentaria down to Coffs Harbour on the NSW coast during January 1964 (Bureau of Meteorology 1966). On its overland journey it weakened until it reached Boulia in western Qld. It then began to intensify as it began to rapidly move toward the southeast and its track is shown in Fig. 8 (top frame) where the heavy rainfall is shown to the south of the track. It was travelling at 57.3 km/h when it passed through Charleville. The 700 hPa charts showed 700 hPa WAA increase (from strong shears and winds) as Audrey approached Charleville (Fig. 8). The positions of the TU are noted on the reanalysis 700 hPa charts. There was strong 200 hPa WAA from the TU towards Audrey with west-north-westerly winds of 25 m/s across a strong thermal gradient as the cyclone intensified (not shown).

|
Reanalysis charts showed that Audrey from 2300UTC 13 January 1964 was in a warm ridge from low levels up to 600 hPa and was indeterminate above this, classifying it as probably an asymmetric moderate level warm system.
Eulo recorded 229.0 mm in 24 h, an all-time rainfall record there since 1887. Reports from Metavale, a cattle and sheep station (36 km southeast of Eula), showed rainfall intensity increased at 1000UTC 13 January with 90.93 mm in 3 h to 1300UTC 13 January and 147.57 mm in the following 5 h and 296.41 mm in the 24 h period. This is phenomenal rainfall considering that it passed through the area at 57.3 km/h which attests to the potency of WAA for extreme rainfall. Record flooding occurred and stock losses were great with 5000 sheep lost at a property near Thargomindah, 7000 sheep near Cunnamulla and 10 000 sheep at a station near Quilpie. Thousands of sheep were lost at Goodooga 32 km south of the border in NSW. Many hundreds of people were evacuated from their homes in NSW.
Charleville showed (centre panels Fig. 8) WAA at 1100UTC 13 January 1964, which increased up to 1700UTC 13 January 1964 and was the period that Metavale Station (230 km south-southwest of Charleville) received the intense rainfall. There was drier air to the north of Charleville which kept the heavy rainfall further south. Near the core of the cyclone drier air would have been circulating around the western side of the cyclone as southerly winds crossed the westerly shears.
There was severe structural wind damage. The cyclone hit St George at 2200UTC 13 January, and 52 houses lost all or part of their roofs and 22 of the business houses were badly damaged – 38 mm of rain was recorded in 15 min. At Goondiwindi, 50 buildings were unroofed, the railway goods shed was destroyed and a church hall was flattened. Telegraph poles were snapped off. At nearby Boggabilla, every building was partially or completely unroofed. Buildings were also badly damaged at Windorah, Quilpie, Cheepie, Charleville, Talwood, Toobeah (many houses unroofed), Pittsworth, Glen Innes and Grafton.
6.5 ET TC Herbie
TC Herbie was an exceptional TC for its late occurrence in the year and unusually fast south-eastward motion (Foley and Hanstrum 1994). Herbie caused wind damage between Carnarvon and Denham, produced a storm surge at Denham that left fishing vessels stranded along the main street, grounded a large freighter at Cape Cuvier and caused flooding along the Irwin and Greenough Rivers, inundating the streets of Dongara.
Herbie developed to the northwest of Cocos Island on 18 May 1988, passing close to the island at 0000UTC on 19 May as a weak TC (category 1) having a central pressure of 990 hPa. Satellite imagery suggested the development of a new low, some 300 km to the south of the original centre on 19 May. This new centre moved rapidly to the southeast and intensified at the expense of the original. Herbie moved some 1500 km in the 24 h prior to crossing the coast at Shark Bay, reaching speeds of over 70 km/h. The central pressure was measured at 980 hPa at landfall. Carnarvon recorded a wind gust of 120 km/h and similar speeds were estimated at Denham. Herbie continued its south-eastward track through inland parts of the state and gradually weakened.
Herbie underwent a change in structure as it accelerated into the mid-latitudes with the strongest winds on its left quadrants where the clockwise rotating winds were augmented by the system’s translational speed. Fig. 9 at 700 hPa shows a similar pattern to Audrey with WAA developing in the dry air north of Herbie, producing heavy rainfall south of Herbie’s track and the cold air advection (CAA) and descent west of the core of Herbie as discussed for Audrey above occurred at Carnarvon and Learmonth in Fig. 9 (lowest frame). Reanalysis 700 hPa charts showed the positions of the TU. There was strong 200 hPa WAA from the TU onto the coast over the period with the 200 hPa west to west-north-westerly winds at Carnarvon varying from 25 to 35 m/s grading to 50 to 80 m/s at Albany in the far south. The heavy rain was south of the TC track (top frame Fig. 9), which was similar to the Audrey case.

|
Reanalysis data showed that Herbie at landfall was in neutral thermal patterns up to 700 hPa, above which it became embedded in warm thermal ridges.
In fig. 10 from Foley and Hanstrum (1994), the msl sequence shows Herbie making landfall and crossing Western Australia. Their fig. 14 shows a sequence of WAA at 850 hPa moving over the Denham area by 2300UTC 21 May 1988.
6.6 Another example of this type
A severe TC crossed the coast near Yeppoon (central Qld) early on 1 February 1893 (Callaghan and Power 2014 ) and probably began to interact with an upper trough, which produced a 998 hPa ECL east of the Sunshine Coast on 2 February. The low remained slow moving and made landfall on the Sunshine Coast just north of Brisbane at 2300UTC 3 February. Crohamhurst (on Stanley River) recorded 907 mm of rain in 24 h to 9 am 3 February 1893, which was an Australian record until 1979. A 15.2 m high wall of water was observed to roar down a Stanley River gorge (tributary of the Brisbane River). More than 150 houses were washed down the Brisbane River. The Indooroopilly Railway Bridge and the Victoria Bridge were both washed away. The highest ever flood was recorded in Brisbane City. Around 29 lives were lost in the Brisbane region.
7 High-impact events from initially weak tropical lows moving onto the coast with strong 700 hPa WAA and robust msl highs forcing up into the lows from the south
These two events had only weak apparent effect from TUs. The role of the TUs may have been to lock the initially weak TCs into their current latitude as the highs pushed in from the south, thereby initiating a pincer effect on the southern flanks of the weak cyclones.
7.1 TC Wanda 1974
Wanda intensified at landfall having winds less than gale force prior to this. It made landfall at 1100UTC 24 January 1974 beneath weak 200 hPa WAA from a TU well inland with more pronounced WAA at 700 hPa east and south of its centre. Intensification was due to a strengthening msl ridge to its south where winds reached storm force. Torrential rain followed landfall and, in the 5 days to 2300UTC 28 January, falls reached 900 mm in the Brisbane area. Mt Glorious had 1318 mm. Brisbane recorded 314 mm in the 24 h to 9 am 26 January (Bureau of Meteorology 1974). Heavy rain in the 24 h to 3 pm 27 January caused the major flood. In the Brisbane Ipswich region, 6007 houses were flooded, 56 of these were destroyed or condemned. The first houses were washed away along Enoggera Creek early on 26 January. Insurance losses were 2645 million in 2011 AUD. Twelve people were drowned in Brisbane and Ipswich. Additionally, several elderly people suffered fatal heart attacks while being evacuated and a 2-year-old child drowned in a Brisbane creek. Major floods also affected the Gold Coast and northeast NSW.
7.2 TC Beth 1976
Beth with strong 700 hPa WAA east and south of its centre moved towards the coast as a weak TC where a TU was located. It intensified leading up to landfall, as a strong msl ridge developed to its south. TC Beth crossed the coast near and to the north of Bundaberg at 2300UTC 21 February 1976. Widespread damage occurred in the Maryborough–Bundaberg area. The cyclone had an asymmetric wind field with a band of hurricane-force winds on the southern flank where it interacted with the intensifying msl high to the south. A Bureau of Meteorology Brisbane survey team observed widespread damage in the Maryborough–Bundaberg area with 200 homes unroofed, two aircraft damaged and rainfall up to 200 mm caused flash flooding and cut roads for 18 h.
8 Hurricane Sandy, New York City
Hurricane Sandy (see Blake et al. 2013) has become the new benchmark ET storm. It is included here to compare with the above storms in Australasia. Due to the huge loss of life and widespread damage caused by Sandy in the sub-tropics, it is important to determine if similar storms in Australasia have occurred and if so as population increases will such disastrous impacts begin to affect Australia and New Zealand.
Between 1200UTC 29 October 2012 and 0000UTC 30 October 2012, the 200 hPa temperature gradient increased over Atlantic City (top frames Fig. 10) as a TU approached the area with WAA winds of 35–65 knots (17–32 m/s) directed towards Atlantic City from the undulation. The undulation then appeared to merge with the warm air above Sandy at 0000UTC 30 October 2012 and the WAA winds over Atlantic City reduced to 25–35 knots (12–17 m/s) as Sandy made landfall. At 1200UTC 29 October 2012 there was 700 hPa WAA onto the coast north from Wallops Island radiosonde station, which receded to the western side of the hurricane circulation by landfall. At 0000UTC 30 October 2012, Atlantic City near the centre had north-north-westerly winds of 8 knots, a bar of 945.6 hPa with present weather mist and 36 mm of rain over the previous 6 h, indicating that the rain had just cleared the station. Sandy at 1200UTC 29 October 2012 (Blake et al. 2013) reached peak intensity of 85 knots (1-min winds), central pressure 945 hPa, over SSTs of 27°C, following a period of weakening. At landfall, the central pressure was much the same and it was over much colder waters of 17°C. The barometric pressure appears to have been maintained by the approach of the undulation and warm upper air although the intensity dropped as shown below.

|
Note the storm-force observations near New York with the northernmost from JFK Airport and the two southern buoys just off the New York Harbour entrance. The wind speeds measured at the buoys were at 5 m above sea level with high energy waves (peak period 15 s) reaching significant wave height of 9.9 m and therefore producing extreme surface roughness. Therefore, the best track peak wind-speed at landfall of 70 knots (1-min average) appears justified. In addition, a Texas Tech University (TTU) measurement tower near Long Beach, New Jersey, reported a 1-min mean wind of 53 knots (27.3 m/s) at a height of 2.25 m at 0000 UTC 30 October. This observation implies 10-min winds of about 68 knots (35.0 m/s) using standard adjustment factors, as analysed by TTU, and supports the estimated intensity of 70 knots or 36 m/s 1-min winds at landfall.
A record water level of 14.06 feet (4.285 m) above mean low water level was recorded at Battery Park, New York City, at 0140UTC 30 October 2012, close to the time of the highest storm surge and peak astronomical tide. At 0100UTC 30 October, the two buoys off the entrance to New York Harbour reported east-south-easterly 1-min winds of 46 and 48 knots while they reported long-period (14–15 s) significant wave heights of just under 10 m from the east and east-southeast. Therefore, these severe wind and wave conditions had an almost immediate effect on New York City. The storm tide at Kings Point (western end of Long Island Sound) of 14.31 feet (4.362 m) above mean low water level was recorded at 0200Z 30 October 2012 with the peak storm surge of 12.65 feet (3.856 m) at 2250Z 29 October 2012 (which was the highest storm surge measured) and the peak tide there occurred at 0410Z 30 October 2012.
While Sandy approached the coast of New Jersey, some fundamental changes occurred in the structure of the cyclone, resulting in its completion of post-tropical transition near 2100 UTC 29 October. Dropsondes during that day indicated that low-level temperatures within a few miles of the centre of Sandy decreased significantly, with surface temperatures dropping from 25°C at 1400 UTC to 17°C at 2100 UTC 29 October 2012. Note the centre frames in Fig. 10 where the 700 hPa temperature around the centre dropped from near 14°C to near 8°C.
Characteristics of wave battering or impact from heavy waterborne debris were found in Long Beach Island and Mantoloking, New Jersey; Staten Island and Queens, New York; and Westerly, Rhode Island. The most severe effects were observed in Long Beach Island and Mantoloking (Guy Carpenter and Company 2013; Irish et al. 2013). Many of the above locations were 2 m or less above mean sea level, which helps explain the devastating damage. The New Jersey Governor’s office estimates that 346 000 housing units were damaged or destroyed in that state, with 22 000 of those units uninhabitable. In New York, the governor’s office estimates that 305 000 homes were destroyed in the state, mostly by storm surge. There were 43 Hurricane Sandy-related deaths in the state of New Jersey and at least 53 civilians in New York City.
The structure of Sandy at 0000UTC 30 October 2012 was determined as a deep asymmetric warm core system (Hart 2003). Exploring reanalysis data at the same time from 850 to 700 hPa showed a warm centre near Boston, at 500 hPa a warm centre near Jersey City, at 300 hPa a warm centre over Sandy at Atlantic City and thence to the warm centre with the TU off the coast. Thus, the warm centre associated with Sandy at landfall sloped southwest, then south and then southeast.
9 Conclusion
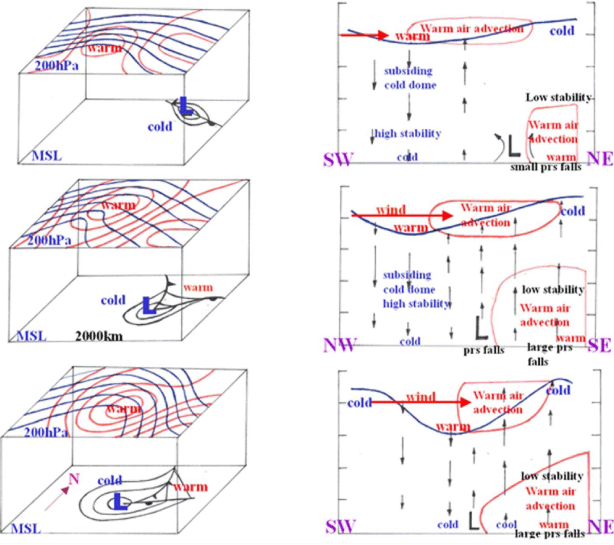
A characteristic of TCs not found in other intense cyclones is the upper-level outflow whose features give a distinctive pattern when viewed from satellite imagery. Apart from TC Dinah, the storms described above are characterised by inflow at upper levels. Severe extratropical cyclones were shown to develop along the Australia east coast downstream of a TU, which highlighted a region of a CPV anomaly. The msl development occurred where there had been WAA evident at 700 hPa. Strong 200 hPa WAA led to the rapid intensification of a June 1967 event. A strong vertical CPV structure led to rapid cyclogenesis in the cases of events during May 1974, June 1998, June 2007 and two South Australian events in 2016. The 1998 Sydney Hobart storm reached maximum intensity as it moved under a vertical CPV. The July 1984 event started with strong 200 hPa WAA from a vertical CPV and then strong 700 hPa WAA developed in the Tasman Sea onto the NSW coast, culminating in a warm-cored system. In the case of March 1978, the WAA was not as impressive as the above events; however, the strong msl high to the south helped turn these into major events. Strong msl highs to the south of the April 2015 and June 2016 events helped enhance their development. A schematic diagram is included in Fig. 11 to describe the process of a TU causing cyclogenesis.
|
Similar explosive development occurred with ET events in the Australasian region, where the upper trough associated with the TU initially weakened the TC. These ET events were shown to be destructive even in the dry interior of Australia. A variation of this sequence involved weak TCs with strong 700 hPa WAA making landfall onto the Australian coast, while interacting with a weak TU, and evolving into high-impact events following development of strong msl ridges to their south. Another form of an ET event occurred where the TU came close to or merged with the warm air above a TC as it moved into the sub-tropics, changing the structure of the TC but retarding its weakening such that they caused destructive winds and major flooding in populated centres. The structure of these events was compared with a very severe TC which made it into the sub-tropics. The Australasian ET events were compared with the US disastrous ET event associated with Hurricane Sandy during October 2012. The Australasian events were affected by wind, flood and ocean damage. For example, Herbie caused a ship to founder and it was reported by surf lifesaving authorities that many of the deaths associated with the sinking of the ‘Wahine’ in Wellington Harbour during TC Giselle were caused by large dumping waves on the Wellington Harbour foreshore as people tried to clamber ashore. Sandy, which had just reached US hurricane-force strength, would only be assessed a Category 2 cyclone in Australasia, where sustained winds are measured over a 10-min period. Sandy was accompanied by ocean waves and storm surge damage. This was especially the case in New York City and the New Jersey Coast, which are extremely vulnerable to wave and storm surges because of low coastal elevations. Additionally, the population density of New York City and New Jersey is far greater than any part of Australasia at the present time. Lessons could be learned from the impact of Sandy in the general expectation that ocean levels and population density will increase in Australia over the next century.
Data availability
The data that support this study will be shared upon reasonable request to the corresponding author.
Conflicts of interest
The author declares no conflicts of interest.
Declaration of funding
This research did not receive any specific funding.
References
Blake ES, Kimberlain TB, Berg RJ, Cangialosi JP, Beven II JL (2013) Tropical Cyclone Report Hurricane Sandy (AL182012) 22–29 October 2012. National Hurricane Center, USA.Bureau of Meteorology (1966) Tropical cyclones in the Northeastern and North-western Australian regions 1963–1964 Season. Meteorological Summary.
Bureau of Meteorology (1969) Tropical cyclones in the Northern Australian Regions 1967–1968 season. Meteorological Summary.
Bureau of Meteorology (1974) ‘Brisbane floods January 1974’. Australian Government Publishing Service.
Bureau of Meteorology (1999) Preliminary report on meteorological aspects of the 1998 Sydney to Hobart Yacht Race.
Bureau of Meteorology (2021) Special climate statement 74 – extreme rainfall and flooding in eastern and central Australia in March 2021.
Callaghan J (2004) The OTHER CYCLONES. International Conference on Storms, Brisbane Australia July 2004.
Callaghan J (2005) Extra-tropical transition and the continuum between extra-tropical cyclones and tropical cyclones. WMO/TMRP International Workshop on Tropical/Extra tropical Interactions Perth 5–9 December 2005.
Callaghan J (2008) Presentation Sydney East Coast Low Workshop, Bureau of Meteorology Sydney.
Callaghan J (2017a) A diagnostic from vertical wind profiles for detecting extreme rainfall. Tropical Cyclone Research and Review 6, 41–54.
| A diagnostic from vertical wind profiles for detecting extreme rainfall.Crossref | GoogleScholarGoogle Scholar |
Callaghan J (2017b) Asymmetric inner core convection leading to tropical cyclone intensification. Tropical Cyclone Research and Review 6, 55–66.
| Asymmetric inner core convection leading to tropical cyclone intensification.Crossref | GoogleScholarGoogle Scholar |
Callaghan J (2018) A short note on the rapid intensification of hurricanes harvey and irma. Tropical Cyclone Research and Review 7, 164–171.
| A short note on the rapid intensification of hurricanes harvey and irma.Crossref | GoogleScholarGoogle Scholar |
Callaghan J (2019a) A comparison of weather systems in 1870 and 1956 leading to extreme floods in the Murray–Darling Basin. Journal of Southern Hemisphere Earth Systems Science 69, 84–115.
| A comparison of weather systems in 1870 and 1956 leading to extreme floods in the Murray–Darling Basin.Crossref | GoogleScholarGoogle Scholar |
Callaghan J (2019b) The interaction of hurricane Michael with an upper trough leading to intensification right up to landfall. Tropical Cyclone Research and Review 8, 95–102.
| The interaction of hurricane Michael with an upper trough leading to intensification right up to landfall.Crossref | GoogleScholarGoogle Scholar |
Callaghan J (2019c) A short note on the intensification and extreme rainfall associated with hurricane lane. Tropical Cyclone Research and Review 8, 103–107.
| A short note on the intensification and extreme rainfall associated with hurricane lane.Crossref | GoogleScholarGoogle Scholar |
Callaghan J (2020) Extraordinary sequence of severe weather events in the late-nineteenth century. Journal of Southern Hemisphere Earth Systems Science 70, 252–279.
| Extraordinary sequence of severe weather events in the late-nineteenth century.Crossref | GoogleScholarGoogle Scholar |
Callaghan J (2021) Weather systems and extreme rainfall generation in the 2019 north Queensland floods compared with historical north Queensland record floods. Journal of Southern Hemisphere Earth Systems Science 71, 123–146.
| Weather systems and extreme rainfall generation in the 2019 north Queensland floods compared with historical north Queensland record floods.Crossref | GoogleScholarGoogle Scholar |
Callaghan J, Power SB (2014) Major coastal flooding in south-eastern Australia 1860–2012, associated deaths and weather systems. Australian Meteorological and Oceanographic Journal 64, 183–213.
| Major coastal flooding in south-eastern Australia 1860–2012, associated deaths and weather systems.Crossref | GoogleScholarGoogle Scholar |
Callaghan J, Power SB (2016) A vertical wind structure that leads to extreme rainfall and major flooding in southeast Australia. Journal of Southern Hemisphere Earth Systems Science 66, 380–401.
| A vertical wind structure that leads to extreme rainfall and major flooding in southeast Australia.Crossref | GoogleScholarGoogle Scholar |
Callaghan J, Tory K (2014) On the use of a system-scale ascent/descent diagnostic for short-term forecasting of Tropical Cyclone development, intensification, and decay. Tropical Cyclone Research and Review 3, 78–90.
| On the use of a system-scale ascent/descent diagnostic for short-term forecasting of Tropical Cyclone development, intensification, and decay.Crossref | GoogleScholarGoogle Scholar |
Chen H, Zhang D-L (2013) On the rapid intensification of hurricane wilma (2005). Part II: convective bursts and the upper-level warm core. Journal of the Atmospheric Sciences 70, 146–162.
| On the rapid intensification of hurricane wilma (2005). Part II: convective bursts and the upper-level warm core.Crossref | GoogleScholarGoogle Scholar |
Dowdy AJ, Mills GA, Timbal B (2011) Large-scale indicators of Australian East Coast Lows and associated extreme weather events. CAWCR Technical Report No. 037.
Dowdy AJ, Mills GA, Timbal B (2013) Large-scale diagnostics of extratropical cyclogenesis in eastern Australia. International Journal of Climatology 33, 2318–2327.
| Large-scale diagnostics of extratropical cyclogenesis in eastern Australia.Crossref | GoogleScholarGoogle Scholar |
Dowdy AJ, Pepler A, Di Luca A, Cavicchia L, Mills G, Evans JP, Louis S, McInnes KL, Walsh K (2019) Review of Australian east coast low pressure systems and associated extremes. Climate Dynamics 53, 4887–4910.
| Review of Australian east coast low pressure systems and associated extremes.Crossref | GoogleScholarGoogle Scholar |
Dysthe KB, Harbitz A (1987) Big waves from polar lows. Tellus 39, 500–508.
| Big waves from polar lows.Crossref | GoogleScholarGoogle Scholar |
Foley GR, Hanstrum BN (1994) The capture of tropical cyclones by cold fronts off the west coast of Australia. Weather and Forecasting 9, 577–592.
| The capture of tropical cyclones by cold fronts off the west coast of Australia.Crossref | GoogleScholarGoogle Scholar |
Foster DN, Gordon AD, Lawson NV (1975) The storms of May June 1974 Sydney NSW, Second Australian Conference on Coastal and Ocean Engineering, Gold Coast.
Guy Carpenter and Company (2013) ‘Post sandy damage report’. (Guy Carpenter)
Harr PA, Elsberry RL (2000) Extra tropical transition of tropical cyclones over the western North Pacific. Part I: evolution of structural characteristics during the transition process. Monthly Weather Review 128, 2613–2633.
| Extra tropical transition of tropical cyclones over the western North Pacific. Part I: evolution of structural characteristics during the transition process.Crossref | GoogleScholarGoogle Scholar |
Hart RE (2003) A cyclone phase space derived from thermal wind and thermal asymmetry. Monthly Weather Review 131, 585–616.
| A cyclone phase space derived from thermal wind and thermal asymmetry.Crossref | GoogleScholarGoogle Scholar |
Hirschberg PA, Fritsch JM (1991a) Tropopause undulations and the development of extratropical cyclones. Part 1: overview and observations from a cyclone event. Monthly Weather Review 119, 496–517.
| Tropopause undulations and the development of extratropical cyclones. Part 1: overview and observations from a cyclone event.Crossref | GoogleScholarGoogle Scholar |
Hirschberg PA, Fritsch JM (1991b) Tropopause undulations and the development of extratropical cyclone. Part II: diagnostic analysis and conceptional model. Monthly Weather Review 119, 518–550.
| Tropopause undulations and the development of extratropical cyclone. Part II: diagnostic analysis and conceptional model.Crossref | GoogleScholarGoogle Scholar |
Hirschberg PA, Fritsch JM (1993) On understanding height tendency. Monthly Weather Review 121, 2646–2661.
| On understanding height tendency.Crossref | GoogleScholarGoogle Scholar |
Holland GJ (1997) The maximum potential intensity of tropical cyclones. Journal of the Atmospheric Sciences 54, 2519–2541.
| The maximum potential intensity of tropical cyclones.Crossref | GoogleScholarGoogle Scholar |
Holland GJ, Lynch AH, Leslie LM (1987) Australian East Coast cyclones. Part I. Synoptic overview and case study. Monthly Weather Review 115, 3024–3036.
| Australian East Coast cyclones. Part I. Synoptic overview and case study.Crossref | GoogleScholarGoogle Scholar |
Hopkins LC, Holland GJ (1997) Australian heavy-rain days and associated East Coast cyclones: 1958–92. Journal of Climate 10, 621–635.
| Australian heavy-rain days and associated East Coast cyclones: 1958–92.Crossref | GoogleScholarGoogle Scholar |
Hoskins BJ, McIntyre ME, Robertson AW (1985) On the use and significance of isentropic potential vorticity maps. Quarterly Journal of the Royal Meteorological Society 111, 877–946.
| On the use and significance of isentropic potential vorticity maps.Crossref | GoogleScholarGoogle Scholar |
Huo Z, Zhang D-L, Gyakum J (1995) A diagnostic analysis of the Superstorm of March 1993. Monthly Weather Review 123, 1740–1761.
| A diagnostic analysis of the Superstorm of March 1993.Crossref | GoogleScholarGoogle Scholar |
Irish JL, Lynett PJ, Weiss R, Smallegan SM, Cheng W (2013) Buried relic seawall mitigates Hurricane Sandy’s impacts. Coastal Engineering 80, 79–82.
| Buried relic seawall mitigates Hurricane Sandy’s impacts.Crossref | GoogleScholarGoogle Scholar |
Joubert PN (2005) Some remarks on the 1998 Sydney Hobart Race. Transactions of the Royal Society of Victoria 117, ix–xviii.
Klein PM, Harr PA, Elsberry RL (2000) Extratropical transition of western North Pacific tropical cyclones: an overview and conceptual model of the transformation stage Weather and Forecasting 15, 373–395.
| Extratropical transition of western North Pacific tropical cyclones: an overview and conceptual model of the transformation stageCrossref | GoogleScholarGoogle Scholar |
Leroux M-D, Nguyen-Hankinson MC, Davidson NE, Callaghan J, Tory K, Wain A, Huang X (2019) Environmental interactions during the extreme rain event associated with ex-tropical cyclone Oswald (2013). Journal of Southern Hemisphere Earth Systems Science 69, 216–238.
| Environmental interactions during the extreme rain event associated with ex-tropical cyclone Oswald (2013).Crossref | GoogleScholarGoogle Scholar |
Louis S, Couriel E, Lewis G, Glatz M, Kulmar M, Golding J, Hanslow D (2016) NSW East Coast Low event – 3 to 7 June 2016 weather, wave and water level matters. Manly Hydraulics Laboratory, New South Wales Government.
McAneney J, Sandercock B, Crompton R, Mortlock T, Musulin R, Pielke R, Gissing A (2019) Normalised insurance losses from Australian natural disasters: 1966–2017. Environmental Hazards 18, 414–433.
| Normalised insurance losses from Australian natural disasters: 1966–2017.Crossref | GoogleScholarGoogle Scholar |
Mills GA (2001) Mesoscale cyclogenesis in reversed shear - the 1998 Sydney to Hobart yacht race storm. Australian Meteorological Magazine 50, 29–52.
Pepler AS, Rakich CS (2010) Extreme inflow events and synoptic forcing in Sydney catchments. IOP Conference Series: Earth and Environmental Science 11, 012010
| Extreme inflow events and synoptic forcing in Sydney catchments.Crossref | GoogleScholarGoogle Scholar |
Pepler A, Coutts-Smith A, Timbal B (2013) The role of East Coast lows on rainfall patterns and inter-annual variability across the East Coast of Australia. International Journal of Climatology 34, 1011–1021.
| The role of East Coast lows on rainfall patterns and inter-annual variability across the East Coast of Australia.Crossref | GoogleScholarGoogle Scholar |
Power S, Callaghan J (2015) Variability in severe coastal flooding in south-eastern Australia since the mid-19th century, associated storms and death tolls. Journal of Applied Meteorology and Climatology 55, 1139–1149.
| Variability in severe coastal flooding in south-eastern Australia since the mid-19th century, associated storms and death tolls.Crossref | GoogleScholarGoogle Scholar |
Power S, Callaghan J (2016) The frequency of major flooding in coastal southeast Australia has significantly increased since the late 19th century. Journal of Southern Hemisphere Earth Systems Science 66, 2–11.
| The frequency of major flooding in coastal southeast Australia has significantly increased since the late 19th century.Crossref | GoogleScholarGoogle Scholar |
Quinting JF, Catto JL, Reeder MJ (2019) Synoptic climatology of hybrid cyclones in the Australian region. Quarterly Journal of the Royal Meteorological Society 145, 288–302.
| Synoptic climatology of hybrid cyclones in the Australian region.Crossref | GoogleScholarGoogle Scholar |
Roberts NM (2000) A guide to aspects of water vapor imagery interpretation: the significance of dry regions. JCMM Internal Report No. 109. Joint Centre for Mesoscale Meteorology, University of Reading, Reading, Berkshire, UK.
Rolfson DM, Smith PJ (1996) A composite diagnosis of synoptic-scale extratropical cyclone development over the United States. Monthly Weather Review 124, 1084–1099.
| A composite diagnosis of synoptic-scale extratropical cyclone development over the United States.Crossref | GoogleScholarGoogle Scholar |
Sinclair M (1993) A diagnostic study of the extratropical precipitation resulting from tropical cyclone bola. Monthly Weather Review 121, 2690–2707.
| A diagnostic study of the extratropical precipitation resulting from tropical cyclone bola.Crossref | GoogleScholarGoogle Scholar |
Sinclair MR, Revell MJ (2000) Classification and composite diagnosis of extratropical cyclogenesis events in the Southwest Pacific. Monthly Weather Review 128, 1089–1105.
| Classification and composite diagnosis of extratropical cyclogenesis events in the Southwest Pacific.Crossref | GoogleScholarGoogle Scholar |
Speer MS, Wiles P, Pepler A (2009) Low pressure systems off the New South Wales coast and associated hazardous weather: establishment of a database. Australian Meteorological and Oceanographic Journal 58, 29–39.
| Low pressure systems off the New South Wales coast and associated hazardous weather: establishment of a database.Crossref | GoogleScholarGoogle Scholar |
Strahl JLS, Smith PJ (2001) Diagnostic study of an explosively developing extratropical cyclone and an associated 500- hPa trough merger. Monthly Weather Review 129, 2310–2328.
| Diagnostic study of an explosively developing extratropical cyclone and an associated 500- hPa trough merger.Crossref | GoogleScholarGoogle Scholar |
Tory K (2014) The turning winds with height thermal advection rainfall diagnostic: why does it work in the tropics? Australian Meteorological and Oceanographic Journal 64, 231–238.
| The turning winds with height thermal advection rainfall diagnostic: why does it work in the tropics?Crossref | GoogleScholarGoogle Scholar |
Watson P, Lord D, Kulmar M, Mcluckie D, James J (2007) ‘Analysis of a storm June 2007’. (Manly Hydraulics Laboratory)
Weldon RB, Holmes SJ (1991) ‘Water vapor imagery. Interpretation and applications to weather analysis and forecasting. NOAA Technical Report NESDIS 57’. (National Oceanic and Atmospheric Administration: Washington, DC)
Wernli H, Dirren S, Liniger MA, Zillig M (2002) Dynamical aspects of the life cycle of the winter storm ‘Lothar’ (24–26 December 1999). Quarterly Journal of the Royal Meteorological Society 128, 405–429.
| Dynamical aspects of the life cycle of the winter storm ‘Lothar’ (24–26 December 1999).Crossref | GoogleScholarGoogle Scholar |
Zhang D-L, Chen H (2012) Importance of the upper-level warm core in the rapid intensification of a tropical cyclone. Geophysical Research Letters 39, L02806
| Importance of the upper-level warm core in the rapid intensification of a tropical cyclone.Crossref | GoogleScholarGoogle Scholar |
Zovko-Rajak D, Tory KJ, Fawcett RJB, Kepert JD, Rikus LJ (2018) High-resolution ensemble prediction of the Australian East Coast Low of April 2015. Journal of Southern Hemisphere Earth Systems Science 68, 165–184.
| High-resolution ensemble prediction of the Australian East Coast Low of April 2015.Crossref | GoogleScholarGoogle Scholar |
Appendix 1 Weather systems which developed under the influence of a Tropopause Undulation

|
Appendix 2 Synoptic charts of the nine worst ECL events

|

|

|

|

|

|

|

|

|
Appendix 3 Development of the 1998 Sydney to Hobart Yacht Race storm
This system was not actually an ECL due to its rapid movement. It was notable for its extremely rapid intensification and the record wave heights it generated, leading to six sailors losing their lives in that disastrous race. In a peer-reviewed paper, Joubert (2005) describes a world record wave height (42.7 m) that occurred during this race. These were the highest waves of the event, and photographs were presented in Joubert’s paper where waves appear to be as high as 80 feet (24.4 m).
The world record wave was measured by radio altimeter from a rescuing helicopter above Joubert’s boat, the ‘Kingurra’. The position of the ‘Kingurra’ can be seen in the lower right frame of Fig. A10. In a sworn statement to the Coronial Enquiry the obviously extremely competent pilot of the helicopter, Senior Constable Jones, stated that he was hovering 100 feet (30.48 m) above the Kingurra in a rescuing mission when a wall of water headed towards him. He rose 50 feet (15.24 m) and from his radio altimeter cleared the wave by 10 feet (3.05 m). Thus, the height of this wave was 140 feet or 42.7 m and is the highest wave ever recorded globally.

|
Initially the low developed downstream of a TU. At 2200UTC 25 December 1998, there was strong 200 hPa WAA over Tasmania circulating around a warm −43°C 200 hPa warm anomaly located well west of Tasmania. The result of this was the development of a 990 hPa low over northeast Tasmania by 1000UTC 26 December 1998. Following this, the low reorganised into an intense system near Wilsons Promontory around 1900UTC 26 December 1998. The low continued to intensify and moved 237 km or 128 nm over the next 8 h towards a bearing of 80°. This is a forward speed of 16 knots and, at this speed of movement, resonance can be effective for winds up to four times this speed, i.e. greater than 60 knots (Dysthe and Harbitz 1987). Additional factors which help resonance are for large waves to be present before the event. This was satisfied with significant wave heights at ESSO Kingfish B Platform Bass Strait of 3.3 m at 1400UTC 26 December 1998 (Bureau of Meteorology 1999). Another factor is for an elongated straight-line wind field in the wave generation zone, and this condition was also met (see Fig. A10). Therefore, in addition to the generally large waves present in Bass Strait that day, a localised zone of extreme waves was generated in the area immediately north of the low and moved with the low and continued to grow in this zone.
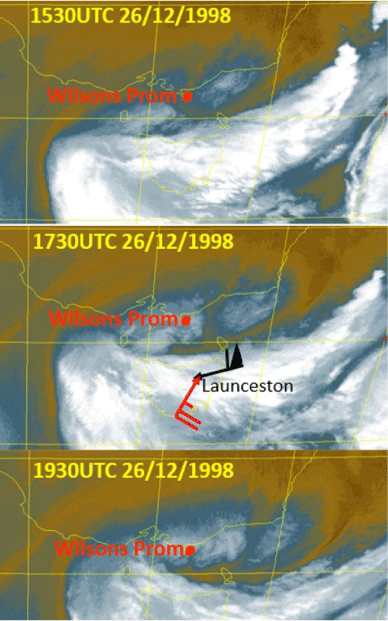
Fig. A10 (top frames) shows that the TU had moved from north of Wilsons Promontory to the southeast tip of the Australian continent in the 6 h to 1800UTC 26 December 1998. The centre frames show that the corresponding 700 hPa cold pool moved from near King Island to be over Wilsons Promontory over the same period, keeping much the same distance from the undulation and warming from around −9°C in the centre to −4°C as convection moved into it. The WAA moved up onto the Victorian coast between Melbourne and Wilsons Promontory. Over this period the low was explosively deepening.
Using high-resolution computer model forecasting data, Mills (2001) found that this rapid intensification of the low was associated with strong descending CPV advection through Bass Strait at the 400 hPa level. This feature can be seen in actual observational data in Fig. A11. This shows water vapour (WV) satellite imagery indicating a dry intrusion extending through Bass Strait towards Wilsons Promontory. At Wilsons Promontory, the pressure fell 8.1 hPa to 983.0 hPa in the 3 h to 1900UTC 26 January and over the same period the sustained 10-min average wind increased from 41 to 71 knots (76–132 km/h). Three hours later the sustained wind was 79 knots (146 km/h) measured on an anemometer at 88.7 m elevation. The WV channel senses radiation in a band that is strongly absorbed and re-radiated by WV. Thus, if the upper troposphere is dry, the WV channel will measure a warmer brightness temperature (dark areas on the satellite imagery). These same areas are also regions of high cyclonic isentropic potential vorticity (Weldon and Holmes 1991; Roberts 2000). The dry subsiding intrusion was also evident from the nearby 400 hPa winds and shears at Launceston in Fig. A11, which was characterised by strong CAA and descent. Below this level at Launceston there was WAA and heavy rain, with Launceston reporting 23.0 mm in the 6 h to 1600UTC 26 December which explains the cloud over there with the CAA restricted to levels above 500 hPa. From Hoskins et al. (1985) temperature is not advected as it is PV that is advected and the temperature results from vertical motion and adjustment processes. Therefore, the 700 hPa cold pool results from CPV advection and the region where the low was rapidly intensifying was a rich source of CPV from the movement of the 700 hPa cold air with associated deep convection over the area and the PV advection into the area at the 400 hPa level from the general area of the TU. Further along the Gippsland coast, severe gusts were also experienced at East Sale (152 km/h) and Bairnsdale (107 km/h).
|
From reanalysis, the structure of the cyclone near peak intensity (0600UTC 27 December 1998) was within a cold cyclone from low levels to the 400 hPa level then under a strong −44°C 200 hPa centre (TU) which is a perfect vertical CPV structure.