Diverse impact of 2023 El Niño on weather patterns over the Indonesian Maritime Continent
Sanaullah Zehri A , Erma Yulihastin
  B * , Fiolenta Marpaung
  B , Agung Adiputra A ,
  A , Narizka Nanda Purwadani
  B C and
 A
B
C
Abstract
The El Niño–Southern Oscillation (ENSO) significantly affects climate extremes, particularly causing the driest conditions across the Indonesian Maritime Continent (IMC). However, the specific impacts of the 2023 ENSO on weather pattern anomalies in the IMC have not been thoroughly explored. This study examines the 2023 El Niño, one of the strongest El Niño conditions during the warmest climate decade, and its effects on weather anomalies (i.e. hot and humid) to fill gaps in our understanding of the diverse impacts of ENSO in the IMC. Composite analysis (1991–2023) from the European Centre for Medium-Range Weather Forecasts Reanalysis v5 (ERA5) and National Oceanic and Atmospheric Administration datasets demonstrated that the 2023 El Niño strengthened westerly winds across the Pacific Ocean and influenced intraseasonal rainfall patterns over the IMC. Distinct contrasts were observed between northern (DOM1) and southern (DOM2) IMC. During the onset and mature periods of El Niño (April–September 2023), DOM2 experienced reduced rainfall and significant drought, especially during the dry season (June–September 2023), affecting vital agricultural regions in Java and southern Sumatra. The positive Indian Ocean Dipole and vigorous Australian monsoon likely intensified this drought. Conversely, DOM1 experienced increased rainfall, triggering severe flood events in several regions in Sumatra and Kalimantan (i.e. northern Sumatra and western, northern and central Kalimantan). Our findings highlighted that the enhanced rainfall, driven by middle and high cloud activities, is linked to ENSO and South China Sea warming. This study deepens our understanding of the varied impacts of El Niño on intraseasonal weather patterns in Indonesia, ultimately aiding in improving sub-seasonal-to-seasonal climate predictions over the IMC.
Keywords: cloud distribution, El Niño, Indian Ocean Dipole, Indonesian Maritime Continent, intraseasonal variability, rainfall, water vapour, weather pattern, westerly winds.
1.Introduction
The climate of the Indonesian Maritime Continent (IMC) is primarily characterised by one of the most active convection regions in the world, influenced by the Hadley, Walker and Asian–Australian monsoon circulations (Love et al. 2011; Yamanaka 2016). As a result, rainfall variability occurs over the IMC across various timescales, ranging from diurnal to interannual oscillations. This variability is also driven by local factors such as land–sea distribution, diverse topography and local sea surface temperatures (SSTs) (Keenan et al. 1989; Hendon 2003; Chang et al. 2005a, 2005b; Juneng and Tangang 2005; Qian et al. 2010; Satyawardhana and Yulihastin 2016; Yulihastin et al. 2021).
On an interannual timescale, the El Niño–Southern Oscillation (ENSO) serves as the primary driver of climate variability due to the dynamic and thermodynamic interactions within the tropical ocean and atmosphere (Neelin et al. 1998; Wallace et al. 1998; McPhaden and Zhang 2009; Ray et al. 2020; Wu et al. 2021). The ENSO, which alternates between warm (El Niño) and cold (La Niña) phases, affects global weather patterns through atmospheric teleconnections (Alexander et al. 2002). In the IMC, El Niño significantly reduces seasonal rainfall across much of the region, leading to seasonal weather conditions that are mainly indicated by hotter and drier environments (Moron et al. 2015, 2019).
However, the behaviour of El Niño has changed under global warming, leading to irregular patterns and shifts in the coupled processes between the atmosphere and ocean, as well as alterations in the location of the Indo-Pacific warm pool (Philip and Van Oldenborgh 2006; Boucharel et al. 2011; Cai et al. 2014, 2015; Yeo and Kim 2014; Wang et al. 2017; Carreric 2019; An et al. 2020; Leung et al. 2022; Chen et al. 2023). This irregular El Niño has increased diversity in the spatial variability of rainfall over the IMC. As a result, the effects of El Niño in this region indicate notable spatial inhomogeneity.
The rapid global warming observed in 2023 was hypothesised to be significantly influenced by external forcings beyond natural variability. This hypothesis was rigorously tested by analysing the compelling case of the 2023 El Niño, which stands as a powerful event during the peak of global warming. The notable temperature rise in 2023 is placed within a broader context, highlighting internal variability as a key role in the annual mean temperature spike through its feedback mechanism (Raghuraman et al. 2024). Remarkably, the 2023 El Niño was a rare double-peak event, showcasing two distinct spatial peaks in the eastern and central equatorial Pacific (Geng et al. 2024). This unique phenomenon substantially strengthens the atmosphere–ocean coupling processes, influencing coastal warming in both Peru and Ecuador (Peng et al. 2024). In the Central Pacific, a single reaction of El Niño Modoki II (denoted as CP-II) has a substantial impact on enhancing moisture convergence over the western Pacific (WP; 10–30°N, 120–160°E) (Chen et al. 2019). In addition, analysis based on the Pacific–Indian Dipole (PID) index (Watterson 2020) revealed that during the positive phase of the PID, increased rainfall is strongly modulated by local factors, resulting in higher precipitation anomalies over the WP and some part of north-western Sumatra, particularly evident during the 2018–2019 period. This finding serves as a clear indication that variability in Indonesia is quite dynamic. Therefore, the distinct characteristics of the 2023 El Niño render it an exceptional case for investigation. This study decisively focuses on uncovering the role of El Niño in shaping wetter episodes across various regions of the IMC, which have led to significant flood events in several parts of Sumatra and Kalimantan during the dry season (i.e. 1 April 2023, 8 and 14 July and 20 September 2023; Admin BPBD 2023; Badan Penanggulangan Bencana Daerah Kab Kapuas Hulu 2023; Ramadhan 2023; Triwibowo 2023) – an aspect that has been largely overlooked in previous research.
This study generally pursues two primary objectives: (i) to analyse 2023 El Niño and its association with intraseasonal variability, with a focus on specific periods: April–June (AMJ) and May–July (MJJ) as transitions from wet to dry seasons; June–August (JJA) and July–September (JAS) as the dry season; and August–October (ASO) and September–November (SON) as transitions from dry to wet seasons, along with examining large-scale changes in the IMC. Previous research identified hot and dry weather patterns as common during El Niño years in the IMC (Moron et al. 2015) but has not documented contrasting wet and humid weather anomalies during El Niño events. Therefore, (ii) this research aims to address this gap by identifying various weather patterns in the IMC during these specific seasons, as influenced by the 2023 El Niño. This understanding could enhance our insight into the heterogeneity impact of the 2023 El Niño on weather anomalies in the IMC, ultimately contributing to more accurate seasonal rainfall predictions for the region.
2.Materials and methods
This study seeks to investigate the role of the ENSO in influencing weather patterns in the IMC. To do so, we utilise a reanalysis dataset from the European Centre for Medium-Range Weather Forecasts v5 (ERA5), which provides a spatial resolution of 0.25° (~25 km) and has been thoroughly evaluated by Hersbach et al. 2020. We analyse seasonal variations in atmospheric conditions over the IMC by compiling monthly data on precipitation, temperature, water vapour, wind at the 850-hPa level, outgoing longwave radiation, SST, total cloud and cloud fraction across three levels of the troposphere (low, middle and high). All data revealed from ERA5 cover the period of 1991–2020 and the year of 2023, with the 30-year span of 1991–2020 serving as the climatological baseline. Data for 2021–2022 are excluded due to the occurrence of La Niña events during those years. Subsequently, we conduct spatiotemporal analyses and create Hovmöller diagrams to identify the prevailing weather patterns over the IMC during the 2023 El Niño.
To understand the spatial characteristics of the 2023 El Niño event, our study focuses on the Indo-Pacific region (30°N–30°S, 90°E–280°W), with special emphasis on the IMC area, located within 15°N–15°S and 90–160°E. For detailed analysis, the IMC is divided into two zones, the northern part (hereafter DOM1) and the southern part (hereafter DOM2), separated by the equator. This division highlights the contrasting pattern in monthly mean rainfall across the region (Fig. 1).
(a) Map showing monthly mean anomalies of 2023 rainfall (shaded; overlaid with the wind at 850 hPa, streamline) based on climatology data periods of 1991–2020 over IMC (15°N–15°S, 90–160°E) as a reference in selecting research of interest domain. The dashed red and blue boxes represent IMC’s northern (DOM1) and southern (DOM2) regions. (b) A time series of daily rainfall observed from four automatic weather stations of Padang (West Sumatra), Sibolga (North Sumatra), Pontianak (West Kalimantan) and Tarakan (North Kalimantan) during the dry season of the El Niño period (1 March–30 September 2023).
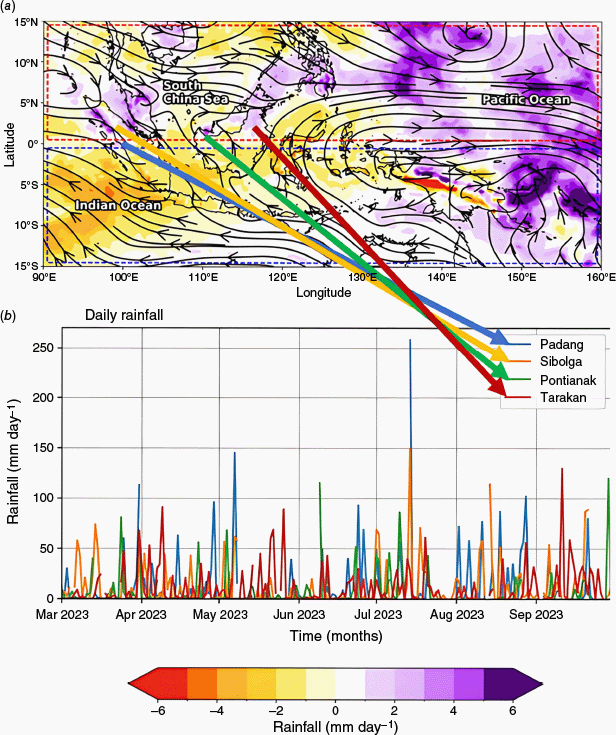
In numerous earlier studies, the DOM1 and DOM2 areas depicted in Fig. 1a also represented equatorial (monsoonal) types of annual rainfall patterns (Aldrian and Susanto 2003; Robertson et al. 2011; As-syakur et al. 2016). In the case of 2023 El Niño, several regions in DOM1 (i.e. Padang, West Sumatra; Kapuas Hulu, West Kalimantan; Kapuas, Central Kalimantan; and Nunukan, North Kalimantan) experienced severe floods triggered by extreme precipitation exceeding 115–258 mm day−1 (Fig. 1b). The observed daily rainfall was derived from four weather stations’ airport-based data of OGIMET (see https://www.ogimet.com/cgi-bin/gsynres?lang=en&ord=REV&ind=96163, 96073, 96509, 96581).
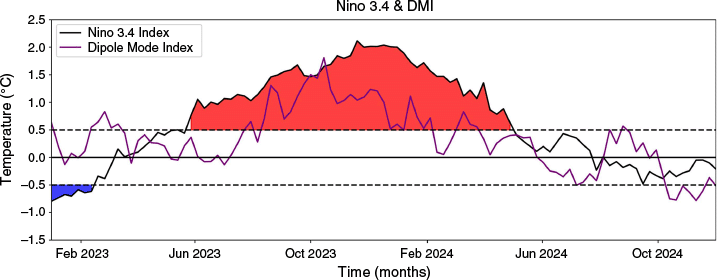
To analyse the characteristics of the double-peak 2023 El Niño (Geng et al. 2024), we examined SST anomaly data averaged over the ENSO 3.4 region (5°N–5°S, 120–170°W) for the period 2022–2024, obtained from the National Oceanic and Atmospheric Administration Physical Sciences Laboratory (NOAA, see https://stateoftheocean.osmc.noaa.gov/sur/pac/Niño34.php). Following NOAA’s method, the anomaly is based on the 1991–2020 climatological period, with monthly climatology linearly interpolated to determine weekly anomalies. El Niño events are identified when SST anomalies in the ENSO 3.4 region exceed +0.5°C for at least three consecutive running 3-month periods. Likewise, the positive (negative) Dipole Mode Index (DMI, see http://www.bom.gov.au/climate/enso/indices.shtml) is defined using the same threshold, exceeding +0.5°C (lower −0.5°C), based on the SST anomaly difference between the western and eastern Indian Ocean.
3.Results
3.1. Evolution of double peaks El Niño 2023
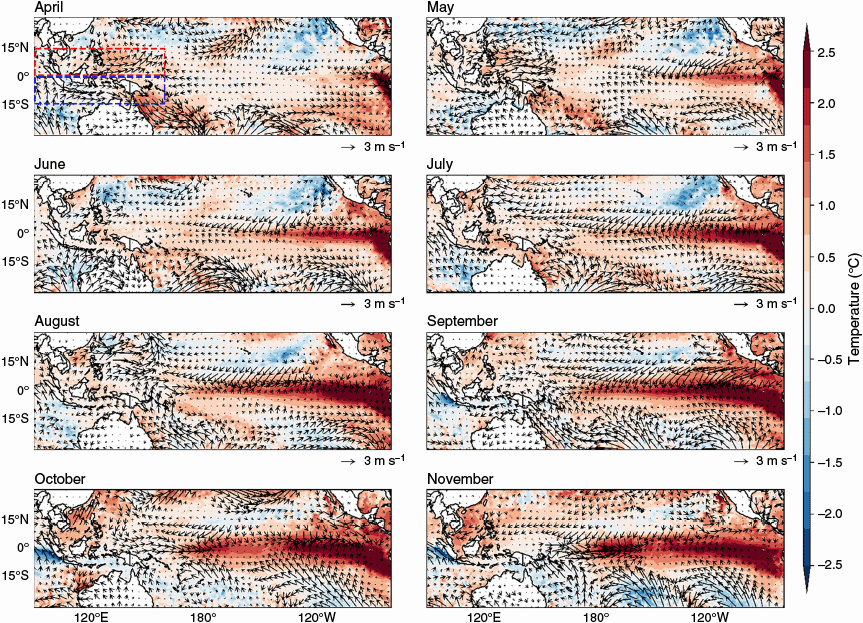
Fig. 2 illustrates the average SST anomalies in the Niño 3.4 region and the DMI. Positive SST anomalies above 0.5°C first appeared in May 2023 and continued to increase throughout the remainder of the year before gradually declining through May 2024. The onset of the 2023 El Niño onset was marked during the AMJ period. Monthly SST over the IMC serves as an indicator of atmospheric water vapour, which contributes to cloud formation. During 2023 El Niño, low-level easterly winds contributed to cooler SSTs in the WP, reducing convective cloud formation over Indonesia. Fig. 3 shows noticeable changes in SST in eastern Indonesia during September–November 2023. In the DOM1 region, SST remained relatively warm due to warming from the South China Sea, while cooling in southern Java and western Sumatra was influenced by the positive Indian Ocean Dipole (IOD+, Fig. 2). Additionally, observations during October–November 2023 reveal that westerly winds strengthened, as indicated by the vector movements, despite the previously strong easterly winds. This intensification of westerly winds led to a shift in convective clouds, which were expected to move toward western Indonesia but instead shifted toward the central Pacific (CP).
Time evolution of Niño 3.4 (solid black line) and Dipole Mode Index (solid purple line) from January 2022 to December 2024. The red-shaded area indicates the 2023 El Niño period with the ENSO index exceeding +0.5°C.
Contour of monthly sea surface temperature anomalies (shaded) overlaid with surface-level wind anomalies (vector), for April–November 2023 across the Indo-Pacific Region and reference red (blue) boxes in the first panel (April) representing DOM1 (DOM2) respectively.
The weakening of the Walker circulation is a key indicator of El Niño events. During El Niño, the low-pressure centre shifted to the eastern Pacific (EP) around Peru, disrupting wind patterns and reducing easterly winds. Fig. 4a shows a weakening of easterly winds in July over the WP, indicating a weakening of Walker circulation. During August–November, wind patterns shifted significantly from west to east, as Fig. 4c shows decreasing outgoing longwave radiation (OLR) during January–September 2023.
(a). Hovmöller diagram showing the time–longitude cross-section of zonal wind at the surface level averaged over 5°N–5°S for January–November 2023. (b) Same as panel (a), but showing outgoing longwave radiation (OLR) anomalies over the northern IMC (DOM1, 15°N–Equator) for January–November 2023. (c) Same as panel (a), but for OLR anomalies over the Pacific Ocean (160°E–80°W). (d) Same as panel (b), but for the southern domain (DOM2, Equator–15°S). Anomalies are calculated relative to the 1991–2020 climatology. In panels (a) and (c), the dashed (solid) line represents the central Pacific (eastern Pacific), and the x-axis of 160°E corresponds to the western Pacific. In panels (b) and (c), the dashed (solid) line marks the centre of Sumatra (West Kalimantan), corresponding to the DOM1 and DOM2 regions. The x-axis of 90°E corresponds to the north-western-most part of Sumatra in DOM1.
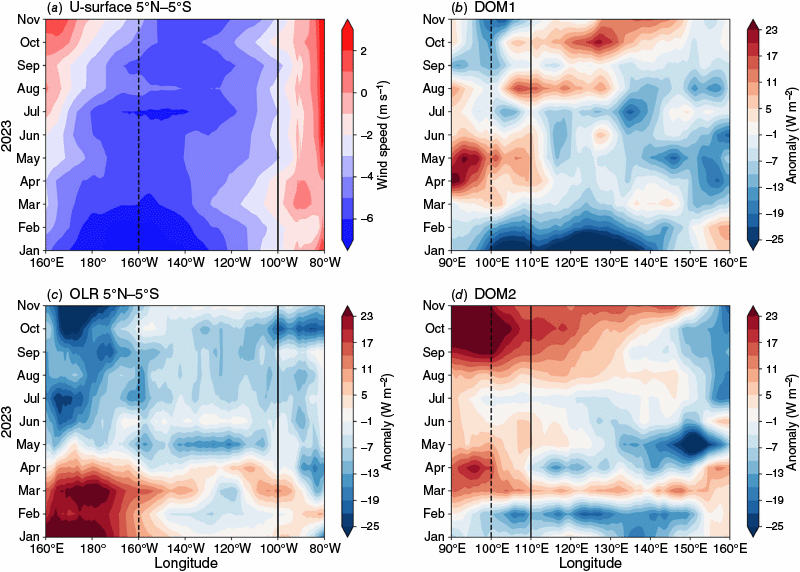
Changes in SST and cloud cover often manifest as variations in OLR. Consequently, OLR is a useful indicator for analysing tropical interannual variability (Wong et al. 2006; Loeb et al. 2012; Wang and Su 2015). During the La Niña decay phase of January–March 2023, easterly winds were prominent. The OLR values remained near zero (high) in EP (CP), suggesting that less (more) solar radiation reached the surface in the EP (CP), cooling (warming) the surface. This period was characterised by lower-average SSTs, leading to reduced water vapour over the CP. From May onward, a noticeable decrease in solar radiation was observed in the WP, with OLR values initially ranging from −7 to −15 W m−2 and falling sharply to below −25 W m−2 by November. By contrast, the EP experienced smaller negative OLR anomalies, ranging from −1 to −7 W m−2, but these values decreased significantly during September–November (−16 to −23 W m−2), with the lowest recorded at −23 W m−2 in October. This increase was linked to rising SSTs in both the EP and WP, leading to more cloud formation. In the CP, cloud formation was influenced by westerly and easterly winds and warmer SSTs, which increased water vapour and cloudiness.
To evaluate the impact of El Niño on convective activity in the IMC, we compared OLR anomalies between the northern IMC (DOM1) and southern IMC (DOM2) (Fig. 4b, d). The comparison indicates that during January–March 2023, OLR anomalies dropped to their lowest of −25 W m−2 in January over north-eastern Sumatra and northern Sulawesi, reflecting increased convective activity associated with La Niña. A significant increase occurred during April–May, with its highest anomaly reaching 23 W m−2, suppressing convection over north-western Sumatra (DOM1). In DOM2, suppressed convection occurred more often in September–November, particularly over southern Sumatra and southern Kalimantan, leading to higher positive OLR anomalies. Overall, DOM1 exhibited more significant variability in convective activity compared to DOM2.
3.2. Seasonal rainfall distribution linked to El Niño 2023
As previously discussed, the IMC experiences various types of rainfall activity, including monsoonal, regional and local patterns. Wind patterns primarily drive monsoonal activity: during the dry season, the prevailing zonal wind blows from the east, whereas during the wet season, it blows from the west. Similarly, the prevailing meridional wind blows from the south during the dry season and the north during the wet season (Aldrian and Susanto 2003). During the Australian monsoon phase, easterly winds dominate, reducing accumulated rainfall over Indonesia. During an El Niño event, easterly winds strengthen during MAM and SON, with no significant changes observed during JJA. During DJF, westerly wind speeds decrease (Mulyana 2002). However, Fig. 5 demonstrates that during the transition from the wet to dry season (AMJ), there are negative rainfall anomalies over western Java, western Kalimantan and south-eastern Sumatra, indicating reduced rainfall accumulation. In the dry season (JJA), the easterly winds moving from Australia to Asia further decrease rainfall, particularly affecting Java and the Nusa Tenggara regions. From ASO to SON, the negative anomaly in rainfall distribution over western Indonesia was not solely attributed to El Niño 2023. The IOD+ phenomenon also contributed to the reduced rainfall in this region, affecting areas such as southern Sumatra and Java.
Mean seasonal anomalies of rainfall distribution (shaded) over the Indonesian Maritime Continent, overlaid with 850-hPa wind (vectors). Panels (a–f) show averaged anomalies for (a) April–June (AMJ), (b) May–July (MJJ), (c) June–August (JJA), (d) July–September (JAS), (e) September–October (ASO) and (f) September–November (SON) in 2023, based on the 1991–2020 climatology. In panel (a), the red (blue) box indicates DOM1 (DOM2). The blue boxes in (e, f) are denoted by the western IMC, which experiences a large reduction in rainfall.
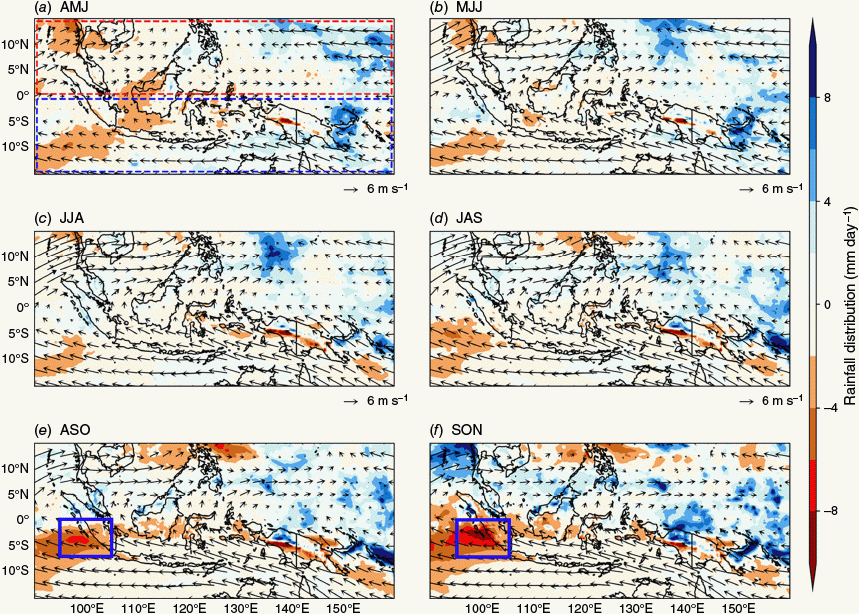
Previous studies stated that during the El Niño and IOD+ events of 1997–98 and 2006–07, eastern Indonesia experienced notably drier conditions across the entire region. Similarly, a previous study found that in SON, the overlap of El Niño and IOD+ led to even more significant reductions in rainfall across Indonesia (Avia and Sofiati 2018). The 2023 El Niño event exacerbated these dry conditions throughout the dry and wet seasons. For example, Fig. 5 demonstrates a significant reduction in rainfall over western Indonesia (see blue boxes in Fig. 5e–f) from ASO to SON, with anomalies exceeding −5 mm day−1 compared to the climatology. As ASO and SON share September and October, the change mainly reflects conditions during August–November. Anomalies intensify through this period, reaching −5.3 mm day−1 in September, −7.1 mm day−1 in October and −8.0 mm day−1 in November. Mean daily anomalies are ~−5 mm day−1 in ASO and ~−7 mm day−1 in SON. Prior studies found that higher SST increases atmospheric water vapour, which affects regional wet and dry conditions and plays a key role in cloud formation (Loyola et al. 2006).
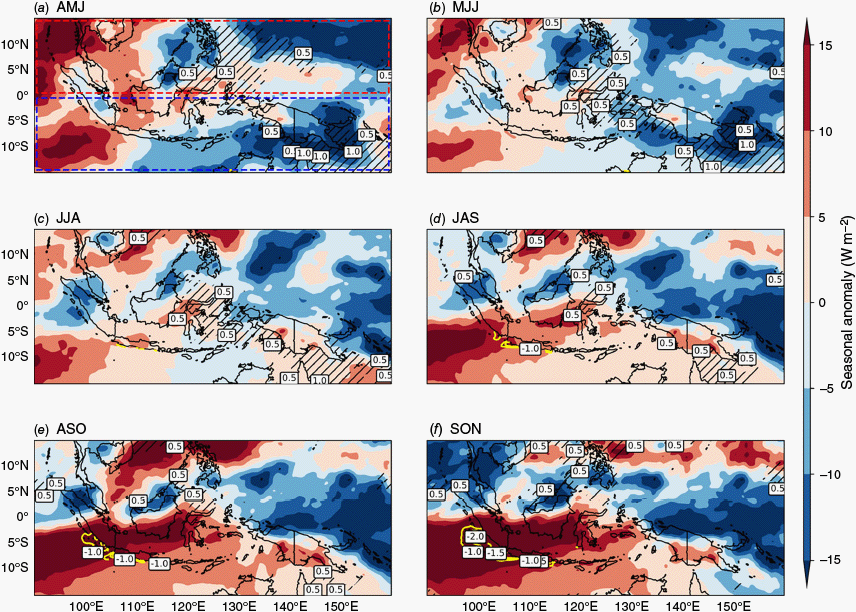
It should be noted that during the transition from wet to dry periods (AMJ and MJJ), the lowest OLR anomalies are in the north-eastern (south-eastern) part of DOM1 (DOM2) within the eastern IMC region (130–150°E, indicated in blue), corresponding with SST anomalies exceeding 0.5°C (Fig. 6). This warming leads to more water vapour and increased convective activity. Conversely, during the dry season (JJA–JAS), warmer SSTs are associated with drier conditions in southern IMC, as cooler SSTs inhibit convective activity. The following section will examine the distribution of cloud fraction and its influence on the 2023 warm episode, which relates to these patterns of convective activity.
Mean seasonal anomalies of outgoing longwave radiation (OLR) (shaded) overlaid with sea surface temperature (SST) anomalies across the Indonesian Maritime Continent. Black (yellow) lines indicate regions with SST anomalies exceeding +0.5°C (falling below −0.5°C). The boxes show the corresponding SST anomaly values. Panels (a–f) show averaged anomalies for (a) April–June (AMJ), (b) May–July (MJJ), (c) June–August (JJA), (d) July–September (JAS), (e) August–October (ASO) and (f) September–November (SON) in 2023, based on the 1991–2020 climatology baseline. Panel (a) exhibits a reference red (blue) box representing DOM1 (DOM2). The black hatched area indicates the region with the warmest SST (>+0.5°C).
3.3. Middle and high cloud activities associated with increased rainfall
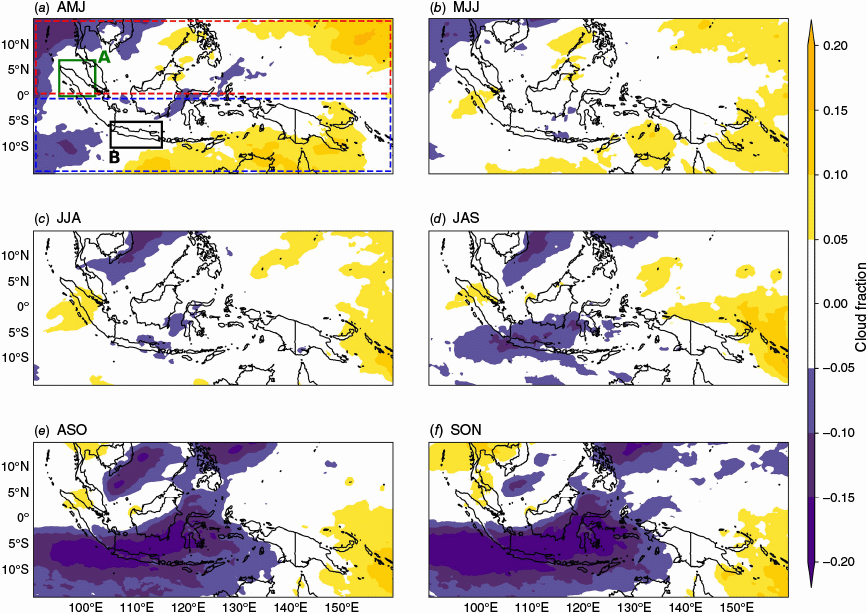
The cloud distribution depicted positive anomalies in total cloud fraction are more common in the eastern IMC region, which is prominently visible in the WP area (Fig. 7). During the ASO–SON period, negative anomalies in cloud cover become more frequent in the southern IMC. Boxes A and B (Fig. 7) exhibit northern Sumatra and Java cloud anomalies. Northern Sumatra exhibited mostly positive total cloud cover during MJJ–SON, whereas Java showed negative anomalies, pronounced during the dry-to-wet transition (ASO–SON). In further analysis, it should be noted that areas with higher cloud fractions are closely associated with increased convective activity (Fig. 8).
Mean seasonal anomalies total cloud distribution (shaded; dimensionless) over the Indonesian Maritime Continent are shown with a shaded threshold of ±0.05. The green box (A) and black box (B) are used for comparison in Fig. 10, with A representing northern Sumatra (DOM1) and B representing Java Island (DOM2). Panels (a–f) depicted averaged anomalies for the following periods: (a) April–June (AMJ), (b) May–July (MJJ), (c) June–August (JJA), (d) July–September (JAS), (e) August–October (ASO) and (f) September–November (SON) in 2023, based on the 1991–2020 climatology baseline.
Mean seasonal cloud fraction for (a–f) high, (g–l) middle and (m–r) low cloud (shaded; dimensionless) over the Indonesian Maritime Continent. Panels (a–r) display averages for the following periods: (a, g, m) April–June (AMJ), (b, h, n) May–July (MJJ), (c, i, o) June–August (JJA), (d, j, p) July–September (JAS), (e, k, q) August–October (ASO) and (f, l, r) September–November (SON) in 2023.
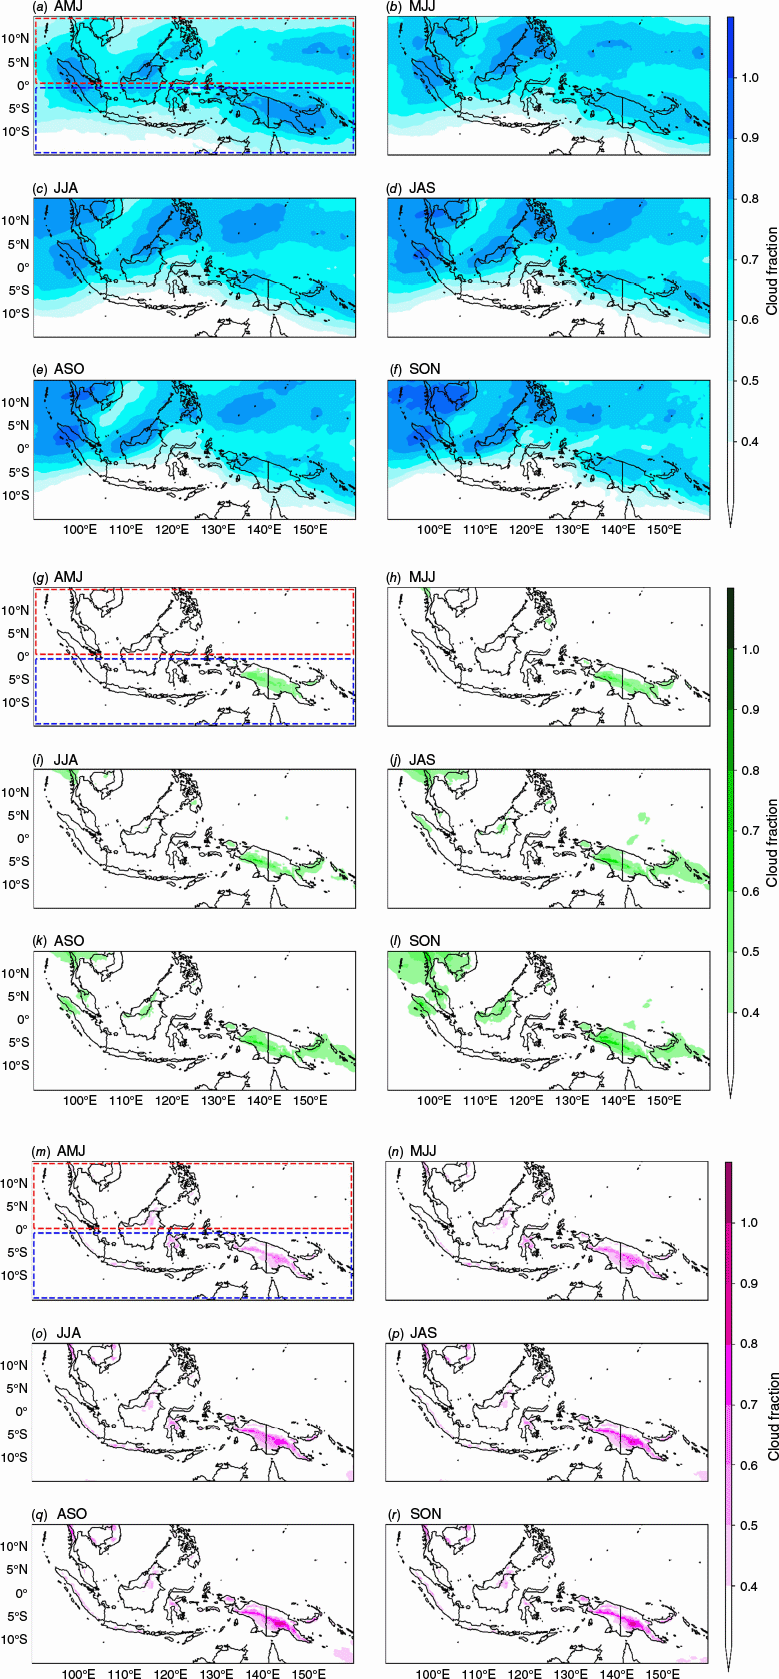
In Fig. 8a–f, the types of high cloud cover include cirrus, cirrostratus and deep convective clouds. These high cloud types are linked to rising SST in the South China Sea. The SSTs in this region are affected by warm episodes and strong surface winds, which can cause either cooling or warming effects. During boreal winter, reduced surface winds over the South China Sea allow for increased latent heat loss, which raises SST (Tan et al. 2016). The warmer SST in the South China Sea and increased high cloud cover in northern Sumatra and Borneo (Kalimantan) can lead to sporadic extreme weather events in western Indonesia. This phenomenon explains the positive rainfall distribution over western Indonesia during April–August 2023.
Additionally, the strengthening of easterly winds associated with El Niño 2023 during July–November 2023 resulted in decreased high cloud cover across much of Indonesia. However, conditions in DOM1 indicate an upward trend in high cloud fraction anomalies, suggesting that high cloud fractions remained prevalent in this region. Localised rain events or phenomena causing excessive rainfall in specific areas on a smaller scale may be driven by local sources. Low cloud fractions include cumulus, stratocumulus and nimbostratus, whereas intermediate cloud fractions comprise altocumulus and altostratus. These types of clouds also contribute to localised rainfall.
According to the previous study, low cloud percentages are linked to rain events of varying intensities, with stratus and stratocumulus often associated with light rain and drizzle (Didier 2015). Fig. 8g–l, m–r display the middle and low cloud fractions. Notable differences are observed between DOM1 and DOM2, with DOM2 showing a higher low cloud fraction than DOM1. The DOM2, which includes Java Island, part of western Sumatra and New Guinea, features mountainous terrain that generates mountain breezes, leading to localised cloud formation and rain.
4.Discussion
Prior studies indicated that ENSO has a strong influence on the persistence of weather types over the IMC, with notable impacts during different ENSO phases (Moron et al. 2015). Specifically, ENSO tends to reduce (increase) convective activity during warm (cold) episodes in the region. However, significant weather-related anomalies are not typically observed under neutral ENSO conditions. In this study, our analysis reveals a limitation: the OLR values, which reflect seasonal weather patterns influenced by the 2023 warm ENSO episode, do not fully capture the extent of dry conditions over the IMC (Fig. 6). The combination of mountain breezes, the diurnal cycle, diverse topography and warm SST (above 28°C) supports deep convection on small to regional scales (Qian et al. 2010). In earlier sections, we discussed water vapour and precipitation, concluding that some areas in DOM1 still exhibit high positive anomaly values. Detailed interaction between rainfall anomalies with the seasonal monsoon flow and local topography in north-eastern Sumatra (DOM1) was evident during the dry season (JJA) and late dry-to-wet transition (SON) in the weak El Niño years 2019 (Watterson 2020, in fig. S6). These effects became pronounced, with the highest positive anomaly observed during the strong 2023 El Niño (Fig. 5). The small difference between middle and high cloud fractions corresponds to similar total rainfall values (Fig. 9).
Comparison of monthly averaged cloud fractions (LC, low cloud; MC, middle cloud; HC, high cloud; dimensionless), average water vapour (WV) and precipitation (TP) between the adjacent northern (DOM1) and southern (DOM2) land regions of the Indonesian Maritime Continent for 2023.
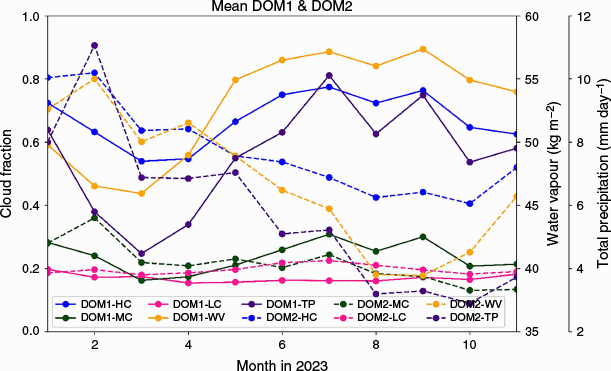
To validate these observations, we compared the average values of cloud fractions, water vapour and precipitation between DOM1 and DOM2. This comparison suggests how seasonal weather patterns, influenced by the 2023 El Niño event, vary between DOM1 and DOM2. Specifically, the warming of the South China Sea, which has been linked to record-high surface air temperatures (Jiang et al. 2024), contributes to higher cloud fractions and increased rainfall in DOM1. By contrast, easterly winds from Australia to Asia lead to drier conditions in DOM2, leading to a more pronounced decrease in precipitation toward the end of 2023 (Fig. 9), particularly in southern Sumatra and western Java, as also reflected in the spatiotemporal intraseasonal pattern (Fig. 5). Furthermore, the cooling effects and altered SST associated with IOD+ and 2023 El Niño resulted in drier weather in DOM2 compared to DOM1.
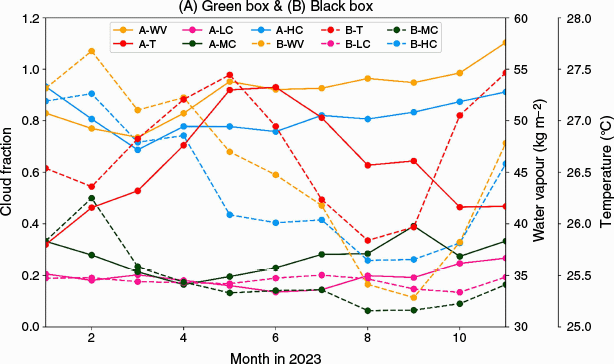
We compared northern Sumatra and Java Island to analyse thermal conditions, representing DOM1 and DOM2, respectively. The results in Fig. 10 focus on surface temperature data, with the precipitation matrix excluded from this comparison. The data reveal that temperatures in Region A (Box A in Fig. 7, northern Sumatra) are higher than in Region B (Box B in Fig. 7, Java Island) during JJA, with range 26.5–27.5°C. However, during September–November, temperatures in Region A decline, while Region B experiences relatively warmer conditions. The cooler temperatures in Region A can be attributed to its mountainous terrain, which generally results in lower temperatures. By contrast, the higher temperatures in Region B are influenced by its landscape, which lacks significant mountain effects. Water vapour content between the two regions follows a linear trend: lower water vapour is associated with higher temperatures. During the transition to boreal winter, Region A, with its higher coverage of high and middle clouds, exhibits cooler temperatures. By contrast, Region B, with less cloud cover, experiences warmer temperatures.
Similar to Fig. 9, a comparison of monthly averaged cloud fractions (LC, low cloud; MC, middle cloud; HC, high cloud; dimensionless), average water vapour and surface temperature (at 2 m) for regions A (northern Sumatra) and B (Java Island) in 2023.
This study highlights the significant role of ENSO events, particularly the strong 2023 El Niño, in modulating rainfall distribution, convective activity and atmospheric circulation over the IMC. The strengthened westerly winds suppressed convection, and decreased cloud cover in specific regions suggests a strong link between large-scale ocean–atmosphere coupling and local climate anomalies. These insights are crucial for improving seasonal prediction models since we highlight the spatial heterogeneity of ENSO over northern and southern IMC. By incorporating high-resolution reanalysis datasets and regional proxies such as DOM1 and DOM2, forecasters and policymakers can better anticipate hydroclimatic extremes, e.g. droughts or delayed wet seasons, and enhance preparedness for climate-related risks.
5.Summary
This study investigates the effects of the 2023 El Niño on weather patterns over the IMC across six seasonal time frames: AMJ, MJJ, JJA, JAS, ASO and SON. The results suggest that during the onset of El Niño in AMJ, there was no significant change in rainfall, with precipitation remaining evenly distributed across DOM1 and DOM2. In the dry season (June–September), dry conditions became prominent in DOM2, leading to drought in several areas, including Java, southern Sumatra, East Nusa Tenggara, West Nusa Tenggara and southern Papua. This drought was exacerbated by the IOD+ phenomenon in western Indonesia and weakened easterly winds in eastern Indonesia. As the transition to the wet season occurred during April–November, the drought conditions worsened due to the strengthening of the Australian monsoon winds, influenced by El Niño. Despite this, convective activity in DOM1 persisted due to the warming of the South China Sea, which increased water vapour and led to higher cloud fractions, resulting in sporadic rainfall in northern Sumatra, north-west Kalimantan and other parts of DOM1. Overall, the analysis of water vapour, total precipitation and high cloud fractions from DOM1 and DOM2 indicates that DOM1 exposure significantly increased in all three variables, whereas DOM2 showed a decrease. The increase in these variables is closely linked to the warming of the South China Sea, contributing to variability in convective activity in DOM1. By contrast, DOM2 experienced persistently dry conditions. Ultimately, our findings play a crucial role in enhancing the accuracy of sub-seasonal to seasonal climate predictions in the IMC, which are essential for agricultural planning, disaster preparedness and water resource management in this vital region.
Data availability
The ECMWF dataset is publicly available in the permanent archives (Hersbach et al. 2023).
Declaration of funding
This work was supported by Badan Riset dan Inovasi Nasional (BRIN, the National Research and Innovation Agency) under the Research and Innovation for Indonesia Progression 2023–2025 with grant number 140/III.4.3/HK/2023. The corresponding author as a Principal Investigator received funding for research into the development of the decision-support system for salt production prediction in Indonesia, entitled ‘Almanak Sentra Garam Nasional’ (ANTASENA). The first author in this study is a Badan Riset dan Inovasi Nasional (BRIN) student at Merdeka Belajar Kampus Merdeka (MBKM, the so-called Freedom Learning in Freedom Campus), supported by the Ministry of Education, Culture, Research and Technology of the Republic of Indonesia, which offers students the opportunity to enhance their skills based on their talents in research and development for future careers preparation.
Acknowledgements
The results of this work support the development of a decision-support system for salt production prediction in Indonesia, the ‘Almanak Sentra Garam Nasional’ (ANTASENA).
Author contributions
S. Zehri, E. Yulihastin and F. Marpaung are the main contributors. S. Zehri drafted the initial manuscript and created the main figures. E. Yulihastin and F. Marpaung supervised the first author, designed the research concept, and revised the original manuscript, improved the analysis and discussed the overall content. In addition, A. Adiputra, N. N. Purwadani, Gammamerdianti and Mushoddik are supporting authors who contributed to data curation and produced related additional figures. Finally, all the authors were involved in discussions and read and approved the final manuscript during the review process.
References
Admin BPBD (2023) Diguyur Hujan, 7 Daerah Sumbar Dilanda Banjir [Rain showered, 7 areas of West Sumatra hit by floods]. In BPBD Provinsi Sumatera Barat, 29 July 2023. Available at https://bpbd.sumbarprov.go.id/home/news/346-diguyur-hujan-7-daerah-sumbar-dilanda-banjir [In Bahasa Indonesia, verified 24 January 2025]
Aldrian E, Susanto RD (2003) Identification of three dominant rainfall regions within Indonesia and their relationship to sea surface temperature. International Journal of Climatology 23, 1435-1452.
| Crossref | Google Scholar |
Alexander MA, Bladé I, Newman M, Lanzante JR, Lau N-C, Scott JD (2002) The atmospheric bridge: the influence of ENSO teleconnections on air–sea interaction over the global oceans. Journal of Climate 15, 2205-2231.
| Crossref | Google Scholar |
An S-I, Tziperman E, Okumura YM, Li T (2020) ENSO irregularity and asymmetry. In ‘El Niño–Southern Oscillation in a Changing Climate’. (Eds MJ McPhaden, A Santoso, W Cai) pp. 153–172. (American Geophysical Union, AGU) 10.1002/9781119548164.ch7
As-syakur AR, Osawa T, Miura F, Nuarsa IW, Ekayanti NW, Dharma IGBS, Adnyana IWS, Arthana IW, Tanaka T (2016) Maritime Continent rainfall variability during the TRMM era: the role of monsoon, topography and El Niño Modoki. Dynamics of Atmospheres and Oceans 75, 58-77.
| Crossref | Google Scholar |
Avia LQ, Sofiati I (2018) Analysis of El Niño and IOD phenomenon 2015/2016 and their impact on rainfall variability in Indonesia. IOP Conference Series: Earth and Environmental Science 166, 012034.
| Crossref | Google Scholar |
Badan Penanggulangan Bencana Daerah Kab Kapuas Hulu (2023) Banjir Melanda Tiga Desa di Kecamatan Batang Lupar Kabupaten Kapuas Hulu [Flooding hits three villages in Batang Lupar District, Kapuas Hulu Regency]. In Info Kapuas Hulu, 10 July 2023. Available at https://info.kapuashulukab.go.id/2023/07/10/banjir-melanda-tiga-desa-di-kecamatan-batang-lupar-kabupaten-kapuas-hulu/ [In Bahasa Indonesia, verified 24 January 2025]
Boucharel J, Dewitte B, du Penhoat Y, Garel B, Yeh S-W, Kug J-S (2011) ENSO nonlinearity in a warming climate. Climate Dynamics 37, 2045-2065.
| Crossref | Google Scholar |
Cai W, Borlace S, Lengaigne M, van Rensch P, Collins M, Vecchi G, Timmermann A, Santoso A, McPhaden MJ, Wu L, England MH, Wang G, Guilyardi E, Jin F-F (2014) Increasing frequency of extreme El Niño events due to greenhouse warming. Nature Climate Change 4, 111-116.
| Crossref | Google Scholar |
Cai W, Santoso A, Wang G, Yeh S-W, An S-I, Cobb KM, Collins M, Guilyardi E, Jin F-F, Kug J-S, Lengaigne M, McPhaden MJ, Takahashi K, Timmermann A, Vecchi G, Watanabe M, Wu L (2015) ENSO and greenhouse warming. Nature Climate Change 5, 849-859.
| Crossref | Google Scholar |
Carreric A (2019) La diversité d’ENSO et le changement climatique. ENSO diversity and global warming. PhD thesis, Université Paul Sabatier-Toulouse III, Toulouse, France. Available at https://theses.hal.science/tel-02942708/ [In French and English, verified 24 January 2025]
Chang C-P, Harr PA, Chen H-J (2005a) Synoptic disturbances over the equatorial South China Sea and Western Maritime Continent during boreal winter. Monthly Weather Review 133, 489-503.
| Crossref | Google Scholar |
Chang C-P, Wang Z, McBride J, Liu C-H (2005b) Annual cycle of Southeast Asia–Maritime Continent rainfall and the asymmetric monsoon transition. Journal of Climate 18, 287-301.
| Crossref | Google Scholar |
Chen M, Yu JY, Wang X, Jiang W (2019) The changing impact mechanisms of a diverse El Niño on the Western Pacific subtropical high. Geophysical Research Letters 46(2), 953-962.
| Crossref | Google Scholar |
Chen S, Chen W, Yu B, Wu R, Graf H-F, Chen L (2023) Enhanced impact of the Aleutian Low on increasing the Central Pacific ENSO in recent decades. npj Climate and Atmospheric Science 6, 29.
| Crossref | Google Scholar |
Didier N (2015) Comparison of spatial and temporal cloud coverage derived from CloudSat, CERES, ISCCP and their relationship with precipitation over Africa. American Journal of Remote Sensing 3, 17-28.
| Crossref | Google Scholar |
Geng X, Kug J-S, Shin N-Y, Zhang W, Chen H-C (2024) On the spatial double peak of the 2023–2024 El Niño event. Communications Earth & Environment 5, 691.
| Crossref | Google Scholar |
Hendon HH (2003) Indonesian rainfall variability: impacts of ENSO and local air–sea interaction. Journal of Climate 16, 1775-1790.
| Crossref | Google Scholar |
Hersbach H, Bell B, Berrisford P, Hirahara S, Horányi A, Muñoz-Sabater J, Nicolas J, Peubey C, Radu R, Schepers D, Simmons A, Soci C, Abdalla S, Abellan X, Balsamo G, Bechtold P, Biavati G, Bidlot J, Bonavita M, De Chiara G, Dahlgren P, Dee D, Diamantakis M, Dragani R, Flemming J, Forbes R, Fuentes M, Geer A, Haimberger L, Healy S, Hogan RJ, Hólm E, Janisková M, Keeley S, Laloyaux P, Lopez P, Lupu C, Radnoti G, de Rosnay P, Rozum I, Vamborg F, Villaume S, Thépaut J-N (2020) The ERA5 global reanalysis. Quarterly Journal of the Royal Meteorological Society 146, 1999-2049.
| Crossref | Google Scholar |
Hersbach H, Bell B, Berrisford P, Biavati G, Horányi A, Muñoz Sabater J, Nicolas J, Peubey C, Radu R, Rozum I, Schepers D, Simmons A, Soci C, Dee D, Thépaut J-N (2023) ERA5 monthly averaged data on single levels from 1940 to present. (Copernicus Climate Change Service, C3S, and Climate Data Store, CDS) [Dataset] doi:10.24381/cds.f17050d7
Jiang N, Zhu C, Hu Z-Z, McPhaden MJ, Chen D, Liu B, Ma S, Yan Y, Zhou T, Qian W, Luo J, Yang X, Liu F, Zhu Y (2024) Enhanced risk of record-breaking regional temperatures during the 2023–24 El Niño. Scientific Reports 14, 2521.
| Crossref | Google Scholar | PubMed |
Juneng L, Tangang FT (2005) Evolution of ENSO-related rainfall anomalies in Southeast Asia region and its relationship with atmosphere–ocean variations in Indo-Pacific sector. Climate Dynamics 25, 337-350.
| Crossref | Google Scholar |
Keenan TD, Morton BR, Manton MJ, Holland GJ (1989) The Island Thunderstorm Experiment (ITEX) – a study of tropical thunderstorms in the maritime continent. Bulletin of the American Meteorological Society 70, 152-159.
| Crossref | Google Scholar |
Leung JC-H, Zhang B, Gan Q, Wang L, Qian W, Hu Z-Z (2022) Differential expansion speeds of Indo-Pacific warm pool and deep convection favoring pool under greenhouse warming. npj Climate and Atmospheric Science 5, 97.
| Crossref | Google Scholar |
Loeb NG, Kato S, Su W, Wong T, Rose FG, Doelling DR, Norris JR, Huang X (2012) Advances in understanding top-of-atmosphere radiation variability from satellite observations. Surveys in Geophysics 33, 359-385.
| Crossref | Google Scholar |
Love BS, Matthews AJ, Lister GMS (2011) The diurnal cycle of precipitation over the Maritime Continent in a high‐resolution atmospheric model. Quarterly Journal of the Royal Meteorological Society 137, 934-947.
| Crossref | Google Scholar |
Loyola D, Valks P, Ruppert T, Richter A, Wagner T, Thomas W, van der A R, Meisner R (2006) The 1997 El Niño impact on clouds, water vapour, aerosols and reactive trace gases in the troposphere, as measured by the Global Ozone Monitoring Experiment. Advances in Geosciences 6, 267-272.
| Crossref | Google Scholar |
McPhaden MJ, Zhang X (2009) Asymmetry in zonal phase propagation of ENSO sea surface temperature anomalies. Geophysical Research Letters 36, L13703.
| Crossref | Google Scholar |
Moron V, Robertson AW, Qian J-H, Ghil M (2015) Weather types across the Maritime Continent: from the diurnal cycle to interannual variations. Frontiers in Environmental Science 2, 65.
| Crossref | Google Scholar |
Moron V, Robertson AW, Wang L (2019) Weather within climate: sub-seasonal predictability of tropical daily rainfall characteristics. In ‘Sub-Seasonal to Seasonal Prediction’. (Eds AW Robertson, F Vitart) pp. 47–64. (Elsevier) 10.1016/B978-0-12-811714-9.00003-6
Mulyana E (2002) Analisis Angin Zonal di Indonesia selama Periode ENSO [Analysis of zonal winds in Indonesia during the ENSO period]. Jurnal Sains & Teknologi Modifikasi Cuaca 3, 115-120 [In Bahasa Indonesia, with abstract in Bahasa and English].
| Google Scholar |
Neelin JD, Battisti DS, Hirst AC, Jin F-F, Wakata Y, Yamagata T, Zebiak SE (1998) ENSO theory. Journal of Geophysical Research: Oceans 103, 14261-14290.
| Crossref | Google Scholar |
Peng Q, Xie S-P, Passalacqua GA, Miyamoto A, Deser C (2024) The 2023 extreme coastal El Niño: atmospheric and air–sea coupling mechanisms. Science Advances 10, eadk8646.
| Crossref | Google Scholar | PubMed |
Philip S, Van Oldenborgh GJ (2006) Shifts in ENSO coupling processes under global warming. Geophysical Research Letters 33, 2006GL026196.
| Crossref | Google Scholar |
Qian J-H, Robertson AW, Moron V (2010) Interactions among ENSO, the monsoon, and diurnal cycle in rainfall variability over Java, Indonesia. Journal of the Atmospheric Sciences 67, 3509-3524.
| Crossref | Google Scholar |
Raghuraman SP, Soden B, Clement A, Vecchi G, Menemenlis S, Yang W (2024) The 2023 global warming spike was driven by the El Niño–Southern Oscillation. Atmospheric Chemistry and Physics 24, 11275-11283.
| Crossref | Google Scholar |
Ramadhan DNS (2023) Banjir telah berdampak pada 3.052 keluarga di Nunukan [Flooding has affected 3052 households in Nunukan]. In Antara News, 26 September 2023. Available at https://www.antaranews.com/berita/3743829/banjir-telah-berdampak-pada-3052-keluarga-di-nunukan [In Bahasa Indonesia, verified 24 January 2025]
Ray A, Rakshit S, Basak GK, Dana SK, Ghosh D (2020) Understanding the origin of extreme events in El Niño–Southern Oscillation. Physical Review E 101, 062210.
| Crossref | Google Scholar | PubMed |
Robertson AW, Moron V, Qian J-H, Chang C-P, Tangang F, Aldrian E, Koh TY, Liew J (2011) The maritime continent monsoon. In ‘World Scientific Series on Asia–Pacific Weather and Climate. Volume 5. The Global Monsoon System: Research and Forecast’. (Eds CP Chang, Y Ding, NC Lau, RH Johnson, B Wang, T Yasunari) pp. 85–98. (World Scientific) 10.1142/9789814343411_0006
Satyawardhana H, Yulihastin E (2016) Interaksi El-Nino, Monsun dan Topografi Lokal Terhadap Anomali Curah Hujan di Pulau Jawa [Interaction of El Niño, monsoon and local topography on rain anomalies in Java Island]. In ‘Fisika, Dinamika, dan Lingkungan Atmosfer Indonesia’. pp. 59–74. (Buku Ilmiah PSTA LAPAN) [In Bahasa Indonesia, with abstract in Bahasa and English]
Tan W, Wang X, Wang W, Wang C, Zuo J (2016) Different responses of sea surface temperature in the South China Sea to various El Niño events during boreal autumn. Journal of Climate 29, 1127-1142.
| Crossref | Google Scholar |
Triwibowo DR (2023) Banjir Landa Empat Kabupaten di Kalteng, Kerusakan Alam Jadi Pemicu [Four regencies in Central Kalimantan were hit by flooding, and natural losses were the cause]. In Kompas, 2 April 2023. Available at https://www.kompas.id/baca/nusantara/2023/04/02/banjir-landa-empat-kabupaten-di-kalteng-kerusakan-alam-jadi-pemicu [In Bahasa Indonesia, verified 24 January 2025]
Wallace JM, Rasmusson EM, Mitchell TP, Kousky VE, Sarachik ES, Von Storch H (1998) On the structure and evolution of ENSO‐related climate variability in the tropical Pacific: lessons from TOGA. Journal of Geophysical Research: Oceans 103, 14241-14259.
| Crossref | Google Scholar |
Wang H, Su W (2015) The ENSO effects on tropical clouds and top‐of‐atmosphere cloud radiative effects in CMIP5 models. Journal of Geophysical Research: Atmospheres 120, 4443-4465.
| Crossref | Google Scholar |
Wang C, Deser C, Yu J-Y, DiNezio P, Clement A (2017) El Niño and Southern Oscillation (ENSO): a review. In ‘Coral Reefs of the Eastern Tropical Pacific: Persistence and Loss in a Dynamic Environment’. (Eds PW Glynn, DP Manzello, IC Enochs) pp. 85–106. (Springer: Dordrecht, Netherlands) 10.1007/978-94-017-7499-4_4
Watterson IG (2020) Australian rainfall anomalies in 2018–2019 Linked to Indo-Pacific driver indices using ERA5 reanalyses. Journal of Geophysical Research: Atmospheres 125(17), e2020JD033041.
| Crossref | Google Scholar |
Wong T, Wielicki BA, Lee RB, Smith GL, Bush KA, Willis JK (2006) Reexamination of the observed decadal variability of the earth radiation budget using altitude-corrected ERBE/ERBS nonscanner WFOV data. Journal of Climate 19, 4028-4040.
| Crossref | Google Scholar |
Wu X, Okumura YM, Deser C, DiNezio PN (2021) Two-year dynamical predictions of ENSO event duration during 1954–2015. Journal of Climate 34, 4069-4087.
| Crossref | Google Scholar |
Yamanaka MD (2016) Physical climatology of Indonesian maritime continent: an outline to comprehend observational studies. Atmospheric Research 178–179, 231-259.
| Crossref | Google Scholar |
Yeo S-R, Kim K-Y (2014) Global warming, low-frequency variability, and biennial oscillation: an attempt to understand the physical mechanisms driving major ENSO events. Climate Dynamics 43, 771-786.
| Crossref | Google Scholar |
Yulihastin E, Nuryanto DE, Trismidianto , Muharsyah R (2021) Improvement of heavy rainfall simulated with SST adjustment associated with mesoscale convective complexes related to severe flash flood in Luwu, Sulawesi, Indonesia. Atmosphere 12, 1445.
| Crossref | Google Scholar |

