

Phosphorus limits diazotrophic cyanobacteria whereas other phytoplankton are co-limited by nitrogen and phosphorus in the lowland Murray River, Australia
Terence A. Rogers A * , Jordan A. Facey A B , Huy Andrew Luong A , Jarrod E. Walton A , Tsuyoshi Kobayashi C D , Nicholas Williamson E , Justin R. Seymour F and Simon M. Mitrovic A
A
B
C
D
E
F
Abstract
Balances in the availability of nitrogen (N) and phosphorus (P) are particularly important in controlling the competitive dynamics between diazotrophic and non-diazotrophic cyanobacteria in riverine environments. In the Murray River, this has not been greatly studied despite frequent cyanobacterial blooms.
To assess the influence of N and P concentrations on cyanobacterial and eukaryotic phytoplankton communities.
We conducted six in situ nutrient amendment experiments across five riverine sites along the Murray River, Australia. Substantial diazotrophic cyanobacterial biomass was present at four sites on experimental onset.
Chlorophyll-a measures indicated co-limitation of N and P at Corowa_21 and Kulnine_21, whereas P alone was the key limiting nutrient at Torrumbarry_20, Mildura_20 and Mildura_21. Phytoplankton populations responded differently to nutrient addition, with diazotrophic cyanobacteria being more often limited by P alone whereas algal groups such as chlorophytes were consistently co-limited. Low ambient dissolved inorganic nitrogen concentrations supported a competitive advantage for some diazotrophic species but not for non-diazotrophic species.
We conclude that within the Murray River, P is the key limiting factor for diazotrophic cyanobacterial growth, and the broader phytoplankton community is co-limited by P and N.
Reductions in the levels of P input will potentially be the most effective nutrient-based control method in reducing cyanobacterial biomass in this and analogous river systems.
Keywords: chlorophyll-a, diazotrophic cyanobacteria, eukaryotic phytoplankton, Murray River, nitrogen, non-diazotrophic cyanobacteria, nutrient limitation, phosphorus.
Introduction
Riverine systems are becoming increasingly threatened by anthropogenic alteration and degradation. Catchment modification, urbanisation, agricultural development and in-stream alterations have changed many natural limnological processes (Cassardo and Jones 2011; Dudgeon 2019). These changes can increase the availability of macronutrients such as nitrogen (N) and phosphorus (P), which can subsequently stimulate cyanobacterial blooms (Davis and Koop 2006; Paerl et al. 2020). This is concerning because cyanobacterial blooms can cause severe environmental, economic and human health problems as a consequence of the production of cyanotoxins (Pilotto et al. 1997; Carmichael 2001; Paerl and Otten 2013; Testai et al. 2016), which are toxic compounds implicated in human and animal illness and death (Carmichael 1992; de la Cruz et al. 2011; Mowe et al. 2015).
Phytoplankton growth is regularly limited by the availability of N and P (Elser et al. 2007; Dolman et al. 2016; Frost et al. 2023). However, phytoplankton groups differ in their nutrient acquisition strategies or capabilities, which can affect their success in different environments. For example, heterocystous cyanobacteria of the order Nostocales often outcompete other phytoplankton groups when the N to P ratio is low and N becomes limiting (De Tezanos Pinto and Litchman 2010; Carey et al. 2012). This phenomenon has led to a focus on P reduction strategies to manage eutrophication as N reduction has been considered ineffective because of the compensation of N reductions by N2-fixing cyanobacteria (Schindler et al. 2016). However, this is being increasingly challenged by many studies, finding that N2-fixation cannot fully compensate for N reductions and that long-term N or co-limitation can occur without community shifts towards N2-fixing taxa (Krogmann et al. 1986; McCarthy et al. 2009; Müller and Mitrovic 2015; Kolzau et al. 2018; Shatwell and Köhler 2019; Kramer et al. 2022).
In large lowland riverine environments, impoundments made by dams and weirs on rivers can alter nutrient dynamics by increasing water residence times, and stimulating thermal and oxygen stratification (Bormans et al. 2004; Mitrovic et al. 2011). This may aid the release of sediment-bound nutrients to the water column during hypoxic or anoxic bottom water periods, which can be redistributed by mixing events, or transported downstream (Paerl 2008; Jung et al. 2014). Many weir pools are likely to have conditions characteristic of a high rate of denitrification, such as shallow, warm waters, high sediment resuspension and intermittent hypoxia (Seitzinger et al. 2006; Holmroos et al. 2012; Velthuis and Veraart 2022). High rates of denitrification will likely lead to a decrease in the N:P ratio (Seitzinger et al. 2006), which often favours N-fixing cyanobacteria (De Tezanos Pinto and Litchman 2010).
The Murray River is one of Australia’s major rivers, spanning over 2500 km in length. Cyanobacterial bloom events in the Murray River have increased over the past decade (Walker and Hillman 1982; Bowling et al. 2018), with evidence that nearly all blooms are likely to have originated in weir pools (Scholz et al. 2003; Al-Tebrineh et al. 2012) or the large upstream reservoir Hume Dam (Bowling et al. 2013, 2018). Several re-occurring species of cyanobacteria dominate these blooms, including Dolichospermum crassum, Dolichospermum planctonicum, Dolichospermum circinale, Microcystis flos-aquae and Raphidiopsis raciborskii. In recent years, Chrysosporum ovalisporum has become common and has formed extensive blooms along most of the Murray River (Bowling et al. 2018). The observation that many of the dominant cyanobacterial genera in the Murray River are diazotrophic (N fixing), heterocystous taxa supports the findings of Harris (2001), which indicated the wider phytoplankton community of the Murray River is likely to be N-limited because of denitrification processes within the river. However, there is currently little information available on the key limiting nutrients for phytoplankton growth in the Murray River, and there have been no direct tests of limiting nutrients during the cyanobacterial growth season in this region, despite the literature suggesting nutrients as drivers of blooms (Scholz et al. 2003; Bowling et al. 2018).
Understanding which nutrients limit phytoplankton growth and how nutrients affect phytoplankton community structure can help guide the development of effective targeted management actions to reduce the proliferation of problem taxa (Wurtsbaugh et al. 2019). Here, we aimed to determine whether N or P, or a combination of both, limit the growth of cyanobacteria and other phytoplankton groups during warmer temperature periods, across multiple weir pool and riverine sites in the Murray River, spanning a distance of ~1300 km. We hypothesised that (1) eukaryotic phytoplankton and non-diazotrophic cyanobacteria would be co-limited by N and P because of low ambient nutrient concentrations, (2) diazotrophic cyanobacteria will be limited by P alone because of their ability to fix atmospheric N2, and (3) sites will vary in their response to nutrient additions on account of local conditions and nutrient availability.
Materials and methods
Study sites
The Murray–Darling Basin is Australia’s second largest river catchment and is located in the south-east of the country, spanning five states and territories. Within the basin is Australia’s largest river, the Murray, which runs for ~2530 km and is the terminus for the Basin. Post-colonial regulation of the river in the form of weirs, locks and channels has allowed for the development of towns and agriculture along the river. The development of The Snowy Mountains Scheme, a hydroelectric and irrigation project, has also significantly influenced the flow of the Murray River. In many cases, these riverine alterations, such as dams and weirs, have created ideal habitats for cyanobacteria (Scholz et al. 2003).
Weir pools within the Murray River are a specific area of interest because they are both the major contributor to flow reduction in-stream and sites of recurring cyanobacterial blooms (Walker and Hillman 1982; Scholz et al. 2003; Bowling et al. 2018). These weirs are also often situated alongside major townships on the river and are used for drinking water, recreation and irrigation.
Four weir pools and one riverine site were selected along the Murray River (Fig. 1). The weir pool sites chosen for this study are distributed along ~1300 km of river and are often influenced by irrigation canals, tributaries and anabranches. Sites were monitored monthly as part of a larger study, during the summer months of 2019–2020 and 2020–2021, for phytoplankton, nutrients and physicochemistry (Rogers 2023). Algal bloom reports from the New South Wales State Government’s Murray and Sunraysia Regional Algae Coordinating Committees (RACCs) were also obtained so that experiments would coincide with cyanobacterial blooms (Rogers 2023).
Map of the Murray River, Australia, with the five sites chosen for experimental setup indicated.
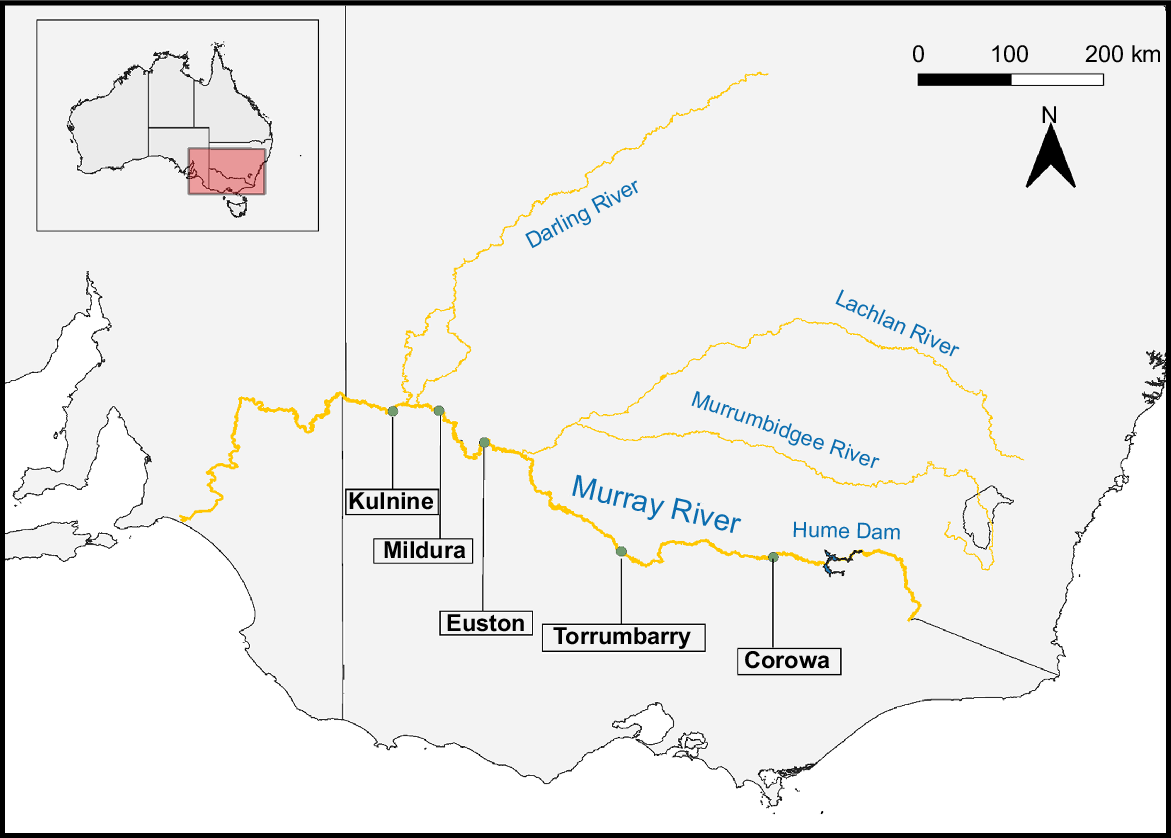
Details on the locations and features of the sites, and the timing of the nutrient enrichment study are provided in Table 1. Additionally, Fig. 1 illustrates the arrangement of these sites along the Murray River and their relation to other significant tributaries and the Hume Dam. Going forth, site names and year of experimentation will be used for reference to sites for clarity. Thus, Kulnine Weir will be called Kulnine_21, Mildura Weir will be Mildura_20 and Mildura_21, Euston Weir will be Euston_20, Torrumbarry Weir will be Torrumbarry_20 and Corowa will be Corowa_21.
| Site | Location | Features | Experiment conducted | |
|---|---|---|---|---|
| Kulnine Weir (Kulnine_21) | 141.600282°E, −34.192232°S | 765 km from mouth of Murray River and downstream from the Darling confluence; ~60 km long pool, ~130 m wide and ~5 m deep. Riverbank is undisturbed and heavily vegetated. | April 2021 | |
| Mildura Weir (Mildura_20, Mildura_21) | 142.175219°E, −34.182928°S | ~60 km long pool, ~176 m wide, ~5 m deep. Has very few tributaries and sparse riparian vegetation. Surrounding land subject to agricultural and urban disturbances. | January 2020 and April 2021 | |
| Euston Weir (Euston_20) | 142.744813°E, −34.581027°S | 60–100 km long pool, ~120 m wide and ~5 m deep. Riparian zone is undisturbed native vegetation. The Murrumbidgee River and Edward–Wakool Anabranch are potential nutrient sources. | January 2020 | |
| Torrumbarry Weir (Torrumbarry_20) | 144.466037°E, −35.944616°S | ~1638 km from Murray River mouth, ~70 m wide, 4–6 m deep. Riparian zone well established, with one major urban influence (Echuca) ~40 km upstream. | February 2020 | |
| Corowa (Corowa_21) | 146.378395°E, −36.017845°S | Only non-weir pool riverine site; ~440 km upstream of Torrumbarry Weir, ~70–80 m wide and ~3 m deep. Moderately vegetated river banks with mostly agricultural activities beyond the floodplain. | April 2021 |
Microcosm enrichment assays
In situ microcosm nutrient assays were undertaken at each site to determine the limiting nutrients of cyanobacterial and other phytoplankton growth and to learn how increased nutrient availability influenced phytoplankton community structure. Each microcosm experiment lasted for 8 days, and experimental setup was similar to that in Facey et al. (2021). Microcosm treatments consisted of a control (C), nitrogen (N), phosphorus (P), and a nitrogen–phosphorus combination (NP), which were all tested in triplicate per site. Amended nutrient addition concentrations were 500 μg N L−1 in the form of KNO3 (N treatment) and 200 μg P L−1 in the form of KH2PO4 (P treatment) for each microcosm treatment. A combination of both N and P were used for the NP treatment and there was no addition to the C treatment. The amended nutrient concentrations were selected so that nutrient availability was in excess, but within a natural range expected in inland Australian river systems (Furst et al. 2019).
The experimental setup consisted of 3-L polyethylene bottles suspended with rope within the river with floats. Bottles were positioned within the euphotic zone near the water surface (~90% surface irradiance), ensuring phytoplankton growth was not limited by light during the experiments. Microcosm treatment bottles were pre-rinsed and then filled from a large plastic tub with ~120 L of surface river water, which was pre-filtered through a 75-μm plankton net to exclude zooplankton, preventing or reducing any phytoplankton change owing to grazing. A fraction of the sample retained in the net was analysed post-experiment for each site to determine whether the pre-filtration process removed any phytoplankton that were absent from the filtrate. Bottles were left with a small air space and nutrient amendments were added using calibrated pipettes. Bottles were lightly mixed through inversion and set randomly along the stringline.
Samples of phytoplankton, chlorophyll-a and dissolved nutrients were collected in triplicate on Day 0 and on Day 8, by using the methods outlined below. Single replicates of all parameters were taken from each microcosm bottle on Day 8, and dissolved nutrients were collected from three surrogate bottles after the nutrient additions on Day 0.
Nutrient sampling and analysis
Water samples for dissolved nutrients were collected from three surrogate bottles before and after the nutrient additions on Day 0 (ambient and amended concentrations respectively). Each water sample was filtered through a 0.45-μm Sartorius cellulose-acetate syringe filter into a 200-mL polyethylene bottle. All filtered water samples (100–150 mL each) were kept frozen for transport to a laboratory. Analyses of the nutrient species included filterable reactive phosphorus (FRP) and oxidised nitrogen (nitrate and nitrite or NOX) and were determined photometrically by using a QuikChem 8500 Lachat nutrient analyser, following American Public Health Association (1995) methods. FRP was measured with the molybdite blue method, using ascorbic acid as the reductant (Murphy and Riley 1962). NOX was analysed with the sulfanilamide method after reduction by a cadmium column (Hosomi and Sudo 1986; American Public Health Association 1995).
Phytoplankton collection and enumeration
Phytoplankton samples (in triplicate, 200 mL each) were collected from the tub on Day 0 and from each microcosm bottle on Day 8 of the experiments, and were preserved in Lugol’s iodine solution. Phytoplankton in the samples were identified using an Olympus BX41 compound light microscope and a Sedgwick–Rafter counting chamber. Enumeration followed methods described by Hötzel and Croome (1999). If required, a 5× concentration was made by settling 50 mL of the sample in measuring cylinders for 24 h. The cylinder was checked for any floating phytoplankton and the upper 40 mL was removed. All taxa were identified to genus level, except for potentially toxic genera that were identified to species level.
Chlorophyll-a analysis
For Days 0 and 8 of the experiments, chlorophyll-a concentrations were measured using the methods described in Müller and Mitrovic (2015), by filtering 200 mL of water sample through a 0.7-μm pore-sized glass fibre filter paper (Whatman) by using a Mitivac vacuum hand pump. The filters were then wrapped in aluminium foil and kept frozen until analysed. Prior to analyses, 10 mL of 90% ethanol was added to the glass fibre filters in clean 10-mL centrifuge tubes and subsequently heated in a 75°C water bath for 10 min. Remnant particles were settled by centrifuging at 2000g for 10 min at 20°C. The supernatant was analysed spectrophotometrically by using a Varian Cary 50 Bio UV Spectrophotometer.
Statistical analysis
Chlorophyll-a concentrations, phytoplankton group biovolume and cyanobacterial species biovolume were analysed using permutational ANOVA (PERMANOVA) with PRIMER + PERMANOVA software (ver. 6, see https://www.primer-e.com/; Anderson 2001). Community analysis was based on similarity percentages (SIMPER) and was performed using Primer software (ver. 6, see https://www.primer-e.com/). Principal component analysis (PCA) was conducted on the dominant phytoplankton communities by using CANOCO software (ver. 5.1, see http://www.canoco.com/), with a separate ordination analysis for each year in which experiments were conducted (Mildura_20, Euston_20 and Torrumbarry_20; and Kulnine_21, Mildura_21 and Corowa_21). Ordinations were conducted separately for each year, because the preliminary analysis indicated that the variation was primarily driven by differences in the initial community composition at the onset of experimentation. Dominant phytoplankton species were identified on the basis of the following two criteria: occurrence in more than three samples and constituting over 5% of the community composition. Hierarchical cluster analysis was performed on the phytoplankton community data to identify commonalities between treatments and sites. The optimal number of clusters was determined using the elbow method (Syakur et al. 2018). PERMANOVA was used to confirm the dissimilarities of the clusters.
Results
Initial conditions
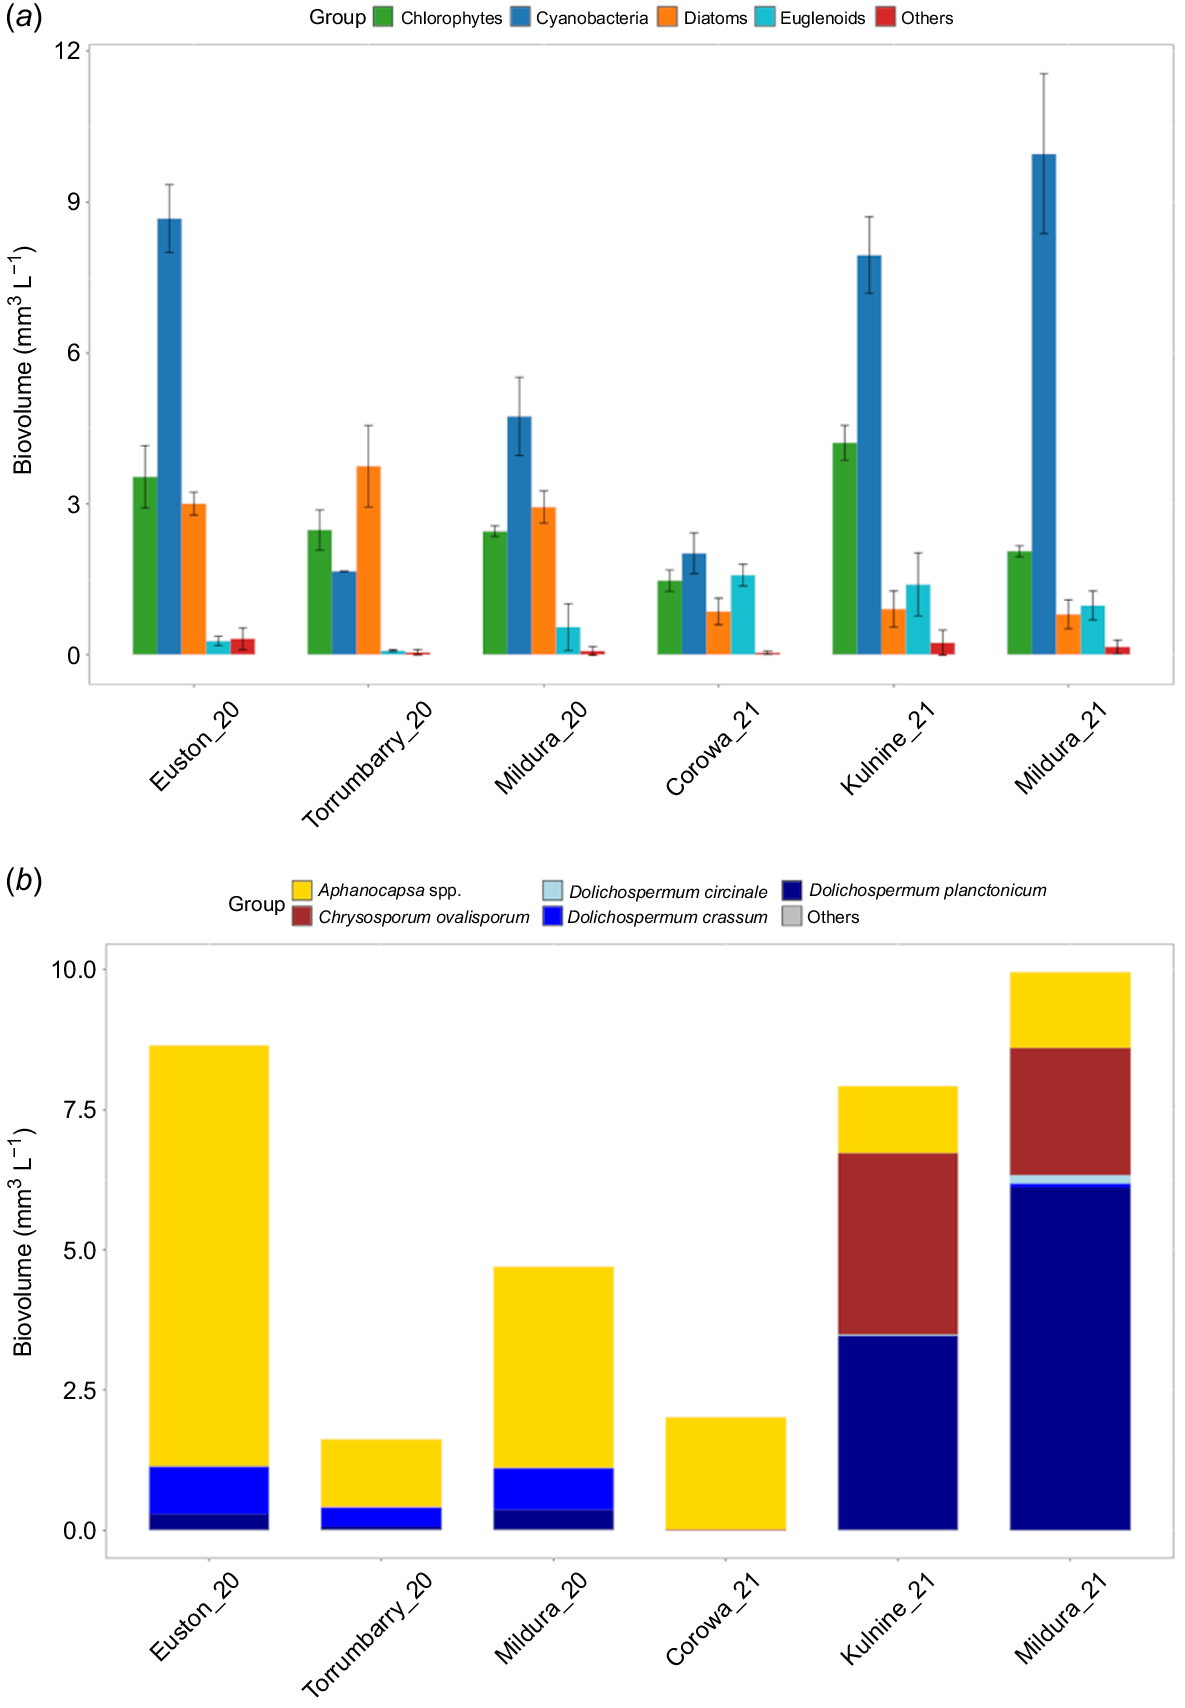
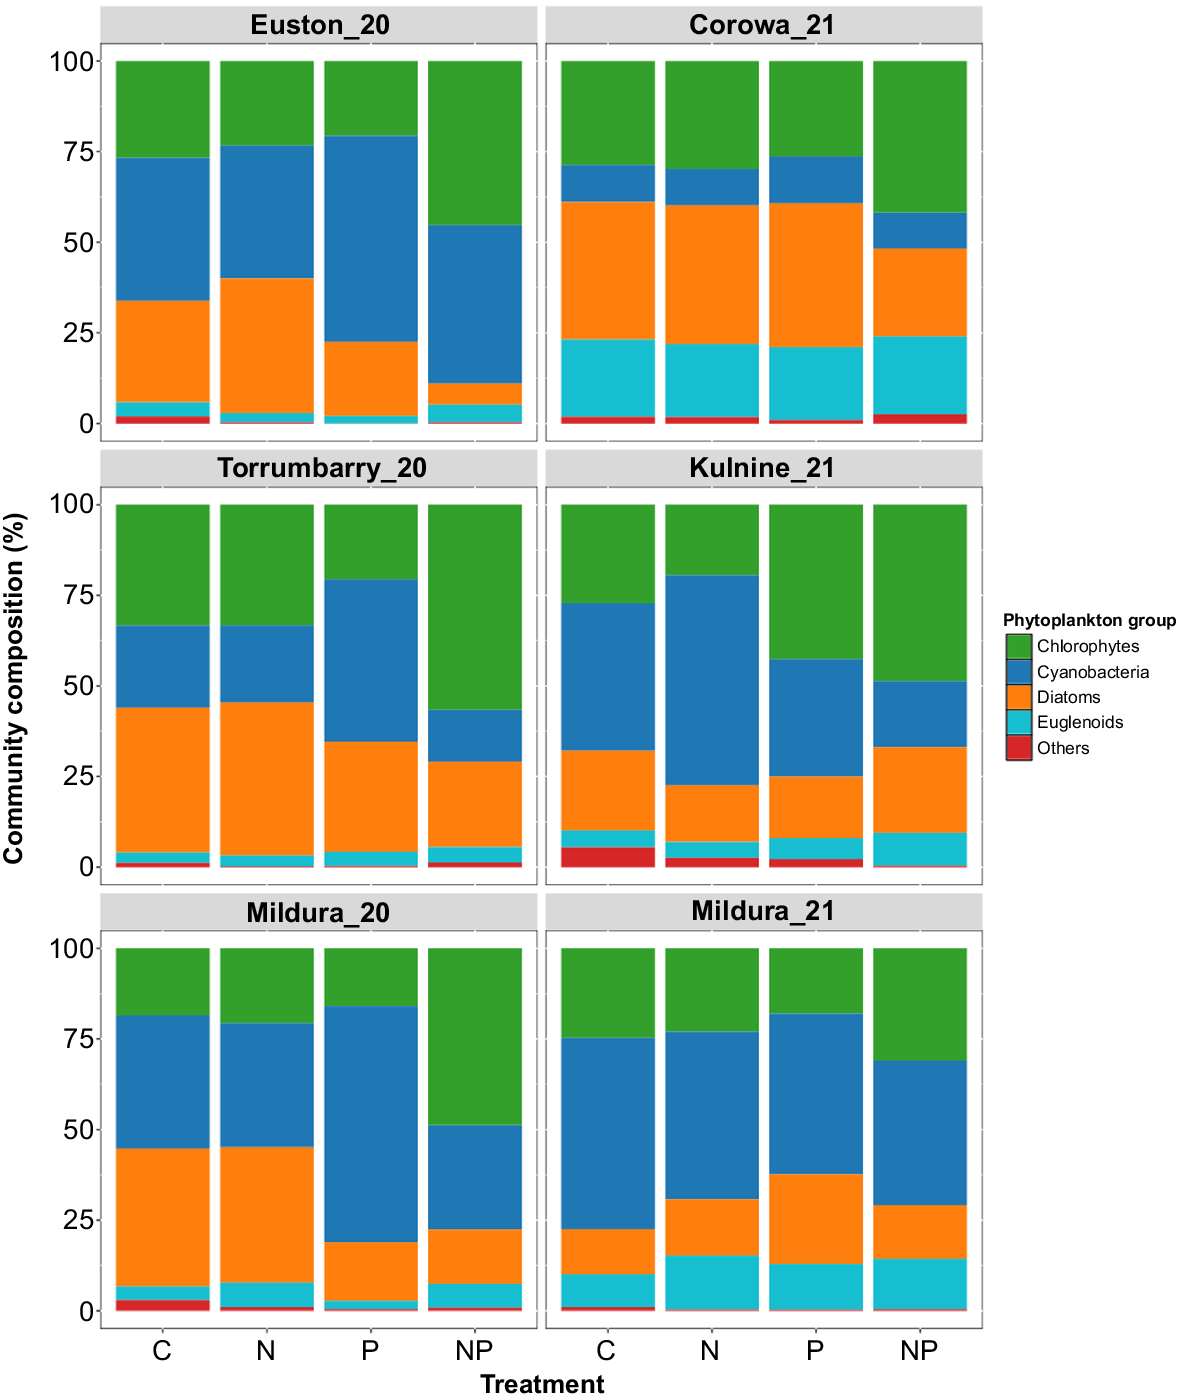
Cyanobacteria were present at all sites at the onset of experimentation, and were the dominant phytoplankton group at Euston_20, Mildura_20, Kulnine_21, Corowa_21 and Mildura_21 experiments (Fig. 2a). Diazotrophic cyanobacterial species were dominant in the system at the start of these experiments, particularly Dolichospermum crassum and D. planctonicum at Euston_20, Mildura_20 and Torrumbarry_20 whereas Chyrsosporum ovalisporum and D. planctonicum were dominant at Mildura_21 and Kulnine_21. Similarly, during the experiments at Mildura_21 and Kulnine_21, there were mixed blooms of D. planctonicum and C. ovalisporum (Fig. 2b).
(a) Initial phytoplankton communities and (b) cyanobacteria species composition from Day 0 of each experiment. Error bars are one standard error from the mean, n = 3.
Ambient dissolved NOX concentrations were low at all sites (Table 2). This was particularly notable for Torrumbarry_20, Euston_20, and both Mildura experiments, with NOX concentrations of <10 μg L−1. NOX was more available at Kulnine_21 and Corowa_21. Similarly, FRP concentrations were lowest and below detection limit at Torrumbarry_20, Euston_20, Mildura_20 and Mildura_21 sites on Day 0 of the experiments. FRP was slightly higher Kulnine_21 and to a lesser degree at Corowa_21.
| Item | Corowa_21 | Torrumbarry_20 | Euston_20 | Mildura_20 | Mildura_21 | Kulnine_21 | |
|---|---|---|---|---|---|---|---|
| Ambient | |||||||
| NO X | 62.00 ± 0 | <5 | 9.70 ± 0.10 | <5 | 10.00 ± 1.00 | 20.50 ± 11.50 | |
| FRP | 7.00 ± 0 | <5 | <5 | <5 | <5 | 23.00 ± 18.00 | |
| Amended | |||||||
| NO X | 452.50 ± 127.50 | 654.58 ± 22.72 | 531.48 ± 11.02 | 484.13 ± 47.73 | 625.00 ± 5.00 | 387.50 ± 17.50 | |
| FRP | 185.00 ± 25.00 | 237.00 ± 6.05 | 191.35 ± 4.77 | 163.93 ± 10.55 | 227.50 ± 2.50 | 225.00 ± 5.00 | |
Values are means ± s.e. (n = 3).
Chlorophyll-a responses to nutrients
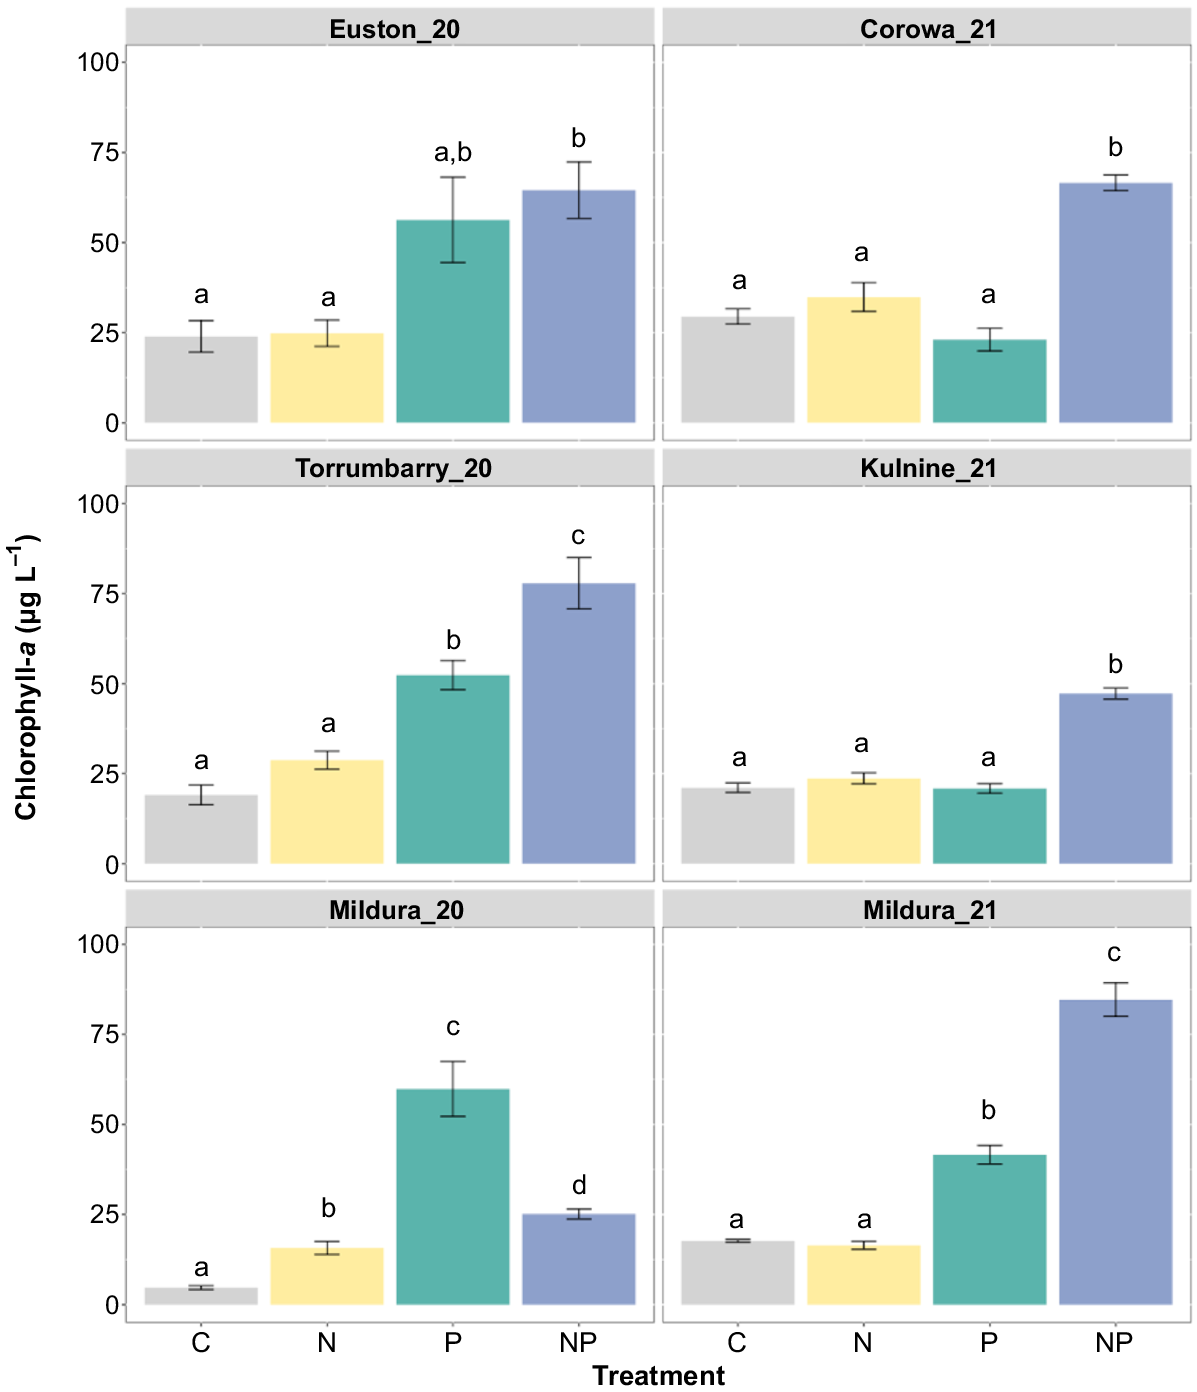
Permutational analysis of chlorophyll-a concentrations showed significant differences among treatments at all sites (PERMANOVA: P < 0.05). Pairwise comparisons showed that chlorophyll-a concentrations increased significantly in the P and NP treatments in Mildura_20 (PERMANOVA: C v. P, P = 0.001; C v. NP, P = 0.001), Mildura_21 (PERMANOVA: C v. P, P = 0.001; C v. NP, P = 0.001) and Torrumbarry_20 (PERMANOVA: C v. P, P = 0.003; C v. NP, P = 0.001) experiments when compared with the control (Fig. 3). Furthermore, analysis showed the treatment effect of NP was significantly greater than that of the P treatments at Mildura_21 (PERMANOVA: P v. NP, P = 0.003) and Torrumbarry_20 (PERMANOVA: P v. NP, P = 0.032), with no response to N treatments at both sites when compared with the control (PERMANOVA: Mildura_21 C v. N, P > 0.05; Torrumbarry_20 C v. N, P > 0.05), suggesting serial P limitation. In Mildura_20, chlorophyll-a concentration was significantly greater than the control in all treatments, but the greatest response was in the P treatment. This could indicate independent co-limitation with antagonistic effect of N according to the criteria outlined in Sperfeld et al. (2016). Experiments at Corowa_21, Kulnine_21 and Euston_20 showed a significant increase of chlorophyll-a concentration in the NP treatment when compared with the control (PERMANOVA: Corowa_21 C v. NP, P = 0.001; Kulnine_21 C v. NP, P = 0.002; Euston_20 C v. NP, P = 0.009). Additionally, at these sites there was no significant response in the N treatments (PERMANOVA: P > 0.05) or P treatments (PERMANOVA: P > 0.05) when compared with the control, suggesting Corowa_21 and Kulnine_21 are simultaneously co-limited (Fig. 3). However, at Euston_20, the P and NP treatments were found to not be significantly different from each other (PERMANOVA: P > 0.05), making it hard to identify as either serial P limitation or a type of co-limitation.
Chlorophyll-a concentrations from the microcosm assays after incubation. Treatments were C (control), N (nitrogen alone), P (phosphorus alone) and NP (combination of nitrogen and phosphorus). Different letters above the bars indicate statistically significant differences between treatments, determined by pairwise comparisons (PERMANOVA, P ≤ 0.05); where letters are absent, the overall test was insignificant. Error bars are one standard error from the mean, n = 3.
Biovolume of major phytoplankton groups
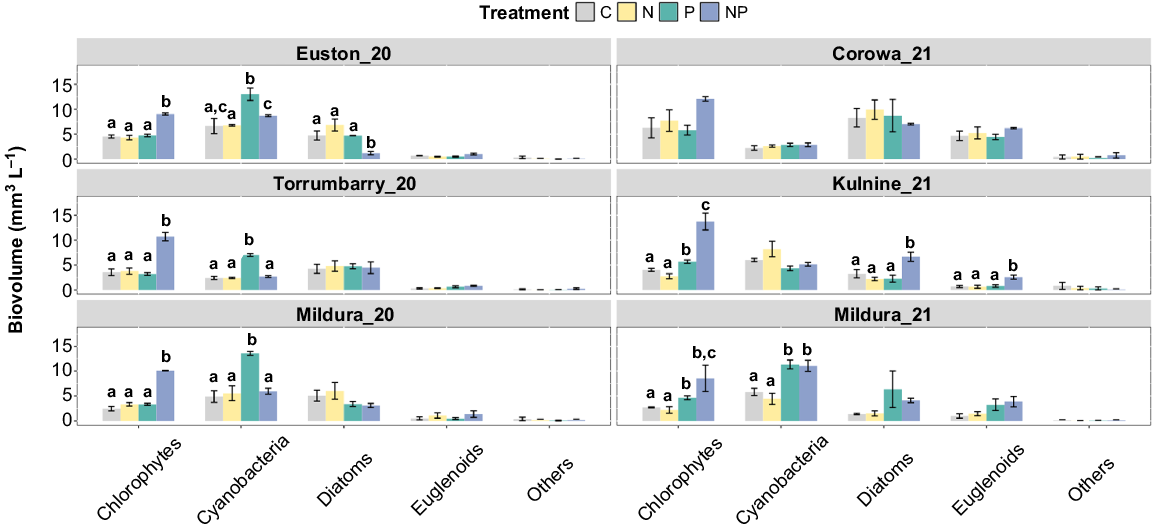
Chlorophytes consistently had the greatest response to NP treatments and had a significantly greater biovolume than in the control at all weir pool sites following incubation (PERMANOVA: Mildura_20 C v. NP, P = 0.001; Euston_20 C v. NP, P = 0.001; Torrumbarry_20 C v. NP, P = 0.006; Kulnine_21 C v. NP, P = 0.001; Mildura_21 C v. NP, P = 0.018). In Mildura_20, Euston_20 and Torrumbarry_20 incubations, no other treatments responded to nutrient addition, suggesting chlorophytes are simultaneously co-limited at these sites. However, chlorophytes responded significantly in the P treatments at Mildura_21 and Kulnine_21 (PERMANOVA: Mildura_21 C v. P, P = 0.008; Kulnine_21 C v. P, P = 0.023), but not in the N treatment when compared with the control (PERMANOVA: Mildura_21 C v. P, P > 0.05; Kulnine_21 C v. P, P > 0.05), suggesting serial P limitation (Fig. 4). Responses of the cyanobacterial group at Torrumbarry_20, Euston_20 and Mildura_20 showed statistical significance in the P treatment when compared with the control (PERMANOVA: Mildura_20 C v. P, P = 0.014; Euston_20 C v. P, P = 0.049; Torrumbarry_20 C v. P, P = 0.002), suggesting P limitation with an antagonistic effect of N (Fig. 4). Additionally, at Mildura_21, cyanobacteria responded significantly to both P and NP treatments when compared with the control (PERMANOVA: Mildura_21 C v. P, P = 0.008; C v. NP, P = 0.019), but did not differ between each other (PERMANOVA: Mildura_21 P v. NP, P > 0.05), again suggesting single P limitation (Fig. 4). Diatom biovolume was significantly greater in the NP treatment in the Kulnine_21 experiment (PERMANOVA: C v. NP, P = 0.048), but growth was not stimulated in any other sites or treatments. Similarly, euglenoid biovolume was not different from the control in any sites or treatments except in the NP treatment at Kulnine_21 (PERMANOVA: C v. NP, P = 0.017). This suggests that both diatoms and euglenoids are simultaneously co-limited at Kulnine_21 (Fig. 4).
Biovolume of different phytoplankton community groups in microcosm experiments. Different letters above the bars indicate statistically significant differences between the treatments, determined by pairwise comparisons (PERMANOVA, P ≤ 0.05); where letters are absent, the overall test was insignificant. Error bars are one standard error from the mean, n = 3.
Phytoplankton community responses
In sites Mildura_20, Euston_20 and Torrumbarry_20, phytoplankton community composition was heavily influenced by increased relative abundance of cyanobacteria in every P treatment across experiments (Fig. 5). SIMPER analysis showed that the diazotrophic cyanobacteria D. crassum and D. planctonicum were the largest drivers of differences at Mildura_20 (~50%), Euston_20 (~41%) and Torrumbarry_20 (~42%). At Mildura_21, D. planctonicum was the primary driver of differences in the P (~33%) and NP (~30%) treatments; however, in the N treatment, C. ovalisporum (~14%) contributed approximately equally with D. planctonicum (~16%). This was reflected in the lack of clear distinction between phytoplankton communities across the treatments (Fig. 5). In the Kulnine_21 experiment, there was a greater proportion of cyanobacteria in the N and C treatments than of chlorophytes, which dominated the P and NP treatments. Small increases in relative cyanobacterial abundance in the N treatment when compared with the control were driven by C. ovalisporum. Chlorophyta were most abundant across NP treatments at all sites except Mildura_21, where cyanobacteria were still most abundant (Fig. 5). Scenedesmus sp. was the largest non-cyanobacterial contributor to differences in phytoplankton community structure across the remaining five experiments.
Cyanobacteria species responses to amendments
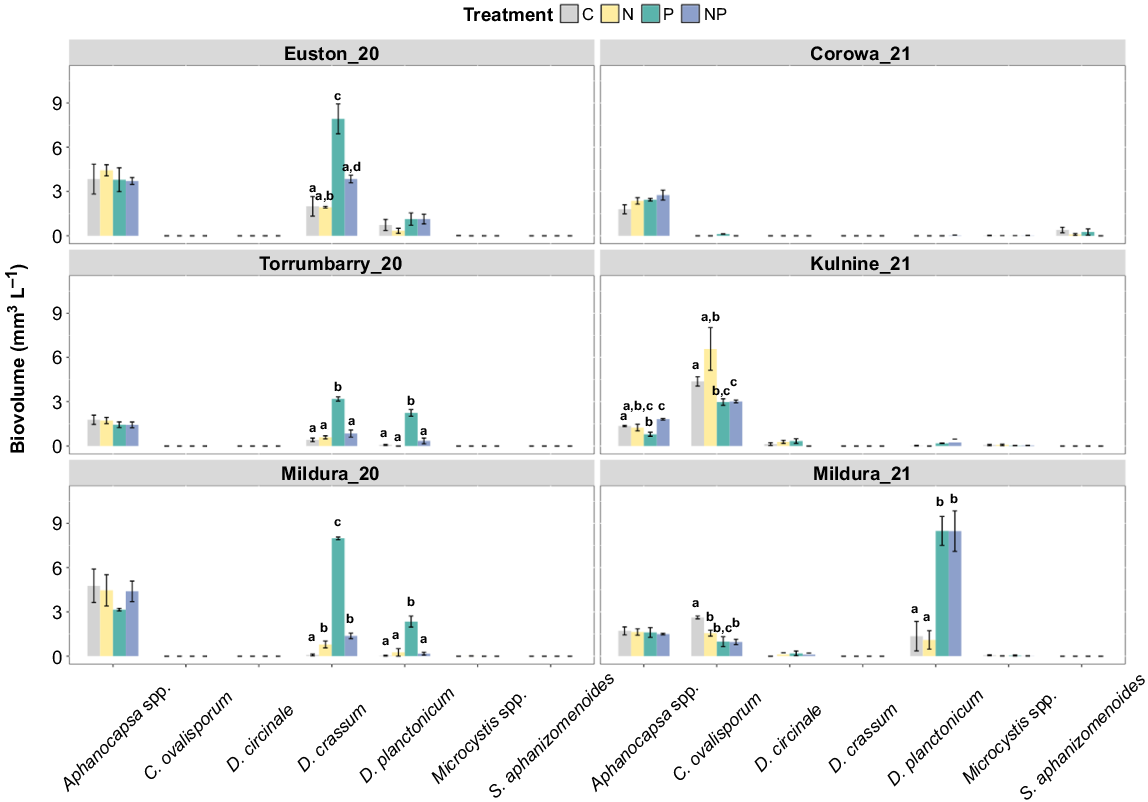
Species-specific responses to nutrient additions followed trends similar to those observed for the total cyanobacterial assemblage during the Mildura_20, Euston_20 and Torrumabrry_20 experiments (Fig. 4, 6); however, several species showed differing responses through the Kulnine_21, Mildura_21 and Corowa_21 experiments. The primary cyanobacterial species displaying P limitation were D. crassum (PERMANOVA: Mildura_20 C v. P, P = 0.001; Euston_20 C v. P, P = 0.004; Torrumbarry_20 C v. P, P = 0.002) and D. planctonicum (PERMANOVA: Mildura_20 C v. P, P = 0.008; Torrumbarry_20 C v. P, P = 0.001) in 2020 experiments, and were the primary phytoplankton species blooming that year (Fig. 6). Similarly, in the Mildura_21 experiments, D. planctonicum displayed clear P limitation of growth (PERMANOVA: C v. P, P = 0.005), whereas C. ovalisporum growth did not appear to be limited by N or P in any of the experiments. D. circinale was present in both Kulnine_21 and Mildura_21 experiments and maintained a low overall biomass in all treatments. At Corowa_21, the diazotrophic cyanobacterium Sphaerospermopsis aphanizomenoides was observed at low biomass, but it did not respond to any of the nutrient additions (Fig. 6).
Biovolume responses of dominant cyanobacterial species to nutrient additions. Different letters above the bars indicate statistically significant differences between the treatments, determined by pairwise comparisons (PERMANOVA, P ≤ 0.05); where letters are absent, the overall test was insignificant. Error bars are one standard error from the mean, n = 3.
The PCA for site experiments conducted in 2020 used 18 dominant species. The first two axes explained 66.52% of community data variability (Axis 1 = 39.58%; Axis 2 = 26.95%) (Fig. 7). The most important species for Axis 1 ordination were D. crassum (1.52) and D. planctonicum (1.13). For Axis 2, the most important groups for its ordination were Scenedesmus (1.69), Synedra (−0.887) and Fragillaria (−0.821). PCA for site experiments performed in 2021 used 20 dominant species. The first two axes explained 54.16% of community data variability (Axis 1 = 35.19%; Axis 2 = 18.97%) (Fig. 7). Species important for Axis 1 ordination included Nitzschia (1.47), Euglena (1.42), Cryptomonas (1.34) and Chrysosporum (−1.41). Important species for Axis 2 included D. planctonicum (2.02), Peridinium (−1.14) and Chrysosporum (−0.951).
Principal component analysis (PCA) applied to phytoplankton species data (dominant) from (a) 2020 sites and (b) 2021 sites. Sampling units distinguished by site and treatment. Hierarchical cluster analysis identified six clusters indicated by numbered ellipses.
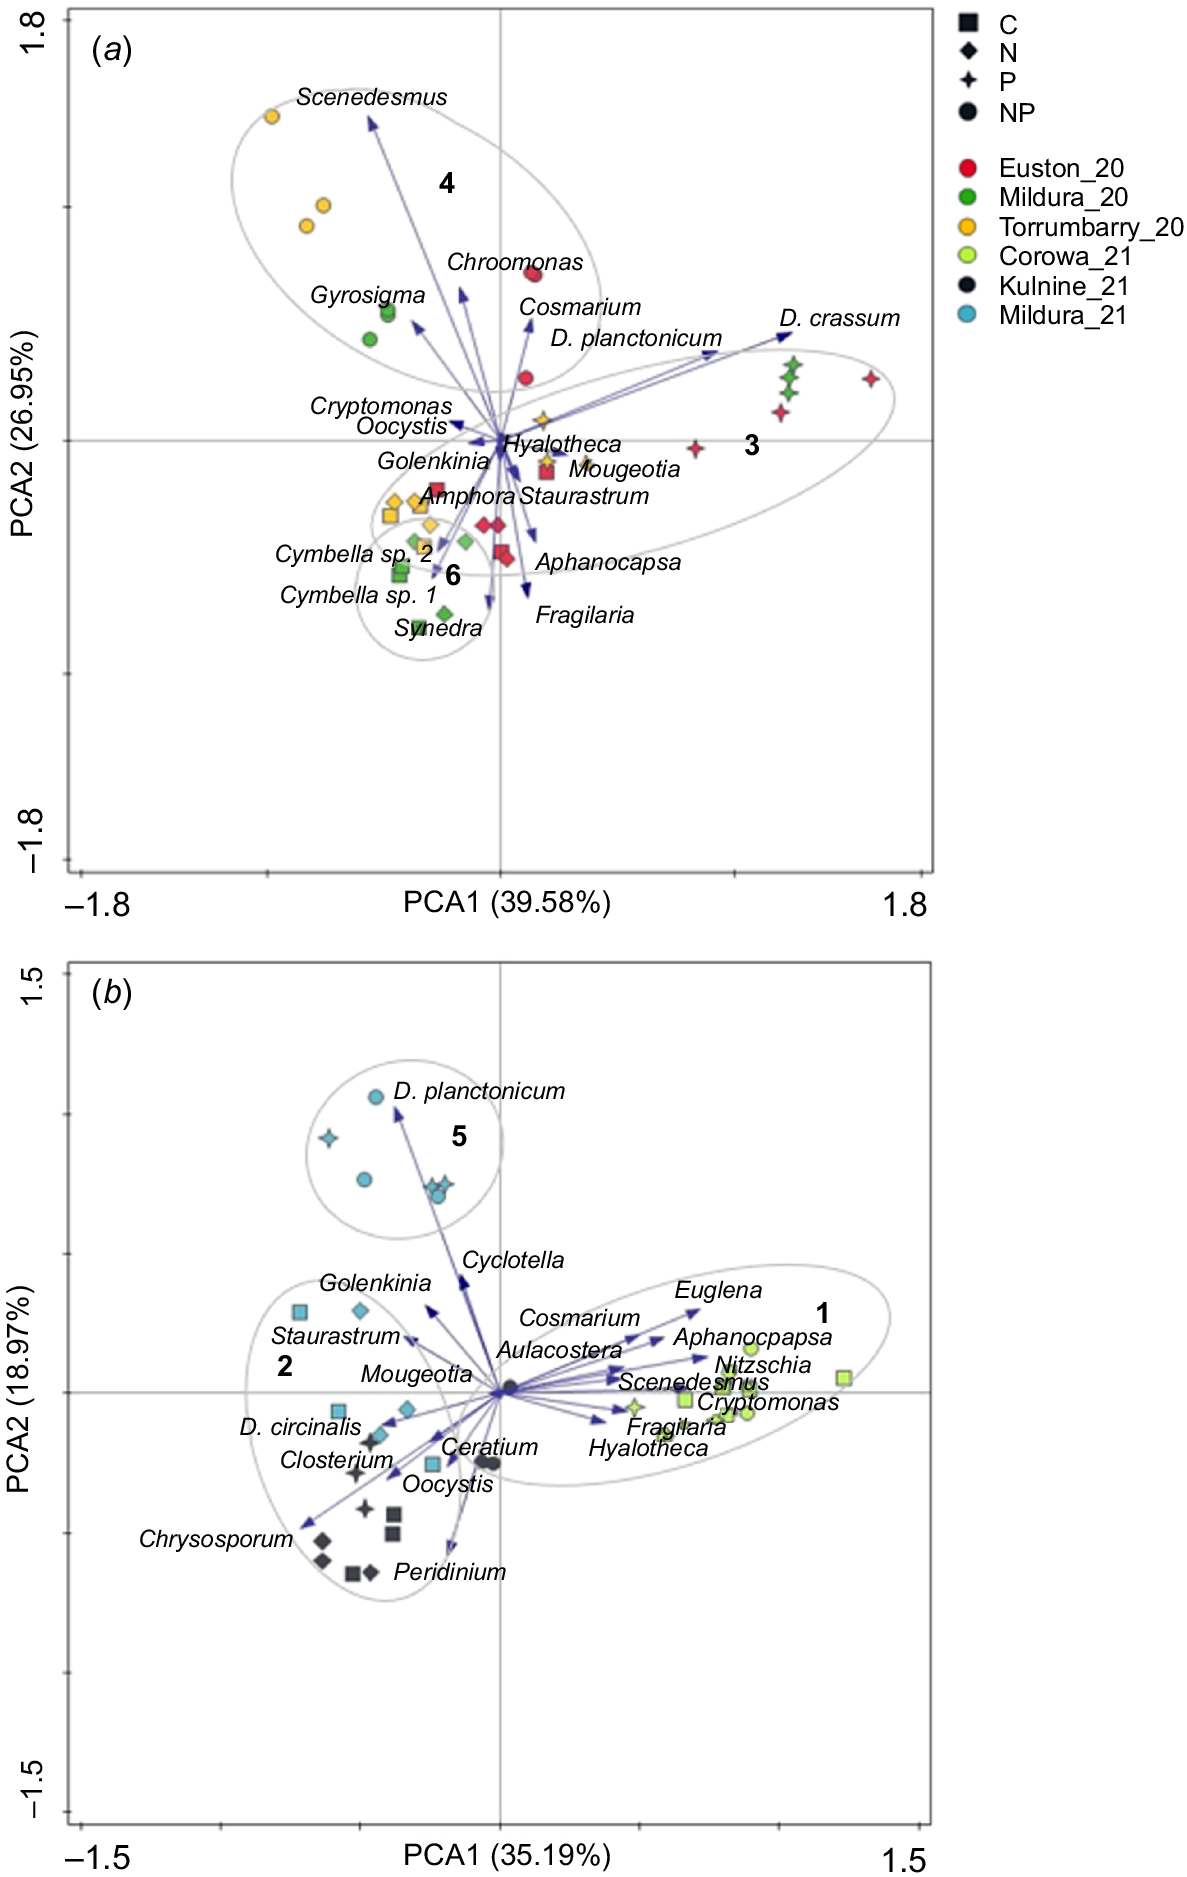
Hierarchical clustering identified six distinct clusters, which further distinguish the community data displayed in the two PCA ordinations (Fig. 7). All clusters were significantly different from each other (PERMANOVA, P = 0.001). There were notable similarities in the NP treatments from Torrumbarry_20, Euston_20 and Mildura_20 (Cluster 4), which had a high proportion of chlorophyta such as Scenesdesmus sp. This cluster was distinct from the other treatments from these sites. For example, Cluster 3 was composed of samples from C, N and P treatments primarily exhibiting co-limitation. Where the community was of lower average total biomass, but greater cyanobacterial biomass (Fig. 5). Similarly, Cluster 6 comprised samples from Mildura_20 and represents a P-limited, low-biomass community with a high diatom biomass and low chlorophyta biomass. Corowa_21, the only non-weir pool site, comprised the majority of the samples in Cluster 1, along with NP treatments at Kulnine_21. This cluster represents a community of high overall biomass, with a mixed community of chlorophyta, diatoms and euglenoids. Cluster 2 was the lowest total biomass and was made up primarily of samples from Kulnine_21 (C, N, P treatments) and Mildura_21 (C and N) and was notably distinct from NP treatments from these sites. Cluster 5 represents high cyanobacterial biomass (D. planctonicum), which occurred when P limitation was alleviated in the Mildura_21 experiment.
Discussion
Along the Murray River, potentially toxic cyanobacterial blooms now occur almost yearly (Scholz et al. 2003; Baldwin et al. 2010; Whiterod and Sherman 2012; Bowling et al. 2013, 2018). It is critical to understand the environmental factors driving these cyanobacterial blooms, as well as determining limiting factors for their growth. Little is known about the role of nutrients in limiting or promoting cyanobacterial blooms and influencing the phytoplankton community structure in this system. Only one previous study has explicitly examined limiting nutrients in the Murray River, but it was conducted over the austral winter period when few cyanobacteria were present (Walker and Hillman 1982). As a result, the influence of nutrient limitation on cyanobacterial dynamics within this system remains a major gap for understanding and potentially managing phytoplankton, and in particular cyanobacterial growth in the Murray River. We found that diazotrophic cyanobacteria were more often limited by P alone, whereas algal groups such as chlorophytes were consistently co-limited. Low ambient dissolved inorganic nitrogen is suggested to favour diazotrophic species over non-diazotrophic species.
Chlorophyll-a and biovolume responses to nutrient additions
At all sites, there was evidence of phytoplankton nutrient limitation on the basis of chlorophyll-a concentrations, indicating that nutrient concentrations play an important role in regulating overall phytoplankton growth. Phosphorus was the key limiting nutrient at Torrumbarry_20, Mildura_20 and Mildura_21, whereas simultaneous co-limitation was evident at Kulnine_21 and Corowa_21. At Euston_20, it was difficult to determine whether the system exhibited serial P limitation or a type of co-limitation (Fig. 3). Total phytoplankton biovolume reflected these trends and was highest in either P or NP treatments at all sites (Supplementary Fig. S1). This indicates that P, and sometimes P with N, are key nutrients limiting total phytoplankton growth in the Murray River, as has been observed globally in other freshwater environments (Schindler 1977; Elser et al. 2007; Harpole et al. 2011; Müller and Mitrovic 2015).
At the beginning of the experiment, ambient concentrations of FRP were low across all sites, with the exception of Kulnine_21, which is influenced by Darling River inflows. NOX concentrations were at levels conducive to nitrogen limitation at all sites (Dolman et al. 2016; Shatwell and Köhler 2019), and were particularly low at Torrumbarry_20, Euston_20 Mildura_20 and Mildura_21 (≤10 μg L−1). At sites with lower NOX availability, the experimental response of chlorophyll-a concentrations were greatest in the NP treatment and were significantly higher than the control, which initially indicates co-limitation of the phytoplankton community (Fig. 3). This finding is supported by Harpole et al. (2011) who proposed that under conditions where concentrations of both N and P are low, phytoplankton growth will typically be limited by both nutrients. Similar findings of co-limitation in nutrient amendment bioassays were documented by Müller and Mitrovic (2015) and Bratt et al. (2020). However, we also found significant increases in chlorophyll-a concentration relative to the control in the P treatments, at Torrumbarry_20 and Mildura_21, although to a lesser extent than in the NP treatments, and with no response in the N treatments. This is indicative of serial limitation, where P is the primary limiting nutrient and N is a secondary limiting nutrient, which takes effect after P limitation is alleviated, suggesting that the community is not truly co-limited at all sites (Harpole et al. 2011).
Interestingly, the cyanobacterial biovolume often had a greater response to additions of P alone relative to the control, such as in Euston_20, Torrumbarry_20 and Mildura_20, than to the combined NP treatment. Whereas chlorophyta were consistently co-limited in weirpool sites. These two community groups regularly made up the majority of the phytoplankton biomass in the experiments, but their different responses to nutrient additions highlight unique nutrient acquisition strategies. The proliferation of cyanobacteria in the P treatments is likely to be due to the prevalence of diazotrophic taxa at the onset of the experiments (Fig. 2a). Diazotrophic cyanobacteria, such as heterocystous taxa of the order Nostocales, can acquire their N demands by using fixation of N2 (Issa et al. 2014). The low ambient concentrations of NOX at these sites may provide beneficial conditions for diazotrophic taxa to outcompete other phytoplankton species (Bradburn et al. 2012; Dolman et al. 2016; Facey et al. 2022). Alleviation of N-limitation by the NP treatment appears to shift the community in favour of other phytoplankton groups.
Growth of D. crassum, a common diazotrophic cyanobacterial species in the Murray River, was highest in the P treatment at Mildura_20, Torrumbarry_20 and Euston_20. The response in the P treatment was notably higher than that in the NP treatment, likely because N demands were met by N2-fixation, providing diazotrophic species with an ecological advantage over other phytoplankton groups. In contrast, when N availability was increased (NP treatment), D. crassum was no longer competitive. Instead, a proliferation of a non-diazotrophic genera such as Scenedesmus occurred (Fig. 7). Similarly, the response of D. planctonicum, another diazotrophic cyanobacteria, followed patterns similar to those of D. crassum in the Mildura_20 and Torrumbarry_20 experiments, with the greatest growth response occurring in the P treatment. The affinity of D. crassum and D. planctonicum to available P was confirmed by the PCA, which showed a strong relationship with the two Dolichospermum species in the Torrumbarry_20, Euston_20, Mildura_20 and Mildura_21 experiments. This suggests that Dolichospermum spp. will not be competitive when there is high dissolved inorganic-N availability, but can utilise P pulses under N-limiting conditions. This is consistent with previous studies that have found that Dolichospermum spp. improve fitness under N-limited conditions (Dolman et al. 2012; Moisander et al. 2012; González-Madina et al. 2019), even compared with other N2-fixing taxa (De Nobel et al. 1998; Yema et al. 2018; Grover et al. 2020), whereas other diazotrophic taxa are stronger competitors for dissolved forms of N (Ferber et al. 2004).
At the Corowa_21 and Kulnine_21 sites, the conditions at the onset of the experiments were characterised by higher availability of dissolved inorganic N, albeit at concentrations still likely to illicit some growth limitations (Kolzau et al. 2018). This resulted in notable differences in the community responses compared with the other sites. At Corowa_21, nutrients released from Hume Dam were likely to drive the elevated ambient nutrient concentrations (Rogers 2023), perhaps in combination with less denitrification occurring in the upstream, riverine environment where conditions were likely to be well mixed and oxic. This, in combination with increased flow velocity, may explain the low Nostocales biovolume on Day 0 of the experiment. As a result of these factors, total cyanobacterial biomass as well as individual species did not respond to any of the nutrient treatments. However, the overall phytoplankton biomass (as total biovolume and chlorophyll-a) was greater in the NP treatment than in the control and was driven predominantly by chlorophyta. Similarly, at Kulnine_21, cyanobacteria did not increase in response to any nutrient treatments. However, chlorophyta and diatoms were strongly co-limited and made up a large proportion of the community in the NP treatment.
It is surprising then that cyanobacteria as a group did not respond to the P treatments, particularly given the large initial inoculum of heterocyst bearing C. ovalisporum and D. planctonicum at Kulnine_21 and Mildura_21 (Fig. 2b). Despite the lack of response from other co-limited groups such as chlorophyta and diatoms, neither C. ovalisporum nor D. planctonicum responded to the P pulse. In experiments at other sites, D. planctonicum appeared to utilise N-limited, P-replete conditions to gain a competitive advantage over non-N fixing taxa. The lack of response to similar conditions at Kulnine_21 may have been due to the Kulnine_21 experiment taking place later in the year than the experiments in which D. planctonicum was successful, resulting in a seasonal or temperature effect, relating to the high light and energetic requirements of heterocyst production (De Nobel et al. 1998; Fu and Bell 2003). Whereas the negative response of C. ovalisporum to P additions, and the greater biomass in C and N treatments than in P, may indicate that C. ovalisporum occupies a different niche or utilises different strategies in response to nutrient limitation or may have different thresholds at which N2-fixation is promoted. The optimum phytoplankton N:P varies among genera, becaus nutrient requirements are based on physiological conditions, the habitats in which the taxa evolved and specific acquisition strategies (De Nobel et al. 1998; Osburn et al. 2021; Wagner et al. 2023).
Hierarchical cluster analysis identified six distinct clusters, providing insights into common trends among treatments and sites (Fig. 7). The differentiation of these clusters and the associated conditions and dominant taxa provide a clear illustration of the effect of nutrient concentration on community structure. Cluster 4 comprised only samples from NP treatments at sites with particularly low ambient nutrient concentrations (Torrumbarry_20, Euston_20, Mildura_20). This cluster represents the ‘first responders’, which can rapidly respond to a nutrient pulse such as the chlorophyta Scenesdesmus sp. and picocyanobacteria such as Aphanocapsa sp. (Ma et al. 2015; Müller and Mitrovic 2015; Facey et al. 2022). This cluster was distinct from the other treatments at these sites. For example, Cluster 3 contained samples from C, N and P treatments in which chlorophyta were co-limited. The community was of lower average total biomass, but greater cyanobacterial biomass than was Cluster 4. This further demonstrated that N-fixing cyanobacteria are more effective competitors in co-limited systems and typically reduce in biomass following addition of N and P. Reinforcing this, Cluster 1 is representative of high N and P availability. Corowa_21 had the highest ambient NOX concentrations and comprised the majority of the samples in Cluster 1 along with Kulnine_21 NP. These conditions are associated with a high biomass, diverse community of chlorophyta, diatoms and euglenoids and, notably, the lowest concentration of cyanobacteria. This diversity includes species that typically dominate in nutrient-enriched or riverine systems (Padisák et al. 2009). Using hierarchical cluster analysis to examine commonalities among treatments and sites under differing nutrient conditions represents a reasonably novel and underutilised approach in riverine settings.
Management of nutrients in the Murray River
Chlorophyta and cyanobacteria were the two most dominant phytoplankton groups in the Murray River during this study. Chlorophyta were consistently co-limited by N and P at all sites, indicating that management of either N or P inputs could reduce overall phytoplankton biomass. However, cyanobacteria were commonly limited by P alone. Owing to the positive relationship between cyanobacterial growth and P concentrations, coupled with low ambient dissolved inorganic N and the high ambient abundance of diazotrophic cyanobacteria, the data from this study suggest that P reductions would be the most effective strategy for reducing the occurrence of the regular blooms of diazotrophic cyanobacteria in the Murray River, while also reducing other dominant phytoplankton groups. These results are consistent with findings of Schindler et al. (2008) and Higgins et al. (2018) who observed that reducing N inputs favoured diazotrophic cyanobacterial growth. However, although they have proposed that N2-fixation can entirely compensate for external N reductions, many proponents of managing both N and P argue that the high energetic cost of N2-fixation and its dependence on the sufficient availability of additional parameters such as light and P, will reduce the magnitude of blooms when growth is reliant on N2-fixation (De Nobel et al. 1997; Agawin et al. 2007; Paerl et al. 2011; Shatwell and Köhler 2019; Grover et al. 2022). Therefore, we cannot exclude the possibility that N reductions would also effectively reduce cyanobacterial biomass to some extent, but would likely exacerbate the competitive advantage of diazotrophic cyanobacteria if not undertaken in combination with P.
Data availability
All data associated with this study will be made available upon request to the corresponding author.
Conflicts of interest
Simon Mitrovic is an Associate Editor of Marine and Freshwater Research. Despite this relationship, he took no part in the review and acceptance of this manuscript, in line with the publishing policy. The authors declare that they have no further conflicts of interest.
Declaration of funding
This work was funded by the Murray–Darling Basin Authority under the Project MD004730: Flow and Stratification based Algal Bloom Prediction Model for the Murray River, with funding received by Prof. Simon Mitrovic.
Acknowledgements
We gratefully appreciate the support and advice of Craig Hardge and Mike Ridley from the Murray–Darling Basin Authority. The authors also thank the Freshwater and Estuarine Research Group from UTS for their contributions and support in the field, in particular, Anne Colville, Patrick McSweeney and Callan Cutcliffe. We also thank Laura Mitchie, Matthew Balzer and Andrew Rogers for their help in the field. This paper forms part of the MRes thesis of Rogers (2023). The view and conclusions expressed in this study are those of the authors and do not necessarily represent the official policy, either expressed or implied of the respective organisations.
References
Agawin NSR, Rabouille S, Veldhuis MJW, Servatius L, Hol S, Van Overzee HMJ, Huisman J (2007) Competition and facilitation between unicellular nitrogen-fixing cyanobacteria and non-nitrogen-fixing phytoplankton species. Limnology and Oceanography 52, 2233-2248.
| Crossref | Google Scholar |
Al-Tebrineh J, Merrick C, Ryan D, Humpage A, Bowling L, Neilan BA (2012) Community composition, toxigenicity, and environmental conditions during a cyanobacterial bloom occurring along 1,100 kilometers of the Murray River. Applied and Environmental Microbiology 78, 263-272.
| Crossref | Google Scholar |
Anderson MJ (2001) A new method for non-parametric multivariate analysis of variance. Austral Ecology 26, 32-46.
| Crossref | Google Scholar |
Baldwin DS, Wilson J, Gigney H, Boulding A (2010) Influence of extreme drawdown on water quality downstream of a large water storage reservoir. River Research and Applications 26, 194-206.
| Crossref | Google Scholar |
Bormans M, Ford PW, Fabbro L, Hancock G (2004) Onset and persistence of cyanobacterial blooms in a large impounded tropical river, Australia. Marine and Freshwater Research 55, 1-15.
| Crossref | Google Scholar |
Bowling LC, Merrick C, Swann J, Green D, Smith G, Neilan BA (2013) Effects of hydrology and river management on the distribution, abundance and persistence of cyanobacterial blooms in the Murray River, Australia. Harmful Algae 30, 27-36.
| Crossref | Google Scholar |
Bowling L, Baldwin D, Merrick C, Brayan J, Panther J (2018) Possible drivers of a Chrysosporum ovalisporum bloom in the Murray River, Australia, in 2016. Marine and Freshwater Research 69, 1649-1662.
| Crossref | Google Scholar |
Bradburn MJ, Lewis WM, Jr, McCutchan JH, Jr (2012) Comparative adaptations of Aphanizomenon and Anabaena for nitrogen fixation under weak irradiance. Freshwater Biology 57(5), 1042-1049.
| Crossref | Google Scholar |
Bratt AR, Finlay JC, Welter JR, Vculek BA, Van Allen RE (2020) Co-limitation by N and P characterizes phytoplankton communities across nutrient availability and land use. Ecosystems 23, 1121-1137.
| Crossref | Google Scholar |
Carey CC, Ibelings BW, Hoffmann EP, Hamilton DP, Brookes JD (2012) Eco-physiological adaptations that favour freshwater cyanobacteria in a changing climate. Water Research 46, 1394-1407.
| Crossref | Google Scholar |
Carmichael WW (1992) Cyanobacteria secondary metabolites – the cyanotoxins. Journal of Applied Bacteriology 72, 445-459.
| Crossref | Google Scholar | PubMed |
Carmichael WW (2001) Health effects of toxin-producing cyanobacteria: ‘The CyanoHABs’. Human and Ecological Risk Assessment: An International Journal 7, 1393-1407.
| Crossref | Google Scholar |
Cassardo C, Jones JAA (2011) Managing water in a changing world. Water 3, 618-628.
| Crossref | Google Scholar |
Davis JR, Koop K (2006) Eutrophication in Australian rivers, reservoirs and estuaries – a southern hemisphere perspective on the science and its implications. Hydrobiologia 559, 23-76.
| Crossref | Google Scholar |
de la Cruz A, Antoniou MG, Hiskia A, Pelaez M, Song W, O’Shea KE, He X, Dionysiou DD (2011) Can we effectively degrade microcystins? Implications on human health. Anti-Cancer Agents in Medicinal Chemistry 11, 19-37.
| Crossref | Google Scholar | PubMed |
De Nobel WTP, Huisman J, Snoep JL, Mur LR (1997) Competition for phosphorus between the nitrogen-fixing cyanobacteria Anabaena and Aphanizomenon. FEMS Microbiology Ecology 24, 259-267.
| Crossref | Google Scholar |
De Nobel WT, Matthijs HCP, Von Elert E, Mur LR (1998) Comparison of the light-limited growth of the nitrogen-fixing cyanobacteria Anabaena and Aphanizomenon. New Phytologist 138, 579-587.
| Crossref | Google Scholar |
De Tezanos Pinto P, Litchman E (2010) Interactive effects of N:P ratios and light on nitrogen-fixer abundance. Oikos 119, 567-575.
| Crossref | Google Scholar |
Dolman AM, Rücker J, Pick FR, Fastner J, Rohrlack T, Mischke U, Wiedner C (2012) Cyanobacteria and cyanotoxins: the influence of nitrogen versus phosphorus. PLoS ONE 7, e38757.
| Crossref | Google Scholar |
Dolman AM, Mischke U, Wiedner C (2016) Lake-type-specific seasonal patterns of nutrient limitation in German lakes, with target nitrogen and phosphorus concentrations for good ecological status. Freshwater Biology 61, 444-456.
| Crossref | Google Scholar |
Dudgeon D (2019) Multiple threats imperil freshwater biodiversity in the Anthropocene. Current Biology 29, R960-R967.
| Crossref | Google Scholar | PubMed |
Elser JJ, Bracken MES, Cleland EE, Gruner DS, Harpole WS, Hillebrand H, Ngai JT, Seabloom EW, et al. (2007) Global analysis of nitrogen and phosphorus limitation of primary producers in freshwater, marine and terrestrial ecosystems. Ecology Letters 10, 1135-1142.
| Crossref | Google Scholar |
Facey JA, Rogers TA, Apte SC, Mitrovic SM (2021) Micronutrients as growth limiting factors in cyanobacterial blooms; a survey of freshwaters in South East Australia. Aquatic Sciences 83, 28.
| Crossref | Google Scholar |
Facey JA, Michie LE, King JJ, Hitchcock JN, Apte SC, Mitrovic SM (2022) Severe cyanobacterial blooms in an Australian lake; causes and factors controlling succession patterns. Harmful Algae 117, 102284.
| Crossref | Google Scholar |
Ferber LR, Levine SN, Lini A, Livingston GP (2004) Do cyanobacteria dominate in eutrophic lakes because they fix atmospheric nitrogen? Freshwater Biology 49, 690-708.
| Crossref | Google Scholar |
Frost PC, Pearce NJT, Berger SA, Gessner MO, Makower AK, Marzetz V, Nejstgaard JC, Pralle A, et al. (2023) Interactive effects of nitrogen and phosphorus on growth and stoichiometry of lake phytoplankton. Limnology and Oceanography 68, 1172-1184.
| Crossref | Google Scholar |
Fu F-X, Bell PRF (2003) Factors affecting N2 fixation by the cyanobacterium Trichodesmium sp. GBRTRLI101. FEMS Microbiology Ecology 45, 203-209.
| Crossref | Google Scholar |
Furst D, Aldridge K, Bice C, Zampatti B, Ye Q (2019) The influence of longitudinal hydrological connectivity on resource availability and lower order food web structure in the Murray River. A report to the Commonwealth Environmental Water Office. (CEWO) Available at https://www.dcceew.gov.au/water/cewo/publications/influence-longitudinal-hydrological-connectivity-murray-river
González-Madina L, Pacheco JP, Yema L, de Tezanos P, Levrini P, Clemente J, Crisci C, Lagomarsino JJ, et al. (2019) Drivers of cyanobacteria dominance, composition and nitrogen fixing behavior in a shallow lake with alternative regimes in time and space, Laguna del Sauce (Maldonado, Uruguay). Hydrobiologia 829, 61-76.
| Crossref | Google Scholar |
Grover JP, Scott JT, Roelke DL, Brooks BW (2020) Dynamics of nitrogen-fixing cyanobacteria with heterocysts: a stoichiometric model. Marine and Freshwater Research 71, 644-658.
| Crossref | Google Scholar |
Grover JP, Scott JT, Roelke DL, Brooks BW (2022) Competitive superiority of N-fixing cyanobacteria when fixed N is scarce: reconsiderations based on a model with heterocyst differentiation. Ecological Modelling 466, 109904.
| Crossref | Google Scholar |
Harpole WS, Ngai JT, Cleland EE, Seabloom EW, Borer ET, Bracken MES, Elser JJ, Gruner DS, et al. (2011) Nutrient co-limitation of primary producer communities. Ecology Letters 14, 852-862.
| Crossref | Google Scholar |
Harris GP (2001) Biogeochemistry of nitrogen and phosphorus in Australian catchments, rivers and estuaries: effects of land use and flow regulation and comparisons with global patterns. Marine and Freshwater Research 52, 139-149.
| Crossref | Google Scholar |
Higgins SN, Paterson MJ, Hecky RE, Schindler DW, Venkiteswaran JJ, Findlay DL (2018) Biological nitrogen fixation prevents the response of a eutrophic lake to reduced loading of nitrogen: evidence from a 46-year whole-lake experiment. Ecosystems 21, 1088-1100.
| Crossref | Google Scholar |
Holmroos H, Hietanen S, Niemistö J, Horppila J (2012) Sediment resuspension and denitrification affect the nitrogen to phosphorus ratio of shallow lake waters. Fundamental and Applied Limnology 180, 193-205.
| Crossref | Google Scholar |
Hosomi M, Sudo R (1986) Simultaneous determination of total nitrogen and total phosphorus in freshwater samples using persulfate digestion. International Journal of Environmental Studies 27, 267-275.
| Crossref | Google Scholar |
Issa AA, Abd-Alla MH, Ohyam T (2014) Nitrogen fixing cyanobacteria: future prospect. In ‘Advances in biology and ecology of nitrogen fixation’. pp. 23–48. (InTech) 10.5772/56995
Jung SW, Kwon OY, Yun SM, Joo HM, Kang J-H, Lee JH (2014) Impacts of dam discharge on river environments and phytoplankton communities in a regulated river system, the lower Han River of South Korea. Journal of Ecology and Environment 37, 1-11.
| Crossref | Google Scholar |
Kolzau S, Dolman AM, Voss M, Wiedner C (2018) The response of nitrogen fixing cyanobacteria to a reduction in nitrogen loading. International Review of Hydrobiology 103, 5-14.
| Crossref | Google Scholar |
Kramer BJ, Jankowiak JG, Nanjappa D, Harke MJ, Gobler CJ (2022) Nitrogen and phosphorus significantly alter growth, nitrogen fixation, anatoxin-a content, and the transcriptome of the bloom-forming cyanobacterium, Dolichospermum. Frontiers in Microbiology 13, 955032.
| Crossref | Google Scholar |
Krogmann DW, Butalla R, Sprinkle J (1986) Blooms of cyanobacteria on the Potomac river. Plant Physiology 80, 667-671.
| Crossref | Google Scholar |
Ma J, Qin B, Paerl HW, Brookes JD, Wu P, Zhou J, Deng J, Guo J, et al. (2015) Green algal over cyanobacterial dominance promoted with nitrogen and phosphorus additions in a mesocosm study at Lake Taihu, China. Environmental Science and Pollution Research 22, 5041-5049.
| Crossref | Google Scholar | PubMed |
McCarthy MJ, James RT, Chen Y, East TL, Gardner WS (2009) Nutrient ratios and phytoplankton community structure in the large, shallow, eutrophic, subtropical Lakes Okeechobee (Florida, USA) and Taihu (China). Limnology 10, 215-227.
| Crossref | Google Scholar |
Mitrovic SM, Hardwick L, Dorani F (2011) Use of flow management to mitigate cyanobacterial blooms in the Lower Darling River, Australia. Journal of Plankton Research 33, 229-241.
| Crossref | Google Scholar |
Moisander PH, Cheshire LA, Braddy J, Calandrino ES, Hoffman M, Piehler MF, Paerl HW (2012) Facultative diazotrophy increases Cylindrospermopsis raciborskii competitiveness under fluctuating nitrogen availability. FEMS Microbiology Ecology 79, 800-811.
| Crossref | Google Scholar |
Mowe MAD, Mitrovic SM, Lim RP, Furey A, Yeo DCJ (2015) Tropical cyanobacterial blooms: a review of prevalence, problem taxa, toxins and influencing environmental factors. Journal of Limnology 74, 205-224.
| Crossref | Google Scholar |
Müller S, Mitrovic SM (2015) Phytoplankton co-limitation by nitrogen and phosphorus in a shallow reservoir: progressing from the phosphorus limitation paradigm. Hydrobiologia 744, 255-269.
| Crossref | Google Scholar |
Murphy J, Riley JP (1962) A modified single solution method for the determination of phosphate in natural waters. Analytica Chimica Acta 27, 31-36.
| Crossref | Google Scholar |
Osburn FS, Wagner ND, Scott JT (2021) Biological stoichiometry and growth dynamics of a diazotrophic cyanobacteria in nitrogen sufficient and deficient conditions. Harmful Algae 103, 102011.
| Crossref | Google Scholar |
Padisák J, Crossetti LO, Naselli-Flores L (2009) Use and misuse in the application of the phytoplankton functional classification: a critical review with updates. Hydrobiologia 621, 1-19.
| Crossref | Google Scholar |
Paerl H (2008) Nutrient and other environmental controls of harmful cyanobacterial blooms along the freshwater–marine continuum. In ‘Cyanobacterial harmful algal blooms: state of the science and research needs. Advances in Experimental Medicine and Biology, Vol. 619’. (Ed. HK Hudnell) pp. 217–237. (Springer) doi:10.1007/978-0-387-75865-7_10
Paerl HW, Otten TG (2013) Harmful cyanobacterial blooms: causes, consequences, and controls. Microbial Ecology 65, 995-1010.
| Crossref | Google Scholar |
Paerl HW, Hall NS, Calandrino ES (2011) Controlling harmful cyanobacterial blooms in a world experiencing anthropogenic and climatic-induced change. Science of The Total Environment 409, 1739-1745.
| Crossref | Google Scholar | PubMed |
Paerl HW, Havens KE, Xu H, Zhu G, McCarthy MJ, Newell SE, Scott JT, Hall NS, et al. (2020) Mitigating eutrophication and toxic cyanobacterial blooms in large lakes: the evolution of a dual nutrient (N and P) reduction paradigm. Hydrobiologia 847, 4359-4375.
| Crossref | Google Scholar |
Pilotto LS, Douglas RM, Burch MD, Cameron S, Beers M, Rouch GJ, Robinson P, Kirk M, et al. (1997) Health effects of exposure to cyanobacteria (blue-green algae) during recreational water-related activities. Australian and New Zealand Journal of Public Health 21, 562-566.
| Crossref | Google Scholar | PubMed |
Schindler DW (1977) Evolution of phosphorus limitation in lakes. Science 195, 260-262.
| Crossref | Google Scholar | PubMed |
Schindler DW, Hecky RE, Findlay DL, Stainton MP, Parker BR, Paterson MJ, Beaty KG, Lyng M, et al. (2008) Eutrophication of lakes cannot be controlled by reducing nitrogen input: results of a 37-year whole-ecosystem experiment. Proceedings of the National Academy of Sciences of the United States of America 105, 11254-11258.
| Crossref | Google Scholar |
Schindler DW, Carpenter SR, Chapra SC, Hecky RE, Orihel DM (2016) Reducing phosphorus to curb lake eutrophication is a success. Environmental Science & Technology 50, 8923-8929.
| Crossref | Google Scholar |
Seitzinger S, Harrison JA, Böhlke JK, Bouwman AF, Lowrance R, Peterson B, Tobias C, Drecht GV (2006) Denitrification across landscapes and waterscapes: a synthesis. Ecological Applications 16, 2064-2090.
| Crossref | Google Scholar | PubMed |
Shatwell T, Köhler J (2019) Decreased nitrogen loading controls summer cyanobacterial blooms without promoting nitrogen-fixing taxa: long-term response of a shallow lake. Limnology and Oceanography 64, S166-S178.
| Crossref | Google Scholar |
Sperfeld E, Raubenheimer D, Wacker A (2016) Bridging factorial and gradient concepts of resource co-limitation: towards a general framework applied to consumers. Ecology Letters 19, 201-215.
| Crossref | Google Scholar |
Syakur MA, Khotimah BK, Rochman EMS, Satoto BD (2018) Integration K-means clustering method and elbow method for identification of the best customer profile cluster. IOP Conference Series: Materials Science and Engineering 336, 012017.
| Crossref | Google Scholar |
Testai E, Scardala S, Vichi S, Buratti FM, Funari E (2016) Risk to human health associated with the environmental occurrence of cyanobacterial neurotoxic alkaloids anatoxins and saxitoxins. Critical Reviews in Toxicology 46, 385-419.
| Crossref | Google Scholar |
Velthuis M, Veraart AJ (2022) Temperature sensitivity of freshwater denitrification and N2O emission – a meta-analysis. Global Biogeochemical Cycles 36, e2022GB007339.
| Crossref | Google Scholar |
Wagner ND, Osburn FS, Taylor RB, Back JA, Chambliss CK, Brooks BW, Scott JT (2023) Diazotrophy modulates cyanobacteria stoichiometry through functional traits that determine bloom magnitude and toxin production. Limnology and Oceanography 68, 348-360.
| Crossref | Google Scholar |
Walker KF, Hillman TJ (1982) Phosphorus and nitrogen loads in waters associated with the river murray near Albury–Wodonga, and their effects on phytoplankton populations. Marine and Freshwater Research 33, 223-243.
| Crossref | Google Scholar |
Whiterod N, Sherman B (2012) Environmental gradients along a lowland weir pool in the southern Murray–Darling Basin, Australia. River Research and Applications 28, 1680-1694.
| Crossref | Google Scholar |
Wurtsbaugh WA, Paerl HW, Dodds WK (2019) Nutrients, eutrophication and harmful algal blooms along the freshwater to marine continuum. WIREs Water 6, e1373.
| Crossref | Google Scholar |
Yema L, Kremer CT, O’Farrell I, de Tezanos Pinto P (2018) Assessing patterns of morphological and physiological trait variations across heterocytous cyanobacteria at cellular and population levels. Hydrobiologia 823, 93-107.
| Crossref | Google Scholar |