

The seafloor character of the Roman Rock area in False Bay, South Africa
Andrew Terhorst A * and John Rogers B
A
B
Abstract
This study investigates the seafloor character of a 12-km2 area off Simon’s Town in False Bay, South Africa.
The goal was to map the seafloor geology around Roman Rock Lighthouse, focusing on sedimentology.
Side-scan sonar and single-beam echosounder were used, complemented by sediment sampling and diver observations for ground-truthing. Sediment samples were analysed for texture and composition.
Six patterns of reflectivity (acoustic facies) were identified, including granite outcrops, wave ripples, and patches of gravelly and quartzose sands. Sediment analysis showed a mix of calcareous and quartzose components, with calcareous material dominating the gravel fraction near granite outcrops.
The Roman Rock seafloor reflects a complex depositional environment shaped by biogenic activity and wave-induced sediment transport.
This research lays the groundwork for future geological studies in False Bay, particularly around wave-induced sediment dynamics.
Keywords: diver observations, echosounder, False Bay, marine geology, Roman Rock, seafloor mapping, sedimentology, side-scan sonar, South Africa.
Introduction
Numerous geological studies have been conducted in False Bay, offering a comprehensive understanding of the region. Research covering the entire bay includes works by Morgans (1956), Bowie (1966), Simpson et al. (1970), Gentle (1971, 1973), Glass (1977, 1980), Flemming (1982, 2024) and Du Plessis and Glass (1991). Other studies have focused on specific areas within False Bay: Retief’s (1970) research focused on sediment transport patterns in Gordon’s Bay. Flemming (1976a) explored the evolution of Rocky Bank at the entrance to False Bay. Erosion of the northern shoreline, particularly around Strandfontein and Monwabisi Beach, has been studied by Schoonees et al. (1983), Theron and Schoonees (2007), Fourie et al. (2015) and MacHutchon (2015). Van Zyl (2011) documented a side-scan sonar survey along the western shore that forms part of the Table Mountain Marine Protected Area.
This paper revisits and updates an earlier, unpublished study (Terhorst 1988) of the seafloor geology around the Roman Rock lighthouse off Simon’s Town, False Bay, South Africa. The initial investigation employed side-scan sonar and single-beam echosounder technologies to map the seafloor geology of the area, complemented by grab samples and diver inspections to validate the sonar interpretations. This localised study, originally commissioned by the Institute for Maritime Technology (IMT) on behalf of the South African Navy Hydrographic Office, stands out as one of the more detailed geological explorations in False Bay. This revision summarises the foundational work and re-examines its conclusions by using recent geological and physical oceanographic data, providing a contemporary perspective on the findings.
Recognising that technological advancements can reshape marine survey methodologies, this paper argues for the enduring value of earlier techniques when applied thoughtfully and supplemented with new information. Flemming (2024) highlighted the importance of such legacy datasets, framing them as essential baselines for future comparative studies and integrated environmental management. Similar efforts on the South African eastern coast by Manikam et al. (2022, 2024) demonstrated the value of revisiting and republishing historical seafloor datasets to inform ongoing research and marine conservation efforts. By bridging the gap between past and present investigations, we aim to renew interest in the seafloor geology of False Bay, especially off Simon’s Town, and underline the importance of continuous exploration in marine science.
Physical setting
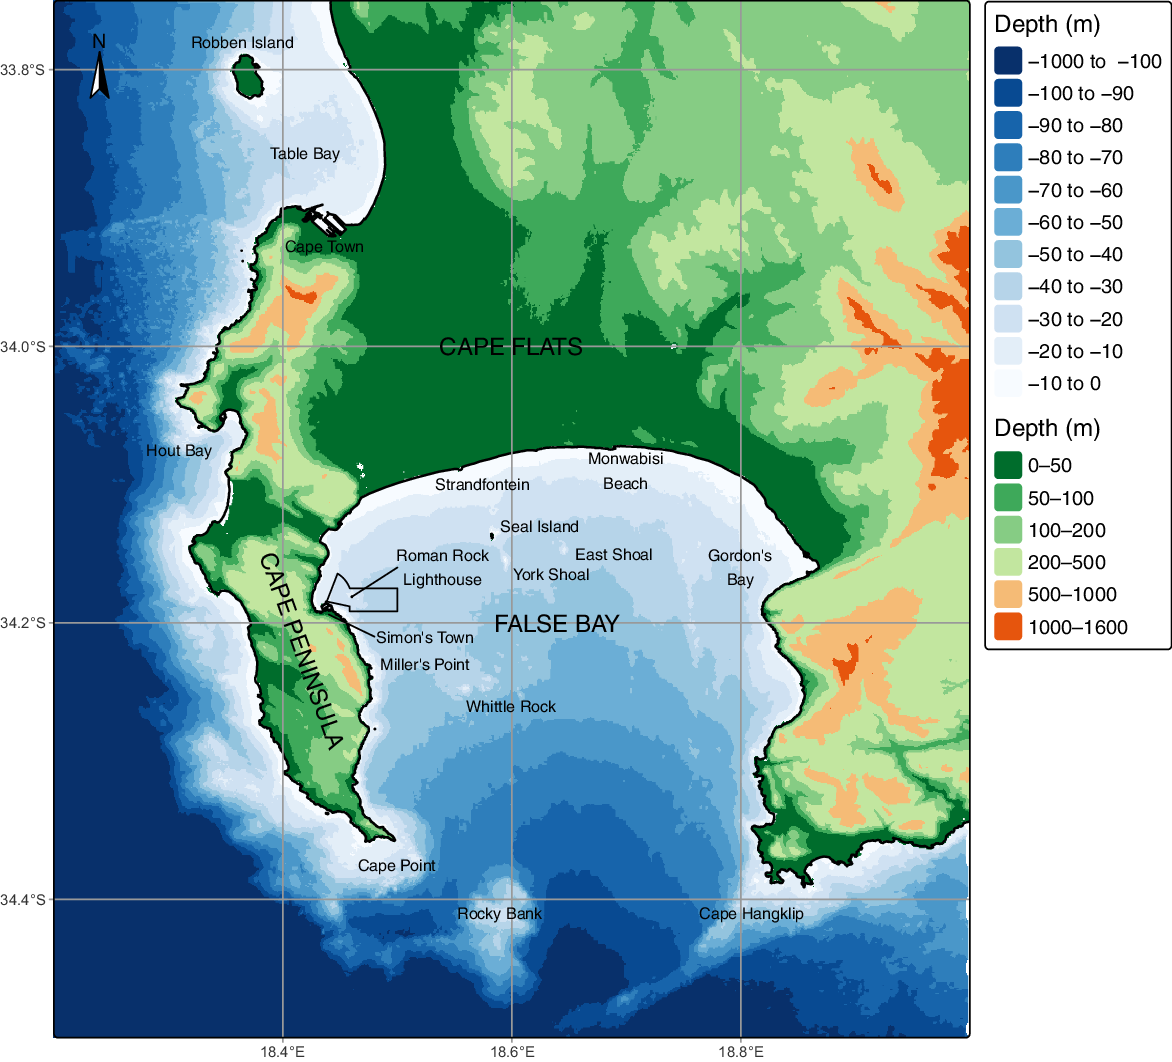
False Bay is the southward extension of a broad sandy valley known as the ‘Cape Flats’, situated between the mountainous Cape Peninsula to the west and the Hottentots-Holland Mountains to the east (Fig. 1). The seafloor within the bay slopes gently toward the south, reaching a depth of over 85 m between Cape Point and Cape Hangklip (Mallory 1970; Du Plessis and Glass 1991; Rogers 2018). Apart from rock pinnacles and reefs around Roman Rock, Seal Island, York Shoal, East Shoal and Whittle Rock, the seafloor in the western and southern parts of the Bay is relatively smooth, unlike the seafloor in the eastern part, which is more irregular (Du Plessis and Glass 1991).
Location of the study area off Simon’s Town in the north-western corner of False Bay, South Africa. Roman Rock lighthouse sits at the centre of the study area. Steep mountains significantly influence the wind regime across False Bay. Rocky Bank, at the entrance to the bay, focuses the energy of long-period swells entering from the south and south-west. Bathymetry provided by the Council for Geoscience.
Geology
The geology of False Bay is inferred from onshore geological maps, hand-contoured hydrographic survey fair-charts, dredge and grab samples, and from magnetometer, shallow seismic and side-scan sonar traverses (Du Plessis and Glass 1991; Flemming 2024).
Cambrian (c. 540 million years ago, Ma) Cape Granite Suite underlies the western half of False Bay. The Cape Granite Suite intrudes the Cambrian (c. 560 Ma) Malmesbury Group shale that underlies the eastern half of False Bay (Gentle 1973; Belcher and Kisters 2003; Scheepers and Schoch 2006). The Ordovician Table Mountain Group sandstone (c. 440–485 Ma) overlies the Cape Granite Suite and Malmesbury Group. The erosion-resistant quartzose sandstone forms the steep mountainous terrain flanking the western and eastern sides of False Bay (Theron 1984).
The granite outcrops along the coast south of Simon’s Town tend to be blocky and well-jointed with deep weathering in places (Rogers 2018, pp. 253–274). Seismic profiles show that False Bay’s granite is deeply weathered in places (Glass 1977). Joint spacing probably controls the depth of weathering; the closer the spacing is, the deeper is the weathering (Linton 1955). Granite outcrops are more likely to occur where joints are more widely spaced.
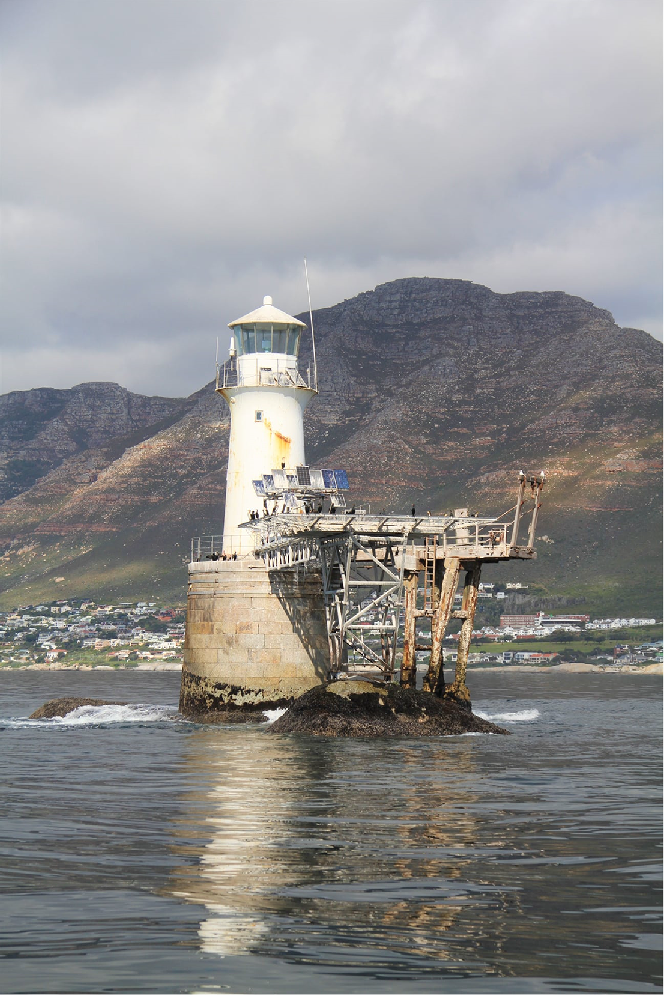
Roman Rock lighthouse, situated in the middle of the study area, is built on top of a large granite pinnacle that protrudes above the sea surface (Fig. 2). South of Simon’s Town, the unconformity between the Cape Granite Suite and the Table Mountain Group is ~100 m above the current sea level (viz. Rogers 2018, p. 64). The unconformity dips below sea level north of Simon’s Town, suggesting that the bedrock in the north-western corner of the study area is likely to be part of the Table Mountain Group (Gentle 1971).
Roman Rock lighthouse, December 2022. The cast-iron lighthouse was built in 1861 on top of a granite reef that protrudes above the sea surface at low tide. Note the north-facing solar panels that power the lighthouse. Simon’s Town appears in the background at the base of the 678 m high Swartberg Mountain. Image credit: Andrew Morson.
The Cape Granite Suite and the lower parts of the Table Mountain Group have been intruded by a swarm of dolerite dykes (Haughton 1933). The dyke swarm dates to the Early Cretaceous and is thought to be associated with the opening of the South Atlantic (Backeberg et al. 2011). Magnetometer data indicate the presence of a large west-north-west (WNW)–east-south-east (ESE) trending dolerite dyke in the Cape Granite Suite beneath the study area (Simpson et al. 1970).
Much of the seafloor in the western half of False Bay is covered by sediment, unlike the seafloor in the eastern half of the bay, which is mostly exposed Malmesbury Group (Tygerberg Formation) siltstone (Du Plessis and Glass 1991). Shallow seismic profiles indicate that the unconsolidated sediment is more than 10 m thick in the middle of False Bay. However, it is less than 2 m thick in the study area (Du Plessis and Glass 1991). Flemming (1982) analysed 185 sediment samples collected in False Bay by Bowie (1966) and Glass (1980). Four of these samples were collected within the study area. The unconsolidated sediment is mostly fine to medium sand, except around granite outcrops, which are composed of coarse bioclastic material. According to Flemming (2024), bottom traction is the primary sediment movement mechanism around Roman Rock. In the deeper eastern part and along the more sheltered parts of the study area, the primary mechanism for sediment movement is lower-bottom suspension.
Physical oceanography
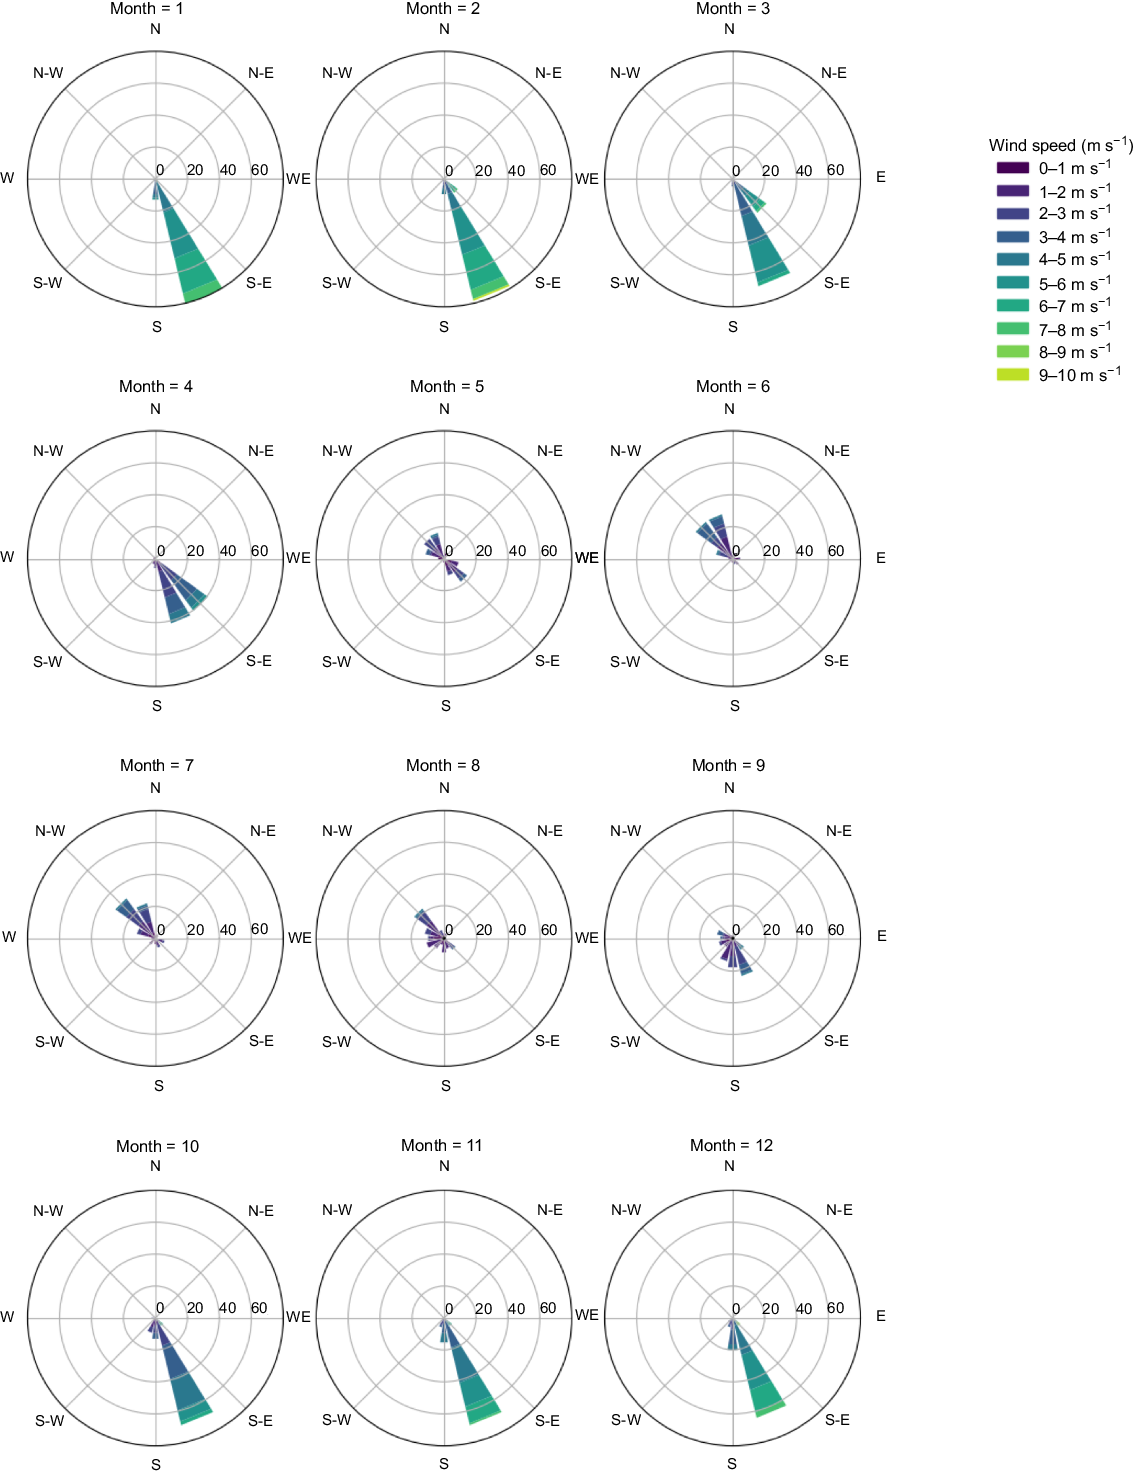
Weather patterns at the south-western tip of Africa are influenced by the interaction between the South Atlantic Anticyclone (SAA), situated in the subtropical high-pressure belt, and westerly (Rossby) waves in the circumpolar low-pressure belt. The position of the SAA oscillates between a southern hemisphere summer mean of 32°S and a winter mean of 28°S (Schulze 1965; Dube 2002). False Bay, at ~34°S, is dominated by anticyclonic conditions in summer and by cyclonic conditions in winter (Jury 2020). Consequently, the physical oceanography of False Bay is dominated by a bidirectional wind regime, with winds blowing seasonally from opposing quarters. Fig. 3 depicts the monthly wind speed distribution and wind direction in False Bay, based on the fifth generation European Centre for Medium-Range Weather Forecasts (ECMWF) reanalysis (ERA5) monthly averaged data on single levels from 1940 to 2023 (Hersbach et al. 2020). The Bay is dominated by stronger south-easterly winds from October to April and by weaker north-westerly winds from May to September.
ERA5 monthly average wind speed and direction in False Bay (on the basis of monthly data spanning the period 1940 through to 2023). ERA5 is the fifth-generation ECMWF re-analysis for global climate and weather.
The mountainous terrain of the Cape Peninsula strongly influences wind patterns in False Bay (Jury 2020). As Fig. 1 shows, mountains shield the study area from strong north-westerly winds. However, the same mountains also channel strong south-easterly winds (Coleman et al. 2021). Gale-force south-easterly winds can generate waves more than 1.5 m high across the study area (Daniels et al. 2022).
Tidal regime
Analysis of historical tide-gauge data shows that Simon’s Town experiences a spring-tide range of 1.486 m. False Bay falls into a semi-diurnal upper micro-tidal (<2-m tidal range) environment (Davies 1980; Grundlingh and Largier 1991; Caldwell et al. 2015). With such a regime, tidal currents are expected to be relatively weak in the study area (Rautenbach et al. 2019; de Vos et al. 2021). Data from an Acoustic Doppler Current Profiler (ADCP) deployed off Miller’s Point, 6 km south of Simon’s Town, show that tide-driven bottom currents never exceed 0.2 m s−1 (Coleman et al. 2021).
Swell regime
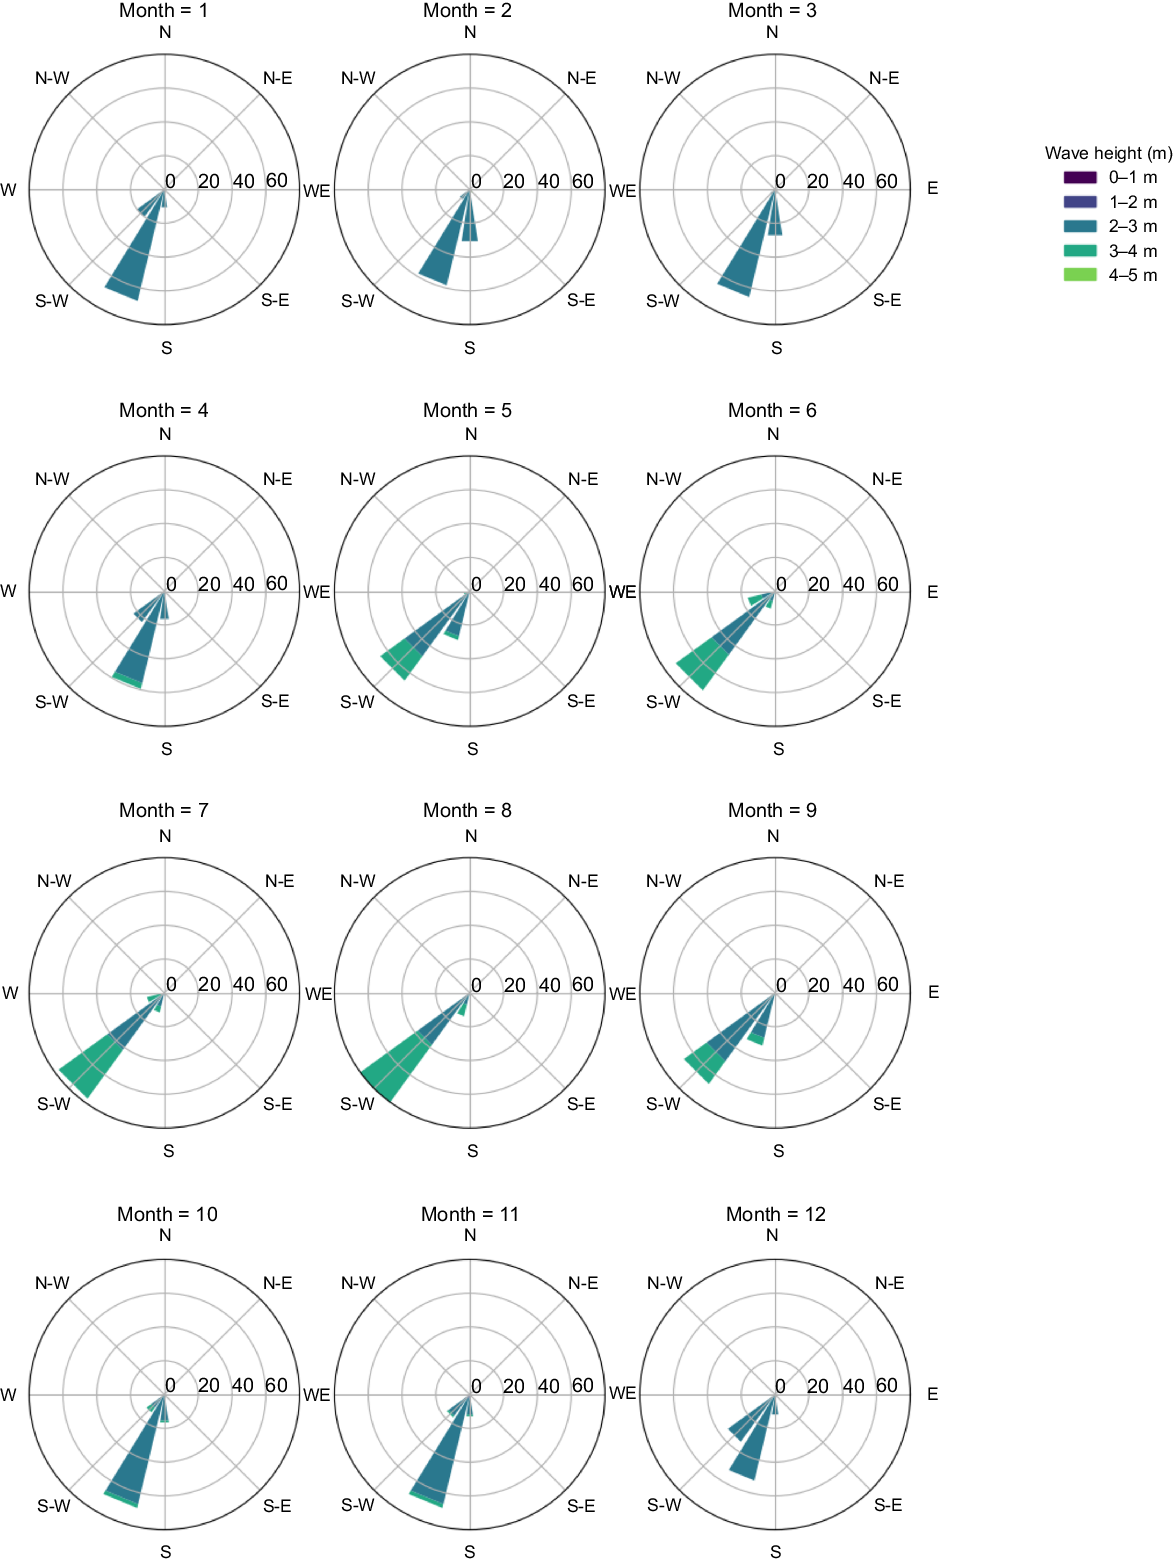
South-westerly swells dominate the south-western coast of South Africa (Fig. 4). The Cape Peninsula provides a natural barrier protecting much of False Bay from the direct impact of these swells. Rocky Bank, at the mouth of False Bay, focuses the energy of south-westerly swells on the rocky eastern shoreline of False Bay, as detailed in studies by Shipley (1964), Darbyshire (1966) and more recently by Salonen and Rautenbach (2021).
ERA5 monthly average swell height and direction at the south-western tip of Africa (on the basis of monthly data spanning the period 1940 through to 2023). South-westerly swells dominate the region.
Southerly swells, originating from deep low-pressure systems south of the country, occasionally penetrate the bay. These swells, too, are concentrated by Rocky Bank, but their impact is felt predominantly along the north-western shore of False Bay (Darbyshire 1966; Bang 1967). This concentration of energy can cause considerable damage to coastal structures, as documented by Brundrit (2009), MacHutchon (2015) and Pfaff et al. (2019). The eastern half of our study area lies directly in the path of these focused southerly swells (Fig. 5).
Modelled wave heights in False Bay, illustrating the shielding effect of the Cape Peninsula on south-westerly swells. The study area is exposed to southerly swells. SWAN model outputs courtesy of Christo Rautenbach and Marc de Vos.
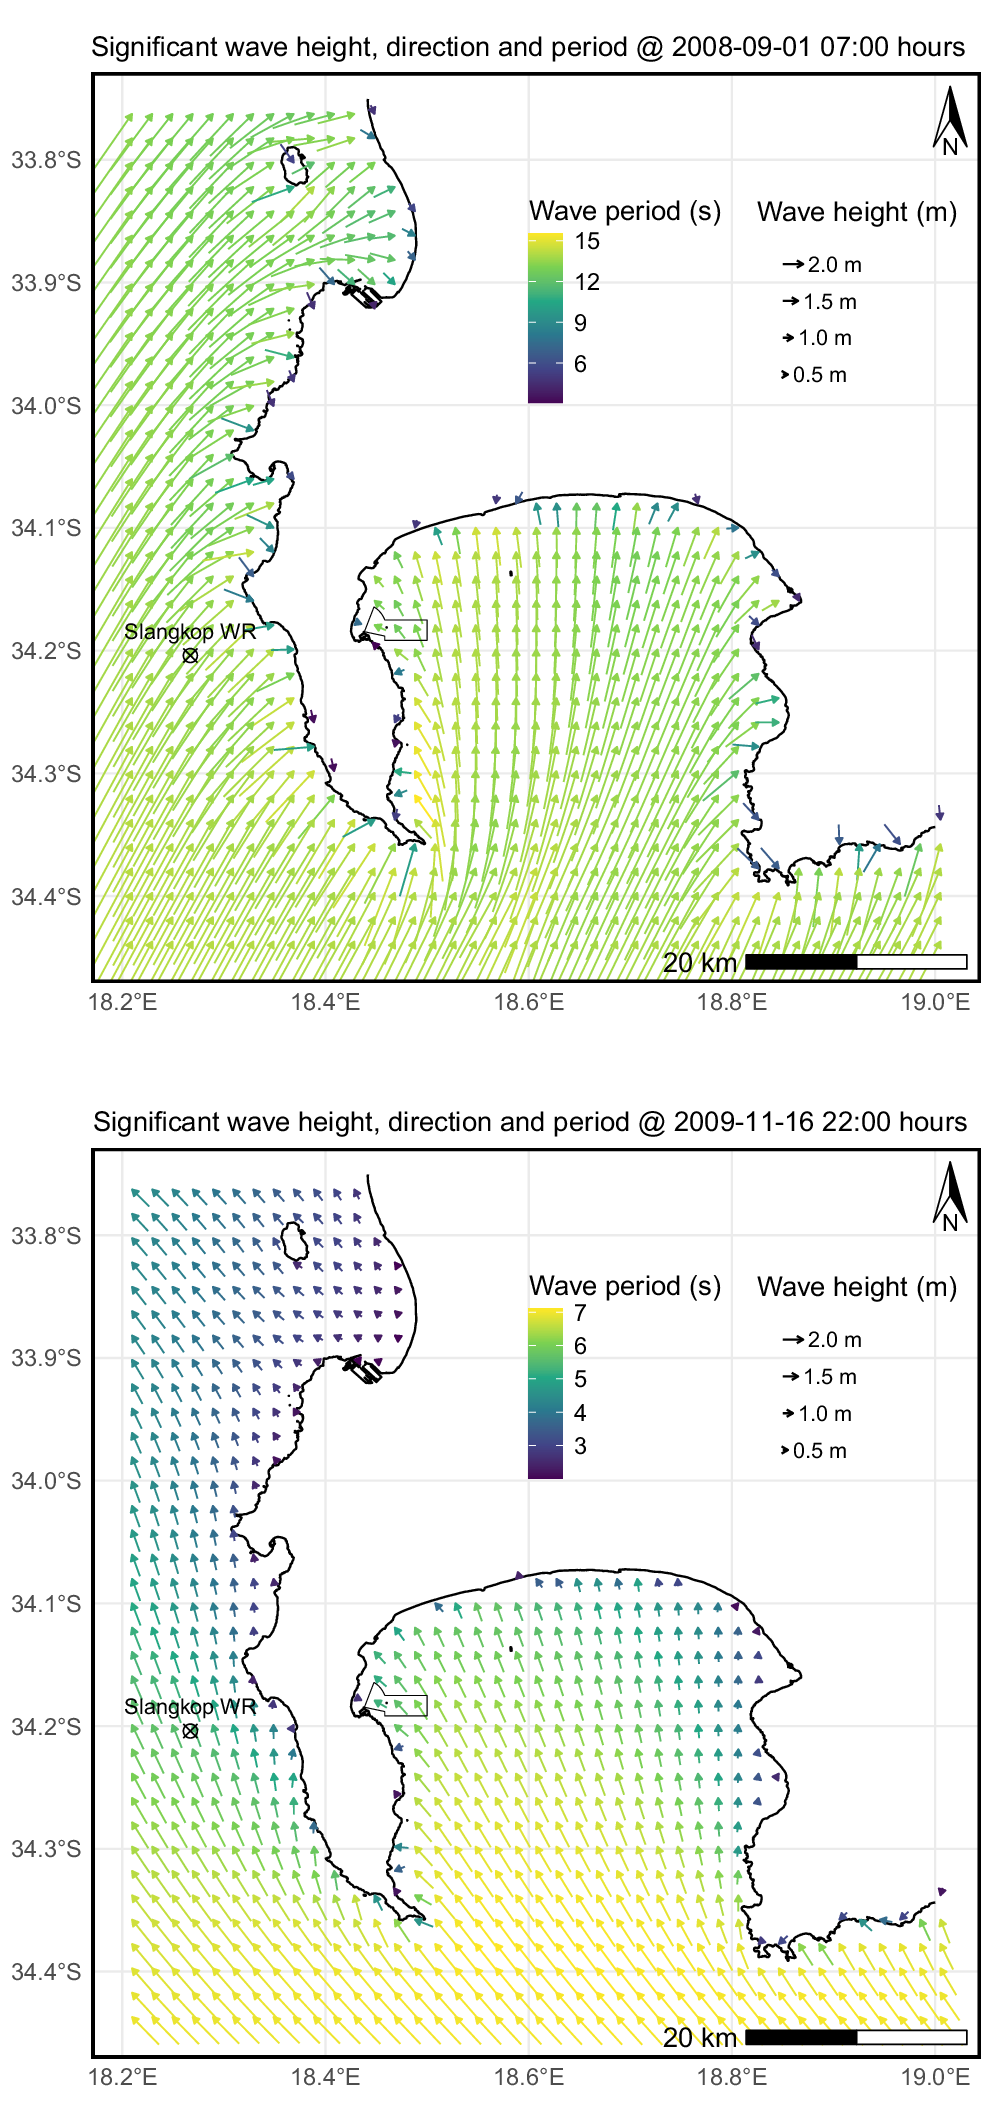
Data from the above-mentioned ADCP show that wave heights in the north-western corner of False Bay can reach 1.5 m (Daniels et al. 2022). However, such wave heights tend to be associated with shorter-period waves between 4 and 6 s, being typically generated by strong local winds.
Surface and bottom currents
Atkins (1970) found that wind-driven surface currents dominate False Bay. He described a clockwise circulation driven by south-easterly winds and an anti-clockwise circulation driven by north-westerly winds. Current metres show that surface water is driven into the middle of the bay by south-easterly winds and exits on the eastern and western sides (Wainman et al. 1987; Grundlingh and Largier 1991).
Circulation models indicate complicated surface-current patterns for different wind speeds and wind directions (Jury 2020; de Vos et al. 2021). Bottom currents tend to flow differently from surface currents (Coleman et al. 2021; de Vos et al. 2021). The models show that in the study area, surface and bottom currents move in a northerly direction with south-easterly winds. With north-westerly winds, surface currents move in a southerly direction. By contrast, bottom currents move in the opposite direction (Coleman et al. 2021). In other words, wind-driven bottom currents flow north-wards through the study area, no matter which way the wind blows. Tide-driven currents develop when there is no wind-forcing and flow north-ward during incoming tides and south-ward during outgoing tides (de Vos et al. 2021).
Methods
Data collection
Data collection took place in two stages during 1985 and 1986. The first phase involved mapping the seafloor by using side-scan sonar and echosounder. In the second phase, sediment sampling and SCUBA diver inspections were used to verify the sonograph interpretation. Two 10-m catamaran workboats were used to collect data.
One catamaran vessel was equipped with a computer-driven integrated survey system. A Hewlett Packard 85 microcomputer steered the vessel along predetermined tracks and interfaced with a Plessey MRD-1 microwave positioning system, a 210-kHz Elac LAZ 721 single-beam echosounder, and an EG&G 260 side-scan sonar recorder with an EG&G 272,105-kHz side-scan sonar towfish. The Plessey MRD-1 provided position fixes accurate to within 1 m (the survey predates widespread GPS availability) (De Jong et al. 2002). This integrated setup enabled the collection of precisely located depth soundings and side-scan sonar data.
The acoustic survey unfolded in two phases. In the first phase, we recorded 7811 depth soundings at 1-s intervals along 66 east–west tracks spaced 60 m apart. In the second phase, we collected 10.8 km2 of side-scan sonar imagery along 22 east–west tracks spaced 180 m apart. Owing to equipment issues and the need to navigate around shallow and exposed reefs, only 90% of the study areas was insonified using side-scan sonar. The side-scan sonar tracks were run at 3.5 knots (~6.5 km h−1) with a 100-m scanning range, achieving an across-track resolution of 0.25 m and an along-track resolution of 2.09 m (Flemming 1976b) The system produced analogue side-scan sonar imagery, corrected for speed and slant range, at 1:1000 scale. Position fixes were printed every 30 s onto the paper records.
Bouma and Rappeport (1984) and Duck and McManus (1985) stressed the importance of in situ observations to ground-truth side-scan sonar imagery. For instance, a feature-less, even-toned seafloor may be covered with features too small or of insufficient density to be resolved by side-scan sonar. To avoid misinterpretation of the side-scan sonar imagery, sediment samples and information from SCUBA diver inspections were obtained from several locations within the study area.
This study collected 71 sediment samples, 58 of which were obtained using a hand-operated Van Veen grab (Van Veen 1936), and SCUBA divers collected 13 during seafloor inspections. The sampling sites targeted different patterns of acoustic reflectivity (acoustic facies) observed on the side-scan sonar imagery. Fig. 6 shows the location of each sample site. The Van Veen grab retrieved up to 0.6 L of sediment. Retrieved samples were emptied into a bucket to allow fines to settle and remove macrofauna and excess water before being transferred into a labelled 700-mL jar.
Sediment sample and dive sites. Colours indicate which acoustic facies were sampled. Shapes indicate the sampling method used.
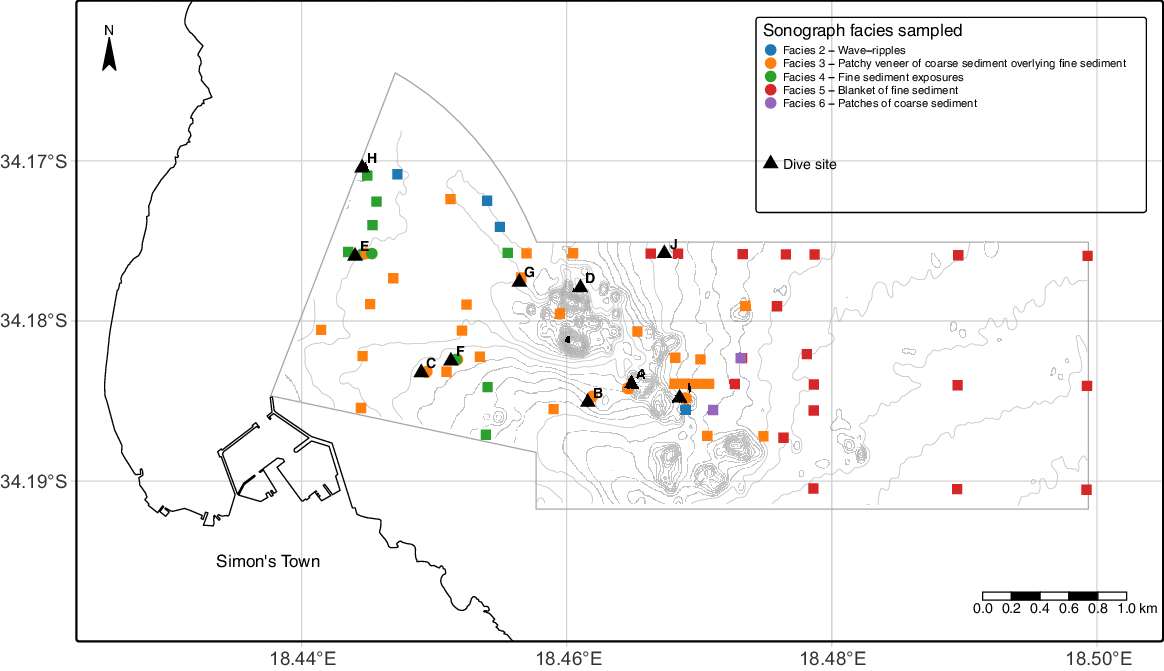
SCUBA divers from the University of Cape Town Scientific Dive Unit and Institute for Maritime Technology inspected 10 dive sites within the study area, with each being selected on the basis of distinct patterns of acoustic reflectivity. Prior to each dive, the team was briefed on expected seabed features and instructed to gather ground-truth data by photographing the seabed, recording notes on plastic sheets, and collecting sediment samples in 700-mL plastic jars. For safety, dives were limited to fair weather conditions and depths of less than 30 m, restricting site selection to the shallower western part of the study area.
Data processing and analysis
The 1:1000 scale paper imagery was reduced to 1:2000 scale by using a photocopier for easier handling. These reduced copies were arranged in a mosaic on the lab floor, allowing the first author to visually assess and classify sonograph facies on the basis of acoustic reflectivity, following the approach of Kidd et al. (1985). Underwater surveys then transferred these facies onto 1:2000 scale track charts, which were photographically reduced to 1:10,000 scale and compiled into a single map. This map was digitised as an ESRI shapefile for integration with other spatial data. Whereas modern digital methods offer precision and efficiency, in our experience, physically assembling the mosaic at a 1:2000 scale provided an unequalled overview, enabling pattern recognition and spatial interpretation in a way often lost on a computer screen.
We converted the 7811 tide-corrected depth soundings into XYZ data points, with an estimated horizontal accuracy between 1 and 5 m and a vertical resolution better than 0.3 m. Using TNTmips geospatial software (ver. 2012, see https://www.microimages.com/), we generated a triangulated irregular network (TIN) from these points and produced a raster digital elevation model (DEM). From the DEM, we extracted 1-m interval depth contours, applied a spline filter to smooth them, and exported the final contours as an ESRI shapefile.
Sediment sample analysis
The workflow used to determine the textural and compositional properties of all the sediment samples is presented in Fig. 7.
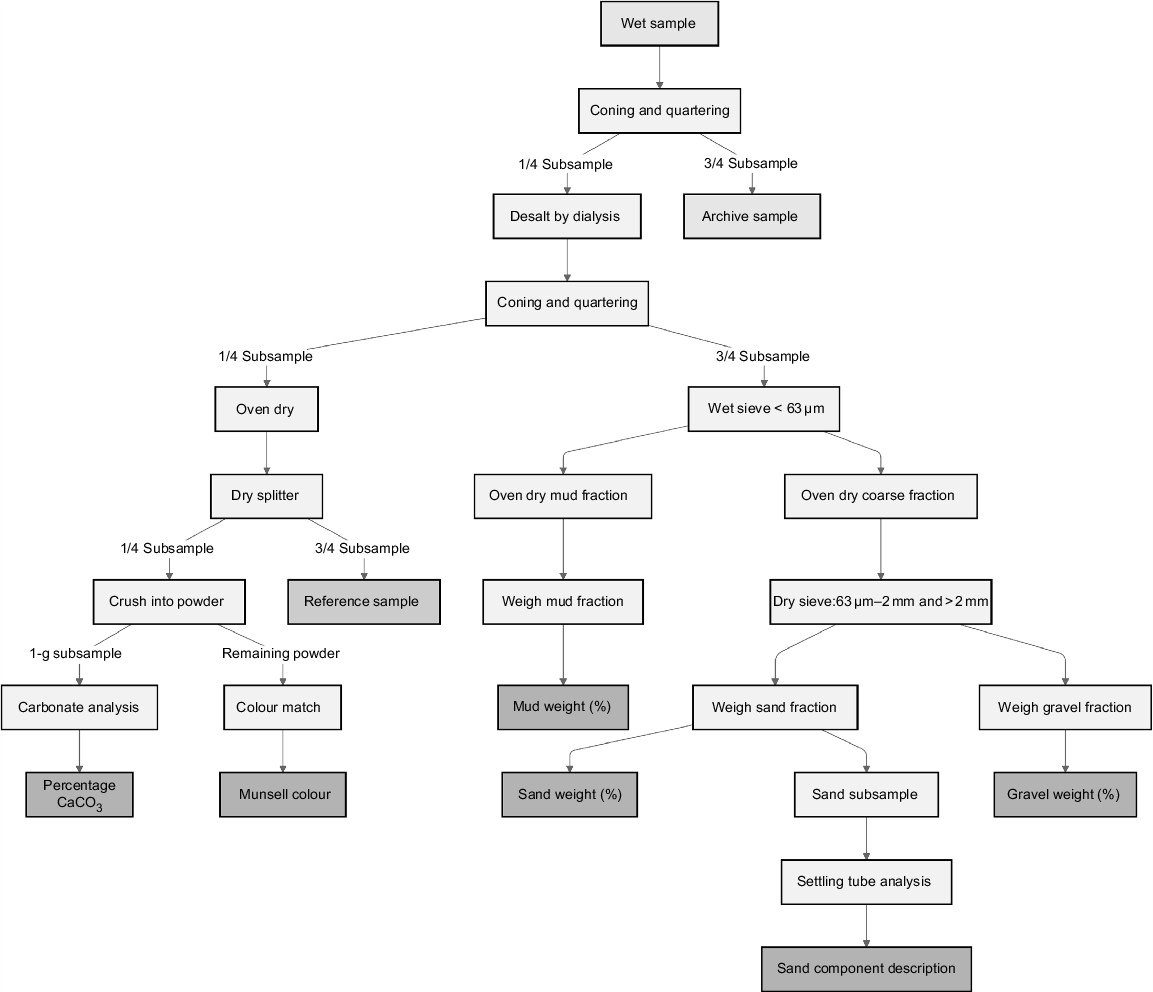
The wet sample was split by ‘coning and quartering’ (Gerlach et al. 2002). A quarter was put aside for laboratory analysis. This subsample underwent desalination by osmosis in dialysis tubing immersed in refreshed tap water overnight. The desalinated sample was then split again, allocating three-quarters for texture analysis and the remaining quarter for composition analysis.
The desalinated texture split was wet-sieved through a 63-μm screen, separating the mud (less than 63 μm) from the coarser fraction. The mud was allowed to settle in plastic tubs, decanted and then dried in glass beakers at 100°C for 24 h for weighing. The coarse fraction underwent similar drying, followed by a 5 min mechanical sieve through 63-μm and 2-mm screens to separate gravel, sand and pan-mud, with the latter being silt retained on the 63-μm screen due to water surface tension. After weighing, pan-mud was added to the wet-sieved mud weight for total mud weight calculation. The gravel, sand and mud proportions were then calculated as percentages of the total dry weight.
For settling-tube analysis, less than 10 g of the sand fraction was subsampled using a dry sample splitter. Equipment issues meant samples had to be analysed using the Council for Geoscience and the University of Cape Town settling tubes. These shared the same basic hardware configuration and microcomputer setup; the software for performing rapid and precise statistical analysis of sand-size distribution was essentially identical (Flemming and Thum 1978; Brink and Rogers 1985).
The desalinated composition-split was oven-dried and then split again. One quarter was crushed into a fine powder with the remaining three quarters being used as a reference sample for the sonograph interpretation. Each crushed subsample was colour-coded using (Munsell 1975) soil-colour charts, before being analysed for CaCO3 by using the ‘Karbonat Bombe’ method (Müller and Gastner 1971; Birch 1981). Five millilitres of concentrated hydrochloric acid (HCl) was added to 1 g of the crushed sample in an airtight container fitted with a pressure gauge. The pressure of the released gas was normalised against a standard for pure CaCO3, giving the percentage CaCO3 for the sample. Standards were determined every five samples because this method is sensitive to air temperature and atmospheric pressure variations.
The gravel and sand fraction components were examined using a procedure based on the Ingram (1965) method. The gravel fraction was inspected visually, whereas the sand fraction was examined under a binocular microscope. Each sample’s components were identified, and their relative abundances were categorised as ‘dominant’ (50%), ‘major’ (5–50%), ‘minor’ (1–5%) or ‘trace’ (1%). Identification of specific biogenic components required consultation with marine biologists.
Observations
Bathymetry
A NW–SE-oriented granite reef zone divides the study area into two distinct parts (Fig. 8). The zone extends ~2 km long and 1 km wide, forming a rugged, elevated feature composed of multiple granite outcrops that rise sharply between 2 and 20 m above an otherwise smooth seafloor. Although we refer to the broader structure as a ‘granite reef zone’, individual exposed features within it are described as ‘granite outcrops’. Notably, three of these outcrops pose navigational hazards, including Roman Rock, which protrudes above the sea surface, Castor Rock, the shallowest, with a depth of ~3 m, and Rambler Rock, with a minimum depth of 8 m.
Bathymetry of the study area; 1-m contours overlaid onto tide-corrected soundings. A NW–SE granite reef zone bisects the study area.
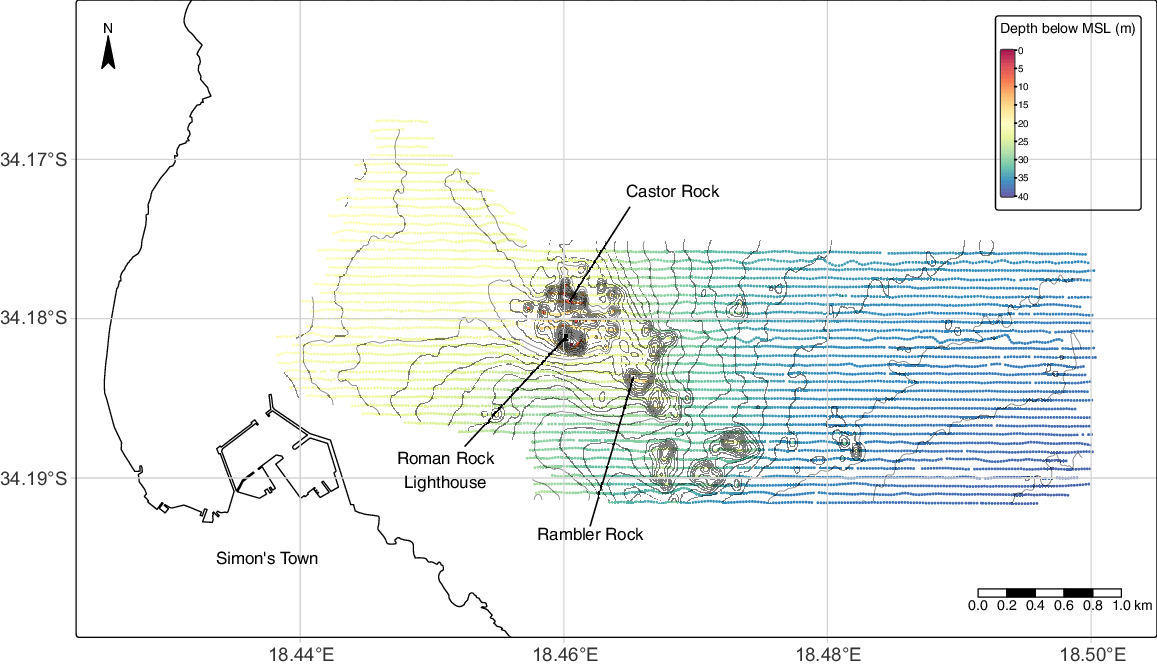
The seafloor north-west of the reef zone is mostly flat, lying at depths of 20–22 m. By contrast, the seafloor south-west of the reef forms a narrow, channel-like trough less than 1 km wide, separating the reef zone from the adjacent coastline. Depths in the trough increase steeply from 22 m to a maximum of 33 m. East of the reef zone, the seafloor gently deepens from ~25 m near the reef to 38 m in the south-eastern corner of the study area. A slight, channel-like depression is also present north-west of Roman Rock.
Side-scan sonar survey
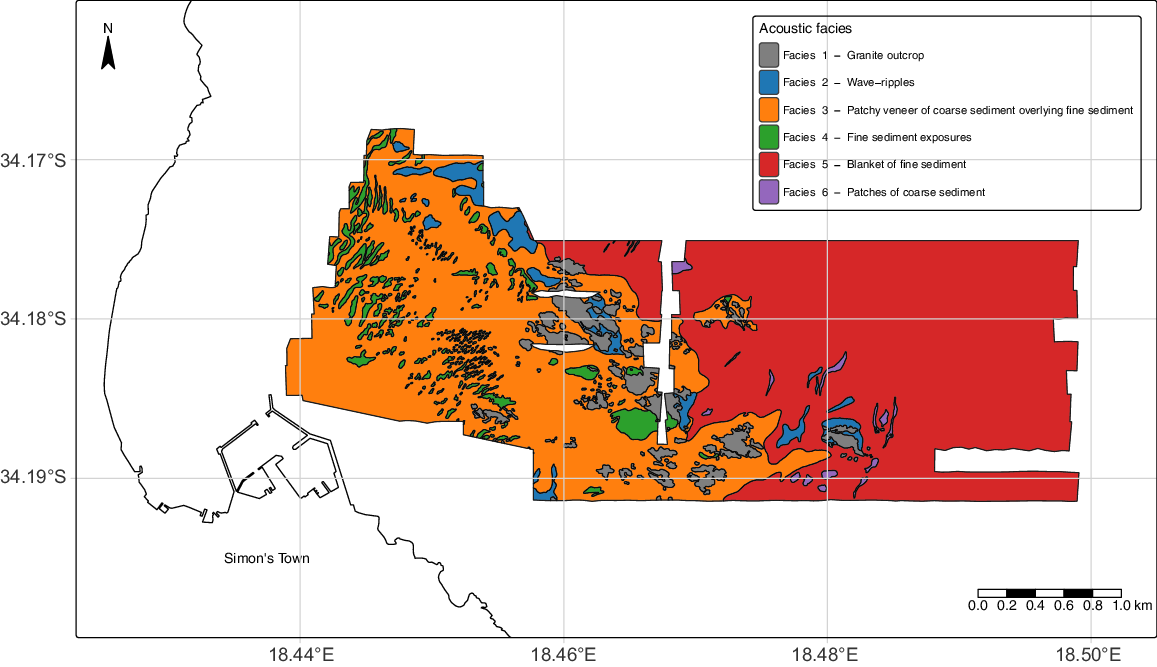
Six patterns of acoustic reflectivity (acoustic facies) were identified on the side-scan sonar imagery (Fig. 9). The characteristic features of the six acoustic facies are detailed in Table 1. Facies 1 corresponds to rocky areas in Fig. 8. Facies 2–6 occur in areas with low relief.
| Facies | Relief | Acoustic reflectivity | Sonograph pattern | Sediment texture | SCUBA diver observations | Interpretation | |
|---|---|---|---|---|---|---|---|
| 1 | Rugged | Strong | Lineaments within an irregular blocky pattern of light and dark tones. | – | Granite outcrop, like the coastal granite outcrops west of the study area. Outcrops are covered with marine organisms. The base of the outcrops is surrounded by bioclastic debris. | Cape Granite Suite; exposed granitic bedrock with bioclastic veneer. | |
| 2 | Low | Moderate | Alternating bands of light and dark tones, oriented ENE–WSW, spaced ~1 m apart. | Calcareous gravel and sand | Straight-crested bifurcating ripples, wavelength 0.8–1.2 m, amplitude 0.2–0.3 m, oriented ENE–WSW. | Shallow, wave-generated ripple fields in calcareous gravelly sand. | |
| 3 | None | Moderate to weak | Uneven, featureless medium-grey tone. | Sand and gravelly sand | Small (1–2 m wide) patches of gravelly calcareous sediment overlying relict quartzose fine to medium sand. Ophiuroids and crinoids are common. | Patchy veneer of calcareous gravelly sediment overlying quartzose sand. | |
| 4 | None | Weak | Cloud-like and tongue-like patches of light tone. | Fine to medium calcareous sand | Rippled fine to medium sand. Ripples are straight-crested, symmetrical and bifurcate; wavelength 10–20 cm, amplitude 1–3 cm, ENE–WSW oriented. Some pinnid bivalves present. | Exposed patches of fine to medium sand within a calcareous sediment veneer. | |
| 5 | None | Weak | Slightly speckled, featureless light tone. | Quartzose fine to medium sand | Rippled quartzose sand. Ripples straight-crested, symmetrical, bifurcating; wavelength 10–20 cm, amplitude 1–3 cm, ENE–WSW oriented. Few ophiuroids and asteroids observed. | Blanket of quartzose fine to medium sand. | |
| 6 | None | Moderate | Isolated patches of medium-grey tone within Facies 5. | Mixed sands: one calcareous, one quartzose | None (too deep for diver observation). | Isolated deeper patches: possibly coarse sediment accumulations or subcropping weathered granite saprolite. Interpretation remains speculative. |
Facies 1 is characterised by lineaments within an irregular, blocky pattern of light and dark tones (Fig. 10). This acoustic facies aligns with rocky pinnacles shown on official nautical charts. Diver observations at Site A (Rambler Rock) and Site I (Fig. 6) showed that the pinnacles resemble the coastal granite outcrops west of the study area, consisting of large, well-jointed, rounded boulders (up to 5 m tall) resting on a broader granite base (massif) or protruding above the sediment. The outcrops were covered in calcareous and soft-bodied marine organisms and surrounded by calcareous skeletal debris.
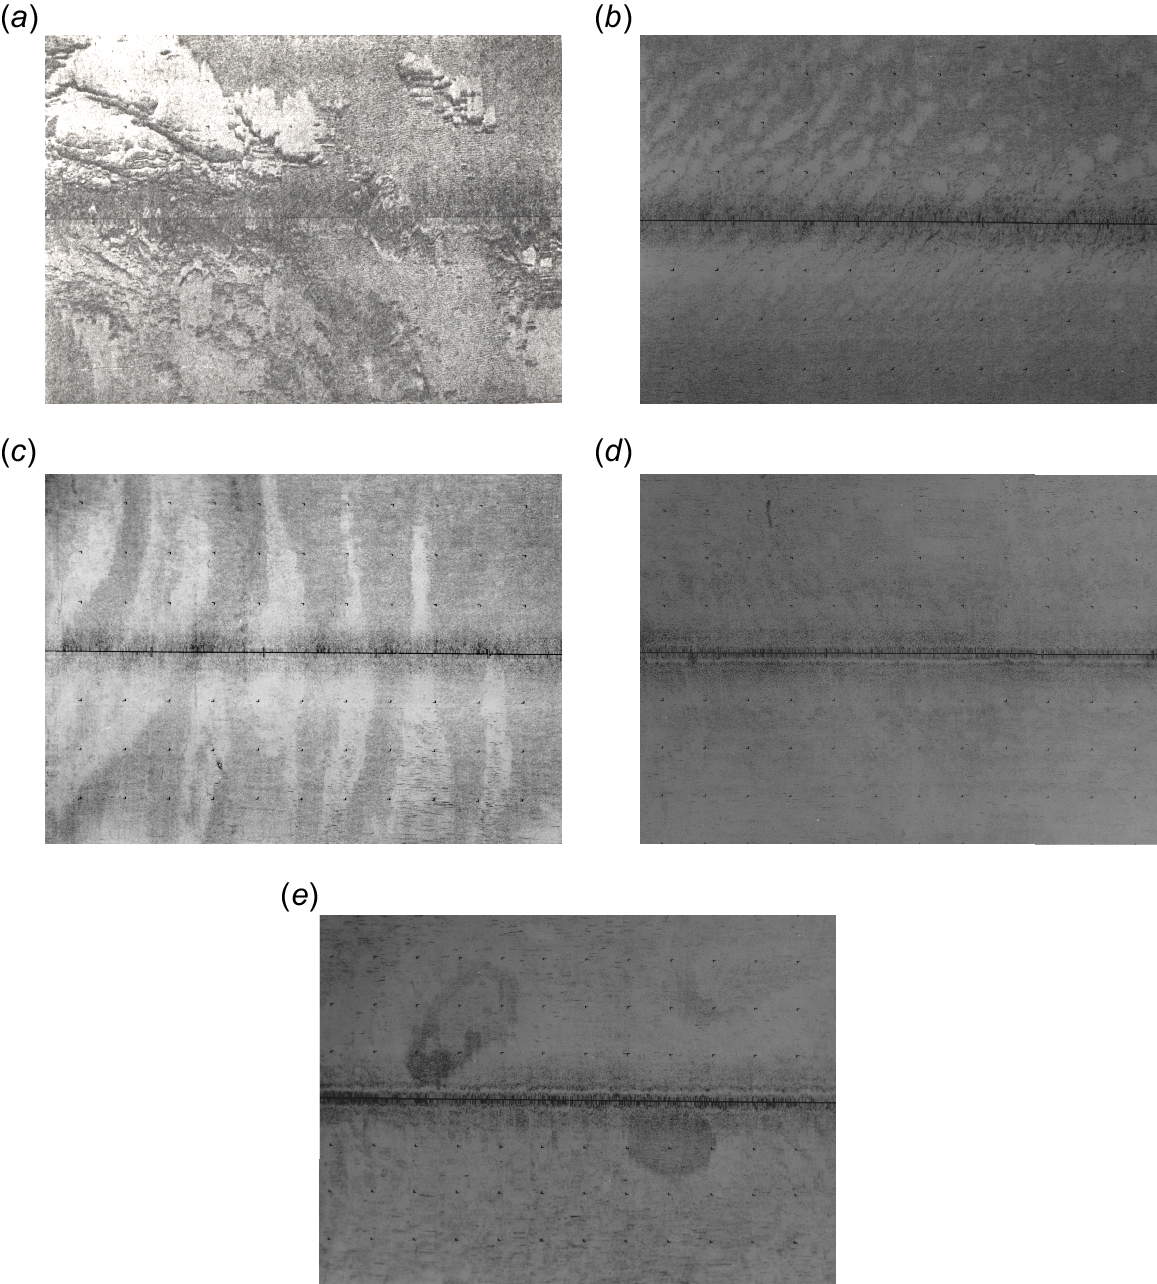
Example sonograms from the side-scan sonar survey. Internal tick-marks are at 25-m intervals. (a) Facies 1: Cape Granite Suite, and Facies 2: wave ripples. (b) Facies 4: cloud-like patches of fine to medium sand. (c) Facies 4: tongue-like patches of fine to medium sand. (d) Facies 5: homogeneous fine to medium sand. (e) Facies 6: coarse sediment patches within Facies 5.
Facies 2 appears on side-scan sonar imagery as alternating bands of light and dark tones, oriented ENE–WSW and spaced ~1 m apart (Fig. 10). It typically occurs adjacent to, or immediately north of, the granite pinnacles (Facies 1) at depths of 20–35 m (Fig. 9). Diver observations near Roman Rock (Site D) confirmed that Facies 2 consists of large-scale, symmetrical sedimentary bedforms spaced 0.8–1.2 m apart and 0.2–0.3 m high, with long, straight crests that occasionally bifurcate parallel to the crest (Fig. 11). The ENE–WSW orientation of the bedforms matches the alternating sonar tone pattern. The bedform wavelength approaches the resolution limits of the side-scan sonar system, making them difficult to resolve in detail. These bedforms are developed in calcareous gravel and sand, with coarser sediment concentrated in the troughs and finer material on the crests.
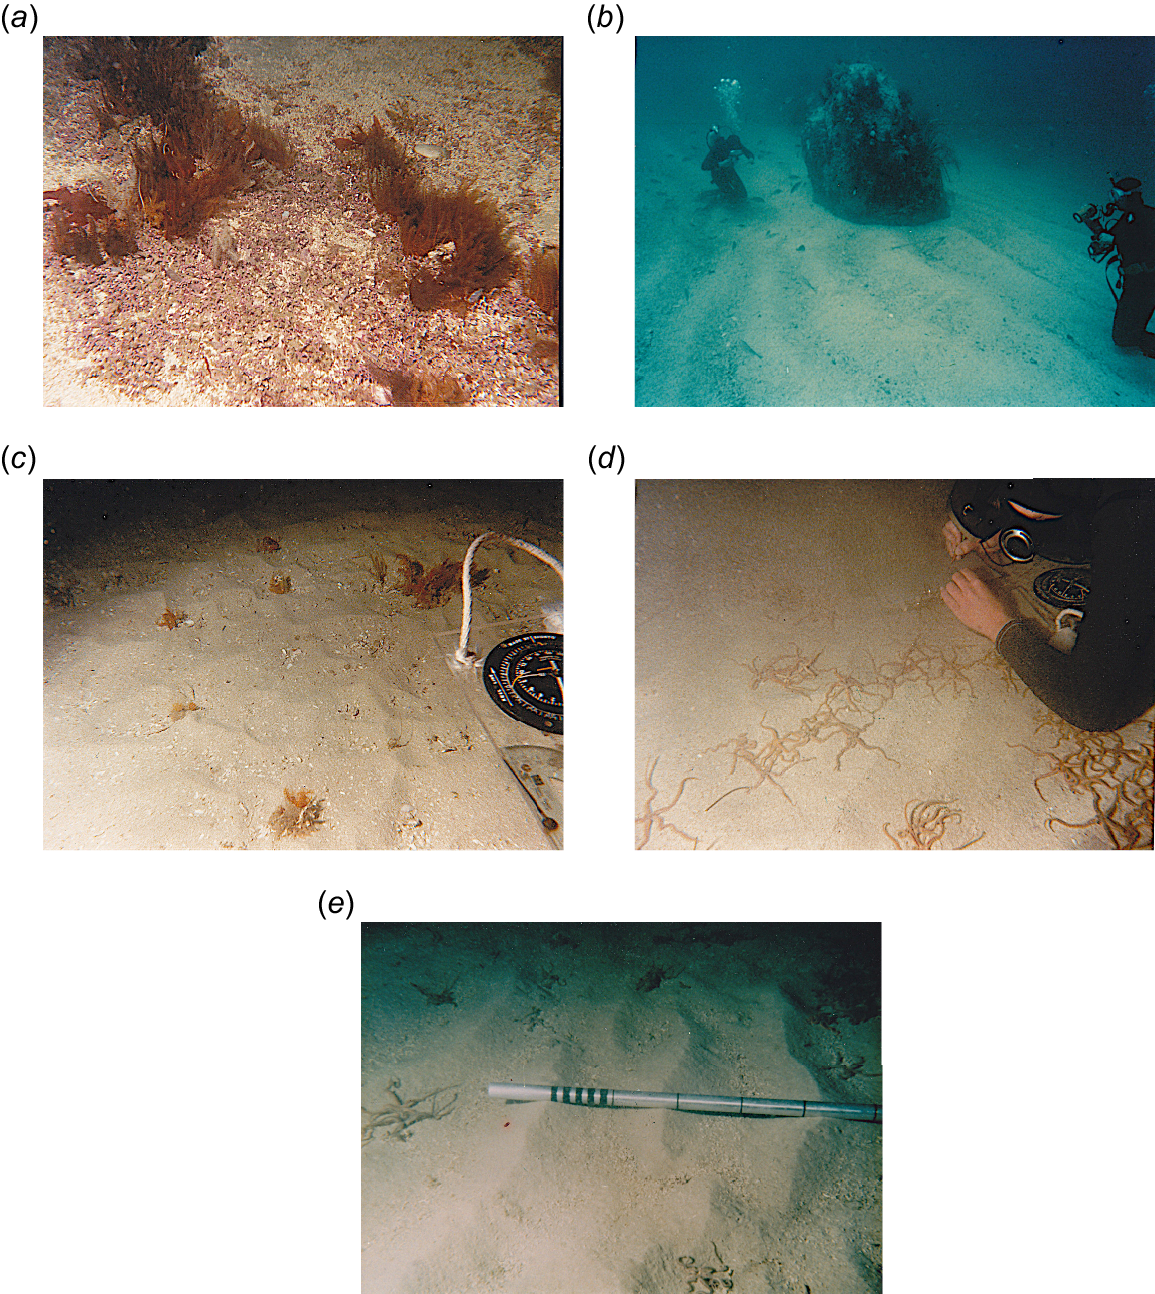
Underwater photographs from in situ diver inspections at various facies. (a) Unattached branching coralline algae (maerl) and dark-coloured feather stars (Comanthus wahlbergi) at Dive site F (Facies 3). (b) Isolated granite boulder in the middle of a wave-ripple field at Dive site D (Facies 2). (c) Fine to medium quartzose sand in a cloud-like patch at Dive site H (Facies 4). (d) Small-scale ripples in fine to medium quartzose sand at Dive site J (Facies 5), with ophiuroids (brittle stars) in the foreground. (e) Rippled quartzose fine to medium sand in a cloud-like patch at Dive site H (Facies 4); measuring staff marked at 1- and 10-cm intervals. Note the slightly coarser material in the troughs. Refer to Fig. 6 for dive site locations.
Facies 3 is characterised by an uneven, featureless, medium-grey tone and occurs in the western half of the study area at depths between 20 and 35 m (Fig. 9, 10). Sediment samples from Facies 3 range from quartzose sand to calcareous gravel. Samples near the granite pinnacles are typically composed of shell debris, including cirripede (barnacle) and mollusc fragments. By contrast, samples farther from the rock pinnacles, i.e. between Roman Rock and the Simon’s Town harbour wall, contain a mixture of coralline-algal fragments and quartzose sand.
Diver observations at Sites C, E, F and H (Fig. 6) discovered both living and dead unattached coralline algae (subfamily Melobesioideae) forming autochthonous structures known as maerl (or marls) on the seafloor surface (Bosence 1976; Steneck 1986). These structures, a few metres across and centimetres high, appear as elongated strips oriented ENE–WSW over quartzose sand and provide a complex habitat supporting diverse taxa (Steller et al. 2003). The maerl strips are often associated with crinoids (Comanthus wahlbergi) and brittle stars. Pebble-sized quartz and feldspar fragments, as well as Venus verrucosa shell fragments, were also noted in Facies 3.
Facies 4 occurs west of Roman Rock at depths of 20–30 m (Fig. 9). The light-toned patches vary in shape and size, but two distinct forms stand out, namely, small, slightly elongate ‘cirrocumulus cloud-like’ patches (10–50 m long, 5–20 m wide, ENE–WSW oriented) and larger, ‘tongue-like’ patches (up to 300 m long, 50 m wide, NNE–SSW to N–S oriented) (Fig. 10). Diver photographs from Sites E, F and H (Fig. 6) show that Facies 4 comprises light grey, rippled, fine to medium quartzose sand (Fig. 11). The small-scale ripples are symmetrical, straight- and sharp-crested, with wavelengths of 10–20 cm, amplitudes under 3 cm and oriented ENE–WSW. Sediment samples confirmed that the sand is fine- to medium-grained and predominantly quartzose. Divers also noted the presence of Atrina squamifera (horse mussels) in some patches, embedded vertically in the sand with only the posterior edge exposed. These bivalves appear to be more abundant in the larger, tongue-like patches, appearing on sonographs as small black streaks.
Facies 5 occurs in the deeper parts of the study area (greater than 25-m water depth), east of Roman Rock (Fig. 9). It appears on the sonographs as a featureless light-toned area (Fig. 10). Sediment samples from Facies 5 are relatively homogeneous, consisting of benthic foraminifera-bearing, quartzose, fine to medium sands. Many samples also contained fauna, such as polychaete worms. Diver observations at Site J (Fig. 6) in Facies 5 showed small-scale ripples in the fine to medium sand (Fig. 11). The ripples were symmetrical, ENE–WSW oriented, with long, straight, bifurcating crests, of wavelengths of 10–20 cm and amplitudes less than 3 cm.
Facies 6 appears as isolated, darker, speckled patches within Facies 5, located in deeper water east of Roman Rock (Fig. 9, 10). The patches vary in shape, from rounded forms 50 to 100 m across to elongate features up to 400 m long and 50 m wide, aligned NNE–SSW. Only two sediment samples were recovered from Facies 6. Both samples are medium sands, with one calcareous and the other quartzose. Facies 6 was too deep for safe diving.
Sedimentology
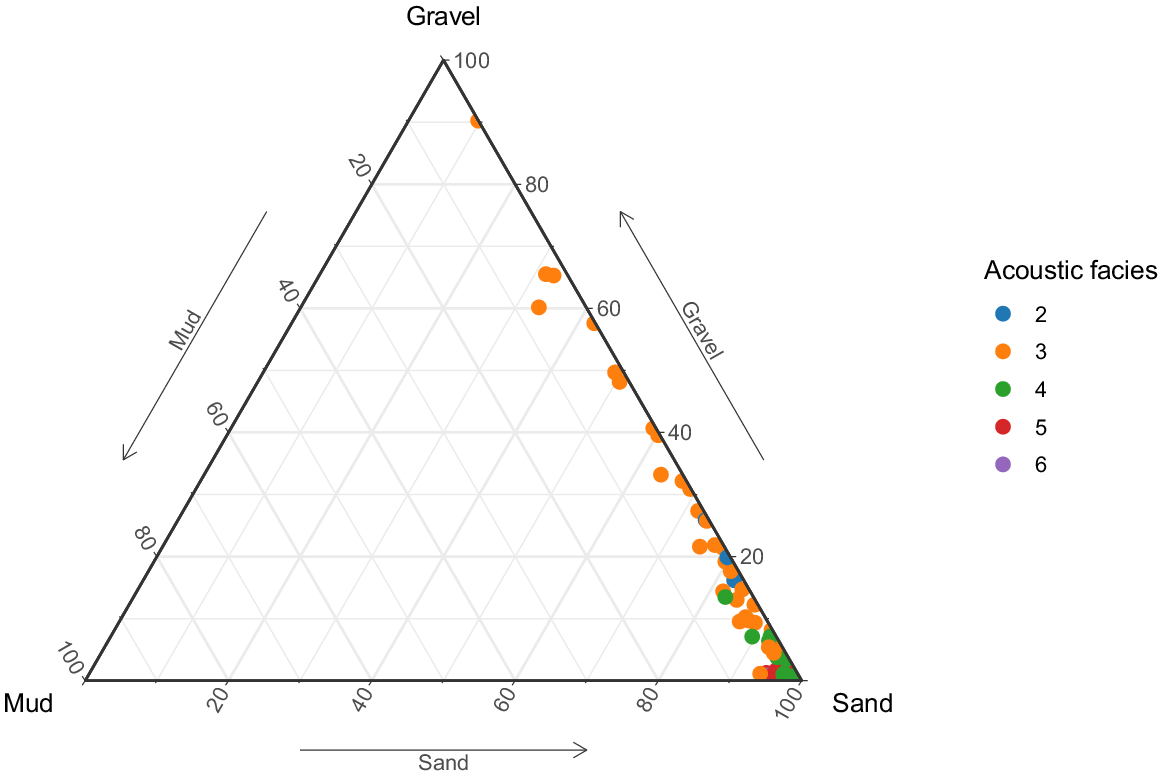
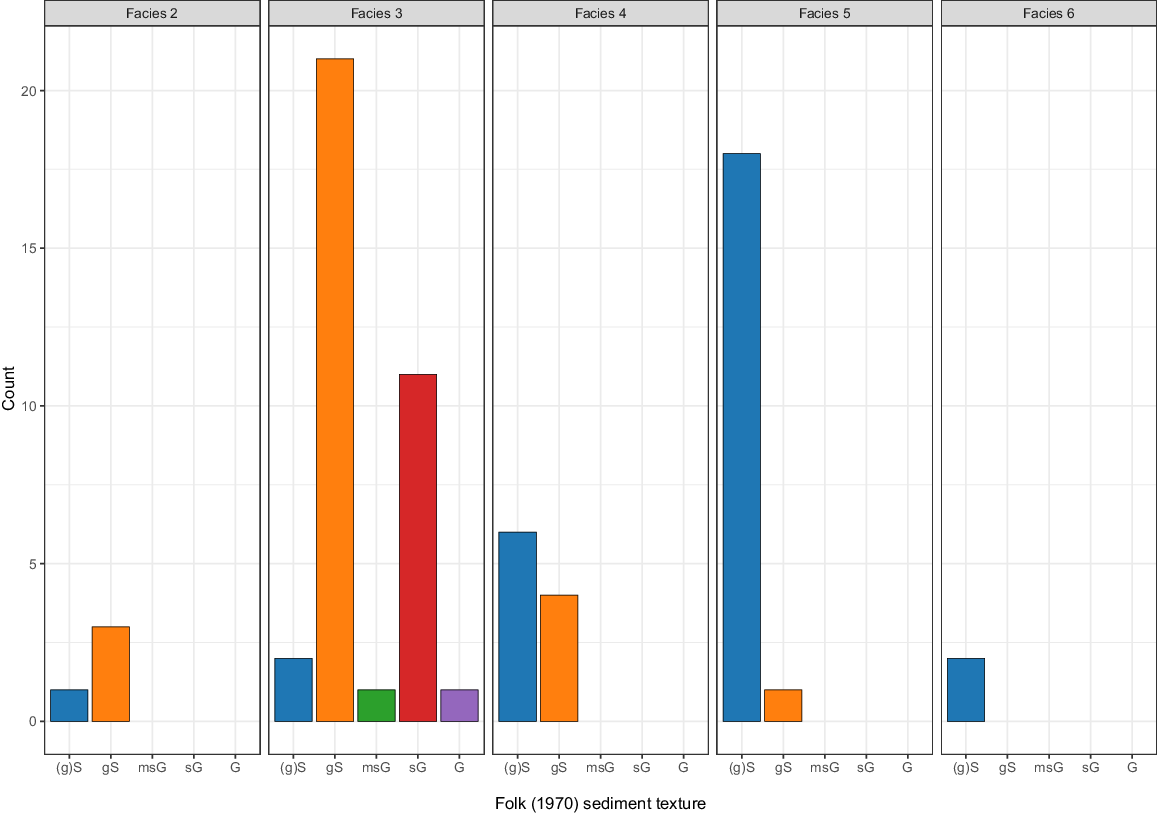
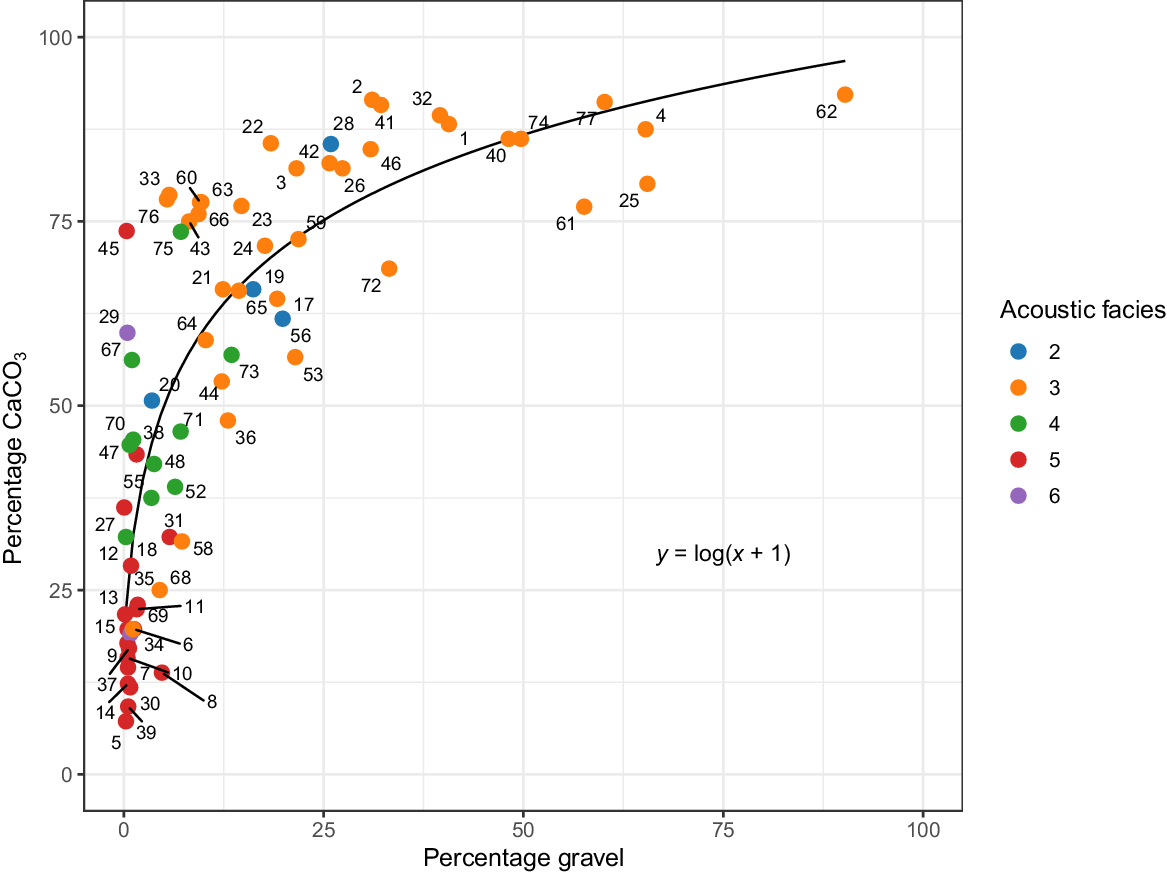
Fig. 12 shows that the sediment samples collected in this study are either gravelly sands or sandy gravels. The samples are essentially mud-free. Fig. 13 presents a breakdown of sediment texture by acoustic facies. Facies 3 exhibits the most variation in sediment texture, ranging from slightly gravelly sand to gravel. Most of the samples from the other acoustic facies are slightly gravelly to gravelly sands. Fig. 14 shows a clear relationship between sediment texture and sediment composition; the higher the gravel fraction, the more calcareous the sediment is. The following section presents the analysis of sediment composition, which clearly shows that the gravel fraction consists primarily of bioclastic components.
Gravel–sand–mud ternary diagram. The sediment is largely mud-free. Samples collected in Facies 3 range from gravelly sand to gravel. Most of the samples from the other acoustic facies are slightly gravelly to gravelly sands.
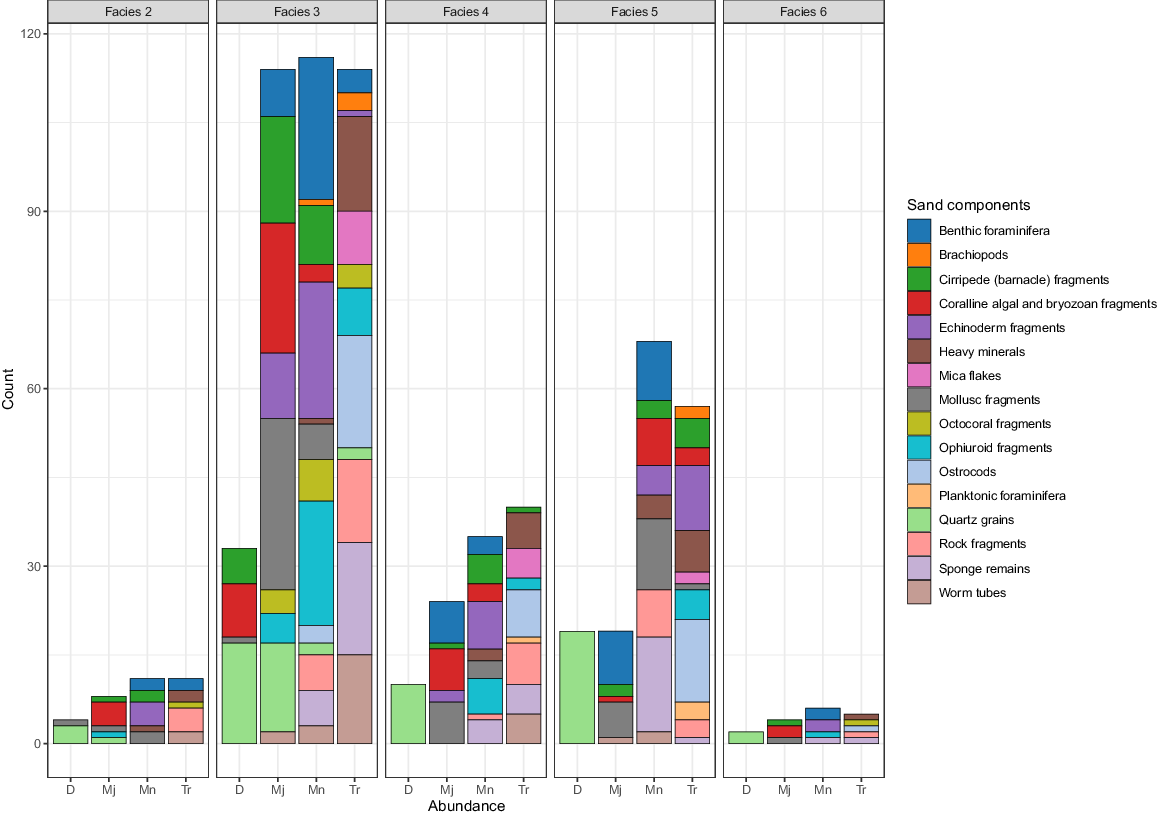
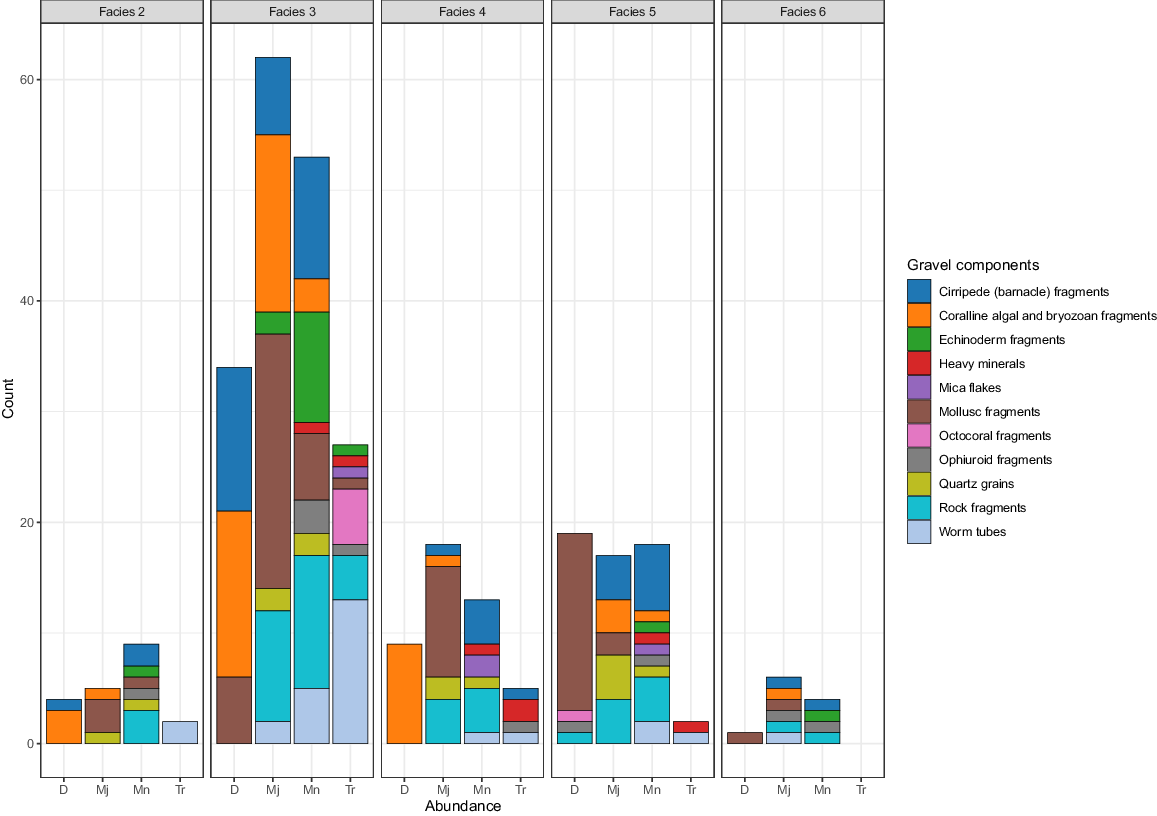
Results from the visual examination of gravel components and binocular examination of sand components are presented in Fig. 15 and 16 respectively. These show the abundance of each component for all the samples from each facies. Abundances are expressed in terms of (Ingram 1965) categories. Mollusc shell and coralline algal fragments dominate the gravel fraction in all the sediment samples.
Interpretation
This section interprets the geological significance of the side-scan sonar, echosounder, sediment sample data and diver observations.
Facies 1: Cape Granite Suite
Facies 1 corresponds to exposed outcrops of the Cape Granite Suite. The WNW–ESE lineaments observed in the side-scan sonar imagery align with the principal joint orientation mapped in onshore granite outcrops along the Simon’s Town coast (Boocock 1951; Theron 1984). These lineaments reflect the structural fabric of the granite, and the outcrops are likely to represent submerged tors, where joint spacing is relatively wide (Linton 1955; Glass 1977; Du Plessis and Glass 1991).
Facies 2: wave ripples
The underwater photographs at Dive site D (Fig. 6) verified that Facies 2 represents rippled calcareous gravelly sand or sand. This pattern of reflectivity has been observed elsewhere along the South African coast, for example, in Saldhana Bay and off Namaqualand (De La Cruz 1978; Flemming 2019).
The symmetry, WSW–ENE orientation, and the crest length of the ripples suggest that orbital currents generated by SSE swells form them and, therefore, should be more accurately defined as long-crested trochoidal wave ripples (Reineck and Singh 1980). The wave ripples are located near or to the north of granite reefs. This implies that the orbital currents forming these ripples are intensified when waves from the SSE pass north-westwards over reefs. The shallow seafloor depression observed to the NW of Roman Rock (see Fig. 8, bathymetry map) is likely to be a product of scouring by stronger bottom orbital currents. The sediment where the wave ripples occur has a mean size of 0.56 mm (coarse sand). Fig. 17 suggests that the minimum orbital current velocity (μm) needed to move sediment of this size is ~0.25–0.3 m s−1.
Near-bottom orbital velocity μm for sediment threshold under waves. Plot was generated using computational routines described in Komar and Miller (1975). For sediment grain sizes of <0.5 mm, the curves are based on Bagnold (1963) empirical data. For grain sizes of >0.5 mm, the curves are based on Komar and Miller (1973) empirical data.
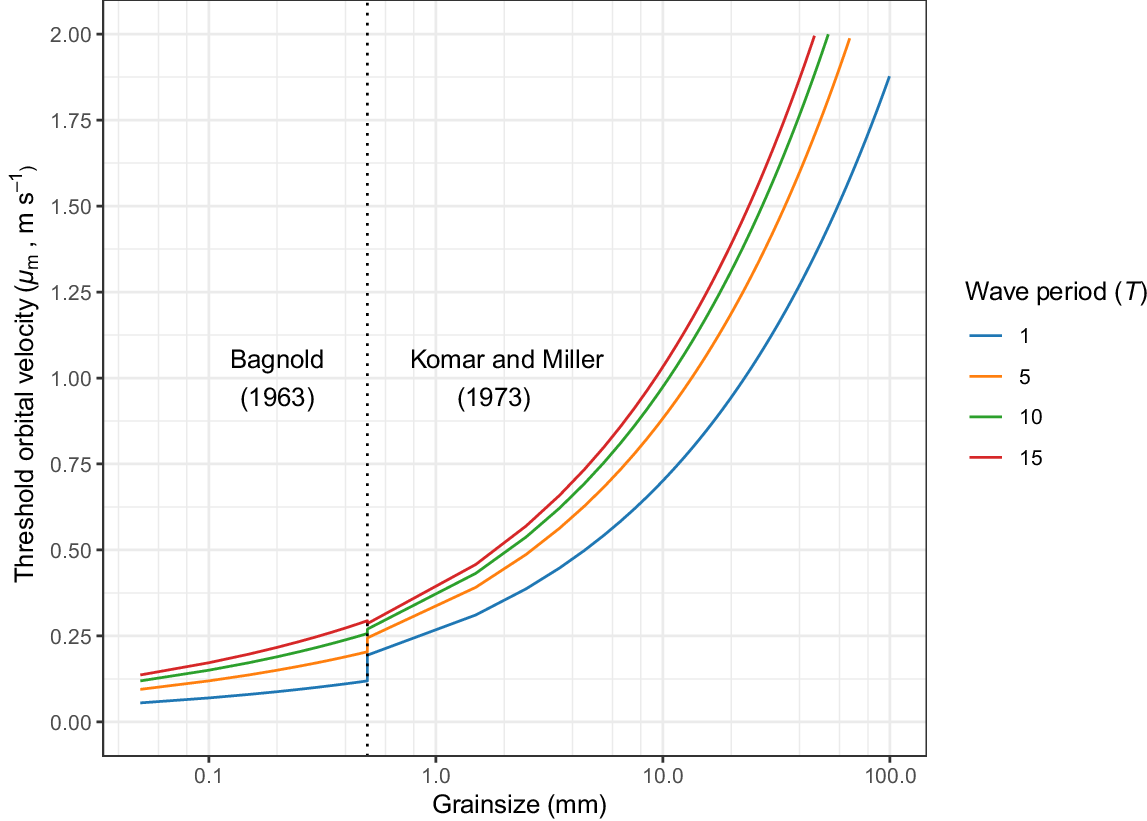
Substituting an arbitrary wave-period of 10 s (within the 8–14-s range described by Shipley 1964), a value for μm of 0.3 m s−1 and a depth () of either 20 or 35 m (the depth range of the wave ripples) into Eqn 1 (Komar and Miller 1973), the minimum wave heights (H) needed for wave ripple formation are 0.9 and 1.8 m at depths of 20 and 35 m respectively.
where μm is the threshold orbital velocity (m s−1), H is the wave height (m), T is the wave period (s), L is the derived wavelength (m), where L = 1.56T2, h is the water depth (m).
Note that Komar and Miller’s (1973) equation is based on empirical studies addressing the entrainment of spherical quartz grains. Irregularly shaped, platy bioclastic components are likely to require lower orbital velocities for entrainment than predicted by models developed for quartzose sands (Li et al. 2020).
The wave ripples were inactive when inspected by divers during fair-weather conditions. This, together with the 0.9–1.8-m range of minimum wave heights required to generate μm and the quiet-water epifaunal assemblage found in the study area, suggests that wave ripple formation is likely to occur only during prolonged summer south-easterly gales when the highest waves occur in False Bay (Theron and Schoonees 2007).
Facies 3: patchy veneer of calcareous sediment
Facies 3 represents a patchy veneer of calcareous gravel or gravelly sand overlying fine to medium quartzose sand. The patchiness of the calcareous sediment is attributed to many environmental factors, such as the nature of bottom (currents, type of substrate, predation and food supply) that affect the distribution of CaCO3 secreting organisms. Maerl is present in almost every coastal ecosystem around the world (Foster 2001). It comprises broken fragments from larger fructose forms of coralline algae growing on rocks. The fragments continue to grow unattached on the seafloor after they have broken off (Woelkerling et al. 1993; Johansen 2018). The concentration of detritus-feeding ophiuroids on top of the maerl may be because some entrained detritus becomes trapped in the interlocking branches of coralline algae as the water filters through them.
Facies 4: exposed areas of calcareous fine to medium sand within the calcareous sediment veneer
The reflective pattern distinguishing Facies 4 from Facies 3 is produced by large patches of rippled, calcareous, fine to medium quartzose sand. Facies 4 appears to represent gaps in the veneer of calcareous gravelly sediment, large enough for side-scan sonar to detect the underlying fine to medium quartzose sand. By contrast, in Facies 3, the much smaller windows of fine to medium quartzose sand in the veneer of calcareous sediment are too small to be resolved by side-scan sonar. This interpretation is based on evidence provided by underwater photographs taken by divers at Dive sites G and H (Fig. 6, 11).
The WSW–ENE orientation of the ‘cloud-like’ sand patches may be due to winnowing by orbital currents generated by SSE waves, whereas the ‘tongue-like’ patches are possibly produced by a predominant northward-moving bottom current (Atkins 1970; de Vos et al. 2021). The WSW–ENE crest orientation and bifurcated ripples seen by divers within Facies 4 at Dive sites F and H (Fig. 6, 11) suggest that these are also a product of SSE wave-generated orbital currents.
Facies 5: blanket of slightly calcareous fine to medium sand
Facies 5 is produced by an extensive blanket of slightly calcareous, fine to medium quartzose sand. The speckles seen on the sonographs in Facies 5 (Fig. 10) are attributed to small wave ripples and epifauna that cannot be resolved by side-scan sonar. This interpretation is verified by underwater photographs of small-scale ripples and epifauna taken at Dive site J (Fig. 6, 10) and by the homogeneity of the Facies 5 sediment samples.
The WSW–ENE crest orientation and bifurcation of the small-scale ripples seen in Facies 5 at Dive site J imply that SSE wave-generated orbital currents produce these.
Facies 6: coarse sediment patches
Any interpretation of Facies 6 is hampered by the lack of underwater photographs, diver observations, and sufficient sediment samples. The two sediment samples from Facies 6, a medium quartzose sand and a medium calcareous sand, suggest that Facies 6 represents medium sand. The rounded Facies 6 patches depicted in Fig. 10 may represent exposed saprolite (Glass 1977; Du Plessis and Glass 1991).
Modern subtidal energy regime
Acoustic doppler current profiler (ADCP) data collected off Miller’s Point and hydrodynamic model outputs indicate that bottom currents in the study area are generally weak, rarely exceeding 0.2 m s−1 (Coleman et al. 2021). This low-energy regime is reflected in the persistence of delicate sedimentary and biogenic structures across the seafloor. For example, the presence of fragile filter-feeding pinnid bivalves (Atrina squamifera) in Facies 4, along with unattached, free-living coralline algae (maerl) and crinoids (Comanthus wahlbergi) in Facies 3, suggests limited sediment reworking under typical conditions. These organisms, which rely on stable substrates and minimal sediment transport, are commonly found in low-energy settings (Day 1969; Branch and Branch 1981; Kilburn and Rippey 1982; Steneck 1986).
Evidence from a previous unpublished side-scan sonar survey conducted 3 years prior (Russell-Cargill 1983) supports the interpretation of a stable seafloor. A visual comparison of the earlier and present sonar data shows no significant changes in the distribution of acoustic facies, suggesting that the sedimentary environment has remained largely unchanged over that period.
However, the formation of wave ripples in Facies 2 indicates that the system is not entirely static. During episodic high-energy events, such as prolonged south-easterly gales in summer, wave-driven orbital currents can exceed thresholds for sediment transport, leading to ripple formation and the observed subtle seabed depression north-west of Roman Rock (Fig. 8). These features highlight the importance of transient hydrodynamic forcing in shaping the sedimentary fabric of the study area.
Sediment mixing
Flemming (1982, 2024) argued that sediment distribution patterns in False Bay can be explained by the sediment-mixing model of Folk and Ward (1957). According to this model, mixing between coarse and fine hydraulic populations follows predictable trends; namely, a well-sorted coarse population becomes finer, more positively skewed, and less well-sorted as fine sediment is introduced; conversely, a well-sorted fine population becomes coarser, more negatively skewed, and less well-sorted as coarse sediment is added.
Our observations of grain size and composition in the Roman Rock area support this interpretation. The quartzose sands of Facies 4 and 5 are less well-sorted than the calcareous sediments of Facies 2 and 3, and Facies 3 shows the clearest evidence of mixing. This facies contains end-member populations of coarse calcareous gravel and moderately to well-sorted fine to medium quartzose sand. Mixing likely occurs because the fine to medium quartzose sand is more easily entrained than is the coarser calcareous veneer. As bottom current velocities decrease, the finer quartzose sand settles onto the coarser substrate, producing the observed mixed textures. The extent of mixing depends on the intensity of bottom currents and bioturbation. Our sediment data, combined with acoustic facies interpretations and diver observations, indicate that this process is most active in Facies 3, where contrasting sediment types co-occur.
Although our findings align with the broader sedimentological framework described by Flemming (2024), particularly the mixing of quartzose and carbonate-rich sediments across False Bay, the Roman Rock area represents a distinct sedimentary environment shaped by unique geological features, including steep granite pinnacles, a narrow reef-trough system, and localised bathymetric gradients. These features influence local circulation patterns, with wave refraction and flow constriction enhancing sediment mixing at reef margins and in the adjacent channel.
Similar sediment mixing processes, driven by carbonate production, siliciclastic input, hydrodynamics and bathymetric controls, have been documented on the Lacepede Shelf, Australia (James et al. 1992), and the Santa Catarina Shelf, Brazil (Martins et al. 2005). Mount (1984) presented a conceptual model for mixed carbonate–siliciclastic systems based on examples from the Bahamas, Gulf of California, and elsewhere, highlighting how antecedent reefs, drowned valleys, and sand bodies focus sediment transport, modulate energy, and create mixing zones. These factors, combined with storm-driven reworking and density contrasts, shape the distribution of mixed sediments. The Roman Rock area, with its shallow reefs, dynamic wave climate, and interplay of relict quartzose sands and bioclastic sediments, exemplifies how small-scale geomorphic features drive fine-scale sediment mixing within a stable shelf framework.
Quaternary sedimentation
This section discusses the Quaternary sedimentary history of the study area, on the basis of literature on sea-level fluctuations and the probable relationships among the six sonograph facies.
During the Last Glacial Maximum (between 26,500 and 19,000 years ago), sea level fell by up to 130 m below the present level (Yokoyama et al. 2000; Compton et al. 2002; Clark et al. 2009; Cooper et al. 2018). The Cape Flats would have extended beyond the present-day entrance to False Bay, and the study area, apart from granite pinnacles, would have formed part of an extensive aeolian dune field deposited across the exposed shelf (Bowie 1966). Talus deposits derived from sandstone cliffs along the Swartberg range may also have contributed sediment (Rogers 2018). As sea level rose during the Flandrian transgression, it is likely that these Late Pleistocene sediments were reworked and redistributed by wave action across the study area.
This process continues today along the northern shore of False Bay, near Monwabisi Beach, where a 50-m-thick succession of Late Pleistocene sands is actively eroded and reworked by wave action (Flemming 1982; MacHutchon 2015). Barwis and Tankard (1983) identified four depositional facies in this succession, namely, beach, estuarine, wash-over fan, and aeolian, which were originally deposited during the Late Pleistocene, predating the onset of the most recent postglacial sea-level rise (Cooper et al. 2018). The aeolian sands, also recovered in boreholes north of this succession, are characterised by cross-bedded, slightly calcareous, moderately to well-sorted fine to medium quartzose sand (Hay 1981). Recent studies by Theron and Schoonees (2007), MacHutchon (2015), Fourie et al. (2015), and Kistner (2016) confirmed that this reworking process is ongoing, with wave action continuing to erode and redistribute these older sediments into the modern nearshore environment.
Although the Roman Rock and Monwabisi Beach areas are located in different parts of False Bay and have distinct geomorphological settings, their shared sedimentary characteristics, particularly the presence of moderately to well-sorted quartzose aeolian sands, suggest a common reworking process. These deposits are likely to reflect the redistribution of locally derived aeolian and shoreline sediments during the Flandrian transgression, forming palimpsest deposits within the modern shelf system.
Comparable relict and palimpsest sediments, where older aeolian or shoreline deposits are reworked and preserved in modern, low-energy, subtidal carbonate-dominated environments, have been described in a variety of high-energy shelf settings. On the US Atlantic shelf, studies by Swift et al. (1971, 1978) and Stubblefield et al. (1984) documented how former barrier islands and shoreface ridges, formed during earlier sea-level stages, were submerged and reshaped by wave and current action. Similar processes have been observed on the North Sea Shelf, where McManus (1975) described glacial and fluvial sediments reworked into marine settings. The Lacepede Shelf of southern Australia provides another example, where relict quartzose and carbonate sands are actively being reworked by modern waves and currents (James et al. 1992). On the Santa Catarina Shelf in southern Brazil, Martins et al. (2005) described a system where ancient dunes and shoreline sands were reworked into modern shelf deposits. These examples show that the quartzose sands at Roman Rock, even though originally deposited in an aeolian or shoreline environment, remain an active part of the modern sedimentary system. They represent palimpsest sediments, reworked and modified over time by ongoing hydrodynamic processes.
Following the submergence of the study area at the end of the Flandrian transgression, carbonate sedimentation became the dominant process. Bioclastic material from molluscs, cirripedes, coralline algae, and other carbonate-secreting organisms accumulated on top of the relict quartzose sands. However, the Roman Rock area remains an active mixing zone, where episodic wave events and bottom currents re-mobilise and redistribute both the relict quartzose and the newer bioclastic sediments. This dynamic reworking maintains a palimpsest seafloor, where the signatures of multiple depositional histories, i.e. aeolian, shoreline and carbonate, are preserved and continually modified by modern hydrodynamic processes.
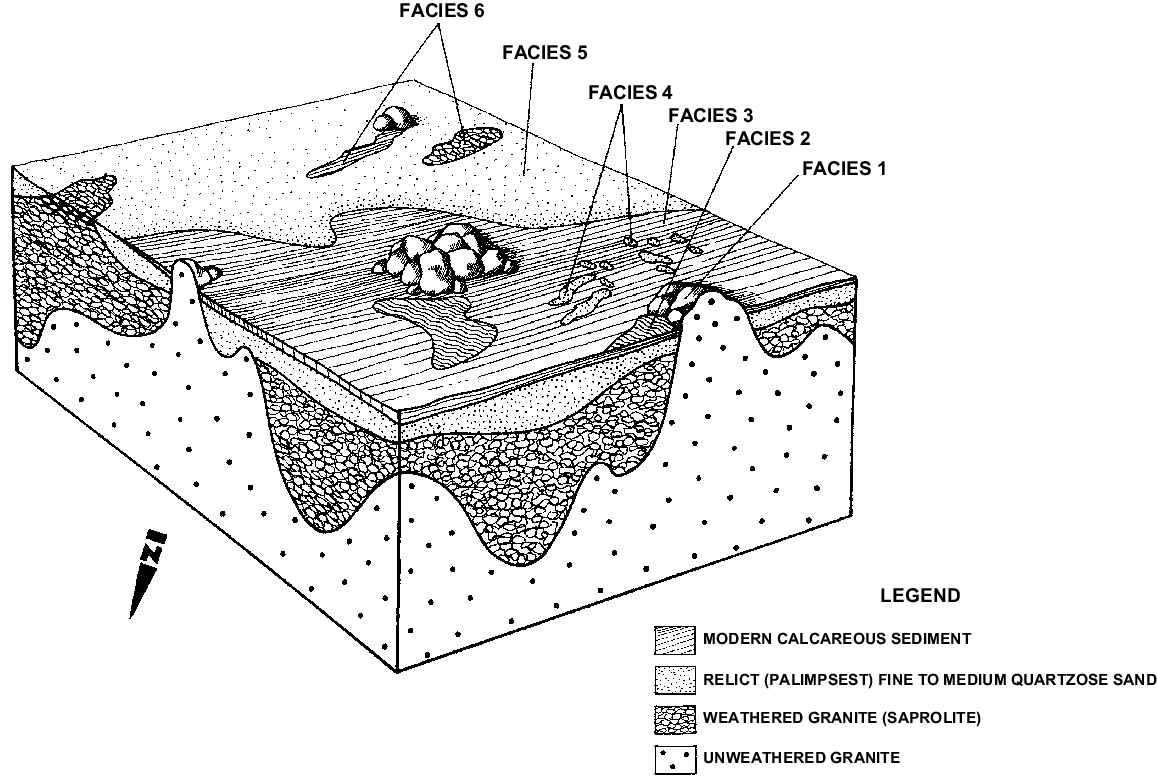
Fig. 18 illustrates the spatial relationships among the six acoustic facies. Coarse calcareous veneers (Facies 2 and 3) are patchily distributed over finer quartzose sands (Facies 4 and 5), whereas granite pinnacles (Facies 1) protrude through the sediment blanket. Facies 6 represents either isolated patches of calcareous sediment or exposed weathered granite saprolite. This configuration supports the interpretation of Roman Rock as a palimpsest system, where relict quartzose sands and modern bioclastic sediments are being actively mixed by wave and current processes, particularly around bathymetric highs, troughs, and reef margins. The model highlights how local bathymetry shapes sediment distribution and the development of distinct facies patterns.
Summary and conclusions
Our side-scan sonar survey of a 12-km2 area in the north-western corner of False Bay showed six distinct acoustic facies, interpreted using echosounder data, bottom samples, and SCUBA diver observations:
Facies 1 depicts Cape Granite Suite outcrops, matching onshore patterns, with lineaments reflecting the principal WNW–ESE joint direction.
Facies 2 is marked by stationary, long-crested, trochoidal wave ripples, which are likely to be formed by currents from south-easterly gales.
Facies 3 features an uneven grey tone of calcareous gravelly sand derived from marine organisms in the shallower western areas.
Facies 4 is expressed as cloud-like and tongue-like light patches, indicative of rippled quartzose sand patches breaking through the calcareous veneer.
Facies 5 is a light-toned blanket of rippled quartzose sand in deeper eastern regions.
Facies 6 consists of medium-grey patches within Facies 5, possibly representing coarse sediment, pending further confirmation.
Recent circulation models and observed epifaunal assemblages indicate that the study area is predominantly a low-energy subtidal environment, except near the reef that bisects it. Summer SSE gales are likely to generate high waves with strong orbital currents, driving the formation of wave ripples. Sediment analysis indicated mixing between calcareous and quartzose sediments, particularly in Facies 3. The quartzose sand is likely to have been reworked from Late Pleistocene aeolian deposits, making the subtidal sands ‘relict’ and ‘palimpsest’. The deposition of calcareous sediment over this palimpsest sand marks the onset of the modern subtidal environment.
This study has demonstrated the complexity of the seafloor geology off Simon’s Town, underscoring the value of bottom sampling, diver observations, and underwater photography in validating sonar imagery. It has also highlighted the need for future research to explore sediment dynamics further, especially considering grain composition, shape, and size and their impact on sediment movement. More comprehensive bottom current and wave data, along with advanced hydrodynamic models, are necessary for a quantitative analysis of sediment movement.
Authorship contributions
Andrew Terhorst provided conceptualisation, formal analysis, investigation, methodology, project administration and wrote the original draft. John Rogers contributed supervision, and review and editing of the written material.
Data availability
Interested readers can access the spatial and sedimentological data used in this study in the ‘Mendeley Data’ open data repository at https://data.mendeley.com/datasets/r6995krm6v/1. A preprint version of this article is available (Terhorst and Rogers 2025).
Declaration of funding
The original study was sponsored by the South African Navy (IMT projects MT-073 and OH-004) and by a MSc study grant awarded to Andrew Terhorst from the South African Foundation for Research Development (FRD).
References
Atkins GR (1970) Winds and current patterns in False Bay. Transactions of the Royal Society of South Africa 39(2), 139-148.
| Crossref | Google Scholar |
Backeberg NR, Reid DL, Trumbull RB, Romer RL (2011) Petrogenesis of the False Bay Dyke Swarm, Cape Peninsula, South Africa: evidence for basement assimilation. South African Journal of Geology 114(3-4), 335-352.
| Crossref | Google Scholar |
Bang ND (1967) Oceanography and a naval tragedy. Lantern 17(1), 84-87.
| Google Scholar |
Barwis JH, Tankard JA (1983) Pleistocene shoreline deposition and sea-level history at Swartklip, South Africa. SEPM Journal of Sedimentary Research 53(4), 1281-1294.
| Crossref | Google Scholar |
Belcher RW, Kisters AFM (2003) Lithostratigraphic correlations in the western branch of the Pan-African Saldania belt, South Africa: the Malmesbury Group revisited. South African Journal of Geology 106(4), 327-342.
| Crossref | Google Scholar |
Birch GF (1981) The karbonat-bombe: a precise, rapid and cheap instrument for determining calcium carbonate in sediments and rocks. Transactions of the Geological Society of South Africa 84(3), 199-203.
| Google Scholar |
Boocock C (1951) The structural features and inclusions of the Cape Peninsula granite. Transactions of the Royal Society of South Africa 33(2), 243-276.
| Crossref | Google Scholar |
Bosence DWJ (1976) Ecological studies on two unattached coralline algae from western Ireland. Palaeontology 19(2), 365-395.
| Google Scholar |
Clark PU, Dyke AS, Shakun JD, Carlson AE, Clark J, Wohlfarth B, Mitrovica JX, Hostetler SW, McCabe AM (2009) The last glacial maximum. Science 325(5941), 710-714.
| Crossref | Google Scholar | PubMed |
Coleman F, Diedericks GPJ, Theron AK, Lencart e Silva J (2021) Three-dimensional modelling of the circulation in False Bay, South Africa. African Journal of Marine Science 43(1), 95-118.
| Crossref | Google Scholar |
Compton JS, Mulabisana J, McMillan IK (2002) Origin and age of phosphorite from the Last Glacial Maximum to Holocene transgressive succession off the Orange River, South Africa. Marine Geology 186(3-4), 243-261.
| Crossref | Google Scholar |
Cooper JAG, Green AN, Compton JS (2018) Sea-level change in southern Africa since the Last Glacial Maximum. Quaternary Science Reviews 201, 303-318.
| Crossref | Google Scholar |
Daniels T, Fearon G, Vilaplana A, Hewitson B, Rautenbach C (2022) On the importance of wind generated waves in embayments with complex orographic features – a South African case study. Applied Ocean Research 128, 103355.
| Crossref | Google Scholar |
Darbyshire M (1966) The surface waters near the coasts of Southern Africa. Deep Sea Research and Oceanographic Abstracts 13, 57-81.
| Crossref | Google Scholar |
de Vos M, Vichi M, Rautenbach C (2021) Simulating the coastal ocean circulation near the Cape Peninsula using a coupled numerical model. Journal of Marine Science and Engineering 9(4), 359.
| Crossref | Google Scholar |
Du Plessis A, Glass JG (1991) The geology of False Bay. Transactions of the Royal Society of South Africa 47, 495-517.
| Google Scholar |
Dube LT (2002) Climate of Southern Africa. South African Geographical Journal 84(1), 125-138.
| Crossref | Google Scholar |
Duck RW, McManus J (1985) A sidescan sonar survey of a previously drawn-down reservoir: a control experiment. International Journal of Remote Sensing 6(5), 601-609.
| Crossref | Google Scholar |
Flemming BW (1976a) Rocky Bank – evidence for a relict wave-cut platform. Annals of the South African Museum 71, 33-48.
| Google Scholar |
Flemming BW (1976b) Side-scan sonar: a practical guide. The International Hydrographic Review 53, 65-92.
| Google Scholar |
Flemming BW (2019) Ripples and dunes: do flumes tell the whole story? In ‘MARID VI. Marine and River Dune Dynamics 2019. Book of Abstracts’, 1–3 April 2019, Bremen, Germany. (Eds A Lefebvre, T Garlan, C Winter) pp. 89–94. (Center for Marine Environmental Sciences, University Bremen and SHOM) Available at https://www.marum.de/Binaries/Binary18548/MARIDVI-Books-of-proceedings.pdf
Flemming BW (2024) Sedimentology of False Bay (Western Cape, South Africa): geological background information for the integrated environmental management of a physically confined coastal compartment. Journal of Coastal Conservation 28(6), 78.
| Crossref | Google Scholar |
Flemming BW, Thum AB (1978) The settling tube – a hydraulic method for grain size analysis of sands. Kieler Meeresforschungen Sonderheft 4, 82-95.
| Google Scholar |
Folk RL, Ward WC (1957) Brazos River bar [Texas]; a study in the significance of grain size parameters. Journal of Sedimentary Research 27(1), 3-26.
| Crossref | Google Scholar |
Foster MS (2001) Rhodoliths: between rocks and soft places. Journal of Phycology 37(5), 659-667.
| Crossref | Google Scholar |
Fourie JP, Ansorge I, Backeberg B, Cawthra HC, MacHutchon MR, van Zyl FW (2015) The influence of wave action on coastal erosion along Monwabisi Beach, Cape Town. South African Journal of Geomatics 4(2), 96-109.
| Crossref | Google Scholar |
Gentle RI (1973) Sidescan sonar in marine geological investigations of the South African continental shelf. South African Journal of Science 69(12), 360-367.
| Google Scholar |
Gerlach RW, Dobb DE, Raab GA, Nocerino JM (2002) Gy Sampling theory in environmental studies. 1. Assessing soil splitting protocols. Journal of Chemometrics 16(7), 321-328.
| Crossref | Google Scholar |
Grundlingh ML, Largier JL (1991) Physical oceanography of False Bay: a review. Transactions of the Royal Society of South Africa 47(4–5), 387-400.
| Google Scholar |
Hersbach H, Bell B, Berrisford P, Hirahara S, Horányi A, Muñoz-Sabater J, Nicolas J, et al. (2020) The ERA5 Global Reanalysis. Quarterly Journal of the Royal Meteorological Society 146(730), 1999-2049.
| Crossref | Google Scholar |
Ingram RL (1965) Facies maps based on the megascopic examination of modern sediments. Journal of Sedimentary Research 35(3), 619-625.
| Crossref | Google Scholar |
James NP, Bone Y, Von Der Borch CC, Gostin VA (1992) Modern carbonate and terrigenous clastic sediments on a cool water, high energy, mid-latitude shelf: Lacepede, southern Australia. Sedimentology 39(5), 877-903.
| Crossref | Google Scholar |
Jury MR (2020) Coastal gradients in False Bay, south of Cape Town: what insights can be gained from mesoscale reanalysis? Ocean Science 16(6), 1545-1557.
| Crossref | Google Scholar |
Kidd RB, Simm RW, Searle RC (1985) Sonar acoustic facies and sediment distribution on an area of the deep ocean floor. Marine and Petroleum Geology 2(3), 210-221.
| Crossref | Google Scholar |
Komar PD, Miller MC (1973) The threshold of sediment movement under oscillatory water waves. Journal of Sedimentary Petrology 43(4), 1101-1110.
| Google Scholar |
Komar PD, Miller CM (1975) On the comparison between the threshold of sediment motion under waves and unidirectional currents with a discussion of the practical evaluation of the threshold: reply. SEPM Journal of Sedimentary Research 45(1), 362-367.
| Crossref | Google Scholar |
Li Y, Yu Q, Gao S, Flemming BW (2020) Settling velocity and drag coefficient of platy shell fragments. Sedimentology 67(4), 2095-2110.
| Crossref | Google Scholar |
Linton DL (1955) The problem of tors. The Geographical Journal 121(4), 470-487.
| Crossref | Google Scholar |
MacHutchon M (2015) Geophysical monitoring of coastal erosion and cliff retreat of Monwabisi Beach, False Bay, South Africa. South African Journal of Geomatics 4(2), 80-95.
| Crossref | Google Scholar |
Mallory JK (1970) The bathymetry and microrelief of False Bay. Transactions of the Royal Society of South Africa 39(2), 109-112.
| Google Scholar |
Manikam SL, Green AN, Cooper A, Deacon G, Flemming B (2022) Development and preservation of transgressive sandy versus rocky shorelines: observations from the SE African Shelf. Geomorphology 419, 108485.
| Crossref | Google Scholar |
Manikam SL, Green AN, Flemming BW, Cooper A, Deacon G (2024) Bedform characteristics and implications for seafloor–bottom current interactions along the Wild Coast Shelf, South Africa. Continental Shelf Research 272, 105159.
| Crossref | Google Scholar |
Martins LR, Martins IR, Urien CM (2005) Sand Bodies of the Santa Catarina Inner Continental Shelf, Brazil. Gravel 3, 103-108.
| Google Scholar |
McManus DA (1975) Modern versus relict sediment on the continental shelf. Geological Society of America Bulletin 86(8), 1154-1160.
| Crossref | Google Scholar |
Mount JF (1984) Mixing of siliciclastic and carbonate sediments in shallow shelf environments. Geology 12(7), 432-435.
| Crossref | Google Scholar |
Müller G, Gastner M (1971) The ‘Karbonat-Bombe’, a simple device for the determination of carbonate content in sediment, soils, and other materials. Neues Jahrbuch Für Mineralogie-Monatshefte 10, 466-469.
| Google Scholar |
Pfaff MC, Logston RC, Raemaekers SJPN, Hermes JC, Blamey LK, Cawthra HC, Colenbrander DR, et al. (2019) A synthesis of three decades of socio-ecological change in False Bay, South Africa: setting the scene for multidisciplinary research and management. Elementa: Science of the Anthropocene 7, 32.
| Crossref | Google Scholar |
Rautenbach C, Barnes MA, de Vos M (2019) Tidal characteristics of South Africa. Deep-Sea Research – I. Oceanographic Research Papers 150, 103079.
| Crossref | Google Scholar |
Retief GF (1970) Sediment transport in Gordon’s Bay. Transactions of the Royal Society of South Africa 39(2), 163-182.
| Crossref | Google Scholar |
Salonen N, Rautenbach C (2021) Toward nearshore, bathymetry induced wave amplification in False Bay, South Africa. AIP Advances 11(7), 075209.
| Crossref | Google Scholar |
Shipley AM (1964) Some aspects of wave refraction in False Bay. South African Journal of Science 60(4), 115-120.
| Google Scholar |
Simpson ESW, du Plessis A, Forder E (1970) Bathymetric and magnetic traverse measurements in False Bay and west of the Cape Peninsula. Transactions of the Royal Society of South Africa 39(2), 113-116.
| Crossref | Google Scholar |
Steller DL, Riosmena-Rodriguez R, Foster MS, Roberts CA (2003) Rhodolith bed diversity in the Gulf of California: the importance of rhodolith structure and consequences of disturbance. Aquatic Conservation: Marine and Freshwater Ecosystems 13(S1), S5-s20.
| Crossref | Google Scholar |
Steneck RS (1986) The ecology of coralline algal crusts: convergent patterns and adaptative strategies. Annual Review of Ecology and Systematics 17(1), 273-303.
| Crossref | Google Scholar |
Stubblefield WL, Mcgrail DW, Kersey DG (1984) Recognition of transgressive and post-transgressive sand ridges on the New Jersey continental shelf. In ‘Siliciclastic Shelf Sediments’. (Eds RW Tillman, CT Siemers) pp. 2–23. (SEPM Society for Sedimentary Geology) doi:10.2110/csp.99.07.0053
Swift DJP, Stanley DJ, Curray JR (1971) Relict sediments on continental shelves: a reconsideration. The Journal of Geology 79(3), 322-346.
| Crossref | Google Scholar |
Swift DJP, Parker G, Lanfredi NW, Perillo G, Figge K (1978) Shoreface-connected sand ridges on American and European shelves: a comparison. Estuarine and Coastal Marine Science 7(3), 257-273.
| Crossref | Google Scholar |
Terhorst A, Rogers J (2025) Seafloor character of the Roman Rock area in False Bay, South Africa. EarthArXiv 2025, version 3 [Preprint, published 27 February 2025].
| Crossref | Google Scholar |
Theron AK, Schoonees JS (2007) Sand transport at and shoreline response to a breakwater attached to a large tidal pool at Monwabisi, Cape Town. Journal of the South African Institution of Civil Engineering 49(2), 2-9.
| Google Scholar |
Wainman CK, Polito A, Nelson G (1987) Winds and subsurface currents in the False Bay region, South Africa. South African Journal of Marine Science 5(1), 337-346.
| Crossref | Google Scholar |
Woelkerling WJ, Irvine LM, Harvey AS (1993) Growth-forms in non-geniculate coralline red algae (Coralliinales, Rhodophyta). Australian Systematic Botany 6(4), 277-293.
| Crossref | Google Scholar |
Yokoyama Y, Lambeck K, De Deckker P, Johnston P, Fifield LK (2000) Timing of the Last Glacial Maximum from observed sea-level minima. Nature 406(6797), 713-716.
| Crossref | Google Scholar | PubMed |