

Behavioural flexibility of the platypus (Ornithorhynchus anatinus) in response to changing water depth in a drought-affected Tasmanian stream
Simon Roberts A and Melody Serena B *
B *
A
B
Abstract
Many Australian freshwater species are well adapted to survive dry periods. However, the effect of drought on platypus behaviour has not previously been studied.
We investigated how the temporal and spatial distribution of platypus foraging activity varied during a cease-to-flow event lasting nearly 2 months along a normally perennial Tasmanian stream.
The frequency and duration of platypus activity in run, riffle and pool habitats was monitored using time-lapse cameras.
Total wetted area within the study area dropped to ~40% of its normal extent by the end of the cease-to-flow period. In response, platypus activity became more nocturnal and was increasingly concentrated in the best remaining aquatic habitat (pools); the mean duration of a foraging bout in a given pool was ~7 times greater during cease-to-flow when discharge was high. The likelihood of diurnal activity on any given day was significantly related to creek depth but not maximum daily air temperature.
The observed changes in platypus behaviour plausibly represent strategies to maximise foraging success and limit predation risk.
The platypus’s ability to survive extended cease-to-flow periods relies on its having access to sufficiently large and productive refuge habitats.
Keywords: Australian wildlife, behavioural monitoring, camera traps, drought impacts, foraging behaviour, habitat selection, Huon River, Kellaways Creek, monotreme, Ornithorhynchidae, time-lapse cameras.
Introduction
Severe drought can function as a major direct or indirect driver of mortality of freshwater vertebrates, including species that breathe air and can travel across land (Kinlaw 2004; Purcell et al. 2017; Deppe et al. 2024). Even in places where surface moisture remains available, a reduction in water level may affect behaviours related to foraging (Martínez-Abraín et al. 2020) or emigration (Deppe et al. 2024). Although Australian freshwater species are generally well adapted to recover following even protracted dry periods (Bond et al. 2008; Hansen et al. 2024), substantial drought can reduce population abundance and even lead to their local extirpation (Bond and Lake 2005). Detailed knowledge of how aquatic animals respond behaviourally to drying habitats is needed to develop and maintain effective drought refuges, identify populations that are likely to be at risk during extended dry periods, optimise the release of water from manmade storages to help maintain drought-affected populations, and identify the circumstances when rescuing individuals during cease-to-flow events may be warranted.
Fossil evidence suggests that the modern platypus (Ornithorhynchus anatinus) may have been extant for at least 3.8 million years (Archer et al. 1978). Adaptations that have plausibly contributed to the platypus’s capacity to withstand drought over this very long time frame include the fact that both sexes may survive and breed when >20 years old in the wild (Grant 2004; Serena et al. 2024). It is also a habitat generalist that successfully occupies a wide variety of both lotic and lentic water bodies (Grant and Temple-Smith 2003). At a finer spatial scale, the platypus feeds on a broad range of benthic insect larvae and other aquatic macroinvertebrates occupying shallow riffles as well as edge habitats and pools (Faragher et al. 1979; McLachlan-Troup et al. 2010; Marchant and Grant 2015; Hawke et al. 2022), and appears to be quite non-selective in its choice of prey taxa (Marchant and Grant 2015; McLachlan-Troup et al. 2020). The platypus is also quite vagile: adults have been documented to travel up to 10.4 km in a single overnight period (Serena et al. 1998) and >15 km (Gardner and Serena 1995) or nearly 19 km (Bino et al. 2018) over a period of a few weeks, thereby improving the likelihood that animals know where suitable drought refuges are located and can access them in an expeditious manner. The platypus is also capable of leaving the water when required and travelling across dry land, including relatively challenging terrain such as a rock cliff and knoll rising 35–40 m above a river channel (Musser et al. 2024).
In response to declining availability of surface water, non-volant aquatic vertebrates may attempt to relocate (or at least allocate more foraging effort) to deeper sites, or aestivate until conditions become more suitable (e.g. Davey et al. 2006; Ruiz-Olmo et al. 2007; Roe and Georges 2008; Purcell et al. 2017; Archdeacon et al. 2024; Deppe et al. 2024). Even though a platypus may sometimes remain inactive in a burrow for a few days in the colder months of the year, there is no evidence that this species can aestivate to survive drought (Serena 1994). It would therefore not be surprising to find that the spatial foraging patterns of platypus change during unusually dry conditions. However, apart from occasional records of dead individuals occurring near recently desiccated river habitats (Serena and Williams 2010; Hawke et al. 2024; Serena et al. 2025) and the known persistence of some populations in water courses subject to lengthy cease-to-flow periods (e.g. Grant 2007), virtually nothing is known about the impact of drought on platypus activity.
To help fill this gap in knowledge, we used time-lapse cameras to monitor platypus activity in a stream reach comprising both pools and shallower riffle and run habitats during an unusually dry summer–autumn period in south-eastern Tasmania. In particular, we aimed to test the following two hypotheses:
Platypus activity becomes increasingly localised in pool habitats as creek depth (along with wetted area) declines.
Platypus activity becomes increasingly nocturnal as creek depth declines.
We also investigated how daily maximum air temperature varied during the study period to ascertain the extent to which ambient temperature, as opposed to creek depth, may have contributed to variation in platypus behaviour. In addition, platypus activity in the study area continued to be monitored at pools after normal base flow recommenced in the second half of 2024, enabling the trajectory of change in post-drought platypus activity to be characterised.
Materials and methods
Study area and local climate
Kellaways Creek is a reliably flowing fourth-order tributary (calculated using the Strahler method; Ranalli and Scheidegger 1968) of the lower Huon River, located ⁓30 km south-west of Hobart, Tasmania. The catchment upstream of the study area (⁓50 km2) is a steep-sided valley, dominated by native forest, with some areas of cleared pasture and rural habitation. Water quality in both winter and summer is generally characterised by very low turbidity, low nutrient concentrations and low electroconductivity (≤300 μS cm−1) (Bobbi 1998); electroconductivity in a pool sampled ⁓200 m upstream of the study area on 24 February 2024 (when flow had atypically ceased) was ~850 μS cm−1 (S. Roberts, unpubl. data), i.e. still well below the value of 1500 μS cm−1 deemed to mark the upper limit of acceptable electroconductivity for most Australian freshwater ecosystems (Australia and New Zealand Environment and Conservation Council 1992). The study reach (235 m long, elevation ⁓60 m) is well shaded through most of the day by riparian vegetation and bounded by pools (P1 at upstream end; P2 at downstream end), each ~30 m long and defined on one bank by bedrock. The pools are linked by a riffle (R1, adjoining P1, 65 m long) and run (R2, adjoining P2, 110 m long), which in turn are separated by a small pool and adjoining boulder cascade. The creek channel is dominated by cobbles and typically 6–10 m wide, reaching a depth of 10–15 cm in riffles and up to 1.5 m in pools (Fig. 1; also see Supplementary Fig. S1).
Relative location of pools P1 and P2, riffle R1 and run R2 in the study area (lengths and wetted widths during normal base flow shown to scale). Arrows mark where cameras were positioned and the direction they pointed. Location of the study area in Tasmania is marked by a dot on the map.
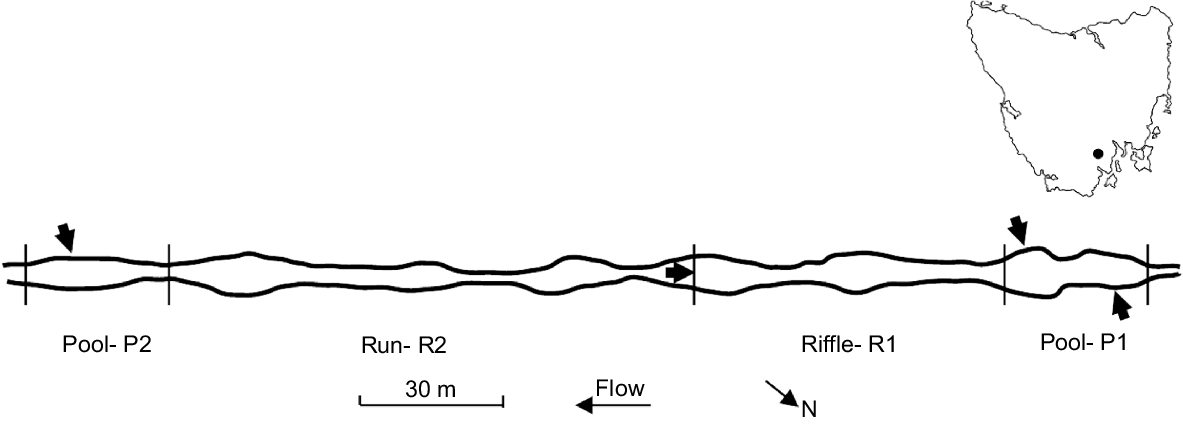
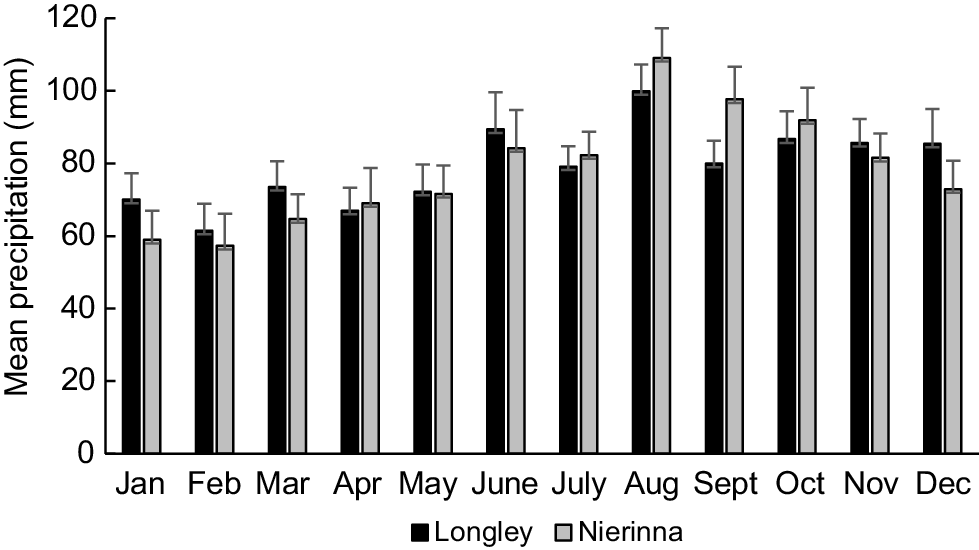
Three Australian Bureau of Meteorology (BOM) weather stations are located within 5 km of the Kellaways Creek catchment, and include Grove (station 094220), Nierinna (094185) and Longley (094151). Rainfall at Nierinna (elevation = 167 m, mean annual precipitation = 934 mm) and Longley (elevation = 358 m, mean annual precipitation = 943 mm) are particularly likely to influence creek flow because they are situated to the north-east in close proximity to most of the catchment headwaters. Mean monthly rainfall in this region is generally lowest in February, equating to 53% (Nierinna, 57 mm) or 62% (Longley, 61 mm) of mean rainfall in the wettest month, August (Fig. 2).
Assessing environmental variables
Maximum daily air temperature in the study area was extrapolated from corresponding values recorded at Grove, which is located at very nearly the same elevation (65 m). Maximum air temperature at Grove from 1 January to 30 June 2022 was very highly correlated with the corresponding daily air temperature recorded in the study area by a Hobo data logger positioned next to the creek (Roberts and Serena 2024) (Pearson r = 0.926, d.f. = 174, P < 0.001). However, maximum air temperature at Grove exceeded that measured at the highly shaded Kellaways Creek site on 96% of days, with a mean difference of 3.4°C (±0.2). Maximum daily air temperature along Kellaways Creek in the current study period was therefore estimated by subtracting 3.4°C from the corresponding Grove daily air temperature.
A standard daily depth measurement at pool P1 was obtained at noon by using images of a graduated linear depth gauge recorded by a time-lapse camera. Excluding periods affected by extended drought or substantial post-storm run-off, depth at the P1 gauge is typically ⁓50–60 cm throughout the year. The relationship of the P1 depth measurement to relative creek discharge was established on the basis of daily photos recorded at the boulder cascade located between riffle R1 and run R2. Four discharge categories were defined for the purpose of this study: high (depth = 57–65 cm at P1 depth gauge, 100% of flow over cascade is turbulent, 100% of small head pool surface area above the cascade is wetted), moderate (depth = 48–56 cm, ⁓50% of flow turbulent, ⁓80% of pool wetted), low (depth = 39–47 cm, ⁓10% of flow turbulent, ⁓65% of pool wetted) and no discharge or cease-to-flow (depth = 30–38 cm, ≤55% of pool wetted).
Wetted width and wetted area (as defined below) were measured along the length of the study area by using images recorded by a camera drone (DJI Mavic Air model, see https://www.dji.com/support/product/mavic-air) deployed above the channel at a height of 20 m on 1 April 2024 (when Kellaways Creek had ceased to flow, depth at P1 gauge = 35 cm) and 7 June 2024 (when typical base flow had resumed, depth at P1 gauge = 57 cm). Before each drone flight, Kincrome permanent jobsite markers were used to mark the boundary points of consecutive 5-m segments on emergent rocks along the length of the study area. To assist accurate estimation of stream width, a 150-mm square white tile was positioned on the bank at each marked point. Photos capturing images of sequential channel segments (each ≥20 m long and stretching from bank to bank) were taken at 10-m intervals. A line perpendicular to the longitudinal orientation of the channel was then drawn across surface water, including marginal pools, visible in the photos at each marked point. Each line was measured at the same zoom magnification by using an online ruler, and converted to metres by using a conversion factor based on tile size. The wetted area within each 5-m segment was calculated on the basis of mean wetted width at the upstream and downstream ends of the segment.
Depth was measured manually at mid-channel at the same points as those used to estimate wetted width, using a standard straight-edge metre stick. Measurements were recorded along the length of riffle R1 and run R2 on 26 March 2024 (when the creek had ceased to flow, depth at P1 gauge = 33 cm) and 30 May 2024 (when normal base flow had more or less resumed, depth at P1 gauge = 53 cm).
Monitoring platypus activity
Following protocols outlined in Roberts and Serena (2024), platypus activity was monitored using time-lapse cameras. Nocturnal images were recorded at 10-s intervals by Cuddeback Color Model 1279 cameras. Diurnal images were recorded at 4-s intervals by two Brinno camera models, including the TLC300 fitted with an ATH120 weather-resistant housing and the MAC200DN.
For the purpose of nocturnal monitoring, single cameras were positioned at the downstream end of pools P1 or P2 to record platypus activity (quantified as the frequency of discrete ‘events’ separated by at least 5 min of no recorded activity: Roberts and Serena 2024). For the purpose of diurnal monitoring, cameras were respectively positioned to record when a platypus entered or exited from pool P1 (utilising two cameras) or P2 (utilising one camera) or moved from riffle R1 to run R2 or vice versa (utilising a camera placed at the intervening boulder cascade). This enabled the movement of an animal from one habitat segment to the next to be tracked with confidence. Although different individuals could not be physically distinguished, the travel pattern of a given animal through the study area could be reliably inferred even on the rare occasions (representing <1% of activity sequences) when more than one platypus was present, on the basis of when and where each animal was first detected and whether it was travelling upstream or downstream. Along with recording the frequency of diurnal platypus activity events in P1, P2, R1 or R2, camera-image time stamps were used to estimate the duration of diurnal platypus activity in each segment. In a bid to maintain synchronicity of camera time clocks, each was reset prior to deployment and checked for accuracy (against a mobile phone clock) at the end of each deployment (4–5 days). In practice, each Brinno camera consistently lost 1–5 s day−1, with a maximum discrepancy of 19 s (although most typically ⁓14 s) developing between neighbouring cameras by the end of a given deployment period. Diurnal activity durations were calculated only on days when cameras were successfully deployed at the four standard monitoring points from at least 30 min before sunrise to at least 30 min after sunset; events when the onset or end of activity could not be pinpointed unequivocally (mainly because of low ambient light) were excluded from analysis. The duration of nocturnal events could not be estimated accurately owing to the more limited size of camera viewing areas at night than during daylight hours (Roberts and Serena 2024).
Analysing platypus activity
Procedures to review time-lapse images paralleled those of Roberts and Serena (2024). The Brinno cameras automatically convert time-lapse sequences into MP4 (TLC300) or AVI (MAC200DN) video files, which were reviewed using freeware program SMPlayer (ver. 23.6.0, see https://www.smplayer.info) at 30 frames s−1 (2 h of real time reviewed in 1 min). Nocturnal photos were reviewed using the slideshow facility of the freeware program FastStone Image Viewer (ver. 7.25, see https://www.faststone.org/) at ~6 frames s−1 (1 h of real time reviewed in 1 min).
Statistical analysis
Statistical tests were conducted using SYSTAT 13.0, with significance set at 0.05. A previous camera-based study of platypus activity conducted over a 12-month period unaffected by drought in the same section of Kellaways Creek confirmed that the mean number of diel events recorded in consecutive bimonthly periods did not differ significantly in the first half of the year, e.g. owing to variation in day length (Roberts and Serena 2024). In the current study, non-parametric Kruskal–Wallis tests and post hoc Dwass–Steel–Critchlow–Fligner pairwise comparisons (Douglas and Michael 1991) were used to test whether the frequency of daily platypus events (which was often zero, resulting in marked non-normality) differed significantly among the four creek depth classes in the period from March through June, when monitoring was conducted both diurnally and nocturnally in all four creek segments. Non-parametric Mann–Whitney tests were used to determine whether the frequency of diurnal and nocturnal events in pool habitats differed significantly for each depth class. Binary logistic regression served to test the strength of the relationship between the occurrence (or not) of daily events in pool habitats and (respectively) creek depth and maximum daily air temperature from late January (when diurnal monitoring began) through the end of warm, dry weather in March; the possibility that depth and temperature might vary in a collinear manner in this period was tested using Pearson correlation. Pearson correlation was also used to test the strength of the relationship between maximum daily air temperature at the Grove weather station and the corresponding air temperature recorded in the study area. Single-factor ANOVA and post hoc Tukey’s pairwise comparisons were used to determine whether the duration of diurnal events at either pools or riffle-run habitats differed significantly among creek depth classes from late January through June, and separate variance Student‘s t-tests were used to test whether mean event duration differed significantly between the two pools or the riffle and run segments. Means are reported ±1 standard error.
Results
Rainfall
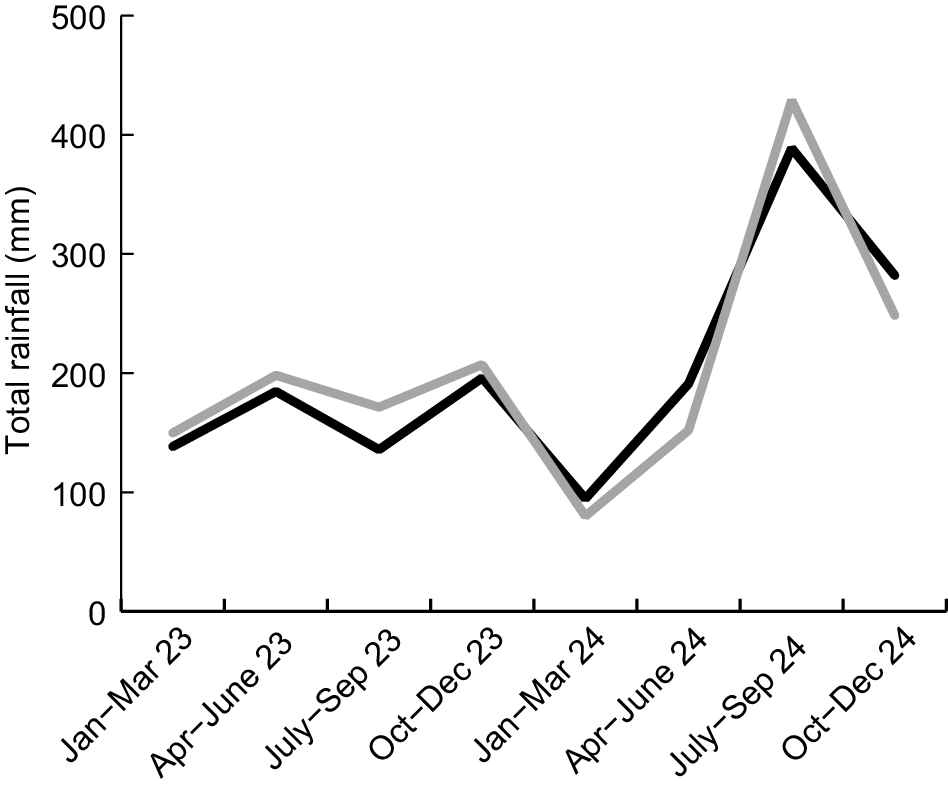
Our study mainly focused on creek conditions and platypus behaviour in the period from January to June 2024, with less intensive monitoring conducted from July to December 2024. Total antecedent rainfall in 2023 was well below normal at both Nierinna (78% of the long-term average) and Longley (69%). Dry conditions intensified from January to March 2024, when total rainfall at Nierinna and Longley was respectively 44 and 46% of long-term mean values. This equates to the lowest decile of long-term BOM records for the area, thereby officially qualifying as a meteorological drought event in Australia (Gibbs and Maher 1967). Conditions eased to some extent (although remaining unseasonably dry) from April to June, when Nierinna and Longley rainfall was respectively 68 and 84% of long-term mean values. By contrast, the amount of rain falling from July to September was well above average (rainfall at Nierinna and Longley = 131 and 150% of respective long-term mean values), with rainfall from October to December being slightly above average (rainfall at Nierinna and Longley = 102 and 110% of respective long-term mean values) (Fig. 3).
Creek depth and wetted area
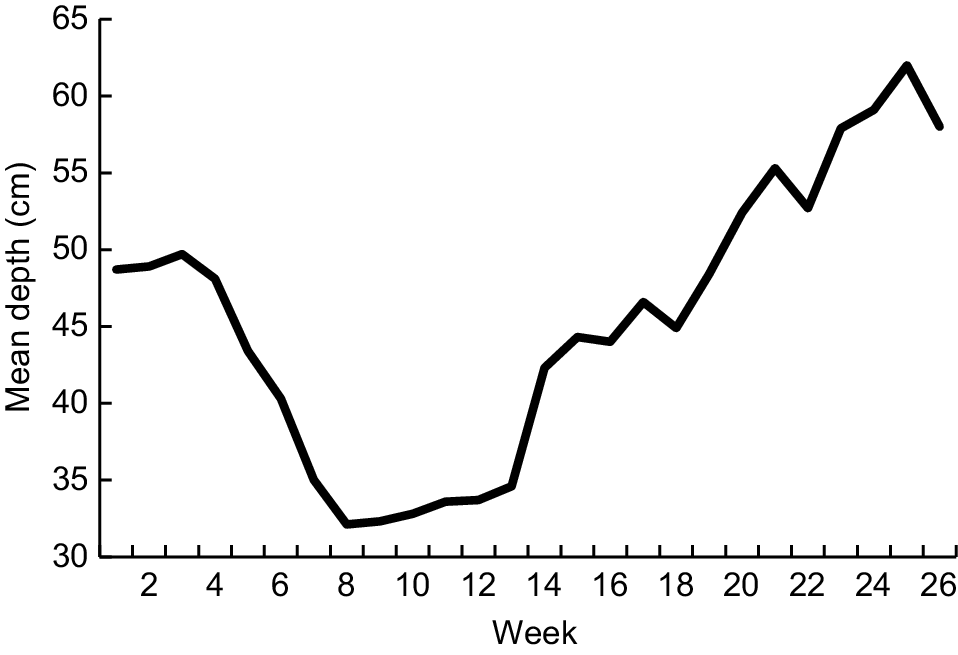
Depth at the P1 gauge was measured on 93% of days from 1 January to 30 June 2024. Discharge was deemed to be relatively high (as indicated by depth = 57–65 cm) on 15% of days in this period, with moderate discharge (48–56 cm), low discharge (39–47 cm) and cease-to-flow (30–38 cm) being recorded respectively on 35, 23 and 27% of days. In practice, flow was moderate to high on nearly all days at both the beginning (1–29 January) and end (8 May−30 June) of the 6-month period, with cease-to-flow prevailing for just over 7 weeks (11 February−2 April) and the remaining two intervals being dominated by low flow (Fig. 4). Thereafter, discharge was deemed to be high from 1 to 10 July. Depth was not assessed from 11 July to 25 September because of very high forecast or actual flow caused by storm run-off (starting with 111 mm of rain being recorded at both Longley and Nierinna stations from 15 to 17 July). On the basis of measurements recorded on 92% of days from 26 September to 31 December, discharge at the P1 gauge was classified as moderate or high on 29 and 71% of days respectively.
Mean weekly water depth at site P1 from 1 January to 30 June 2024. See Materials and methods for details about how depth was recorded.
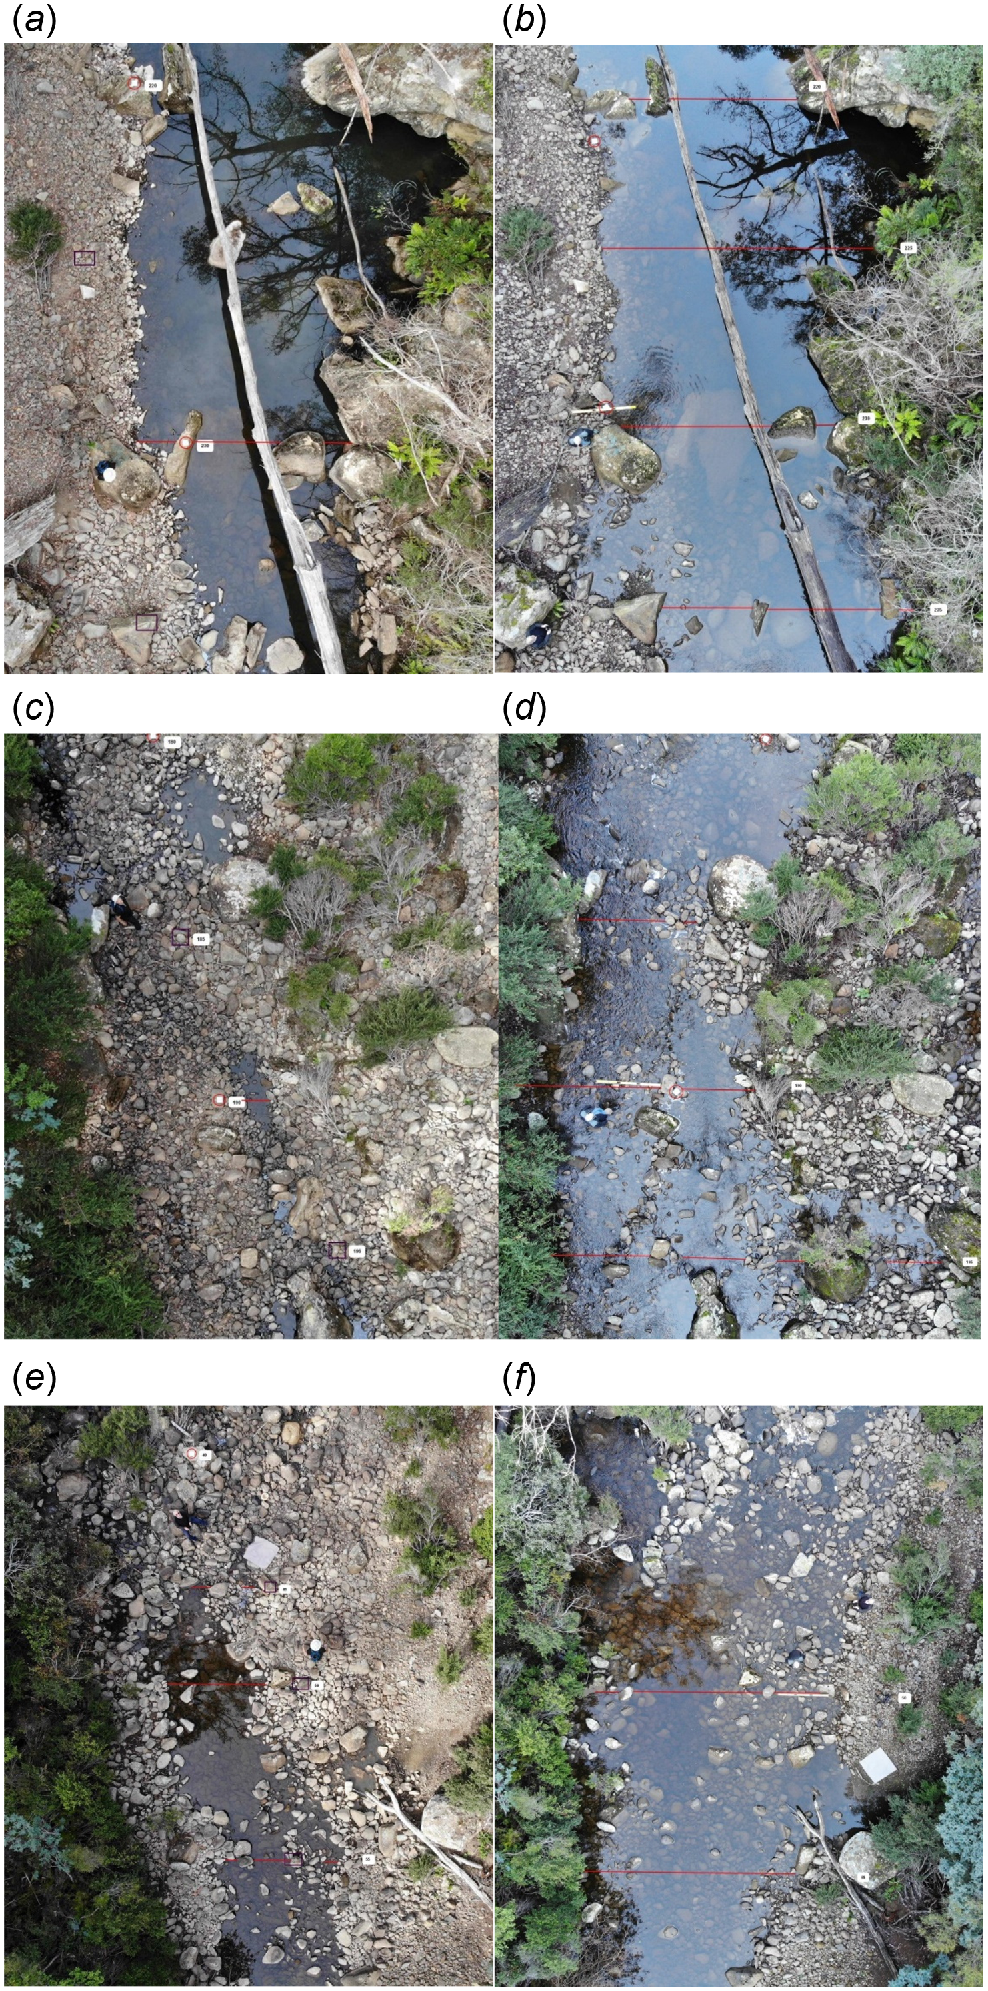
The wetted width of riffle, run and pool habitats increased significantly from 1 April (at nearly the end of the cease-to-flow period) to 7 June (when discharge had recovered). The mean depth of run and riffle habitats towards the end of the cease-to-flow period (in late March) was also significantly less than that in late May, when flow was deemed to be moderate (Table 1). In absolute terms, total wetted area in the study area more than doubled from 1 April (578 m2) to 7 June (1407 m2), with 79% of the additional wetted area occurring in run or riffle habitats (Fig. 5). Put differently, pool habitats (which comprised 26% of the length of the study area) were associated with 54% of total wetted area at the end of the cease-to-flow event and 32% of total wetted area after flow had resumed in early June. The channel mid-point was dry in 71% of run or riffle segments (each 5 m long) when flow had ceased in late March. The same was true for only 7% of segments measured after flow had resumed in late May, in all cases at points where surface flow followed a braided pathway or meandered from one side of the channel to the other.
Variation in the wetted width of Kellaways Creek over the course of this study. (a) Site P1, 1 April 2024. (b) Site P1, 7 June 2024. (c) Site R1, 1 April 2024. (d) Site R1, 7 June 2024. (e) Site R2, 1 April 2024. (f) Site R2, 7 June 2024. Depth at P1 gauge = 35 cm on 1 April, 57 cm on 7 June. Wetted widths shown as red lines, white tiles used for calibration are circled in red.
| Measurement | N | Cease-to-flow | Moderate to high discharge | t | P | |
|---|---|---|---|---|---|---|
| Pool wetted width (m) | 17 | 4.6 ± 0.6 (0.3–8.8) | 6.1 ± 0.5 (2.8–10.6) | 4.915 | <0.001 | |
| Run and riffle wetted width (m) | 42 | 1.6 ± 0.2 (0–4.5) | 4.7 ± 0.3 (1.0–9.3) | 9.125 | <0.001 | |
| Run and riffle depth (cm) | 42 | 3.8 ± 1.2 (0–30) | 11.8 ± 1.2 (0–30) | 9.966 | <0.001 |
Mean ± s.e. (range). See Materials and methods for when and how measurements were recorded.
Maximum daily air temperature
Maximum daily air temperature could be estimated in the study area on all but 1 day (17 April) from 1 January to 30 June 2024. Temperatures ranged from 5.1 to 32.4°C, with the mean monthly maximum peaking in January and February (20.8°C) and declining to its lowest value in June (8.3°C) (Table 2). On the basis of observations made in captivity, Booth and Connolly (2008) reported that a platypus becomes noticeably lethargic when ambient temperature exceeds 29°C and may die of heat stress if temperature exceeds 34°C. In the Kellaways Creek study area, air temperature exceeded 29°C on four occasions in the first 6 months of 2024 (2.2%), including 2 days in January and 1 day each in February and March.
| Month | N days | Mean ± s.e. (range) | N days >29°C | |
|---|---|---|---|---|
| January | 31 | 20.8 ± 0.8 (14.2–31.9) | 2 | |
| February | 29 | 20.8 ± 0.8 (14.1–32.4) | 1 | |
| March | 31 | 18.6 ± 0.8 (10.2–31.3) | 1 | |
| April | 29 | 14.6 ± 0.5 (10.0–20.5) | 0 | |
| May | 31 | 11.6 ± 0.5 (6.5–17.4) | 0 | |
| June | 30 | 8.3 ± 0.4 (5.1–11.9) | 0 |
See Materials and methods for how temperature was calculated.
Platypus activity (number of daily events)
Creek depth and the number of diurnal platypus events were both recorded on 89% (P1), 91% (P2), 80% (R1) and 80% (R2) of the 122 days from 1 March to 30 June 2024. Creek depth and the number of nocturnal platypus events were recorded at both P1 and P2 on 91% of the 113 days from 10 March to 30 June.
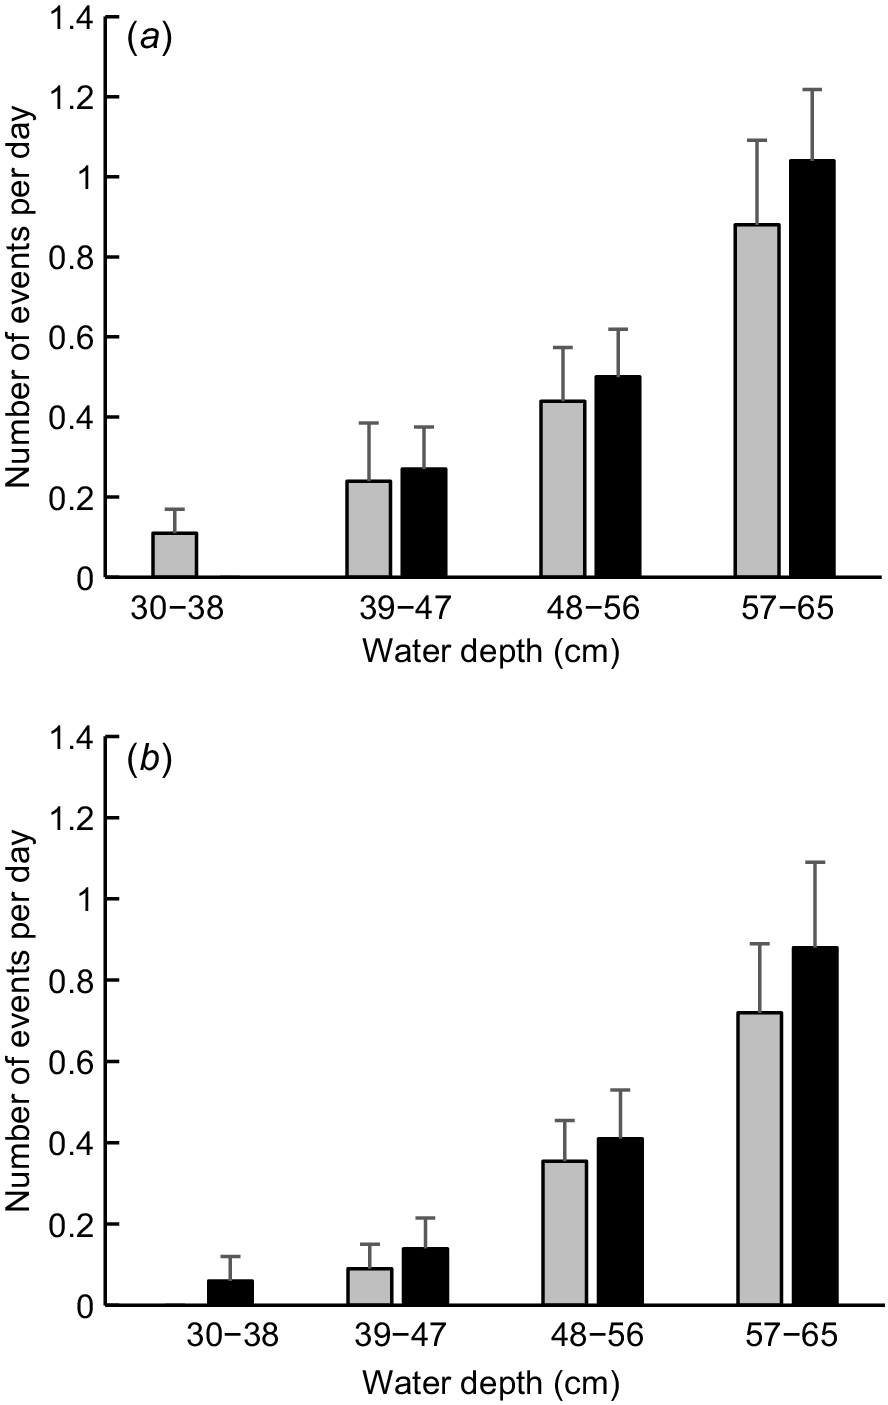
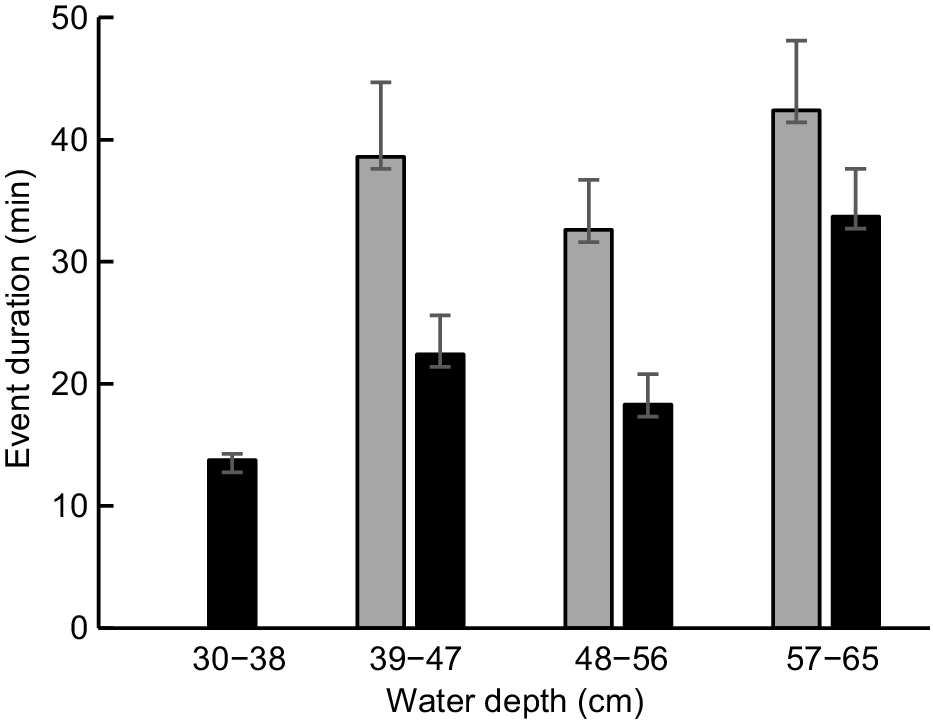
The mean daily number of diurnal platypus events increased monotonically in all parts of the study area as creek depth and discharge increased (Fig. 6). The maximum number of daily events on days when flow had ceased was 0 (P2, R2) or 1 (P1, R1), as compared with 3 (P2, R2) or 4 (P1, R1) on days when discharge was high. The frequency of diurnal platypus events varied significantly among the four depth classes at P1 (Kruskal–Wallis test statistic = 16.801, P = 0.001), P2 (K–W test statistic = 31.184, P < 0.001), R1 (K–W test statistic = 17.121, P = 0.001) and R2 (K–W test statistic = 19.948, P < 0.001). At both pools, post hoc pairwise comparisons indicated that the frequency of diurnal events on days assigned to the two shallowest depth classes did not vary significantly, with the same being true for event frequency on days assigned to the two greatest depth classes. However, the frequency of diurnal events associated with the lower half and upper half of the depth range differed significantly from each other. In the case of run and riffle habitats, diurnal event frequencies differed significantly for all paired depth classes except for the two greatest (Table 3).
Mean number of diurnal events at different water depths in four creek segments from March to June 2024. Error bars show s.e. See Materials and methods for segment descriptions and how depth was recorded. (a) P1 (grey, n = 27, 25, 32, 25); P2 (black, n = 28, 26, 32, 25). (b) R2 (grey, n = 19, 22, 31, 25); R1 (black, n = 18, 22, 32, 25).
| Group comparison | P | ||||
|---|---|---|---|---|---|
| P1 | P2 | R1 | R2 | ||
| 1 v. 2 | 1.000 | 0.793 | <0.001 | <0.001 | |
| 1 v. 3 | <0.001 | <0.001 | <0.001 | <0.001 | |
| 1 v. 4 | 0.030 | 0.004 | <0.001 | <0.001 | |
| 2 v. 3 | <0.001 | <0.001 | <0.001 | <0.001 | |
| 2 v. 4 | 0.030 | 0.023 | <0.001 | <0.001 | |
| 3 v. 4 | 0.274 | 0.664 | 0.999 | 0.664 | |
Group 1, depth = 30–38 cm; Group 2, 39–47 cm; Group 3, 48–56 cm; Group 4, 57–56 cm. See Fig. 6 for sample sizes. Significant P-values (P < 0.05) indicate that groups differ significantly.
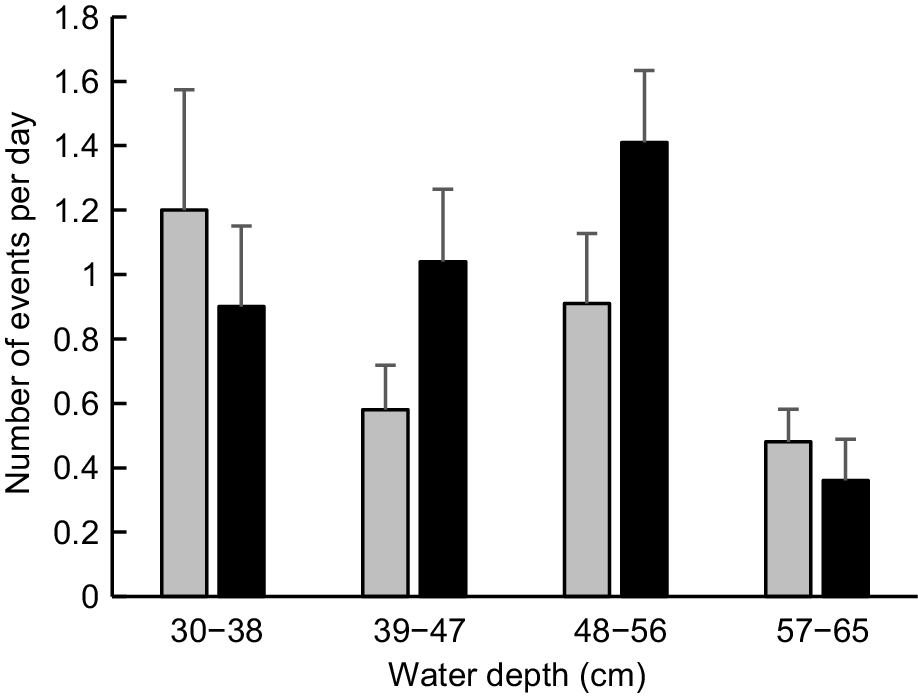
In contrast to the findings for diurnal events, the frequency of nocturnal events at pools reached its lowest level when water was deepest in the creek (Fig. 7). The maximum number of nocturnal events recorded on days when flow had ceased was 7 (P1) and 4 (P2), as compared with 1 (P1) and 2 (P2) on days when discharge was high. The frequency of nocturnal events differed significantly among depth classes at P2 (K–W test statistic = 13.259, P = 0.004) but not at P1 (K–W test statistic = 2.656, P = 0.448). Post hoc pairwise comparisons indicated that the frequency of nocturnal events recorded at P2 when gauged depth exceeded 56 cm was significantly less than at depths of 39–47 cm (P = 0.013) or 48–56 cm (P < 0.001); all other pairwise comparisons were not significant (P > 0.100). After combining event data for both pools, the frequency of nocturnal events significantly exceeded that of diurnal events for each of the three lowest depth classes, despite the fact that platypus images would undoubtedly have been recorded somewhat less effectively at night because of lower visibility and consistently longer recording intervals. The converse was true (i.e. the frequency of diurnal events significantly exceeded that of nocturnal events) on days when gauged depth exceeded 56 cm and creek discharge was accordingly deemed to be high (Table 4).
Mean number of nocturnal events at different water depths in pools from March to June 2024. Error bars show s.e. See Materials and methods for pool descriptions and how depth was recorded. P1 (grey, n = 20, 26, 32, 25); P2 (black, n = 20, 26, 32, 25).
| Depth class (cm) | Diurnal | Nocturnal | U | P | |
|---|---|---|---|---|---|
| 30–38 | 0.06 ± 0.03 (0–1, 55) | 1.05 ± 0.22 (0–7, 40) | 514.0 | <0.001 | |
| 39–47 | 0.26 ± 0.09 (0–3, 51) | 0.81 ± 0.13 (0–4, 52) | 844.0 | <0.001 | |
| 48–56 | 0.47 ± 0.09 (0–3, 64) | 1.16 ± 0.16 (0–5, 64) | 1411.0 | 0.001 | |
| 57–65 | 0.96 ± 0.14 (0–4, 50) | 0.42 ± 0.08 (0–2, 50) | 1645.5 | 0.003 |
Values are means ± s.e. (range, N).
Daily depth at the P1 gauge was significantly related to whether or not diurnal platypus activity was recorded at pools in the dry period extending from 27 January to 31 March 2024 (n = 53 days sampled, log-likelihood χ2 = 11.100, P = 0.001, McFadden’s R2 = 0.176). By contrast, no relationship was evident between maximum daily air temperature and diurnal platypus activity recorded at pools over the same period (n = 53 days, log-likelihood χ2 = 0.013, P = 0.908, McFadden’s R2 = 0.000). Depth at the P1 gauge was not significantly correlated with maximum daily temperature on days when cameras were deployed in this period (Pearson r = −0.171, P = 0.218).
Platypus activity (event duration)
The duration of 210 diurnal events was estimated from 27 January to 30 June (59 events at P1; 70 at P2; 45 at R1; 36 at R2). Although mean event duration at P1 exceeded that at P2, the difference was not significant (P1, 29.7 min ± 4.8; P2, 19.9 min ± 2.8; t = 1.749, d.f. = 94.05, P = 0.084). Accordingly, the two data sets were combined before determining whether event duration at pools differed by depth class. By contrast, mean event duration at R2 was significantly greater than at R1 (R1, 26.3 min ± 2.4; R2, 38.4 min ± 3.3; t = 2.964, d.f. = 65.71, P = 0.004). The data sets for R1 and R2 were therefore analysed separately to determine whether event duration at riffle or run habitats differed by depth class.
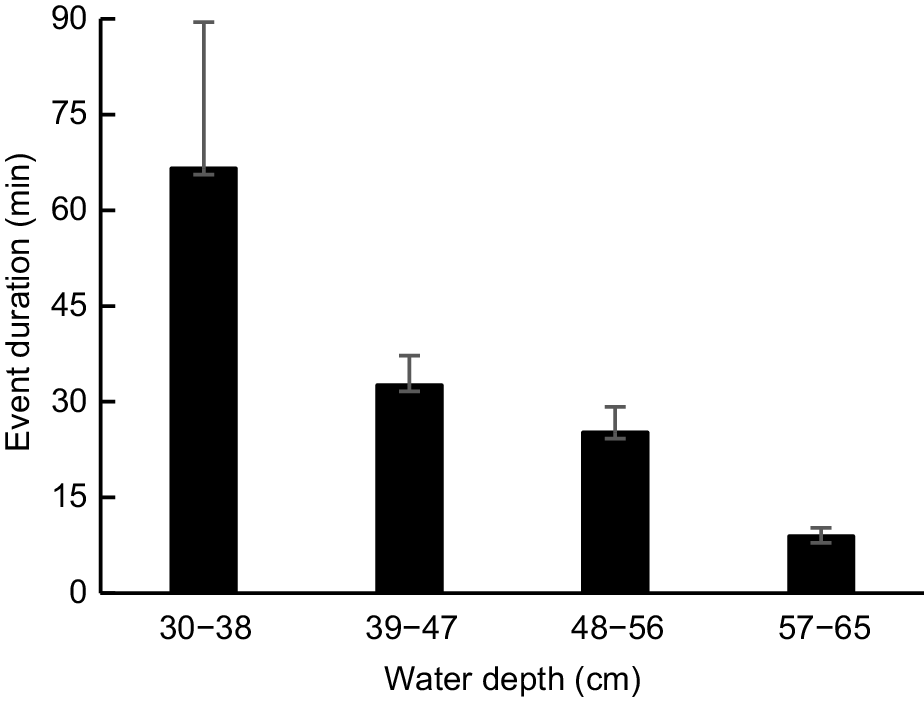
The duration of diurnal events at pools from late January to June was inversely related to creek depth and discharge (Fig. 8). Maximum event duration on days when flow had ceased (175 min) was three times greater than that on days when discharge was high (58 min). Mean event duration at pools differed significantly by depth class (F = 13.727, d.f. = 3, 125, P < 0.001), with all post hoc pairwise comparisons being found to be significant (P ≤ 0.036), apart from that involving the two intermediate depth classes (P = 0.654). The mean length of time that a platypus spent foraging in a pool on days when flow had ceased (66 min ± 23) was double the mean length of time spent foraging in a pool on days when discharge was low (33 min ± 5), and more than seven times greater than mean event duration on days when discharge was high (9 min ± 1).
Mean diurnal event duration in pools (P1 and P2 records, n = 9, 39, 34, 47) at different water depths from January to June 2024. Error bars show s.e. See Materials and methods for pool descriptions and how depth was recorded.
In the case of riffle R1, event duration was lowest when flow had ceased (equating to the lowest depth class) and peaked when discharge was high (Fig. 9). The maximum duration of an event associated with high discharge (70 min) was five times greater than on days when flow had ceased (14 min). Mean event duration at R1 differed significantly by depth class (F = 4.036, d.f. = 3, 41, P = 0.013), although post hoc pairwise comparisons were significant only for the two greatest depth classes (P = 0.017). In the case of run R2, little difference was apparent in mean event durations for the three deepest depth classes, with no data being available for the lowest depth class. Mean event duration at R2 did not differ significantly by depth class (F = 0.897, d.f. = 2, 33, P = 0.418). The maximum duration of an event recorded at R2 (on a day when discharge was deemed to be high) was 96 min.
Platypus occurrence in the study area during the cease-to-flow period
Platypus activity at P1 and P2 was monitored on most days in the cease-to-flow period, with cameras deployed diurnally at one or both pools from 15 February to 9 March, and both diurnally and nocturnally from 10 March to 2 April. Cameras were also deployed diurnally at riffle R1 and run R2 in the period from 15 February to 2 April. However, because animals invariably entered the study area via P1 or P2, no activity was detected at R1 or R2, except on days when this was also detected at P1 or P2.
Reflecting the strong positive effect of creek depth on diurnal event frequency, platypus activity was often not recorded during daylight hours in both the first and second halves of the cease-to-flow period (diurnal activity detected on 4 of 22 days sampled at both pools from 11 February to 9 March and 4 of 21 days sampled from 10 March to 2 April). Platypus activity was not recorded in the study area on one-third of the days (8/24) in the second half of the cease-to-flow period when cameras were deployed both diurnally and nocturnally (10 March−2 April). However, the longest interval with no recorded activity was two consecutive days; each of the other six occasions characterised by no activity was 1 single day bracketed by days when a platypus was observed.
Trajectory of post-drought diurnal platypus activity at pools
The mean frequencies of platypus diurnal events recorded at pools P1 and P2 in May–June 2024 comprised just 18 and 27% respectively of the corresponding bimonthly values for 2021–2022, when antecedent discharge in the study area remained reliably high (Roberts and Serena 2024) (Table 5). However, diurnal platypus activity increased strongly at pools once substantial rain began falling in mid-July 2024, with mean diurnal event frequencies at P1 and P2 in July–August 2024 equating to 71 and 100% respectively of the corresponding bimonthly values for 2021–2022. By September–October 2024, following an extended interval of above average rainfall, mean diurnal event frequencies at P1 and P2 comprised 120 and 165% respectively of the corresponding bimonthly values for 2021–2022. In absolute terms, up to three unique individuals were sometimes detected utilising the study area on a given day in the period from July to December. By comparison, with one exception (when two different animals were detected on 25 February, one in pool P1 and one in pool P2), no more than one individual could be confirmed to be active in the study area on a given day from early February to April. Up to two individuals were confirmed to utilise the study area on a given day in May (on three occasions, with the first occurring on 29 May) and June (four occasions).
| Period | Pool 1 | Pool 2 | |||
|---|---|---|---|---|---|
| 2024 | 2021–2022 | 2024 | 2021–2022 | ||
| May–June | 0.6 ± 0.1 (54) | 3.3 ± 0.4 (15) | 0.7 ± 0.1 (54) | 2.6 ± 0.5 (26) | |
| July–Aug | 1.0 ± 0.4 (10) | 1.4 ± 0.2 (22) | 0.7 ± 0.2 (9) | 0.7 ± 0.3 (9) | |
| Sept–Oct | 3.2 ± 0.3 (36) | 2.7 ± 0.4 (32) | 2.8 ± 0.2 (36) | 1.7 ± 0.2 (23) | |
| Nov–Dec | 3.6 ± 0.3 (43) | 3.5 ± 0.5 (33) | 2.1 ± 0.2 (43) | 2.3 ± 0.3 (39) | |
Values for 2021–2022 are from Roberts and Serena (2024). See Materials and methods for details about how depth was recorded.
Discussion
Platypus behavioural flexibility in response to drought
Both the wetted surface area and volume of streams and rivers are normally reduced during drought (Magoulick and Kobza 2003), with impacts on hydrology typically found to be inversely related to the size of a lotic system (McCargo and Peterson 2010). In the case of Kellaways Creek, total wetted area at the end of a lengthy (nearly 2-month) cease-to-flow period in late summer and early autumn dropped to ⁓40% of the area normally available to the local platypus population. Although this was largely due to desiccation of run and riffle habitats, the mean wetted width of pools declined to ⁓75% of their corresponding dimension during normal base flow.
The platypus typically is active for one activity bout per day, lasting 8–16 h (Serena 1994; Gust and Handasyde 1995; Otley et al. 2000; Bethge et al. 2003, 2009) and mainly devoted to finding prey (Otley et al. 2000; Serena et al. 2001; Bethge et al. 2003, 2009). Although nocturnal foraging often predominates, diurnal activity occurs routinely both at sites on the Australian mainland (Grigg et al. 1992; Serena 1994; Gardner and Serena 1995; Gust and Handasyde 1995; Serena et al. 1998; Bino et al. 2018; Hawke et al. 2021) and in Tasmania (Otley et al. 2000; Bethge et al. 2009). The relative proportions of nocturnal and diurnal activity are likely to be dictated by trade-offs between predator avoidance, how much foraging effort is required to satisfy energy demands, and the risk that agonistic interactions with conspecifics may occur if animals meet (Roberts and Serena 2024). The two pools monitored in the current study were collectively characterised by approximately similar numbers of diurnal and nocturnal platypus activity events when assessed over a 12-month period of reliable flow in 2021–2022, although the frequency of nocturnal events was likely to have been underestimated because of reduced visibility at night (Roberts and Serena 2024). By contrast, despite the fact that nocturnal event frequency in the current study would have been subject to additional negative bias owing to images being recorded at longer intervals at night than during the day, the mean nocturnal event frequency recorded at pools when flow had ceased was more than an order of magnitude greater than the corresponding diurnal value. As hypothesised, a positive relationship between declining creek depth and platypus nocturnality was observed; the frequency of nocturnal events outnumbered diurnal events by a factor of more than three when discharge was deemed to be low, and by a factor of more than two when discharge was deemed to be moderate. Conversely, diurnal events outnumbered nocturnal events by a factor of more than two when discharge was deemed to be high.
The platypus has a relatively low body temperature of ⁓32°C (Grant and Dawson 1978a; Grant 1983; Grigg et al. 1992) and a limited ability to cool itself by sweating (Grant and Dawson 1978b). Burrows located in consolidated soil banks have also been found to provide reliably cool summer resting sites for a platypus population in north-western Tasmania (Bethge et al. 2004). It is therefore reasonable to postulate that nocturnality might have increased as creek depth dropped because burrows were increasingly occupied during the day to reduce conductive heat gain and avoid radiant heat transfer from sunlight (Mitchell et al. 2018). In practice, this hypothesis was not supported in our well-shaded study area, where no relationship was apparent between maximum daily air temperature and the frequency of diurnal platypus activity. Furthermore, diurnal air temperature was estimated to exceed 29°C (the threshold when individuals in captivity reduce their activity in a presumed bid to limit metabolic heat gain: Booth and Connolly 2008) on only 4 days in the first half of 2024.
Alternatively, it is possible that the Kellaways Creek platypus population became more nocturnal as water level declined to reduce predation risk. Predation is known to be a major factor contributing to platypus mortality (Serena and Williams 2010; Serena et al. 2025), with animals predicted to be most vulnerable when travelling through very shallow water or across dry land (Grant and Bishop 1998; Grant 2007). Furthermore, a diverse array of known or inferred platypus predators occurs in or near the Kellaways Creek study area (S. Roberts, pers. obs.), including spotted-tail quoll (Dasyurus maculatus) (Dawson et al. 2007), Tasmanian devil (Sarcophilus harrisii) (Munday et al. 1998), white-bellied sea-eagle (Haliaeetus leucogaster) and wedge-tailed eagle (Aquila audax) (Munday et al. 1998; Rakick et al. 2001), and domesticated dog (Canis familiaris) (Connolly et al. 1998; Munday et al. 1998). Our camera-based findings indicated that individual pools were never utilised by a given platypus for more than a few hours at a time, implying that foraging activity was likely to have been distributed among two or more pools even at the height of the 2024 drought. As documented in Table 1, intervening shallower habitats were on average 4.7 m wide and held water at a mean depth of 12 cm (although up to 30 cm) when creek discharge was moderate to high, providing opportunities for a platypus to conceal its presence when moving between pools. However, darkness increasingly would have provided the best option for animals to avoid detection between pools as the drought progressed, with nearly three-quarters of the combined lengths of run and riffle habitats effectively drying out by late March, ⁓6.5 week after flow had ceased.
Australian fishes (Marshall et al. 2016) and turtles (Roe and Georges 2008; Deppe et al. 2024) have been documented moving to more sizeable and hence reliable pools in response to reduced availability of surface water. Similarly (and as hypothesised), platypus activity along Kellaways Creek became increasingly concentrated in pool habitats as stream depth and wetted area declined in 2024. Although the number of diurnal platypus activity events waned in both pools and shallower run–riffle habitats as creek depth dropped, this was countered by a strong inverse relationship between creek depth and event duration in the case of pools, where the mean length of diurnal events on days of cease-to-flow was ~7 times greater than that on days when discharge was deemed to be high. Put differently, a platypus was recorded spending up to nearly 3 h foraging continuously in pool P1 when flow had ceased, as opposed to a maximum of just under 1 h on days when flow was high. By contrast, there was no indication that event duration in run–riffle habitats increased as creek depth declined. If anything, the available evidence (albeit based on very limited sampling for the two lowest depth classes) indicated that the opposite was true.
Increased platypus usage of pools as creek flow declines is explicable both as a predator avoidance strategy and, perhaps even more importantly, as an adaptive response to drought-induced changes in prey availability and detectability. Optimal foraging theory predicts that predators should select habitat patches to maximise their net rate of energy and nutrient gain (Pyke 1984). Furthermore, the platypus’s daily food requirements are quite high; recent research has indicated that non-lactating individuals must consume ⁓13–21% of their body weight in prey each day to fuel energy needs in captivity, equating to a mean 921 ± 18 kJ kg−1 (Thomas et al. 2017). Macroinvertebrates may become more crowded and hence available to predators as the wetted area of a creek starts to contract (Dewson et al. 2007; Szałkiewicz et al. 2022), thereby potentially augmenting platypus foraging efficiency in relatively shallow parts of a creek in the early stages of a drought. However, macroinvertebrate abundance and diversity are both likely to decline if discharge continues to drop in a normally perennial stream such as Kellaways Creek, augmenting competition and predation and creating unsuitable conditions for many taxa as environmental attributes such as flow velocity, water temperature and dissolved oxygen concentration are altered (Dewson et al. 2007; Bond et al. 2008; Machuca-Sepúlveda et al. 2024). A critical threshold is typically reached when surface discharge ceases, marked by the loss of riffle-dwelling species along with accelerated migration of fish and other aquatic fauna to pools (Boulton 2003; Bond et al. 2008; Archdeacon et al. 2024). Moreover, because the platypus locates its prey by using bill mechanoreceptors and electroreceptors that need to be wetted to function (Manger and Pettigrew 1995; Pettigrew et al. 1998), it can forage only at sites where adequate surface moisture remains.
Radio-tracking studies have invariably found that adult platypus home ranges overlap broadly in lotic water bodies (e.g. Serena 1994; Gardner and Serena 1995; Gust and Handasyde 1995; Serena et al. 1998), with 1.2–3.6 animals km−1 being estimated to occupy a diverse range of creek habitats (Serena 1994; Gardner and Serena 1995; Serena and Williams 1997; Serena et al. 2014). The Kellaways Creek platypus population is likely to lie at the upper end of this range, given that it occupies a relatively undegraded catchment and up to three individuals have sometimes been recorded simultaneously in the study area. However, the question remains whether local population density may have dropped in 2024 as an outcome of drought, as suggested by the low maximum number of unique individuals being recorded in the study area during the cease-to-flow period and for some weeks thereafter.
In theory, platypus usage may have diminished in the study area as an outcome of any or all of three drought-related effects. First, platypus dispersion may have changed so that animals occupied smaller home ranges with less overlap occurring between neighbours. This could plausibly occur if each individual chose to concentrate activity in one or a few pools while otherwise restricting longitudinal travel, thereby both limiting predation risk (as discussed above) and reducing energy expenditure. The energetic cost of travelling between pools is predicted to rise as shallow habitats desiccate; a platypus walking across land has been estimated to use ⁓30–60% more energy than when it swims (Bethge et al. 2001). Furthermore, conserving energy during drought may become increasingly important over time. Food resources for fish often become scarce in refuge pools during extended cease-to-flow periods, causing them to switch to a lower quality diet (Sternberg et al. 2008) or to lose condition (Balcombe et al. 2012).
Second, although some platypus activity continued to be recorded in the study area throughout the cease-to-flow period, a proportion of the population may have emigrated to other parts of the Huon River system in presumed search of more reliable or productive drought refuges. Variation in the propensity of individuals to move from drying habitats has been recorded both within and between sympatric turtle species (Roe and Georges 2008; Purcell et al. 2017; Deppe et al. 2024) and fish species (Albanese et al. 2004; Davey and Kelly 2007; Archdeacon et al. 2024). Factors affecting the decision by aquatic fauna, including the platypus, to remain in situ or travel elsewhere may reasonably include knowledge of the existence of an accessible and more substantial alternative refuge site (Davey and Kelly 2007; Roe and Georges 2008), an individual’s current health and condition (Roe and Georges 2008; Lovich et al. 2017) and the strength of biotic interactions affecting predation risk or competition for critical resources (Magoulick and Kobza 2003).
Third, increased adult mortality may have contributed to a decline in local population density. Even though relatively few platypus deaths have been causally linked to drought, some carcasses have been recorded in desiccated river reaches during dry periods (Serena and Williams 2010; Hawke et al. 2024; Serena et al. 2025). By contrast, although platypus reproduction is known to be adversely affected by low antecedent rainfall (Serena et al. 2014) and surface discharge (Serena and Grant 2017), there is no reason to hypothesise that reduced juvenile numbers contributed directly to a reduced frequency of diurnally recorded events. This follows on from observations made in both the study area (Roberts and Serena 2024) and elsewhere (Serena 1994; Bethge et al. 2009) that suggest that juveniles are most likely to be active at night.
In practice, the frequency of diurnally recorded platypus events at pools remained low (as compared with historical values recorded in a year unaffected by drought) for ⁓3 months after flow resumed in early April 2024. Platypus activity rebounded thereafter, with diurnal event frequency in September and October 2024 exceeding the corresponding values for the same bimonthly period in 2021 by 18 (Pool 1) and 41% (Pool 2). This is broadly in line with the amount of time required for many lotic invertebrate populations to recover following severe seasonal drought (namely, a few weeks to a few months: Pires et al. 2000; Caruso 2002; Boulton 2003). It is therefore reasonable to posit that platypus activity in the study area was initially limited by reduced availability of food resources after flow resumed, and then rebounded as macroinvertebrates repopulated the study area. However, in the absence of detailed tracking studies, it is impossible to determine whether resumption of normal levels of platypus activity was mediated by expansion of local home range use (Hypothesis 1 above), as opposed to animals returning to the study area after temporarily moving elsewhere (Hypothesis 2 above). Alternatively, if temporal variation in diurnal platypus activity had been due to adults dying and eventually being replaced by new recruits (Hypothesis 3 above), event frequency would likely not have returned to pre-drought levels before late 2025 at the earliest, following the next regional round of juvenile growth and dispersal (Roberts and Serena 2024).
Implications for platypus management
The capacity of aquatic fauna to resist longitudinal fragmentation of water courses during drought frequently depends on their degree of adaptation to drying conditions along with the distribution of suitable refuges (Boulton 2003; Magoulick and Kobza 2003; Bond et al. 2008; Walters et al. 2024). This study has demonstrated that a platypus population occupying a normally reliably flowing creek in southern Tasmania was able to survive a drought in which flow ceased for nearly 2 months by altering behaviour in a manner predicted to reduce predation risk and concentrate activity in the best remaining foraging habitat in deeper pools. Although relatively small streams such as Kellaways Creek are particularly likely to experience damaging temperature increases and low concentrations of dissolved oxygen during low-flow events (McCargo and Peterson 2010), this may have been buffered to some extent in our study area by extensive riparian cover (Rutherford et al. 1997; Walters 2016). More generally, as has been previously demonstrated for fish assemblages (Bond and Lake 2005; Matono et al. 2012), platypus populations occupying relatively undegraded water courses may well find it easier to survive periods of variable hydrology than do those in more severely altered environments.
The ecological consequences of low-flow events are known to vary with their intensity and duration (Boulton 2003; Magalhães et al. 2007; Bond et al. 2008; Walters 2016). Plausibly, a platypus is most likely to survive an extreme or very extended drought period if a suitably productive refuge is available near its normal activity area, insofar as this will reduce predation risk while in transit, and make it easier for the animal to assess when its original home range is again habitable.
Alternatively, individuals that appear to be at imminent risk of dying in drought-affected channels may be taken into captivity and maintained there until conditions appear to be suitable for their release back to the wild (Hawke et al. 2024). Although this may result in some animals surviving that would otherwise have died, it cannot be assumed to guarantee the survival of all rescued individuals (Hawke et al. 2024), and may potentially have deleterious effects on physiology, endocrinology or behaviour (Teixeira et al. 2007; Dickens et al. 2010). Furthermore, a species’ ability to survive low-flow events can develop only within the range of environmental variation to which it has adapted (Lytle and Poff 2004). In this light, the positive outcomes of platypus rescue operations in drought must be weighed up against the likelihood that a population’s ability to survive increasingly dry conditions fuelled by climate change may require genetic change to occur by differential mortality, with outlying survivors potentially better adapted to survive in future (Purcell et al. 2017). More generally, reactive single-species approaches to drought intervention demonstrably cannot replace proactive measures designed to support the survival of a range of species, including the platypus, during extended dry periods. Broadly speaking, these will include assessing the adequacy of refuge sites under a range of climate change scenarios, taking action where necessary to improve habitat and water quality at refuge sites and in adjoining areas, working creatively to establish additional refuge sites and to maintain environmental flows through drought, and strengthening connectivity both within and among catchments to facilitate post-drought dispersal and recolonisation of vacant habitats (Bond et al. 2008; Walters et al. 2024).
Data availability
The data that support this study will be shared upon reasonable request to Simon Roberts.
Declaration of funding
We sincerely thank Brinno for donating three of the cameras used to monitor platypus activity, and Chocolatier Australia for funding Open Access publication of this paper.
Acknowledgements
We are very grateful to Andrew Ellis for providing and flying the drone used to document change in channel wetted width.
References
Albanese B, Angermeier PL, Dorai-Raj S (2004) Ecological correlates of fish movement in a network of Virginia streams. Canadian Journal of Fisheries and Aquatic Sciences 61, 857-869.
| Crossref | Google Scholar |
Archdeacon TP, Gonzales EJ, Yackulic CB (2024) Fishes move to transient local refuges, not persistent landscape refuges during river drying experiment. Freshwater Biology 69, 792-808.
| Crossref | Google Scholar |
Archer M, Plane M, Pledge N (1978) Additional evidence for interpreting the Miocene Obdurodon insignis Woodburne and Tedford, 1975, to be a fossil platypus (Ornithorhynchidae: Monotremata) and a reconsideration of the status of Ornithorhynchus agilis De Vis, 1885. Australian Zoologist 20, 9-19.
| Google Scholar |
Balcombe SR, Lobegeiger JS, Marshall SM, Marshall JC, Ly D, Jones DN (2012) Fish body condition and recruitment success reflect antecedent flows in an Australian dryland river. Fisheries Science 78, 841-847.
| Crossref | Google Scholar |
Bethge P, Munks S, Nicol S (2001) Energetics of foraging and locomotion in the platypus Ornithorhynchus anatinus. Journal of Comparative Physiology B 171, 497-506.
| Crossref | Google Scholar |
Bethge P, Munks S, Otley H, Nicol S (2003) Diving behaviour, dive cycles and aerobic dive limit in the platypus Ornithorhynchus anatinus. Comparative Biochemistry and Physiology – A. Molecular & Integrative Physiology 136, 799-809.
| Crossref | Google Scholar |
Bethge P, Munks S, Otley H, Nicol S (2004) Platypus burrow temperatures at a subalpine Tasmanian lake. Proceedings of the Linnean Society of New South Wales 125, 273-276.
| Google Scholar |
Bethge P, Munks S, Otley H, Nicol S (2009) Activity patterns and sharing of time and space of platypuses, Ornithorhynchus anatinus, in a subalpine Tasmanian lake. Journal of Mammalogy 90, 1350-1356.
| Crossref | Google Scholar |
Bino G, Kingsford RT, Grant T, Taylor MD, Vogelnest L (2018) Use of implanted acoustic tags to assess platypus movement behaviour across spatial and temporal scales. Scientific Reports 8, 5117.
| Crossref | Google Scholar |
Bond NR, Lake PS (2005) Ecological restoration and large-scale ecological disturbance: the effects of drought on the response by fish to a habitat restoration experiment. Restoration Ecology 13, 39-48.
| Crossref | Google Scholar |
Bond NR, Lake PS, Arthington AH (2008) The impacts of drought on freshwater ecosystems: an Australian perspective. Hydrobiologia 600, 3-16.
| Crossref | Google Scholar |
Boulton AJ (2003) Parallels and contrasts in the effects of drought on stream macroinvertebrate communities. Freshwater Biology 48, 1173-1185.
| Crossref | Google Scholar |
Caruso BS (2002) Temporal and spatial patterns of extreme low flows and effects on stream ecosystems in Otago, New Zealand. Journal of Hydrology 257, 115-133.
| Crossref | Google Scholar |
Connolly JH, Obendorf DL, Whittington RJ, Muir DB (1998) Causes of morbidity and mortality in platypus (Ornithorhynchus anatinus) from Tasmania, with particular reference to Mucor amphibiorum infection. Australian Mammalogy 20, 177-187.
| Crossref | Google Scholar |
Davey AJH, Kelly DJ (2007) Fish community responses to drying disturbances in an intermittent stream: a landscape perspective. Freshwater Biology 52, 1719-1733.
| Crossref | Google Scholar |
Davey AJH, Kelly DJ, Biggs BJF (2006) Refuge-use strategies of stream fishes in response to extreme low flows. Journal of Fish Biology 69, 1047-1059.
| Crossref | Google Scholar |
Dawson JP, Claridge AW, Triggs B, Paull DJ (2007) Diet of a native carnivore, the spotted-tailed quoll (Dasyurus maculatus), before and after an intense wildfire. Wildlife Research 34, 342-351.
| Crossref | Google Scholar |
Deppe AR, Bower DS, McKnight DT (2024) Impact of severe drought on movement and survival of freshwater turtles in the Gwydir Wetlands, Australia. Marine and Freshwater Research 75, MF23226.
| Crossref | Google Scholar |
Dewson ZS, James ABW, Death RG (2007) A review of the consequences of decreased flow for instream habitat and macroinvertebrates. Journal of the North American Benthological Society 26, 401-415.
| Crossref | Google Scholar |
Dickens MJ, Delehanty DJ, Michael Romero L (2010) Stress: an inevitable component of animal translocation. Biological Conservation 143, 1329-1341.
| Crossref | Google Scholar |
Douglas CE, Michael FA (1991) On distribution-free multiple comparisons in the one-way analysis of variance. Communications in Statistics – Theory and Methods 20, 127-139.
| Crossref | Google Scholar |
Faragher RA, Grant TR, Carrick FN (1979) Food of the platypus (Ornithorhynchus anatinus) with notes on the food of brown trout (Salmo trutta) in the Shoalhaven River, NSW. Australian Journal of Ecology 4, 171-179.
| Crossref | Google Scholar |
Gardner JL, Serena M (1995) Spatial organization and movement patterns of adult male platypus, Ornithorhynchus anatinus (Monotremata: Ornithorhynchidae). Australian Journal of Zoology 43, 91-103.
| Crossref | Google Scholar |
Grant TR (1983) Body temperatures of free-ranging platypuses, Ornithorhynchus anatinus (Monotremata), with observations on their use of burrows. Australian Journal of Zoology 31, 117-122.
| Crossref | Google Scholar |
Grant TR (2004) Captures, capture mortality, age and sex ratios of platypuses, Ornithorhynchus anatinus, during studies over 30 years in the upper Shoalhaven River in New South Wales. Proceedings of the Linnean Society of New South Wales 125, 217-226.
| Crossref | Google Scholar |
Grant TR, Bishop KA (1998) Instream flow requirements for the platypus (Ornithorhynchus anatinus): a review. Australian Mammalogy 20, 267-280.
| Crossref | Google Scholar |
Grant TR, Dawson TJ (1978a) Temperature regulation in the platypus, Ornithorhynchus anatinus: maintenance of body temperature in air and water. Physiological Zoology 51, 1-6.
| Crossref | Google Scholar |
Grant TR, Dawson TJ (1978b) Temperature regulation in the platypus, Ornithorhynchus anatinus: production and loss of metabolic heat in air and water. Physiological Zoology 51, 315-332.
| Crossref | Google Scholar |
Grant TR, Temple-Smith PD (2003) Conservation of the platypus, Ornithorhynchus anatinus: threats and challenges. Aquatic Ecosystem Health & Management 6, 5-18.
| Crossref | Google Scholar |
Grigg GC, Beard L, Grant TR, Augee M (1992) Body temperature and diurnal activity patterns in the platypus (Ornithorhynchus anatinus) during winter. Australian Journal of Zoology 40, 135-142.
| Crossref | Google Scholar |
Gust N, Handasyde K (1995) Seasonal variation in the ranging behavior of the platypus (Ornithorhynchus anatinus) on the Goulburn River, Victoria. Australian Journal of Zoology 43, 193-208.
| Crossref | Google Scholar |
Hansen HH, Bergman E, Kopf K, Linkmark M (2024) Resistance of Australian fish communities to drought and flood: implications for climate change and adaptations. Ecography 2025, e07442.
| Crossref | Google Scholar |
Hawke T, Bino G, Kingsford RT, Iervasi D, Iervasi K, Taylor MD (2021) Long-term movements and activity patterns of platypus on regulated rivers. Scientific Reports 11, 3590.
| Crossref | Google Scholar |
Hawke T, Bino G, Shackleton ME, Ross AK, Kingsford RT (2022) Using DNA metabarcoding as a novel approach for analysis of platypus diet. Scientific Reports 12, 2247.
| Crossref | Google Scholar |
Hawke T, Meagher P, Bino G, Elphinstone A, May S, Lowe A, Vogelnest L, Kingsford RT (2024) Rescue and return: translocating a semi-wild platypus (Ornithorynchus anatinus) population during the 2019 drought. Ecological Management & Restoration 25, 199-207.
| Crossref | Google Scholar |
Kinlaw A (2004) High mortality of Nearctic river otters on a Florida, USA, interstate highway during an extreme drought. IUCN Otter Specialist Group Bulletin 21, 76-88.
| Google Scholar |
Lovich JE, Quillman M, Zitt B, Schroeder A, Green DE, Yackulic C, Gibbons P, Goode E (2017) The effects of drought and fire in the extirpation of an abundant semi-aquatic turtle from a lacustrine environment in the southwestern USA. Knowledge & Management of Aquatic Ecosystems 418, 18.
| Crossref | Google Scholar |
Lytle DA, Poff NL (2004) Adaptation to natural flow regimes. Trends in Ecology & Evolution 19, 94-100.
| Crossref | Google Scholar | PubMed |
Machuca-Sepúlveda J, López M, Fierro P, Beltrán JF, Norambuena J-A, Pinheiro S. Oliveira R, Zamorano M, Farias JG (2024) Ecological responses of freshwater macroinvertebrates to augmented drought: a literature review and projections. Ecological Indicators 164, 112153.
| Crossref | Google Scholar |
Magalhães MF, Beja P, Schlosser IJ, Collares-Pereira MJ (2007) Effects of multi-year droughts on fish assemblages of seasonally drying Mediterranean streams. Freshwater Biology 52, 1494-1510.
| Crossref | Google Scholar |
Magoulick DD, Kobza RM (2003) The role of refugia for fishes during drought: a review and synthesis. Freshwater Biology 48, 1186-1198.
| Crossref | Google Scholar |
Manger PR, Pettigrew JD (1995) Electroreception and the feeding behaviour of platypus (Ornithorhynchus anatinus: Monotremata: Mammalia). Philosophical Transactions of the Royal Society of London – B. Biological Sciences 347, 359-381.
| Crossref | Google Scholar |
Marchant R, Grant TR (2015) The productivity of the macroinvertebrate prey of the platypus in the upper Shoalhaven River, New South Wales. Marine and Freshwater Research 66, 1128-1137.
| Crossref | Google Scholar |
Marshall JC, Menke N, Crook DA, Lobegeiger JS, Balcombe SR, Huey JA, Fawcett JH, Bond NR, Starkey AH, Sternberg D, Linke S, Arthington AH (2016) Go with the flow: the movement behaviour of fish from isolated waterhole refugia during connecting flow events in an intermittent dryland river. Freshwater Biology 61, 1242-1258.
| Crossref | Google Scholar |
Martínez-Abraín A, Santidrián Tomillo P, Veiga J (2020) Otter diet changes in a reservoir during a severe autumn drought. Journal of Mammalogy 101, 211-215.
| Crossref | Google Scholar |
Matono P, Bernardo JM, Oberdorff T, Ilhéu M (2012) Effects of natural hydrological variability on fish assemblages in small Mediterranean streams: implications for ecological assessment. Ecological Indicators 23, 467-481.
| Crossref | Google Scholar |
McCargo JW, Peterson JT (2010) An evaluation of the influence of seasonal base flow and geomorphic stream characteristics on coastal plain stream fish assemblages. Transactions of the American Fisheries Society 139, 29-48.
| Crossref | Google Scholar |
McLachlan-Troup TA, Dickman CR, Grant TR (2010) Diet and dietary selectivity of the platypus in relation to season, sex and macroinvertebrate assemblages. Journal of Zoology 280, 237-246.
| Crossref | Google Scholar |
McLachlan-Troup TA, Nicol SC, Dickman CR (2020) Platypus predation has differential effects on aquatic invertebrates in contrasting stream and lake ecosystems. Scientific Reports 10, 13043.
| Crossref | Google Scholar |
Mitchell D, Snelling EP, Hetem RS, Maloney SK, Strauss WM, Fuller A (2018) Revisiting concepts of thermal physiology: predicting responses of mammals to climate change. Journal of Animal Ecology 87, 956-973.
| Crossref | Google Scholar | PubMed |
Munday BL, Whittington RJ, Stewart NJ (1998) Disease conditions and subclinical infections of the platypus (Ornithorhynchus anatinus). Philosophical Transactions of the Royal Society of London – B. Biological Sciences 353, 1093-1099.
| Crossref | Google Scholar | PubMed |
Musser A, Grant T, Turak E (2024) Movements of platypuses around and through instream structures and natural barriers in the Jenolan Karst Conservation Reserve, New South Wales. Australian Mammalogy 46, AM23031.
| Crossref | Google Scholar |
Otley HM, Munks SA, Hindell MA (2000) Activity patterns, movements and burrows of platypuses (Ornithorhynchus anatinus) in a sub-alpine Tasmanian lake. Australian Journal of Zoology 48, 701-713.
| Crossref | Google Scholar |
Pettigrew JD, Manger PR, Fine SLB (1998) The sensory world of the platypus. Philosophical Transactions of the Royal Society of London – B. Biological Sciences 353, 1199-1210.
| Crossref | Google Scholar | PubMed |
Pires AM, Cowx IG, Coelho MM (2000) Benthic macroinvertebrate communities of intermittent streams in the middle reaches of the Guadiana Basin (Portugal). Hydrobiologia 435, 167-175.
| Crossref | Google Scholar |
Purcell KL, McGregor EL, Calderala K (2017) Effects of drought on western pond turtle survival and movement patterns. Journal of Fish and Wildlife Management 8, 15-27.
| Crossref | Google Scholar |
Pyke GH (1984) Optimal foraging theory: a critical review. Annual Review of Ecology, Evolution, and Systematics 15, 523-575.
| Crossref | Google Scholar |
Rakick R, Rakick B, Cook L, Munks S (2001) Observations of a platypus foraging in the sea and hunting of a platypus by a wedge-tailed eagle. The Tasmanian Naturalist 123, 2-4.
| Google Scholar |
Ranalli G, Scheidegger AE (1968) Topological significance of stream labelling methods. Hydrological Sciences Journal 13, 77-85.
| Crossref | Google Scholar |
Roberts S, Serena M (2024) Use of consolidated time-lapse camera imagery to detect and monitor platypus (Ornithorhynchus anatinus) activity. Australian Mammalogy 46, AM23045.
| Crossref | Google Scholar |
Roe JH, Georges A (2008) Maintenance of variable responses for coping with wetland drying in freshwater turtles. Ecology 89, 485-494.
| Crossref | Google Scholar | PubMed |
Ruiz-Olmo J, Jiménez J, Chacón W (2007) The importance of ponds for the otter (Lutra lutra) during drought periods in Mediterranean ecosystems: a case study in Bergantes River. Mammalia 71, 16-24.
| Crossref | Google Scholar |
Rutherford JC, Blackett S, Blackett C, Saito L, Davies-Colley RJ (1997) Predicting the effects of shade on water temperature in small streams. New Zealand Journal of Marine and Freshwater Research 31, 707-721.
| Crossref | Google Scholar |
Serena M (1994) Use of time and space by platypus (Ornithorhynchus anatinus: Monotremata) along a Victorian stream. Journal of Zoology 232, 117-131.
| Crossref | Google Scholar |
Serena M, Grant TR (2017) Effect of flow on platypus (Ornithorhynchus anatinus) reproduction and related population processes in the upper Shoalhaven River. Australian Journal of Zoology 65, 130-139.
| Crossref | Google Scholar |
Serena M, Williams GA (1997) Population attributes of platypus (Ornithorhynchus anatinus) in Flinders Chase National Park, Kangaroo Island. The South Australian Naturalist 72, 28-34.
| Google Scholar |
Serena M, Williams G (2010) Factors contributing to platypus mortality in Victoria. The Victorian Naturalist 127, 178-183.
| Google Scholar |
Serena M, Thomas JL, Williams GA, Officer RCE (1998) Use of stream and river habitats by the platypus, Ornithorhynchus anatinus, in an urban fringe environment. Australian Journal of Zoology 46, 267-282.
| Crossref | Google Scholar |
Serena M, Worley M, Swinnerton M, Williams GA (2001) Effect of food availability and habitat on the distribution of platypus (Ornithorhynchus anatinus) foraging activity. Australian Journal of Zoology 49, 263-277.
| Crossref | Google Scholar |
Serena M, Williams GA, Weeks AR, Griffiths J (2014) Variation in platypus (Ornithorhynchus anatinus) life-history attributes and population trajectories in urban streams. Australian Journal of Zoology 62, 223-234.
| Crossref | Google Scholar |
Serena M, Snowball G, Thomas JL, Williams GA, Danger A (2024) Platypus longevity: a new record in the wild and information on captive life span. Australian Mammalogy 46, AM23048.
| Crossref | Google Scholar |
Serena M, Williams GA, Thomas JL (2025) Factors contributing directly to platypus (Ornithorhynchus anatinus) mortality and implications for conserving populations in the wild. Australian Mammalogy 47, AM24032.
| Crossref | Google Scholar |
Sternberg D, Balcombe S, Marshall J, Lobegeiger J (2008) Food resource variability in an Australian dryland river: evidence from the diet of two generalist native fish species. Marine and Freshwater Research 59, 137-144.
| Crossref | Google Scholar |
Szałkiewicz E, Kałuża T, Grygoruk M (2022) Detailed analysis of habitat suitability curves for macroinvertebrates and functional feeding groups. Scientific Reports 12, 10757.
| Crossref | Google Scholar |
Teixeira CP, de Azevedo CS, Mendl M, Cipreste CF, Young RJ (2007) Revisiting translocation and reintroduction programmes: the importance of considering stress. Animal Behaviour 73, 1-13.
| Crossref | Google Scholar |
Thomas JL, Handasyde KA, Temple-Smith P, Parrott ML (2017) Seasonal changes in food selection and nutrition of captive platypuses (Ornithorhynchus anatinus). Australian Journal of Zoology 65, 319-327.
| Crossref | Google Scholar |
Walters AW (2016) The importance of context dependence for understanding the effects of low-flow events on fish. Freshwater Science 35, 216-228.
| Crossref | Google Scholar |
Walters AW, Clancy NG, Archdeacon TP, Yu S, Rogosch JS, Rieger EA (2024) Refuge identification as a climate adaptation strategy to promote fish persistence during drought. Fish and Fisheries 25, 997-1008.
| Crossref | Google Scholar |