

Historical changes in marine communities uncovered in diverse data sources highlight impacts over half a century
John W. Turnbull A B C * , David J. Booth D and Graeme F. Clark A B C
A
B
C
D
Abstract
Historical records and citizen scientist data are a useful resource for long-term ecological studies, yet their quality and validity have been challenged.
We aimed to investigate how traditional structured surveys and unstructured, opportunistic data sources can be used to understand historical ecological change over half a century.
We studied ~6000 records between 1965 and 2020 from the Shiprock site in the Sydney region, to understand ecological changes and insights that could be derived from these diverse data sources.
We report the local disappearance of some fish and invertebrate species, declines in the abundance of many taxa including kelp, potential impacts of the implementation of a marine reserve and range extensions consistent with climate change. Structured surveys provided broadly scientifically useful ecological information, whereas unstructured opportunistic data provided long-term retrospective community information and species presence information.
We have described scientifically and managerially relevant insights encompassing foundation, threatened, protected and invasive species, community shifts and the impacts of local and global processes over historical timescales.
Unstructured, opportunistic data sources can document long-term ecological changes arising from local and global processes, but are limited in the ability to provide population and community structure information.
Keywords: citizen science, climate change, historical marine ecology, invasive species, marine protected areas, protected species, Shiprock, threatened species.
Introduction
Humans have had an impact on ecosystems for far longer than we have effectively monitored them (Cushing 1988; Jackson et al. 2001). Historical ecology studies provide a potential solution to this gap, allowing us to retrospectively understand ecosystem changes that pre-date formal scientific studies (Balée 2006; McClenachan et al. 2012) and inform conservation and sustainability decision-making (Scarborough et al. 2022). Marine historical ecology emerged in the late 20th Century and has been used to study timescales from years to centuries and spatial scales from single sites to thousands of square kilometres (Beller et al. 2020; Thurstan 2022).
Understanding historical changes in marine ecosystems requires consideration of novel data sets and the application of diverse social and life science methodologies (Balée 2006). Novel or non-traditional historical data sets can include popular media articles, artworks, museum collections and opportunistic samples (Thurstan et al. 2015; Blasi et al. 2023). Here, we define diverse data sources as the combination of non-traditional, opportunistic or novel data sources that fall outside the traditional scientific method, and scientific sources in which data collection is systematically designed to address a hypothesis or research question (Bryman 2016). In the context of this study, these data include historical articles, SCUBA diver logs, photographs and citizen scientist and scientist surveys.
With the current degradation of the marine environment under the combined effects of multiple pressures (Brook et al. 2008), it is critical to consider such diverse data sets to understand impacts and inform management (McClenachan et al. 2012; Beller et al. 2020). Local records kept by individuals and groups, including through structured citizen science activities, can increase the spatial and temporal scale of studies to span continents and decades, and provide access to locations and times that may be out of reach of traditional scientific research (Dickinson et al. 2010). They are also an important source for coupled systems research, such as is required to understand social–ecological systems (Lepczyk et al. 2009; Scarborough et al. 2022).
The usefulness of citizen science data sources has been challenged (Aceves-Bueno et al. 2017); however, the demands of biodiversity research in the future require us to maximise the value derived from these data (Theobald et al. 2015; Callaghan et al. 2021). Although the quality of citizen science data can vary depending on individual knowledge, methods and program design, they can reach levels that meet or exceed the quality of data collected by professional researchers (Edgar and Stuart-Smith 2009; Dickinson et al. 2010; Callaghan et al. 2020). It is important, therefore, to consider the limitations and biases of unstructured non-traditional, opportunistic or novel data (as indeed it is with traditional scientific method data) in their interpretation and application (Specht and Lewandowski 2018; Callaghan et al. 2019).
Although many human impacts result in ecosystem degradation, human–nature interactions are not always negative (Lerner 1993). Environmental stewardship or ‘active earth-keeping’ provides a pathway to sustainable futures, and includes advocacy, restoration, protection and monitoring by citizen scientists (Turnbull et al. 2020). Environmental stewardship of frequented locations can opportunistically provide valuable information, including unstructured data sources spanning decades (Thurstan et al. 2015). Institutions may also undertake local stewardship actions, such as the design and gazettal of marine protected areas (MPAs). However, today, many MPAs are not producing the intended social or ecological outcomes (Turnbull et al. 2021). It is essential, therefore, to monitor the results of protection over decadal timescales, something that can also be facilitated through citizen science (Edgar et al. 2023).
Shiprock is an iconic location of high social and ecological value in the southern suburbs of Sydney, Australia. This unique marine community was first documented by some of Sydney’s earliest SCUBA diver citizen scientists, namely, members of the Underwater Research Group of New South Wales (URG), in 1965 (Lawler 1998). Since then, Shiprock has been the focus of ongoing efforts to discover, document and conserve its abundant marine life. Early write-ups of Shiprock describe the sense of wonder, discovery, desire to document and, ultimately, the need to conserve the site that developed over decades (e.g. https://www.urgdiveclub.org.au/copy-of-bulletin-archive-1965-1969, accessed 8 June 2022). These efforts featured collaboration with scientists at the Australian Museum, particularly in describing species taken as samples from the site:
Another tropical species of sea urchin belonging to the same family as two caught in late January was collected last week end (6th March)... These were identified by Miss E. Pope of the Australian Museum, as colour variations of ‘Temnopleurus alexandri’. [C. Lawler in URG Bulletin March 1966]
URG commenced a series of citizen science surveys around that time, including multiple biodiversity surveys using two transects perpendicular to shore, i.e. ‘A’ and ‘B’, that ran from the shallows to the bottom of the wall, and an environmental survey in November 1966 (Lawler 1998). These surveys were ultimately written up by club member Clarrie Lawler in the journal Wetlands (Lawler 1998).
Shiprock was declared a no-take (sanctuary zone) Aquatic Reserve in 1982 (see https://www.dpi.nsw.gov.au/fishing/marine-protected-areas/aquatic-reserves/shiprock-aquatic-reserve, accessed 8 June 2022). The Reserve is small, spanning 250 m of shoreline and ~2 ha, but it encompasses the central feature wall and nearby rock outcrops. Access to the dive site remained limited because of the steep ravine and rock ledges on the way down from the road until the owners of the property bordering the access track left a generous bequest for the local Council to build stairs in 2004 (URG Bulletin September 2012).
In recent years, citizen science at Shiprock continued in the form of structured surveys through the Reef Life Survey (RLS) program (see www.reeflifesurvey.com, accessed 7 June 2022), and ongoing unstructured documentation through opportunistic photographs published on iNaturalist (see https://www.inaturalist.org/home, accessed 9 June 2022). In 2017, at the instigation of the authors of this paper, the original perpendicular transect surveys were repeated in a collaborative project with URG members. The availability of parallel unstructured opportunistic data and structured survey data, at a single site, which effectively provided a standardised spatial scale, allowed a unique basis for our study spanning 50 years.
Our research explored the following three broad questions:
What can be concluded from the comparison of Shiprock historical and recent data, regarding ecological diversity and change, spanning the last 50 years?
How can these conclusions be interpreted in the context of the local and global drivers of change, including the potential effects of the local marine reserve on fished v. non-fished species, and the potential effects of climate change on species with a northern v. southern range?
How do the two main citizen science data collection modes at Shiprock (structured surveys v. unstructured opportunistic observations) compare in their strengths and limitations?
Materials and methods
Nestled on the northern developed shore of Port Hacking (southern Sydney, Australia), 4 km upstream from the estuary mouth, Shiprock has been a focal point for recreation and stewardship for over half a century. The northern shore of Port Hacking is largely urbanised, whereas the southern shore is largely undeveloped because of the declaration of the world’s second-oldest National Park in 1879, the Royal National Park. The upper reaches of the estuary are bounded by the Royal National Park on both sides.
The Port Hacking estuary has a history of human impacts, including fishing and bait collection, dredging, shell grit mining, catchment modification and urban runoff (Meehan and West 2002; McKinley et al. 2011); however, recent studies have found it to be pristine relative to other estuaries in the Sydney region, with only slight to moderate pollution impacts (Alyazichi et al. 2021; Birch et al. 2021). Fishing pressure is moderate, with an annual recreational fisher daytime effort ~1/3 that of the nearby Port Jackson estuary (Sydney Harbour) (Steffe and Murphy 2011). Natural impacts from strong tidal flows, storms, progradation of the tidal delta and sand migration are also ongoing (Meehan and West 2002).
Shiprock is sheltered from waves and experiences tidal flushing twice daily. Situated on a tight bend in the river, the site is characterised by a vertical underwater wall over 10 m high at its north-eastern end, tapering to a series of ledges 100 m to the south-west. The site also has several small rocky outcrops, numerous overhangs and ledges, and two small caves. High tidal flushing with waters relatively free of urban runoff has allowed the establishment of a highly diverse marine community at Shiprock, founded on rich and abundant sessile invertebrates and algae.
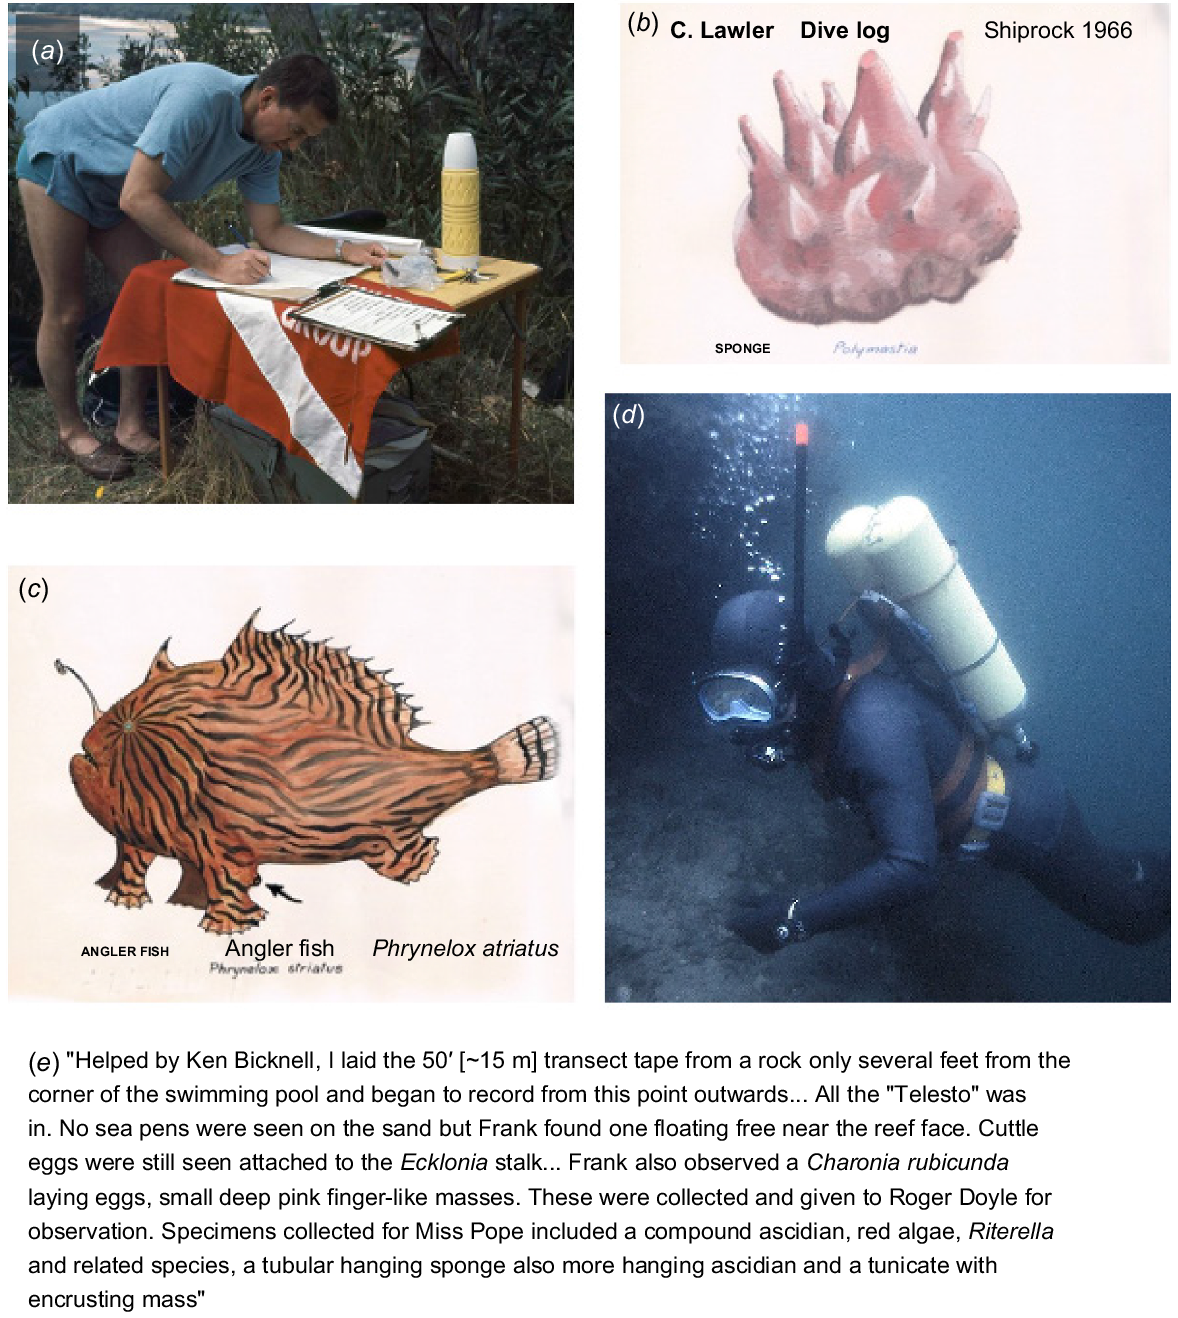
The initial historical data for our study were sourced from ‘The subtidal flora and fauna at Shiprock, Port Hacking, NSW during 1965–1970’ (Lawler 1998). Discussions with C. Lawler and other URG members then provided a large volume of Shiprock species records in diver logs, newsletters (‘The Bulletin’), and survey notes from the 1960s. These included extensive graphical data in the form of hand-drawn pictures of species and habitats (e.g. Fig. 1–3). Selected pictures are reproduced here; further historic pictures and prose can be found at https://www.urgdiveclub.org.au/ (accessed 5 June 2022).
Profile of Shiprock wall, as published in the Wetlands article (transect A in Lawler 1998) and originally sketched in the 1960s. Reproduced with permission of D. Lawler (daughter of C. Lawler).

Images from URG surveys of Shiprock in the 1960s. (a) C. Lawler recording survey details at Shiprock; (b) a hand-drawn image of a sponge; (c) anglerfish (C. Lawler); (d) an unknown diver; and (e) an extract from C. Lawler’s dive log, 4 September 1966.
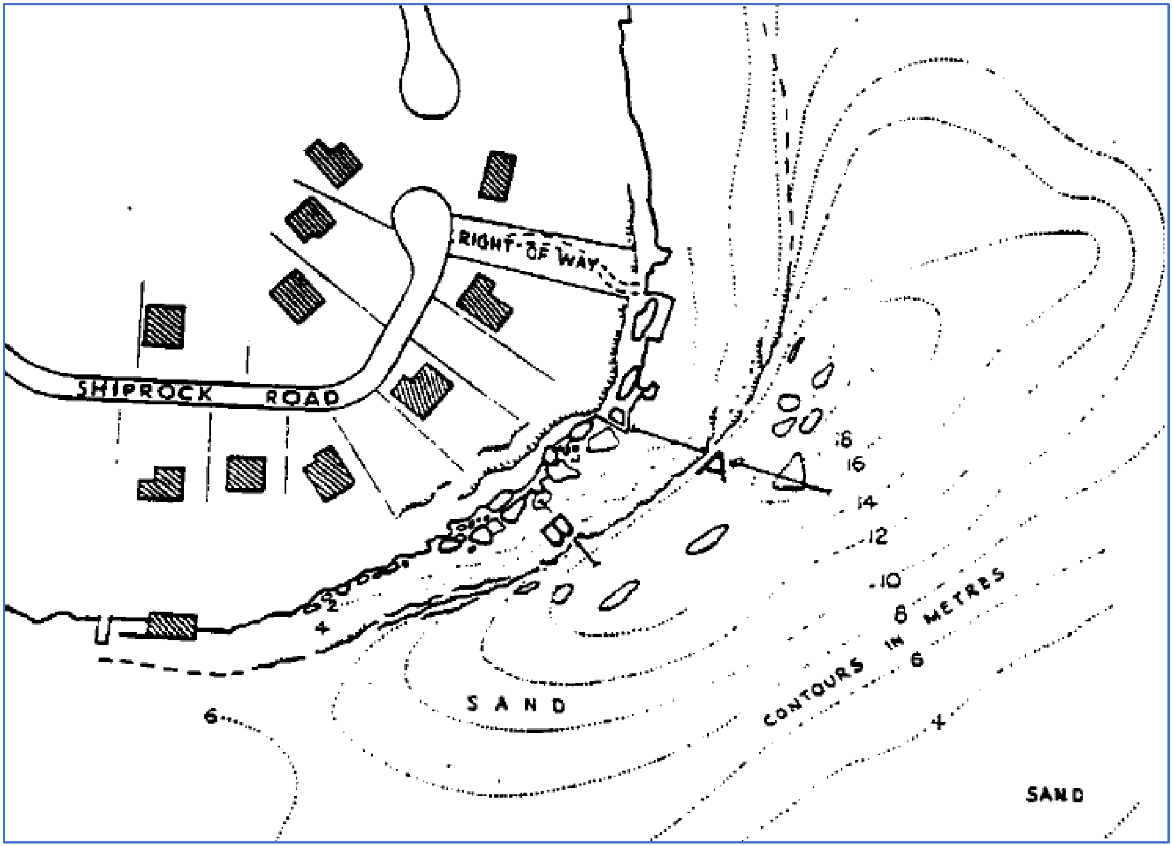
Perpendicular transect locations as published in the Wetlands article (adapted from map 2 of Lawler 1998), based on sketches drawn in the 1960s. Reproduced with permission of D. Lawler (daughter of C. Lawler).
More recent data were collected from three sources, namely (i) Reef Life Surveys, (ii) repeats of the original 1960s perpendicular transect surveys, and (iii) the iNaturalist citizen science website.
The bulletin and dive log extracts
We extracted all references to species at Shiprock from Bulletins and dive logs from 1965 to 2013. These were tabulated and included metadata for date, article, diver, species common name, species scientific name, relative abundance category and descriptive information such as habitat. Abundance categories were as follows: presence, absence, one, few (2–10), many (11–100) and abundant (101+).
Scientific names were checked, verified and updated where necessary by using WoRMS (see www.marinespecies.org, accessed 9 June 2022) and Fishes of Australia (see https://fishesofaustralia.net.au/, accessed 9 June 2022). Species names required considerable interpretation and translation. Organisms were historically described by a blend of common and scientific names; for example, ‘Telesto’ referred to the soft coral Telesto smithii, which is abundant at Shiprock, now most likely Carijoa sp. (see https://www.inaturalist.org/observations/8199698, accessed 10 June 2022) and possibly invasive (Concepcion et al. 2010). ‘Sea pens’ most likely referred to Cavernularia sp., an octocoral that is common in the sand around Sydney, but which may still be undescribed (see https://www.inaturalist.org/observations/7015860, accessed 1 June 2022), in the family Veretillidae. Charonia rubicunda was a marine gastropod, now C. lampas, and Ritterella was a compound ascidian, most likely R. tokioka (Fig. 2).
Reef Life Surveys (RLS)
RLS is a global program that gathers underwater visual census data by using highly trained volunteers (Edgar and Stuart-Smith 2014). At the start of our study, an RLS site had already been established at Shiprock, with surveys being conducted in 2010, 2015 and early 2017 at depths between 8 and 10 m. A further three surveys were conducted by RLS volunteers (including author J. Turnbull) during our study, in 2018, 2019 and 2020. RLS transects run along a constant depth contour parallel to shore, not down from the shallows as in the perpendicular surveys, and avoid sand under the RLS method (Edgar and Stuart-Smith 2014).
Perpendicular transect surveys
Clarrie Lawler (1998) reported using surveys along two transects, A and B, running perpendicular to shore and down the Shiprock depth gradient (Fig. 3). The A transect ran from 1- to 16-m depth over a distance of 46 m, and the B transect ran from 1- to 14-m depth over a distance of 23 m. Species identifications for Lawler (1998) were confirmed in collaboration with the Australian Museum, often by physical samples collected from Shiprock (C. Lawler, pers. comm.). Whereas the survey method was structured, the data available for analysis were unstructured, reported in prose in the Wetlands article (Lawler 1998).
We replicated the original perpendicular transect methods by adapting RLS methods to vertical, rather than along-contour transects. These comprised fish blocks 5 m wide on either side of the transect tape, invertebrate and cryptic fish blocks 1 m wide on either side of the tape, and photo quadrats perpendicular to the substrate every 1–2 m, heading down the historical transect lines instead of across the wall face.
In total, 21 perpendicular transect surveys were conducted by scientists and volunteers between 2017 and 2019 (n = 12 by the authors of this paper; and n = 9 by URG + RLS surveyors), spanning all four seasons in most years. We captured a total of 856 photo quadrats of sufficient quality to enable the classification of sessile organisms during these surveys. Photo quadrats were classified as top (above the vertical wall lip), vertical wall or bottom (beyond the base of the wall, on transect A only). These were annotated in CoralNet (see https://coralnet.ucsd.edu/source/; Beijbom et al. 2012) with random placement of 25 annotation points, by using CATAMI classification to the morphotaxon level (Althaus et al. 2013).
iNaturalist
iNaturalist (see www.inaturalist.org) is a global citizen science platform hosted by the California Academy of Sciences and National Geographic Society (Mesaglio and Callaghan 2021). On 1 October 2017, we created the Revisiting Shiprock project on iNaturalist to encourage citizen scientists to upload their sightings at Shiprock. The project was open to members of the public, with a simple description of ‘Marine species found at Shiprock, Port Hacking, Sydney, Australia’ and a single rule that sightings must be from Shiprock, as denoted by a pin placed on the map. Almost 3 years later, on 21 September 2020, we extracted all research-grade records from iNaturalist, downloading 2358 records with metadata, including date of observation, date uploaded, user, place, species and common name.
Analysis
We classified all fish and mobile invertebrates at the species level, where possible. We analysed sessile invertebrates and most algae at the morphotaxa level because of difficulties in identification without physical samples, the taking of which is highly restricted in the Shiprock sanctuary zone. Owing to the sparse nature of data in the 1970s, 1990s and 2010s, and the relatively high abundance of data in the 1960s and 2010s, we aggregated our data into decades for analysis purposes. Our primary analysis focused on the changing presence of species, owing to shortage of specific quantitative abundance data and formal sampling structure in the historic records. Availability of categorical abundance data (such as a single sighting, few, many) did allow some comparison of relative abundances over time. Species were excluded from our analysis if they were (i) unable to be identified under a contemporary scientific name, (ii) difficult to distinguish visually from other species, (iii) highly cryptic and so unlikely to be noticed, or (iv) commonplace and therefore unlikely to be noted in Bulletins, dive logs or the 1998 paper.
These exclusions are detailed in Supplementary Table S1.
To identify species that have either increased or decreased over the study period, we used a ‘losers’ v. ‘winners’ categorisation, comparing the relatively data-rich decades of the 1960s and 2010s, that we considered appropriate given the limitations of our data. The winners v. losers approach has been applied in prior studies of pressures on marine systems (for example, Castro et al. 2021; Smith et al. 2021). We categorised losers as species that were recorded prior to the 1980s, i.e. including species found in the 1960s perpendicular surveys or 1960s and 1970s Bulletins and dive logs, but not recorded since. The 1980s were chosen as the delineator in our study because this period corresponds with a gap in the historical record at Shiprock and is approximately halfway in our historical timeline. Conveniently, it is also the period in which the Shiprock Aquatic Reserve was established. We categorised winners as species that were recorded after 1980, i.e. in the 1990s and 2000s dive logs, 2010–20 Reef Life surveys, 2017–19 perpendicular surveys or 2017–20 iNaturalist sightings, but with no corresponding records prior to the 1980s.
We chose selected statistical analyses where these were viable given the historical data limitations. These included Chi-Square tests comparing the 1960s to the 2010s for winners and losers, fished v. not fished species and northern, north + south and southern species, multivariate analysis of the community at Shiprock over the decades, and univariate analysis of the data from perpendicular surveys in the 1960s and 2010s, which we considered methodologically comparable. Where patterns were detected that were not significant, we applied power analysis using the R package pwr (ver. 1.3-0, S. Champely, see https://github.com/heliosdrm/pwr) to assess the detectable effect size. Multivariate analysis was conducted in R with the vegan package (ver. 2.6-10, J. Oksanen et al., see https://CRAN.R-project.org/package=vegan), using non-metric multi-dimensional scaling plots based on Gower similarity matrices. These data were not pre-treated with a transformation because our abundance scale of 0–4 already represented an approximation of a log transformation. Blank data in the periods of the 1970s, 1990s and 2000s were treated as missing, rather than zeros, owing to the lack of absence data in these periods.
Univariate analysis was conducted in R (ver. 4.4.1, R Foundation for Statistical Computing, Vienna, Austria, see https://www.R-project.org/) using the lme4 package (ver. 1.1–33, see https://CRAN.R-project.org/package=lme4; Bates et al. 2015) for mixed-effects modelling and DHARMa (ver. 0.4.6, F. Hartig, see https://cran.r-project.org/package=DHARMa) for verification of model assumptions. We investigated the interaction between period and range, and period and fished status, as predictors for species abundance, with a random effect of species, and the Poisson distribution. Range was determined from species distributions at https://reeflifesurvey.com/species/ (accessed 10 June 2022), categorising species with a distribution ranging from NSW northward as North, species ranging southward as South, and species limited to NSW or with a range both north and south of NSW as North + South. Fished status was set to ‘yes’ for species listed in the NSW Saltwater Fishing Guide (see https://www.dpi.nsw.gov.au/fishing/recreational/fishing-rules-and-regs/saltwater-recreational-fishing-guide, accessed 10 June 2022)
To compare the two modes of citizen science data collection, namely, structured surveys v. unstructured opportunistic sightings, we analysed the rate at which these methods detected species over time, and the types of ecological information that could be derived from them. We compared the cumulative rate of species detection for structured surveys (RLS and recent perpendicular transects) with that of opportunistic searching by untrained divers (iNaturalist) spanning the four contemporary years of 2017–20. We then compared the abundance and frequency of reporting of the most abundant and frequently reported species, so as to explore population and community perspectives. During this analysis, we also noted any patterns observed in the data, for example, differing proportions of particular species.
Results
In total, 339 taxa were described in the historical and contemporary records. The number of records and species were higher in the contemporary period (1990–2020), in part owing to the higher sampling effort including the new online source, iNaturalist (Table 1). After corrections and exclusions, these consolidated into 321 taxa, 135 in the historical period and 267 in the contemporary period (Table S1).
| Data source | Source type | Start year | End year | Samples | Number of records | Number of species | |
|---|---|---|---|---|---|---|---|
| Historical period: 1965–1979 | |||||||
| Original URG perpendicular surveys | Structured surveys, unstructured data | 1965 | 1969 | Unknown | 141A | 131B | |
| URG Bulletin (monthly) | Unstructured | 1965 | 1977 | 18 Bulletins | 165 | 36B | |
| URG dive logs (up to weekly) | Unstructured | 1965 | 1974 | 89 logs | 585 | 108B | |
| 1980s – no data; gazettal of Aquatic Reserve | |||||||
| Contemporary period: 1990–2020 | |||||||
| Reef Life Surveys | Structured | 2010 | 2020 | 6 surveys | 500 | 118 | |
| Repeat perpendicular surveys (URG and authors) | Structured | 2017 | 2019 | 21 surveys | 1389 | 147 | |
| URG dive logs | Unstructured | 1990 | 2013 | 55 logs | 857 | 35B | |
| iNaturalist | Unstructured | 1998C | 2020 | Unspecified | 2358 | 224D | |
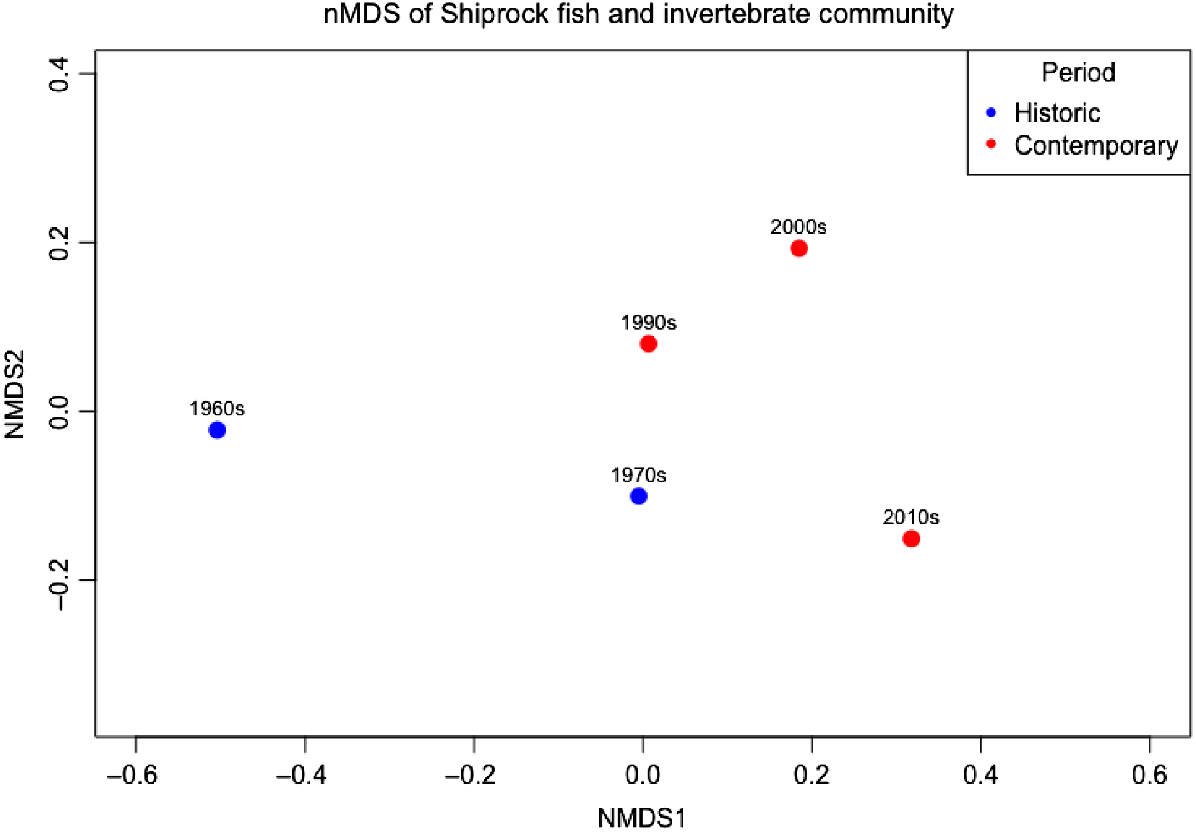
Non-metric multi-dimensional scaling analysis showed progressive change in the ecological community at Shiprock over the decades, from the historical (pre-1980s) to contemporary (post-1980s) periods (Fig. 4). This progression is evident in the Gower dissimilarity distances; 1960–1970s (0.479), 1990s (0.536), 2000s (0.644) and 2010s (0.832).
Non-metric multi-dimensional scaling representation by using Bray–Curtis resemblance of mobile animal communities at Shiprock from the 1960s to the 2010s.
Mobile animals
In total, 273 mobile fish and invertebrate species (i.e. excluding sessile invertebrates) were identified with sufficient confidence to allow comparison of historical data to contemporary records, with approximately twice as many fish (183 spp.) as invertebrates (90 spp.) (Table 2). A total of 64 species were excluded as overly common, cryptic or difficult to distinguish visually (Table S1). Of the remaining 209 species, 34% were recorded in both historical and contemporary periods, 11% were losers and 55% were winners.
| Item | Recorded both pre- and post-1980s | Loser (pre-1980s only) | Winner (post-1980s only) | Common (exclude) | Cryptic (exclude) | Difficult to distinguish (exclude) | Total | |
|---|---|---|---|---|---|---|---|---|
| Fish | 44 | 7 | 88 | 7 | 21 | 16 | 183 | |
| Mobile invertebrate | 28 | 16 | 26 | 7 | 9 | 4 | 90 | |
| Total | 72 | 23 | 114 | 14 | 30 | 20 | 273 |
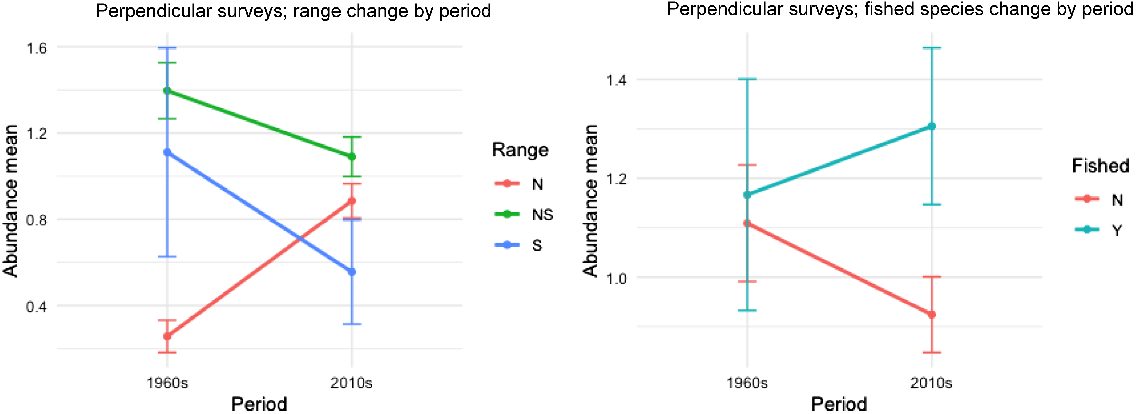
Significantly more loser species were invertebrates (χ2 = 13.43, P < 0.001), whereas significantly more winner species were fishes (χ2 = 5.84, P = 0.015) (Table S1). Our analysis of perpendicular surveys showed a significant increase in abundances of mobile animals with a northern range from the 1960s to the 2010s (Est. = 1.23, P = 0.001), alongside a significant decrease in abundances of animals with a southern range and both north + south range (Est. = −1.92, P = 0.003 and Est. = −1.48, P < 0.001 respectively) (Fig. 5; Table 3). Although there was an observable increase in fished species’ abundances and decrease in non-fished species’ abundances from the 1960s to the 2010s, this result was not significant (Est. = 0.295, P = 0.236) (Fig. 5). Power analysis of changes in abundance between fished and non-fished species between these periods showed that the observed effect size is low (0.050). Given the sample size and a power target of 0.8, an effect size of at least 0.2 would be required for detection.
Abundance scale means for surveys perpendicular to shore at Shiprock, from the 1960s and 2010s, showing interactions between period and range and period and fished status. Error bars indicate standard errors. Range N, north of Sydney; S, south of Sydney; and NS, both. Fished status: N, not fished; Y, fished, on the basis of the NSW Recreational Saltwater Fishing Guide.
| Item | 1960s | 2010s | |||||
|---|---|---|---|---|---|---|---|
| Fish | Invertebrates | Total | Fish | Invertebrates | Total | ||
| Range | |||||||
| North | 8 | 1 | 9 | 29 | 0 | 29 | |
| North + South | 38 | 33 | 71 | 52 | 26 | 78 | |
| South | 1 | 4 | 5 | 3 | 1 | 4 | |
| Fished status | |||||||
| No | 36 | 31 | 67 | 61 | 22 | 83 | |
| Yes | 11 | 7 | 18 | 23 | 5 | 28 | |
| Total | 47 | 38 | 85 | 84 | 27 | 111 | |
Ranges are based on distributions at www.reeflifesurvey.com. Fished status: Yes, for species listed in the NSW Recreational Saltwater Fishing Guide.
Sessile biota
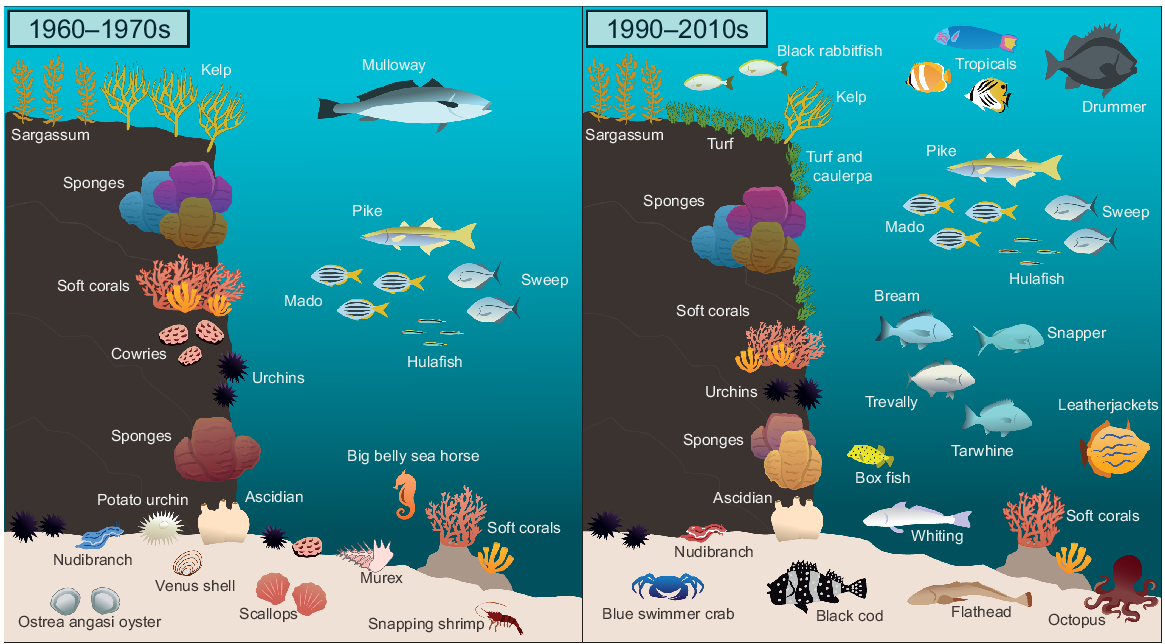
The 1960s account of Shiprock described abundant Sargassum and Ecklonia along the top of the wall, accompanied by a ‘multitude of animals’, including molluscs, urchins, ascidians and bryozoans (Lawler 1998). The wall was inhabited by ‘hosts of encrusting invertebrates’ including ascidians, bryozoans, hydroids, worms, sponges and soft and hard corals. At the base of the wall were layers of bivalves, a wide diversity of gastropods and urchins (Fig. 1). The sandy bottom was inhabited by sea stars, urchins and sea pens.
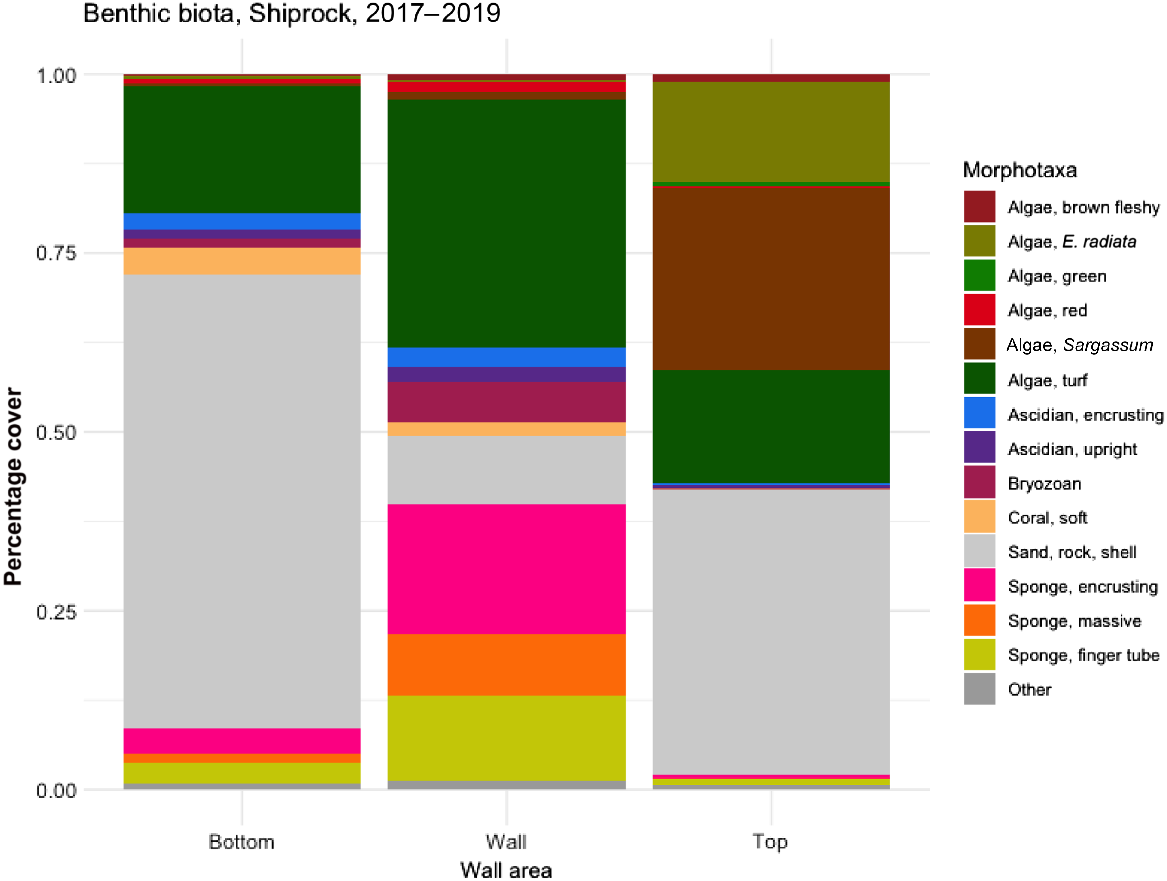
Today, the section of Shiprock above the wall is primarily sand, shell and rock, with substantial stands of Sargassum sp., some Ecklonia radiata and a small number of invertebrates (Fig. 6). The vertical wall is dominated by turfing and epiphytic algae and mostly sponges, with some corals, bryozoans and ascidians. Along the base of the wall are primarily sand, rubble and turfing algae with some encrusting invertebrates.
Algae
We categorised one species of algae as a loser (Ecklonia radiata, kelp) and one as a winner (Caulerpa taxifolia).
Ecklonia radiata was recorded in the 1960s surveys as ‘forming an almost unbroken frieze along the top edge of the submarine cliff’ and as ‘dense growths’ in the shallows. Many kelp were recorded in dive logs in the 1960s and 1970s, and noted as being eaten by sea urchins in the January 1969 Bulletin. These historical observations contrast with our contemporary ones, where we observed no unbroken frieze or dense growth, and just 14.8% coverage of E. radiata at the top of the wall (Fig. 6).
Sargassum now occupies three times the area (44.8%) and algal turf more than double the area (33.5%) of kelp. Sargassum was noted in the 1960s as abundant, and algal turf is unlikely to have been noted by divers, so we did not categorise either of these as winners. However, Caulerpa taxifolia is a notable invasive species that was first recorded in a dive log in January 2009.
Scientific names
Our analysis of scientific names showed substantial changes between the historical and contemporary periods. Of the 114 species identified in the 1998 Wetlands article (17 of the total of 131 taxa were genera or multiple species), one-quarter (29 species) had different or unknown scientific names today (Table S2).
Species detection effectiveness
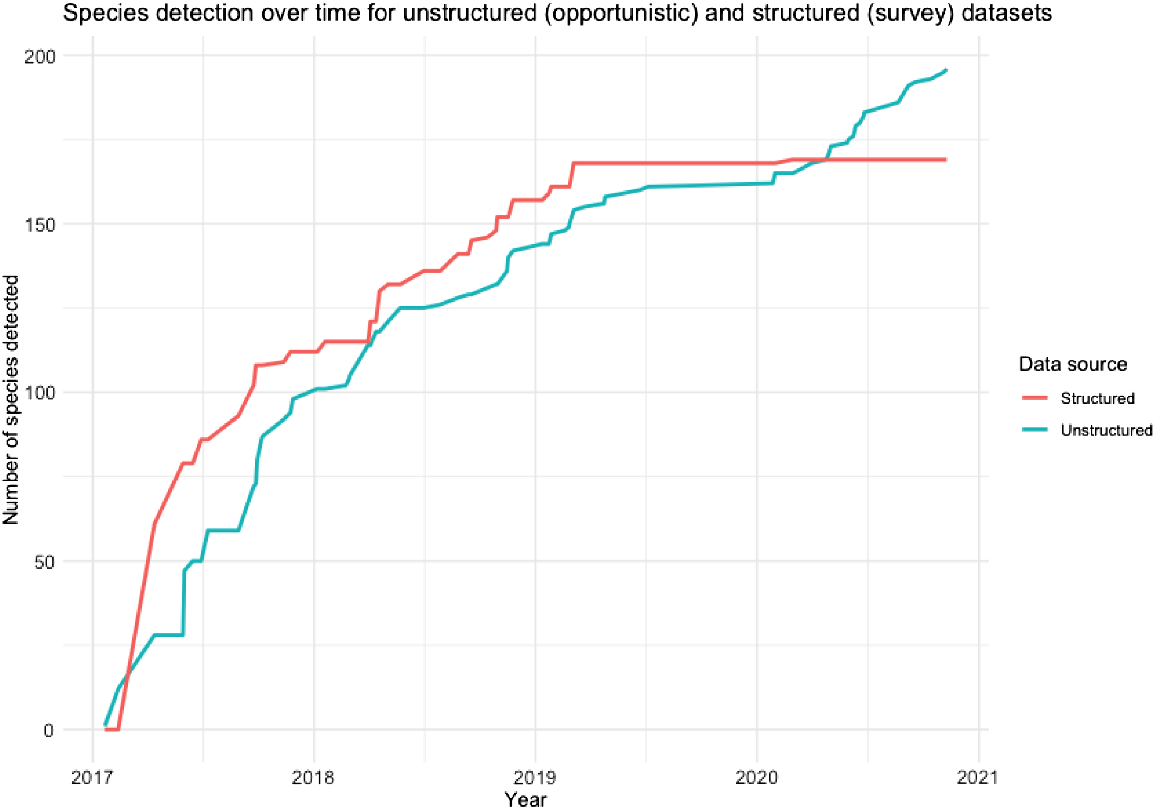
Overall, we found a similar rate of species detection between structured and opportunistic sampling modes over 4 years. Structured sampling surveys found more species in the first 2 years; however, on completion of the structured surveys, new species continued to be recorded in iNaturalist, exceeding the structured survey tally (Fig. 7).
Cumulative rate of species detection over time during two parallel projects; structured surveys (perpendicular transects and RLS) compared with unstructured, opportunistic sampling (iNaturalist).
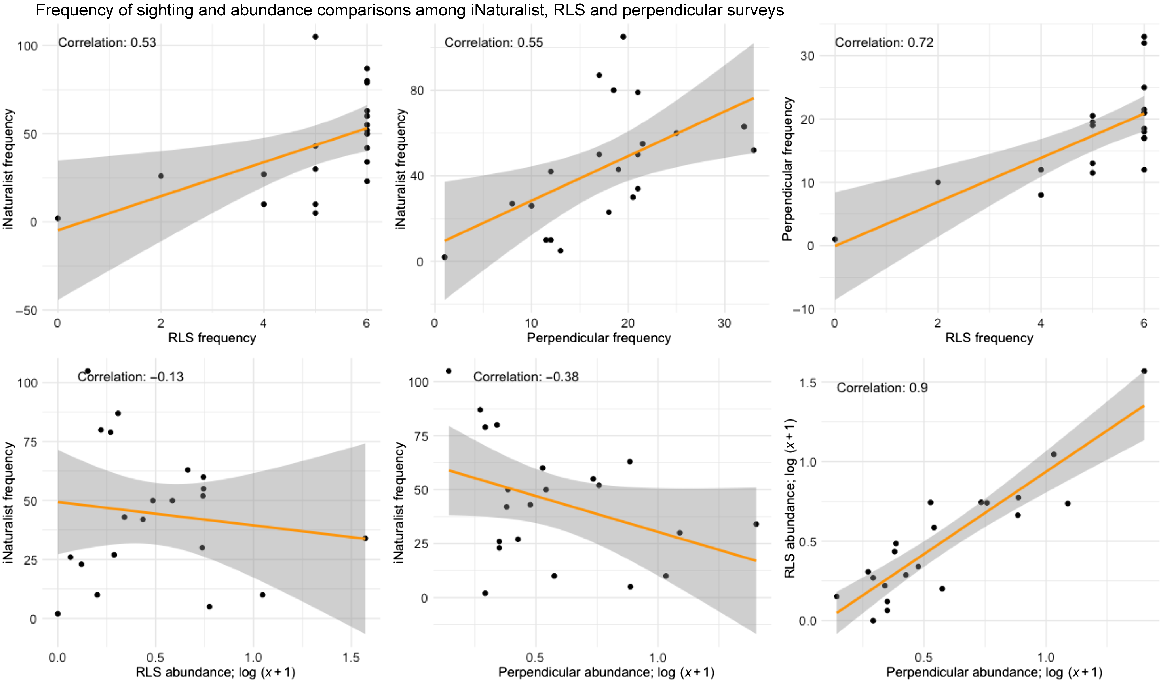
Structured surveys reported abundances and, because of the standardised survey area, densities, whereas such information could not be derived from the opportunistic sampling data. Fish biomass data could also be calculated from the structured data by using fish size classes and the allometric growth equation (R. Froese and D. Pauly, FishBase, ver. 06/2017, see www.fishbase.org). Opportunistic data included all the top 20 species in the Shiprock marine community, but in very different proportions to the structured surveys (Fig. 8). We observed that the more frequently reported species were generally large, colourful and easy to photograph (Table S3).
Data collection comparisons of most frequently reported species at Shiprock (Table S5). Data points with regression lines (yellow) and standard errors (grey bands). Frequency of recording of species and abundances for perpendicular and RLS structured surveys, and iNaturalist opportunistic sampling frequencies, in six combinations.
Discussion
Using a combination of structured and unstructured data sources, we found a substantial change in the marine community over half a century. Despite the serendipitous nature of much of our data, we detected evidence of major long-term human impacts and stewardship through citizen science over timescales exceeding that found in more traditional scientific studies. Substantial changes, elaborated and discussed below, include declines in the foundation species Ecklonia radiata, arrival of the invasive species Caulerpa taxifolia, arrival of significantly more northern, tropical species than southern species, declines in some mobile invertebrates, local extirpation of a depleted species Argyrosomus japonicus, and arrival of several previously fished species, including the now-protected black cod (Epinephelus daemelii) (Fig. 9, Table S1).
Climate change
The clearest indication of the impacts of climate change at Shiprock is in the disproportionate arrival of tropical species from the north. Tropicalisation of marine communities has been documented in numerous studies along the eastern coast of Australia and worldwide (Vergés et al. 2016; Vergés et al. 2019). Although large-scale change cannot be generalised from a single site, it is instructive that Shiprock provides evidence of this global change process in the opportunistic data record. Closely observed sites such as Shiprock can function as long-term sentinels of change (Micheli et al. 2020), informing the design of broader studies that can provide more generalisable conclusions.
Several northern arrivals have the potential for substantial ecological impacts. The black rabbitfish (Siganus fuscescens) is a schooling herbivore that can affect the health of kelp forests (Gajdzik et al. 2021) and may become invasive in the future. The congeneric S. rivulatus, for example, is considered invasive in other jurisdictions (Pickholtz et al. 2018) and, together with other rabbitfish species, can severely deplete macroalgae biomass over large areas (Vergés et al. 2014). Surgeonfishes (Acanthurus spp.) can increase herbivory pressure through schooling (Basford et al. 2015), and large-bodied predators from the Epinephelus genus (gropers) can affect communities both through predation and habitat engineering (Stallings 2008; Ellis 2019).
Declines in kelp at Shiprock may also be related to direct impacts of climate change. Kelp declines related to warmer, nutrient-poor tropical waters have been documented in multiple jurisdictions (Smale 2020). Such losses can have flow-on effects through the loss of the ecosystem services that kelp provides, such as shelter, habitat, nutrient cycling and productivity (Steneck and Johnson 2013). Loss of kelp may then provide space for fast-growing, opportunistic species such as turfing algae and invasive species (Filbee-Dexter et al. 2016).
Invasive species
Surprisingly few invasive species were detected at Shiprock, possibly due to the restriction of our study to CATAMI categories for sessile species and lack of awareness of invasive species by citizen scientists. Many invasive species are cryptic, unremarkable and uncharismatic (see https://www.dpi.nsw.gov.au/fishing/aquatic-biosecurity/pests-diseases/marine-pests, accessed 8 June 2022).
The invasive colonial ascidian (Didemnum vexillum) and fanworm (Sabella spallanzanii) have both been recorded in iNaturalist in the estuary but not at Shiprock (www.inaturalist.org, accessed 8 June 2022). An encrusting colonial ascidian most likely to be D. vexillum was found to be abundant at Shiprock by the authors over the course of this study (e.g. https://flic.kr/p/2acViVS, accessed 8 June 2022).
The Pacific oyster (Magallana gigas) had a single sighting at Shiprock in 2020 (Table S1). No other declared marine invasives were recorded in our study except the alga Caulerpa taxifolia, which was promoted to the diving community as invasive in 2002 (see https://www.urgdiveclub.org.au/post/north-harbour-aquatic-reserve-project-summary, accessed 6 June 2022). There are multiple records of C. taxifolia in Port Hacking, including two at Shiprock (see www.inaturalist.org, accessed 9 June 2022).
Although opportunistic data collection has been found to be useful for monitoring invasive species (Crall et al. 2010), our study has highlighted that care must be taken to manage biases arising from (lack of) awareness and detectability of species.
Over-exploitation and marine protected areas
Although Shiprock is a very small Aquatic Reserve, small MPAs can be effective for some species if they are no take (sanctuary zone), well located and supported by the local community (Turnbull et al. 2018). We found an observable but non-significant increase in fished species’ abundance between the historical and contemporary periods, and there was a wide range of fished species that were not recorded at Shiprock before MPA gazettal in the 1980s, but which were now regularly reported, sometimes in substantial numbers. Many winners such as yellow-fin bream (Acanthopagrus australis) and snapper (Pagrus auratus) were recorded on our transects, together with morwong, leatherjackets, drummer, trevally and tarwhine. Fished invertebrates were also recorded for the first time since the 1980s, including octopus, blue swimmer crabs and cuttlefish.
Mulloway (A. japonicus) has not been recorded in recent times, despite having been recorded at Shiprock in the 1960s. Once widely distributed in subtropical and temperate Australian shallow waters (see https://www.dpi.nsw.gov.au/__data/assets/pdf_file/0005/1329611/stock-status-summary-2021-mulloway.pdf, accessed 7 June 2022), mulloway has been the subject of widescale commercial and recreational fishing, with commercial landings declining over the past 50 years to arrive at today’s depleted stock status. The Shiprock Aquatic Reserve does not appear to have been sufficient to restore local mulloway populations, which is most likely a result of the small size of the reserve being inadequate to offer effective protection for this wide-ranging species (Moffitt et al. 2009).
The Shiprock MPA may also have protected aquaria-targeted species (Madrigal-Mora et al. 2022), including colourful fishes such as Canthigaster callisterna, Chromis hypsilepis, Dendrochirus brachypterus, Mecaenichthys immaculatus, Thalassoma lunare, Abudefduf spp., Acanthurus spp. and Chaetodon spp. all listed as winners in our study.
Multiple stressors
Most of our loser species were invertebrates, particularly molluscs. Mobile invertebrates in Australia’s cool latitudes are particularly vulnerable because warming waters from the north squeeze populations against deep ocean barriers in the south, putting over 30% of species at high risk of extinction (Edgar et al. 2023). Nine of our 12 mollusc losers rely on calcium carbonate shells, the cowries, whelks and bivalves, resulting in a possible additional threat from climate change through ocean acidification (Parker et al. 2013).
In addition to global climate-change pressures, the bivalves Ostrea angasi and Pecten fumatus have been affected by local human exploitation (Flood et al. 2012; Cook et al. 2021). Ostrea angasi is endemic to Australia’s southern waters, but has experienced declines in many locations. It is the subject of recent restoration programs (Pereira et al. 2019), but restoration can be challenging because multiple stressors are at play. In addition to climate change and over-exploitation, habitat loss, sedimentation and nutrient inflows have contributed to population reductions in this socially valuable species (Cook et al. 2021).
These additional stressors may also be at play in other results in our study. Although fishing pressure is moderate in Port Hacking (Steffe and Murphy 2011), even small levels of exploitation can affect populations, and the small size of the Shiprock reserve may limit its effectiveness (Edgar et al. 2014; Turnbull et al. 2018). The majority of the shoreline and catchment in Port Hacking is undeveloped and pollution levels are reported to be low, but pollutants are higher in concentration in northern embayments and so may also be affecting on the community at Shiprock (Alyazichi et al. 2021; Birch et al. 2021).
Threatened, vulnerable and protected species
Several threatened, vulnerable and protected species were recorded at Shiprock (see https://www.dpi.nsw.gov.au/fishing/species-protection/what-current, accessed 9 June 2022) (Table S1). The charismatic blue groper (Achoerodus viridis) is protected from spearfishing in NSW (see https://www.marineconservation.org.au/bluegroper/, accessed 8 June 2022) and has increased in numbers over the period of our study. White’s seahorse (Hippocampus whitei) was first recorded in 1965 (Lawler 1998) then not again for over 30 years, until being photographed in 1998, 2004 and 2008 (see www.inaturalist.org). Another seahorse, H. abdominalis, and the ornate ghost pipefish (Solenostomus paradoxus) have not been recorded since the 1960s. Whereas H. whitei is specifically listed as Endangered under Australia’s Environment Protection and Biodiversity Conservation Act 1999 (see http://www.environment.gov.au/cgi-bin/sprat/public/publicspecies.pl?taxon_id=66240, accessed 9 June 2022), these latter two species fall under more general syngnathid protection (see https://www.legislation.gov.au/Details/C2021C00182, accessed 8 June 2022).
Black cod (Epinephelus daemelii) was only recorded at Shiprock after the establishment of the Aquatic Reserve, in 1999 and again in 2003 URG diver logs, and in recent years on RLS and iNaturalist (Table S1). Black cod is listed as Near Threatened on the IUCN Red List and Vulnerable in NSW after declines caused by overfishing dating back over 100 years (Francis et al. 2016). Slow growing, long lived and a target for spear-fishers, this species has been protected in NSW since 1983, but has been slow to recover (Harasti and Malcolm 2013).
Sampling and technology change
Our conclusions must be considered in light of the historical and structural limitations of the data collection methods and technologies employed. Early data collection at Shiprock required hand-written notes, drawings, memory and physical sample collection. Underwater cameras were not widely available nor affordable. Over the 58 years of our study, there was an observable increase in the ease and volume of data collection, ranging from several species able to be recorded by hand or collected on a dive in the 1960s, to 24–36 photographs that could be taken on a single roll of film, to hundreds of photographs taken per dive with a modern digital camera.
The publication process has also accelerated in efficiency over that time, and contemporary online technologies provide a novel layer of personal motivation and reinforcement (Jennett et al. 2016). Historical data were either rarely published, for example, in personal dive logs and collections, or required extensive manual effort in hand drawing, colouring, stencilling and physical printing and distribution. It is probable therefore that many species may have been present at Shiprock without ever appearing in the historical record.
Structured v. unstructured data collection
Although it is difficult to compare structured surveys to unstructured opportunistic sampling due to the wide variation in sampling effort, our study standardises the spatial scale to a single site and provides a basis for temporal comparison by using parallel structured and unstructured projects. The structured project involved trained professional and citizen scientists conducting surveys over standardised areas, and the unstructured project involved initiating an online effort for anyone with an underwater camera to record species in the same time and space. Despite the divergent methods, the rate at which these two projects identified species was surprisingly similar (Fig. 7).
Frequency of sightings (i.e. presence on a survey) was strongly positively correlated between structured (RLS and perpendicular survey) methods, and moderately correlated between these and iNaturalist (Fig. 8). We found a weak negative correlation between the iNaturalist frequency of sighting (as a possible proxy for abundance of a species) and abundance in the structured surveys, even though the data sets are not directly comparable. This appeared to be due to the most abundant, but non-charismatic species such as T. taeniatus, S. lineolata, T. novozelandiae and A. strigatus being infrequently noticed and recorded in iNaturalist (Table S3).
The potential application of structured v. unstructured, opportunistic data sets therefore varied substantially. Whereas structured surveys provided reliable information beyond a list of species, such as densities, species absence, community structure and change over time, unstructured sightings provided primarily species presence. Structured surveys can also be designed to target inconvenient or inaccessible times and places (Callaghan et al. 2020), particularly if they are part of a broader program such as Reef Life Survey. As opportunistic records represented no systematic search in either time or space, there were no reliable absence records, and sighting frequencies were widely divergent from structured survey abundances and densities.
As part of our analysis, we observed that colourful, photogenic and charismatic species were frequently reported in iNaturalist, despite comprising a small proportion of individuals on a standardised transect (e.g. in the case of S. jacksoniensis, less than 1%). Other studies have noted this bias (Roberts et al. 2022). Although modelling may be used to attempt to compensate for the limitations of unstructured data, such as by mimicking randomness in absence and hypothesising factors such as detectability and observer effort (Brown and Williams 2019), such models require their own set of assumptions. Such assumptions do not consider observer-driven variations in sampling effort, for example, a diver focusing on photographing gobies for a period, which then gives a false signal of change in the opportunistic data record.
There were also notable differences between RLS and perpendicular surveys. RLS places transects along a depth contour on hard substrate, avoiding sand, and at Shiprock the chosen RLS depths were between 6 and 10 m. Perpendicular surveys ran down from the water surface to the deepest point on the site, spanning sand and rubble both above and below the wall and incorporating very shallow areas. Sand- and subsurface-dwelling fish were therefore more abundant on perpendicular transects, for example, G. subfasciatus and A. vaigiensis juveniles respectively. Fish that prefer structured habitat were more abundant on RLS transects, for example, T. taeniatus and O. limenus. It is evident that, even with structured survey methods, it is important to understand methodological foci and limitations.
Overall, we found that structured surveys provided broader community, population and temporal-change information, whereas unstructured sampling provided better recording of rare, threatened and invasive species (Roberts et al. 2022), and the potential for retrospectivity (Table 4).
| Ecological information | Structured surveys | Opportunistic sampling | |
|---|---|---|---|
| Species presence | Yes | Yes | |
| Species absence | Yes | No | |
| Species richness | Yes | Limited (not standardised) | |
| Invasive species distribution | Limited | Yes, if salient | |
| Threatened species distribution | Limited | Yes, if salient | |
| Coverage in remote areas | Yes, if planned | Likely to be low | |
| Abundance | Yes | Limited | |
| Biomass | Yes | No | |
| Population change | Yes | No | |
| Community structure | Yes | No | |
| Potential for retrospectivity | No | Yes |
Relevance to management, governance and sustainability
Our study has highlighted the value and potentially irreplaceable nature of historical ecological information at high stewardship sites such as Shiprock. Such sites represent an opportunity for managers to discover indicators of change spanning retrospective timescales, which are impossible in newly designed forward-looking studies.
Both structured and unstructured data have limitations. For example, loser species may be detected in unstructured, opportunistic data, particularly if they are explicitly searched for in a current project, but winners cannot be conclusively determined without historical structured searches that reliably detect absences. Frequency of opportunistic observation is not a suitable proxy for abundance, and biomass, population and community structural information can at best be modelled using assumptions. Structured surveys are superior for broad-scope, reliable community change information; however, such data are less abundant and so are of very high value where they do exist. Merged, diverse data sets incorporating structured and unstructured data therefore provide the most comprehensive insights.
Our study has shown that a single site such as Shiprock can be a sentinel for change, including detecting declines in foundation species, community shifts relating to global factors such as climate change, and local winner and loser species. However, this depends on an active, engaged local community that takes on the challenge of monitoring and conserving the site. Management actions that encourage such local stewardship can therefore have wide-ranging benefits for the long-term sustainability of the social–ecological system.
Data availability
The data used to generate the results of this paper are available in the Supplementary material, at https://www.inaturalist.org/projects/shiprock and at https://portal.aodn.org.au/search, keyword ‘RLS’. A preprint version of this article is available in ResearchSquare (Turnbull et al. 2024).
Conflicts of interest
The authors declare that they have no conflicts of interest. John Turnbull is a volunteer and advisory council member of Reef Life Survey, member of the URG and contributor to iNaturalist.
Declaration of funding
Funding for this research was provided by the University of New South Wales and The University of Sydney, an Australian Government Research Training Program (RTP) scholarship awarded to J. Turnbull and ARC SRIEAS Grant SR200100005, Securing Antarctica’s Environmental Future, to Graeme Clark.
Acknowledgements
The authors express their deep gratitude to Clarrie Lawler, who passed away during our study, and to his family, particularly Denise Lawler who remains a member of URG today. We also thank Prof. Emma L. Johnston for her steady support and insight; Prof. Adriana Vergés for her insightful comments and reviews of our manuscript; Dr Sonia Graham, Lana Kajlich, Mathilde Chevalier and Steve Samois who contributed to components of this study, including design, data collection and annotation; and Jordana Costa for the summary infographic. Finally, we thank all of the volunteers at RLS, URG and on iNaturalist who provided data essential to the success of our study.
References
Aceves-Bueno E, Adeleye AS, Feraud M, Huang Y, Tao M, Yang Y, Anderson SE (2017) The accuracy of citizen science data: a quantitative review. The Bulletin of the Ecological Society of America 98(4), 278-290.
| Crossref | Google Scholar |
Althaus F, Hill N, Edwards L, Ferrari R, Case M, Colquhoun J (2013) CATAMI Classification Scheme for scoring marine biota and substrata in underwater imagery – a pictorial guide to the collaborative and annotation tools for analysis of marine imagery and video (CATAMI) classification scheme. Version 1.4 – December 2014. (CATAMI) Available at https://catami.org/wp-content/uploads/sites/2/2023/03/CATAMI_class_PDFGuide_V4_20141218.pdf
Alyazichi YM, Qasim AK, Jones BG, McLean E, Murad J, Aljawi A (2021) Geochemistry, spatial distribution, and sources of trace element pollution in the surface sediments of Port Hacking, southern Sydney, Australia. Anthropocene Coasts 4(1), 1-16.
| Crossref | Google Scholar |
Balée W (2006) The research program of historical ecology. Annual Review of Anthropology 35, 75-98.
| Crossref | Google Scholar |
Basford AJ, Feary DA, Truong G, Steinberg PD, Marzinelli EM, Vergés A (2015) Feeding habits of range-shifting herbivores: tropical surgeonfishes in a temperate environment. Marine and Freshwater Research 67(1), 75-83.
| Crossref | Google Scholar |
Bates D, Mächler M, Bolker B, Walker S (2015) Fitting linear mixed-effects models using lme4. Journal of Statistical Software 67(1), 1-48.
| Crossref | Google Scholar |
Beijbom O, Edmunds PJ, Kline DI, Mitchell BG, Kriegman D (2012) Automated annotation of coral reef survey images. In ‘2012 IEEE Conference on Computer Vision and Pattern Recognition’, 16–21 June 2012, Providence, RI, USA. pp. 1170–1177. (IEEE) 10.1109/CVPR.2012.6247798
Beller EE, McClenachan L, Zavaleta ES, Larsen LG (2020) Past forward: recommendations from historical ecology for ecosystem management. Global Ecology and Conservation 21, e00836.
| Crossref | Google Scholar |
Birch GF, Lee J-H, Gunns T (2021) Baseline assessment of anthropogenic change and ecological risk of an estuary bordered by an urbanized catchment and a pristine national park (Port Hacking estuary, Australia). Marine Pollution Bulletin 162, 111822.
| Crossref | Google Scholar |
Blasi M, Carrié R, Fägerström C, Svensson E, Persson AS (2023) Historical and citizen-reported data show shifts in bumblebee phenology over the last century in Sweden. Biodiversity and Conservation 32(5), 1523-1547.
| Crossref | Google Scholar |
Brook BW, Sodhi NS, Bradshaw CJA (2008) Synergies among extinction drivers under global change. Trends in Ecology & Evolution 23(8), 453-460.
| Crossref | Google Scholar |
Brown ED, Williams BK (2019) The potential for citizen science to produce reliable and useful information in ecology. Conservation Biology 33(3), 561-569.
| Crossref | Google Scholar |
Callaghan CT, Poore AGB, Major RE, Rowley JJL, Cornwell WK (2019) Optimizing future biodiversity sampling by citizen scientists. Proceedings of the Royal Society of London – B. Biological Sciences 286(1912), 20191487.
| Crossref | Google Scholar |
Callaghan CT, Roberts JD, Poore AGB, Alford RA, Cogger H, Rowley JJL (2020) Citizen science data accurately predicts expert-derived species richness at a continental scale when sampling thresholds are met. Biodiversity and Conservation 29, 1323-1337.
| Crossref | Google Scholar |
Callaghan CT, Poore AGB, Mesaglio T, Moles AT, Nakagawa S, Roberts C, et al. (2021) Three frontiers for the future of biodiversity research using citizen science data. Bioscience 71(1), 55-63.
| Crossref | Google Scholar |
Castro N, Ramalhosa P, Cacabelos E, Costa JL, Canning-Clode J, Gestoso I (2021) Winners and losers: prevalence of non-indigenous species under simulated marine heatwaves and high propagule pressure. Marine Ecology Progress Series 668, 21-38.
| Crossref | Google Scholar |
Concepcion GT, Kahng SE, Crepeau MW, Franklin EC, Coles SL, Toonen RJ (2010) Resolving natural ranges and marine invasions in a globally distributed octocoral (genus Carijoa). Marine Ecology Progress Series 401, 113-127.
| Crossref | Google Scholar |
Cook PA, Warnock B, Gillies CL, Hams AB (2021) Historical abundance and distribution of the native flat oyster (Ostrea angasi) in estuaries of the Great Southern region of Western Australia help to prioritise potential sites for contemporary oyster reef restoration. Marine and Freshwater Research 73(1), 48-56.
| Crossref | Google Scholar |
Crall AW, Newman GJ, Jarnevich CS, Stohlgren TJ, Waller DM, Graham J (2010) Improving and integrating data on invasive species collected by citizen scientists. Biological Invasions 12, 3419-3428.
| Crossref | Google Scholar |
Dickinson JL, Zuckerberg B, Bonter DN (2010) Citizen science as an ecological research tool: challenges and benefits. Annual Review of Ecology, Evolution, and Systematics 41, 149-172.
| Crossref | Google Scholar |
Edgar GJ, Stuart-Smith RD (2009) Ecological effects of marine protected areas on rocky reef communities – a continental-scale analysis. Marine Ecology Progress Series 388, 51-62.
| Crossref | Google Scholar |
Edgar GJ, Stuart-Smith RD (2014) Systematic global assessment of reef fish communities by the Reef Life Survey program. Scientific Data 1, 140007.
| Crossref | Google Scholar |
Edgar GJ, Stuart-Smith RD, Willis TJ, Kininmonth S, Baker SC, Banks S, et al. (2014) Global conservation outcomes depend on marine protected areas with five key features. Nature 506(7487), 216-220.
| Crossref | Google Scholar |
Edgar GJ, Stuart-Smith RD, Heather FJ, Barrett NS, Turak E, Sweatman H, et al. (2023) Continent-wide declines in shallow reef life over a decade of ocean warming. Nature 615(7954), 858-865.
| Crossref | Google Scholar |
Ellis RD (2019) Red grouper (Epinephelus morio) shape faunal communities via multiple ecological pathways. Diversity 11(6), 89.
| Crossref | Google Scholar |
Filbee-Dexter K, Feehan CJ, Scheibling RE (2016) Large-scale degradation of a kelp ecosystem in an ocean warming hotspot. Marine Ecology Progress Series 543, 141-152.
| Crossref | Google Scholar |
Flood M, Stobutzki I, Andrews J, Ashby C, Begg G, Fletcher R, Galeano D, Gardner C, Gibson B, Gray C, Hone P, Horvat P, McDonald B, Quinn R, Rowling K, Sainsbury K, Saunders T, Sloan S, Smith T, Ward T (2012) Status of key Australian fish stocks reports 2012. The inaugural process of production and lessons learned. Fisheries Research and Development Corporation Project number 2011-513. (Australian Bureau of Agricultural and Resource Economics and Sciences: Canberra, ACT, Australia)
Francis MP, Harasti D, Malcolm HA (2016) Surviving under pressure and protection: a review of the biology, ecology and population status of the highly vulnerable grouper Epinephelus daemelii. Marine and Freshwater Research 67(8), 1215-1228.
| Crossref | Google Scholar |
Gajdzik L, DeCarlo TM, Koziol A, Mousavi-Derazmahalleh M, Coghlan M, Power MW, et al. (2021) Climate-assisted persistence of tropical fish vagrants in temperate marine ecosystems. Communications Biology 4(1), 1231.
| Crossref | Google Scholar |
Harasti D, Malcolm H (2013) Distribution, relative abundance and size composition of the threatened serranid Epinephelus daemelii in New South Wales, Australia. Journal of Fish Biology 83(2), 378-395.
| Crossref | Google Scholar |
Jackson JBC, Kirby MX, Berger WH, Bjorndal KA, Botsford LW, Bourque BJ, Bradbury RH, Cooke R, Erlandson J, Estes JA, Hughes TP, Kidwell S, Lange CB, Lenihan HS, Pandolfi JM, Peterson CH, Steneck RS, Tegner MJ, Warner RR (2001) Historical overfishing and the recent collapse of coastal ecosystems. Science 293(5530), 629-637.
| Crossref | Google Scholar |
Jennett C, Kloetzer L, Schneider D, Iacovides I, Cox A, Gold M, et al. (2016) Motivations, learning and creativity in online citizen science. Journal of Science Communication 15(3), A05.
| Crossref | Google Scholar |
Lawler CJ (1998) The subtidal flora and fauna at Shiprock, Port Hacking, New South Wales during 1965–1970. Wetlands Australia Journal 17(2), 41-59.
| Google Scholar |
Lepczyk CA, Boyle OD, Vargo TL, Gould P, Jordan R, Liebenberg L, et al. (2009) Symposium 18: citizen science in ecology: the intersection of research and education. The Bulletin of the Ecological Society of America 90(3), 308-317.
| Crossref | Google Scholar |
Madrigal-Mora S, Hannes Eisele M, Espinoza M (2022) Do reef fish assemblages benefit from a marine protected area in the north Pacific coast of Costa Rica? Environmental Biology of Fishes 105(5), 541-559.
| Crossref | Google Scholar |
McClenachan L, Ferretti F, Baum JK (2012) From archives to conservation: why historical data are needed to set baselines for marine animals and ecosystems. Conservation Letters 5(5), 349-359.
| Crossref | Google Scholar |
McKinley AC, Ryan L, Coleman MA, Knott NA, Clark G, Taylor MD, Johnston EL (2011) Putting marine sanctuaries into context: a comparison of estuary fish assemblages over multiple levels of protection and modification. Aquatic Conservation: Marine and Freshwater Ecosystems 21(7), 636-648.
| Crossref | Google Scholar |
Meehan AJ, West RJ (2002) Experimental transplanting of Posidonia australis seagrass in Port Hacking, Australia, to assess the feasibility of restoration. Marine Pollution Bulletin 44(1), 25-31.
| Crossref | Google Scholar |
Mesaglio T, Callaghan CT (2021) An overview of the history, current contributions and future outlook of iNaturalist in Australia. Wildlife Research 48(4), 289-303.
| Crossref | Google Scholar |
Micheli F, Carlton J, Pearse J, Selgrath J, Elahi R, Watanabe J, et al. (2020) Field stations as sentinels of change. Frontiers in Ecology and the Environment 18(6), 320-322.
| Crossref | Google Scholar |
Moffitt EA, Botsford LW, Kaplan DM, O’Farrell MR (2009) Marine reserve networks for species that move within a home range. Ecological Applications 19(7), 1835-1847.
| Crossref | Google Scholar |
Parker LM, Ross PM, O’Connor WA, Pörtner HO, Scanes E, Wright JM (2013) Predicting the response of molluscs to the impact of ocean acidification. Biology 2(2), 651-692.
| Crossref | Google Scholar |
Pereira RRC, Scanes E, Parker LM, Byrne M, Cole VJ, Ross PM (2019) Restoring the flat oyster Ostrea angasi in the face of a changing climate. Marine Ecology Progress Series 625, 27-39.
| Crossref | Google Scholar |
Pickholtz RSM, Kiflawi M, Friedlander AM, Belmaker J (2018) Habitat utilization by an invasive herbivorous fish (Siganus rivulatus) in its native and invaded range. Biological Invasions 20, 3499-3512.
| Crossref | Google Scholar |
Roberts CJ, Vergés A, Callaghan CT, Poore AGB (2022) Many cameras make light work: opportunistic photographs of rare species in iNaturalist complement structured surveys of reef fish to better understand species richness. Biodiversity and Conservation 31(4), 1407-1425.
| Crossref | Google Scholar |
Scarborough C, Welch ZS, Wilson J, Gleason MG, Saccomanno VR, Halpern BS (2022) The historical ecology of coastal California. Ocean & Coastal Management 230, 106352.
| Crossref | Google Scholar |
Smale DA (2020) Impacts of ocean warming on kelp forest ecosystems. New Phytologist 225(4), 1447-1454.
| Crossref | Google Scholar |
Smith SM, Malcolm HA, Marzinelli EM, Schultz AL, Steinberg PD, Vergés A (2021) Tropicalization and kelp loss shift trophic composition and lead to more winners than losers in fish communities. Global Change Biology 27(11), 2537-2548.
| Crossref | Google Scholar |
Specht H, Lewandowski E (2018) Biased assumptions and oversimplifications in evaluations of citizen science data quality. The Bulletin of the Ecological Society of America 99(2), 251-256.
| Crossref | Google Scholar |
Stallings CD (2008) Indirect effects of an exploited predator on recruitment of coral-reef fishes. Ecology 89(8), 2090-2095.
| Crossref | Google Scholar |
Steffe AS, Murphy JJ (2011) Recreational fishing surveys in the Greater Sydney Region. Fisheries Final Report Series Number 131. (NSW Department of Primary Industries: Sydney, NSW, Australia) Available at https://www.dpi.nsw.gov.au/__data/assets/pdf_file/0008/545741/FFRS-131_Steffe-and-Murphy-2011.pdf
Theobald EJ, Ettinger AK, Burgess HK, DeBey LB, Schmidt NR, Froehlich HE, et al. (2015) Global change and local solutions: tapping the unrealized potential of citizen science for biodiversity research. Biological Conservation 181, 236-244.
| Crossref | Google Scholar |
Thurstan RH (2022) The potential of historical ecology to aid understanding of human–ocean interactions throughout the Anthropocene. Journal of Fish Biology 101(2), 351-364.
| Crossref | Google Scholar |
Thurstan RH, McClenachan L, Crowder LB, Drew JA, Kittinger JN, Levin PS, et al. (2015) Filling historical data gaps to foster solutions in marine conservation. Ocean & Coastal Management 115, 31-40.
| Crossref | Google Scholar |
Turnbull JW, Shah Esmaeili Y, Clark GF, Figueira WF, Johnston EL, Ferrari R (2018) Key drivers of effectiveness in small marine protected areas. Biodiversity and Conservation 27(9), 2217-2242.
| Crossref | Google Scholar |
Turnbull JW, Johnston EL, Kajlich L, Clark GF (2020) Quantifying local coastal stewardship reveals motivations, models and engagement strategies. Biological Conservation 249, 108714.
| Crossref | Google Scholar |
Turnbull JW, Johnston EL, Clark GF (2021) Evaluating the social and ecological effectiveness of partially protected marine areas. Conservation Biology 35, 921-932.
| Crossref | Google Scholar | PubMed |
Turnbull JW, Booth DJ, Vergés A, Clark G (2024) Historical marine ecology using non-traditional data sources reveals the impact of local and global processes over half a century. ResearchSquare 2024, ver. 1 [Preprint, published 4 August 2024].
| Crossref | Google Scholar |
Vergés A, Tomas F, Cebrian E, Ballesteros E, Kizilkaya Z, Dendrinos P, et al. (2014) Tropical rabbitfish and the deforestation of a warming temperate sea. Journal of Ecology 102(6), 1518-1527.
| Crossref | Google Scholar |
Vergés A, Doropoulos C, Malcolm HA, Skye M, Garcia-Pizá M, Marzinelli EM, et al. (2016) Long-term empirical evidence of ocean warming leading to tropicalization of fish communities, increased herbivory, and loss of kelp. Proceedings of the National Academy of Sciences 113(48), 13791-13796.
| Crossref | Google Scholar |
Vergés A, McCosker E, Mayer-Pinto M, Coleman MA, Wernberg T, Ainsworth T, Steinberg PD (2019) Tropicalisation of temperate reefs: implications for ecosystem functions and management actions. Functional Ecology 33(6), 1000-1013.
| Crossref | Google Scholar |