

Decadal monitoring shows seagrass decline and community shifts following environmental disturbance in Moreton Bay, south-eastern Queensland, Australia
Joanna N. Smart A B * , Nicholas M. Hammerman A , Kirsten M. Golding A , Kathryn Markey B , Eva Kovacs A and Chris Roelfsema A
A
B
Abstract
Seagrass meadows are declining globally. Most seagrass research focuses on small-scale dynamics, with less known about change over larger spatial and temporal scales. The Eastern Banks in Moreton Bay, Australia (142 km2), provide a case study for investigating large-scale seagrass dynamics.
Determine whether seagrass species community composition and cover vary spatially and temporally across the Eastern Banks.
Georeferenced photoquadrats (n = 48,629) were collected across four banks between 2011 and 2024. Seagrass cover was classified using machine learning platform ReefCloud. Beta regression models and PERMANOVA analysis assessed trends in seagrass composition across years and among banks. Seagrass cover was assessed against water quality data to identify potential environmental drivers of change.
Oceana serrulata increased at Amity and Wanga-Wallen Banks, replacing Zostera muelleri as the dominant species. Total seagrass cover declined across three banks, with changes in cover and community composition being potentially associated with fluctuations in water quality.
Seagrass cover has declined significantly, with shifts in community composition occurring across the Eastern Banks during the study period.
These findings have highlighted the vulnerability of seagrass meadows to environmental disturbances, and the need for monitoring to identify resilience mechanisms and support ecosystem management.
Keywords: community composition, long-term monitoring, Moreton Bay, Oceana serrulata, seagrass decline, seagrass dynamics, seagrass meadows, Zostera muelleri.
Introduction
Seagrass meadows are critical ecosystems in coastal marine and estuarine environments worldwide (Orth et al. 2006; Nordlund et al. 2018). Healthy seagrass meadows provide essential ecosystem services such as nutrient cycling (Human et al. 2015), carbon sequestration (Macreadie et al. 2014; Duarte and Krause-Jensen 2017), coastal protection (Ondiviela et al. 2014), habitat creation (Heck et al. 2008), food generation (Nordlund et al. 2018) and oxygen production (Felisberto et al. 2015). However, anthropogenic pressures on marine habitats are causing extensive changes to coastal environments (Barbier et al. 2011; Priya et al. 2023; Venegas et al. 2023). In particular, seagrass meadows are experiencing a global decline (Waycott et al. 2009; Unsworth et al. 2019; Dunic et al. 2021). Factors such as marine heatwaves, extreme weather events (e.g. floods), water pollution (e.g. agricultural and urban runoff, wastewater discharge) and physical damage (e.g. dredging, land reclamation, bottom trawling) impact the physiology, composition, extent and density of coastal seagrass meadows (McKenzie et al. 2020; Strydom et al. 2020; Grech et al. 2011; Bass and Falkenberg 2023, Clemente et al. 2023, Moir et al. 2025).
Despite the extent of degradation to seagrasses worldwide, there is limited information on how seagrass meadows respond to disturbance events at ecologically relevant spatial scales and over extended timeframes (i.e. decadal) (Roelfsema et al. 2014; Kilminster et al. 2015). For instance, while many studies have focused on small scale seagrass dynamics, from individual plants to local patches of between 1 and 100 m2 (Orth and Heck 2023), there is a distinct scarcity of research investigating seagrass communities at broader spatial extents exceeding 100 km2 and spanning more than a few years (Orth et al. 2010; Lyons et al. 2012, 2013; Roelfsema et al. 2014; Kilminster et al. 2015; Kovacs et al. 2022). This gap in research hinders our ability to understand how seagrass communities respond to environmental and anthropogenic stressors at ecologically relevant scales. Comprehensive, long-term datasets are necessary to evaluate the resilience of seagrass meadows and to inform conservation and management strategies effectively (York et al. 2017; Unsworth et al. 2019; Orth and Heck 2023).
The shallow seagrass meadows of the Eastern Banks, Moreton Bay (Queensland, Australia), have been utilised as a study site for exploring seagrass dynamics including through remote sensing, in situ field surveys and manipulative experiments (Abal and Dennison 1996; Udy and Dennison 1997; Lyons et al. 2010, 2012; Kovacs et al. 2022). Covering ~142 km2, the Eastern Banks support many endangered and vulnerable species such as dugongs (Dugong dugon) (Department of Climate Change, Energy, the Environment and Water 2000; Lanyon 2003), green sea turtles (Chelonia mydas) (Arthur et al. 2007; Department of the Environment and Energy 2017) and commercially important species, such as snapper, prawns and crabs (Lanyon 2003; Arthur et al. 2007; Tibbetts et al. 2019). The Eastern Banks are comprised of four sub-banks, each separated by a deep channel (Amity, Wanga-Wallen, Moreton and Maroom), which are home to the following six main seagrass species: Halophila spinulosa, Halophila ovalis, Halodule uninervis, Zostera muelleri, Oceana serrulata and Syringodium isoetifolium (Young and Kirkman 1975), with a total of seven species occurring in the broader Moreton Bay region (Tibbetts et al. 2019). The most dominant species across the Eastern Banks by percentage cover include O. serrulata, Z. muelleri and H. uninervis (Phinn et al. 2008; Lyons et al. 2010, 2011). The region has experienced significant environmental disturbances that could affect seagrass dynamics, including flooding and storms in 2011, 2013 and 2022 (Yu et al. 2011; Hanington et al. 2015; Grinham et al. 2024). Additionally, anthropogenic activities in the bay, such as dredging, wastewater discharge and land reclamation, may influence the spatial extent and coverage of seagrass meadows in the region (Gibbes et al. 2014; Grinham et al. 2024).
To understand how seagrass communities have changed over time, we aimed to (1) quantify changes in community composition of the seagrass species both spatially (between banks) and temporally (between years) across shallow estuarine seagrass habitat, and (2) determine whether those changes are associated with acute disturbances or environmental change occurring during the study period. We used ~50,000 photoquadrats to assess the spatial and temporal patterns of seagrass coverage and species composition across 13 sampling events between June 2011 and December 2024. These findings highlight the vulnerability of seagrass meadows to environmental disturbances, emphasising the need for continued large-scale spatial monitoring and research to identify resilience mechanisms and support ecosystem management.
Materials and methods
Study site
The Eastern Banks are located within Moreton Bay (south-eastern Queensland, Australia), ~14 km east of Brisbane City. Specifically, the banks are found in the eastern part of Moreton Bay, south of Moreton Island and north-west of North Stradbroke Island (see Fig. 1). The Eastern Banks have been the focus of satellite remote sensing-based habitat mapping research since 2000 (Phinn et al. 2005). The study included the collection and analysis of an extensive in situ georeferenced photoquadrat data sets (Roelfsema et al. 2015a) used for verification for 13 sampling events up to 2024. The consistent methods for collection and analysis across time and space with high thematic classification of the photoquadrats (i.e. to species level) provide an opportunity to assess long-term changes in seagrass community composition, which has not yet been fully leveraged for ecological assessments.
Map of the survey area within the Eastern Banks, Moreton Bay (Map data ©2025 Google). (a) The location of Moreton Bay, denoted by a yellow dot, on the south-eastern coast of Queensland, Australia, (b) the location of the Eastern Banks within Moreton Bay, and (c) a fine-scale map with red dots showing the location of all survey transects within the Eastern Banks surveyed at any point between 2011 and 2024. Green lines delineate the four sub-banks within the survey area. Blue points indicate the location of water quality monitoring, from which environmental data have been annually measured (e.g. temperature, turbidity, salinity, dissolved oxygen).
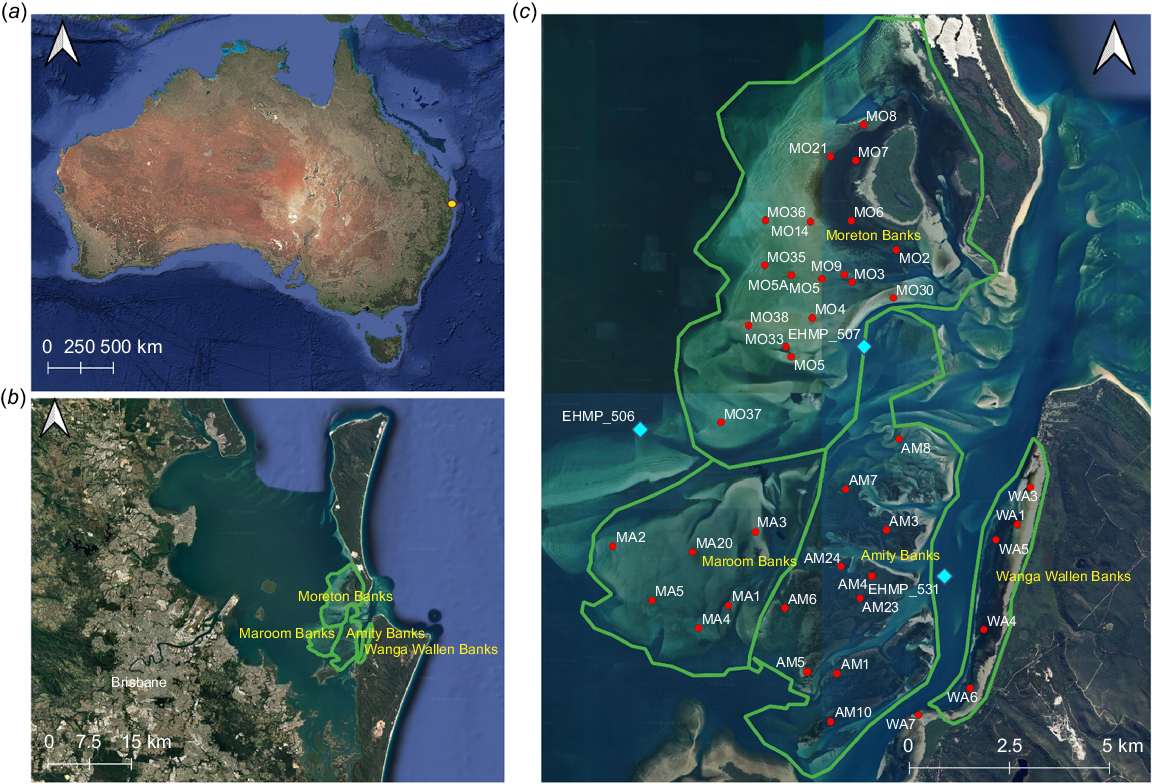
The area is dynamic, experiencing strong currents and a tidal range of ~1.5–2 m (Maritime Safety Queensland, Department of Transport and Main Roads 2024). Covering an area of ~142 km2, the Eastern Banks generally have a good water clarity and are shallow in depth, making them ideal for seagrass growth (Udy et al. 2024). However, the banks are also influenced by runoff from the surrounding rivers (e.g. Caboolture, Pine, Brisbane and Logan Rivers) and catchments, which can periodically affect water quality in the region (Tibbetts et al. 2019). The Eastern Banks can be divided into four major individual banks, each demarked by deep channels or land masses. These banks include Amity Bank, Moreton Bank, Maroom Bank and Wanga-Wallen Bank (Fig. 1) on which we focus this study because of the availability of consistent field data.
Field sampling
Georeferenced photoquadrats were collected for each of the 13 sampling events between June 2011 and December 2024, by using a repeatable and fine spatial-scale survey method that has been previously described (Roelfsema et al. 2015b). Snorkellers captured photoquadrats of the benthos while towing a float equipped with a handheld GPS, which was logging positions so photographs could be assigned coordinates through time synchronisation. Photoquadrats of the seafloor representing an ~1-m2 quadrat were captured at 2–4-m intervals with a waterproof digital camera along a transect, with transects ranging in length from 100 to 800 m. Transect locations were distributed throughout the different banks to capture the variation in seagrass habitat (Fig. 1). The total dataset consisted of a total of 48,629 photoquadrats across 13 sampling events (Table 1). In some years (i.e. 2012, 2013, 2014, 2024), two sampling events occurred, whereas in all other years, one sampling event occurred (Table 1). Not all transects were surveyed each year because of environmental conditions and logistics.
| Year | Month | Season | Number of transects | Number of photographs | |
|---|---|---|---|---|---|
| 2011 | June | Winter | 34 | 3759 | |
| 2012 | July | Winter | 31 | 3069 | |
| 2012 | February | Summer | 31 | 2352 | |
| 2013 | January | Summer | 30 | 2782 | |
| 2013 | May | Autumn | 33 | 3946 | |
| 2014 | April | Autumn | 14 | 1181 | |
| 2014 | July | Winter | 24 | 2267 | |
| 2015 | June | Winter | 38 | 3562 | |
| 2021 | July | Winter | 28 | 4451 | |
| 2022 | June | Winter | 31 | 4026 | |
| 2023 | July | Winter | 30 | 4427 | |
| 2024 | July | Winter | 33 | 5392 | |
| 2024 | December | Summer | 31 | 5729 |
Water quality data
Water quality data for the Eastern Banks was compiled to assess whether variability in water quality could be a potential driver of seagrass compositional change. Data were collected between 2011 and 2023 as part of the Ecosystem Health Monitoring Program (EHMP). The EHMP is an ongoing ambient monitoring program established in 1999 and is currently coordinated by Healthy Land and Water (HLW) (Healthy Land and Water 2023). Water samples were collected at three locations across the Eastern Banks (Fig. 1) during 8 months of the year (February, March, May, August, September, October, November and December). Depth profiles of temperature, salinity, pH, turbidity and dissolved oxygen were collected in situ with a multiparameter water quality sonde. Surface-water samples were collected and tested for total nitrogen, total phosphorus, ammonia, nitrogen oxides, filterable reactive phosphorus and chlorophyll-a.
Analysis
Seagrass species composition and percentage cover were derived from the photoquadrats by utilising the machine learning platform, ReefCloud (Australian Institute of Marine Science, see https://reefcloud.ai/). Although ReefCloud was originally developed to analyse coral reef photoquadrats, its underlying architecture can be adapted for seagrass habitat classification. The flexible architecture, point-based classification interface, and capacity for user-defined training datasets made it possible to apply ReefCloud successfully to seagrass habitats, with performance suitable for ecological analysis. ReefCloud utilises a point count method where images as annotated by assigning classification categories to points randomly overlaid on the image. Point count methods are commonly used to assess benthic cover across tropical, subtropical and temperate ecosystems (Pante and Dustan 2012; Perkins et al. 2016). A proportion of the randomly overlaid points is assigned to a class by the user, which trains the algorithm for classification of the remaining points.
For this study, fifty points were randomly overlaid onto each photoquadrat in ReefCloud (see https://reefcloud.ai/). This resulted in a total of 2,427,350 points labelled across 48,629 photographs. In total, 19,105 (3.9%) points were manually classified by an expert for training data to support the machine learning model. Model training was undertaken until further training no longer resulted in increased model F1 and accuracy scores, ensuring a reasonable balance between classification accuracy and the need to process and analyse the full dataset. A seagrass habitat classification scheme was used for this study, which was previously determined to capture the variation of the main habitat types present in the study area (Roelfsema et al. 2015b).
To ensure all points could be correctly assigned a category, the categories used for classification included 28 categories within a hierarchical design, which included seven functional categories (Supplementary Table S1). Category accuracy was assessed by calculating the class F1 score. The F1 score is a performance metric that combines precision (correct positive predictions of all predicted positives) and recall (correct positive predictions of all actual positives) (Naidu et al. 2023; Diallo et al. 2025). In this study, only classes with an F1 score greater than 0.5 were used to ensure that model predictions were reasonably reliable, with a balanced trade-off between precision and recall, and to exclude poorly predicted or highly uncertain classes. The percentage cover of each category in each photoquadrat was determined by ReefCloud, by summing the total count for each category per quadrat and dividing by the number of points surveyed in the quadrat.
To analyse the changes in seagrass cover within each bank over time, we calculated the mean percentage cover and associated confidence intervals for each seagrass species at each bank for each sampling event by using the statistical environment R (ver. 4.4.3, R Foundation for Statistical Computing, Vienna, Austria, see https://www.r-project.org/). This aggregation step was used to address sample imbalance, as the number of photoquadrats differed among sampling events (Table S3). By using the mean percentage cover as the response variable, we ensured that each time point contributed equally to the model, regardless of sample size.
To determine how the percentage cover of each seagrass species across the four different banks had changed over time, we fit beta regression models for each seagrass species within each bank by using the R package betareg (ver. 3.2-1, see https://cran.r-project.org/package=betareg; Cribari-Neto and Zeileis 2010). Beta regression is an extension of the generalised linear model, using a logistic link function to ensure logical predictions and assuming that errors are beta-distributed. Beta regression is well-suited for analysing percentage cover data because it models proportional outcomes (ranging between 0 and 1), while accounting for the skewness and heteroscedasticity often present in ecological data (Douma and Weedon 2019). Prior to analysis, percentage cover data were scaled to between 0 and 1, as required by beta regression. Any values of 0 or 100% were converted to 0.001 and 0.999 respectively, as the beta regression structure cannot utilise exact 0 and 1 values. The mean percentage cover per sampling event was used as the response variable, and sampling year was included as the predictor variable.
Given the time-series nature of the data, residuals from each model were assessed for temporal autocorrelation by using autocorrelation function (ACF) plots. Although some residual autocorrelation was detected, especially at short lags, explicit autocorrelation structures were not included because of the limited number of time points (n = 13) and irregular sampling intervals, which restrict the implementation and reliability of time-series models. Further model diagnostics were performed using the R packages performance (ver. 0.13.0, see https://cran.r-project.org/package=performance; Lüdecke et al. 2021), car (ver. 3.1-3, see https://CRAN.R-project.org/package=car; Fox and Weisberg 2019) and lmtest (ver. 0.9-40, see https://cran.r-project.org/package=lmtest; Zeileis and Hothorn 2002). Residual plots and McFadden’s pseudo-R2 were generated to assess model fit and evaluate the adequacy of the chosen distribution. Likelihood ratio tests were used to compare models and assess the significance of predictor variables. Residuals were examined for normality and homoscedasticity to validate beta regression assumptions.
To assess whether seagrass community composition and cover varied spatially or temporally, a permutational analysis of variance (PERMANOVA) was conducted using the R package vegan (ver. 2.6-8, J. Oksanen et al., see https://cran.r-project.org/package=vegan/). Percentage cover data were averaged for each transect within each bank. The explanatory variables included year of sampling, bank (Amity, Wanga-Wallen, Moreton and Maroom), and transect. Season was not included as a factor, because seasonal sampling was highly unbalanced across years, with most surveys occurring in either winter or summer, and limited representation from other seasons (Table 1).
To evaluate the assumption of homogeneity of multivariate dispersion, the function betadisper() from the vegan package was used. Significant differences in dispersion were found across both banks and years, suggesting that some variation detected by PERMANOVA could be influenced by unequal within-group variability. However, interpretation of PERMANOVA results was supported by complementary analyses. Pairwise PERMANOVA comparisons were conducted to identify which groups differed significantly, and non-metric multidimensional scaling (NMDS) plots were used to visualise compositional patterns across banks and years. These visualisations aided in distinguishing whether observed differences were due to shifts in group centroids (i.e. true compositional differences) or simply due to dispersion.
The final PERMANOVA model included ‘year,’ ‘bank,’ and ‘transect’ as explanatory variables. An interaction term between year and bank was included to account for spatially structured temporal changes and transect was nested within bank to account for spatial autocorrelation, because transects within the same bank are likely to share similar environmental and ecological conditions. A Bray–Curtis dissimilarity matrix was used as the resemblance measure, and 9999 permutations were applied to generate the reference distribution.
Patterns in community composition and seagrass cover were visualised using NMDS, implemented using vegan (ver. 2.6-8). Percentage cover data were averaged by transect within each bank, and Bray–Curtis dissimilarities were calculated on square-root transformed species abundance data to down-weight dominant species. A three-dimensional solution (k = 3) was selected to better capture the complex variation in the data, while maintaining acceptable stress values. Model fit was assessed using Shepard plots and stress values. Environmental vectors were fitted to the ordination, and variables with a Spearman rank correlation of >0.5 were overlaid on the NMDS plots to highlight associations with species and community structure.
To assess when water quality deviated significantly from normal conditions, we calculated the 5th and 95th percentiles for indicators of water quality, including total nitrogen (mg L−1), ammonia (mg L−1), salinity (recorded by a multi-parameter water quality sonde, g L−1) and turbidity (NTU) in R (R Foundation for Statistical Computing). These percentiles were used as thresholds to flag extreme deviations in the dataset (Australian Government Initiative 2023) and identify when water quality conditions on the Eastern Banks had deviated from normal, potentially affecting seagrass species. Quantitative comparisons between water quality data and seagrass cover could not be conducted because of temporal and spatial disparity between water quality sampling and seagrass surveys.
Results
Point classification model accuracy
The point classifier correctly identified 83% of the training points, with a corresponding F1 score of 0.83 (Table S1). Of the seagrass species, the classification of Oceana serrulata was most accurate, with an F1 score of 0.92. The F1 scores for the classification of H. uninervis, H. spinulosa, S. isoetifolium and Z. muelleri all exceeded 0.70. Classification accuracy for H. ovalis was comparatively low, with an F1 score of 0.53. The model performed well when classifying other non-seagrass benthic habitats.
Trends in seagrass percentage cover
Analysis of seagrass cover trends across banks over time showed species-specific responses during the study period (Tables S2, S4). Oceana serrulata showed significant increases in cover at both Amity (Fig. 2, slope = 0.1976 ± 0.034, P < 0.001) and Wanga-Wallen banks (slope = 0.1281 ± 0.0193, P < 0.001), with particularly strong growth at Wanga-Wallen resulting in a 33.90% increase in cover. However, this species showed a significant decline at Maroom Bank (slope = −0.1289 ± 0.0007, P < 0.001).
Seagrass cover trends from the beta regression model for each seagrass species at each bank over the 13-year study period, with 95% confidence intervals. Solid lines represent significant model predictions, with dashed lines showing non-significant relationships. Dots represent mean cover from photoquadrats with ±95% confidence intervals.
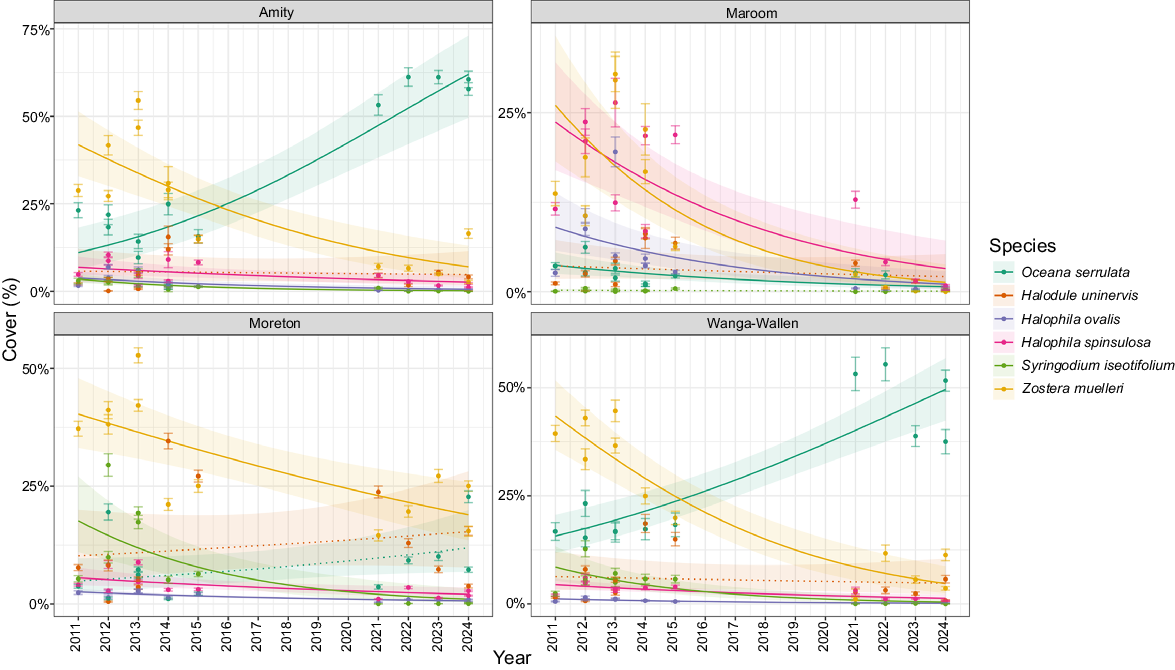
Conversely, Zostera muelleri displayed significant decreases across all banks, with particularly severe declines at Wanga-Wallen (slope = −0.2105 ± 0.0322, P < 0.0001) and Amity (slope = −0.1734 ± 0.0347, P < 0.0001), leading to cover reductions of 40.45 and 34.13% respectively. The trends in seagrass cover suggested that declines in Z. muelleri were replaced by O. serrulata at both Amity and Wanga-Wallen banks, with O. serrulata becoming the new dominant species.
Halophila ovalis exhibited consistent significant declines across all banks (all P < 0.001), with the strongest decrease observed at Maroom Bank (slope = −0.1688 ± 0.0464) and Wanga-Wallen Bank (slope = −0.1523 ± 0.0277). However, it should be noted that accuracy and F1 scores were lower for this species than for other seagrasses. Similarly, Halophila spinulosa demonstrated significant decreases across all banks, with the most pronounced decline at Maroom Bank (slope = −0.171 ± 0.403, P < 0.001), resulting in a 20.33% reduction in cover. Syringodium isoetifolium showed significant declines at three of the four banks, with Moreton Bank experiencing the most substantial decrease (slope = −0.232 ± 0.0537, P < 0.001), equating to a 17.40% reduction in cover. The only seagrass species that did not experience a significant decline across the banks was Halodule uninervis (all P > 0.05).
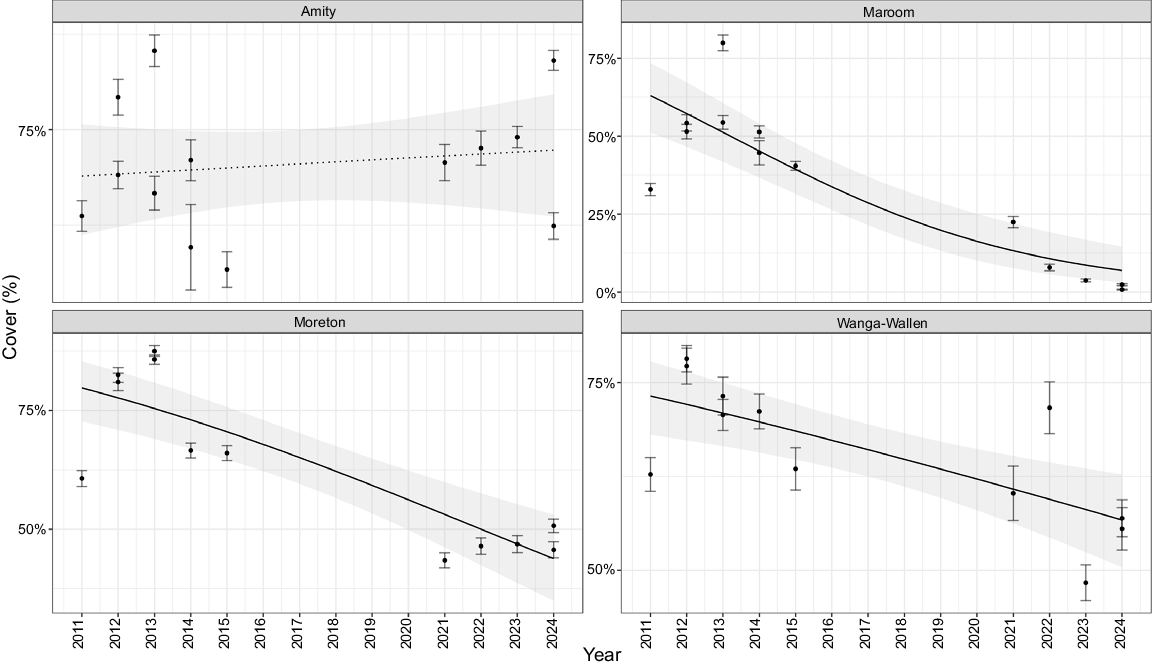
Despite increases in O. serrulata across two of four banks, total seagrass cover declined significantly across Maroom, Moreton and Wanga-Wallen banks (Fig. 3, all P < 0.001). The most substantial reduction was observed at Wanga-Wallen Bank (slope = −0.2105 ± 0.0322, P < 0.001), resulting in a 56.20% decrease in total cover. Amity bank was the only bank that did not record significant seagrass decline, which was likely because of the increase in O. serrulata replacing the declines observed in Z. muelleri.
Predicted seagrass cover trends from the beta regression model for total seagrass cover at each bank over the 13-year study period, with 95% confidence intervals. Solid lines represent significant model predictions, with dashed lines showing non-significant relationships. Dots represent mean cover from photoquadrats with ±95% confidence intervals.
Trends in species composition
For the shallow waters of the Eastern Banks, significant differences in seagrass community composition across multiple factors were found (Table 2). Temporal variation (year) explained 16.47% of the total variation (F = 22.81, P = 0.001). This suggested that seagrass community composition has changed significantly over time. Differences among banks accounted for 22.08% of the variation (F = 48.89, P = 0.001), indicating that seagrass community composition varies among these spatially distinct locations. The interaction between year and bank was also significant (F = 3.20, P = 0.001), explaining 8.9% of the variation. The significance of interaction suggests that the effect of time on community composition differs among banks. The strongest source of variation was attributed to the nesting of transect within bank, which explained 33.24% of the total variation (F = 8.76, P = 0.001). This result suggested that there are meaningful differences in seagrass community composition among transects within the same bank.
| Item | Degrees of freedom | Sum of squares | R2 | F | Pr (>F) | |
|---|---|---|---|---|---|---|
| Year | 9 | 6.653 | 0.16477 | 22.8065 | 0.001*** | |
| Bank | 5 | 8.915 | 0.22078 | 48.8952 | 0.001*** | |
| Year:bank | 34 | 3.620 | 0.08966 | 3.2027 | 0.001*** | |
| Bank/transect | 46 | 13.423 | 0.33243 | 8.7643 | 0.001*** | |
| Residual | 220 | 7.767 | 0.19236 | |||
| Total | 314 | 40.378 | 1.00000 |
The table includes pseudo-F values, degrees of freedom and significance levels for each factor. Probabilities are significant at: ***, P ≤ 0.001.
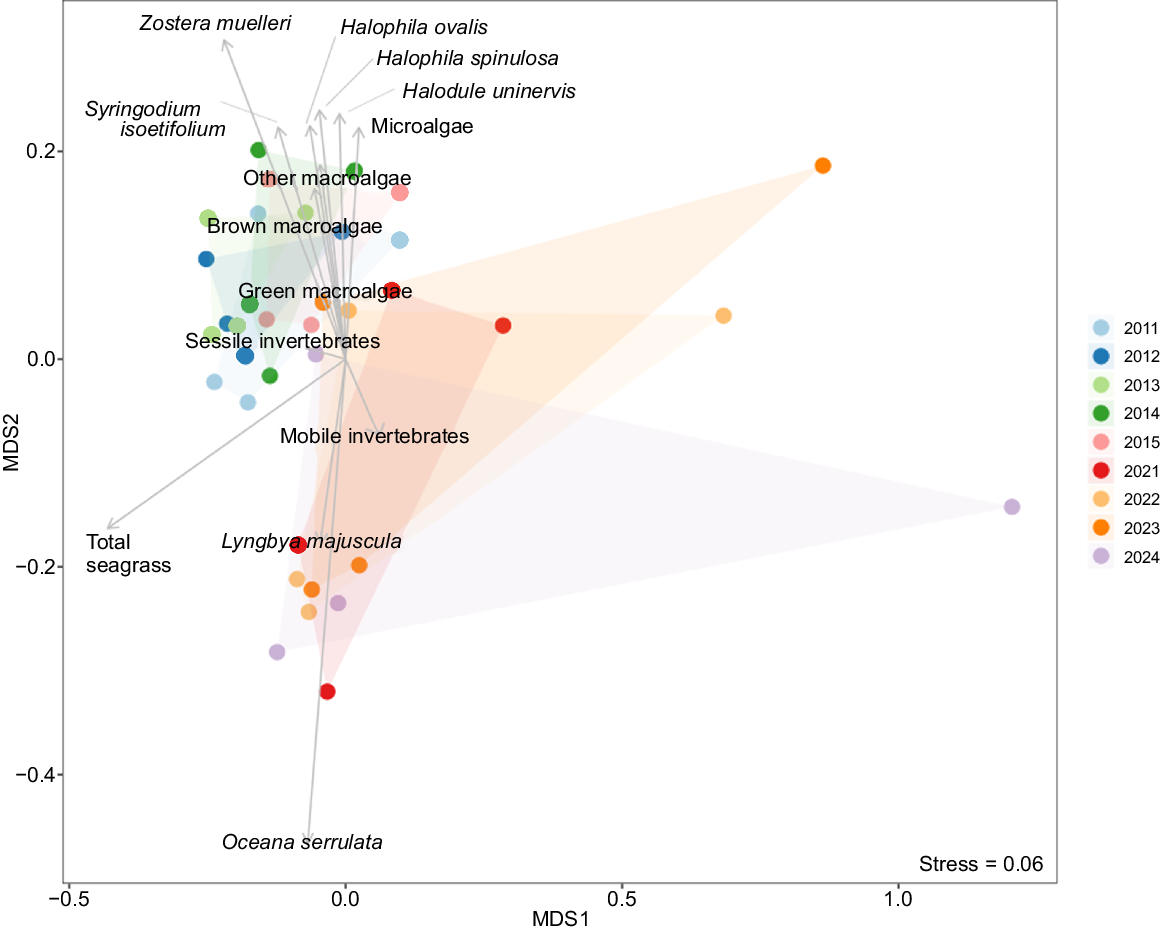
Distinct temporal and spatial patterns in seagrass community composition were found within the NMDS ordination (stress = 0.06, Fig. 4, 5). The first axis (MDS1) represented a gradient from areas dominated by Oceana serrulata and Zostera muelleri to more sparse communities. The second axis (MDS2) separated communities characterised by Halophila ovalis and brown macroalgae from those dominated by Lyngbya majuscula. Temporal trajectories showed a general shift in community composition from 2011 to 2024, with the most pronounced changes occurring at Maroom bank, which displayed the greatest dispersion along MDS1.
Non-metric multidimensional scaling (NMDS) ordination of seagrass community composition coloured by year of monitoring. Points represent each bank at each survey year, with closer points indicating greater similarity in species composition.
Non-metric multidimensional scaling (NMDS) ordination of seagrass community composition coloured by bank. Points represent each bank at each survey year, with closer points indicating greater similarity in species composition.
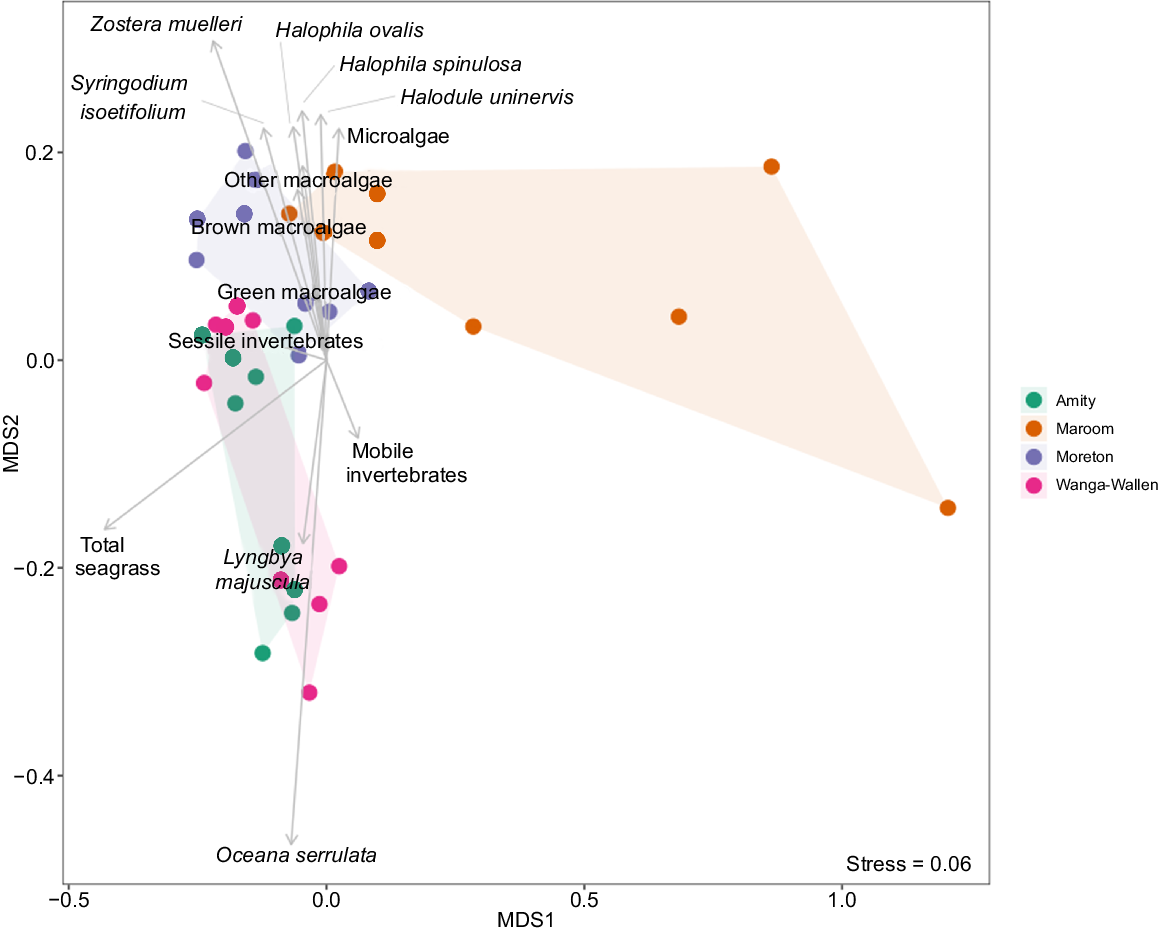
The spatial separation among banks was evident, with Maroom bank showing the most distinct composition and greatest temporal variation. Amity, Moreton and Wanga-Wallen banks displayed more clustered patterns, suggesting more stable community composition over time, although still exhibiting significant temporal changes as indicated by the PERMANOVA results. These patterns suggested that although all banks underwent significant temporal changes in seagrass community composition, the magnitude and direction of these changes varied among locations.
Water quality dynamics
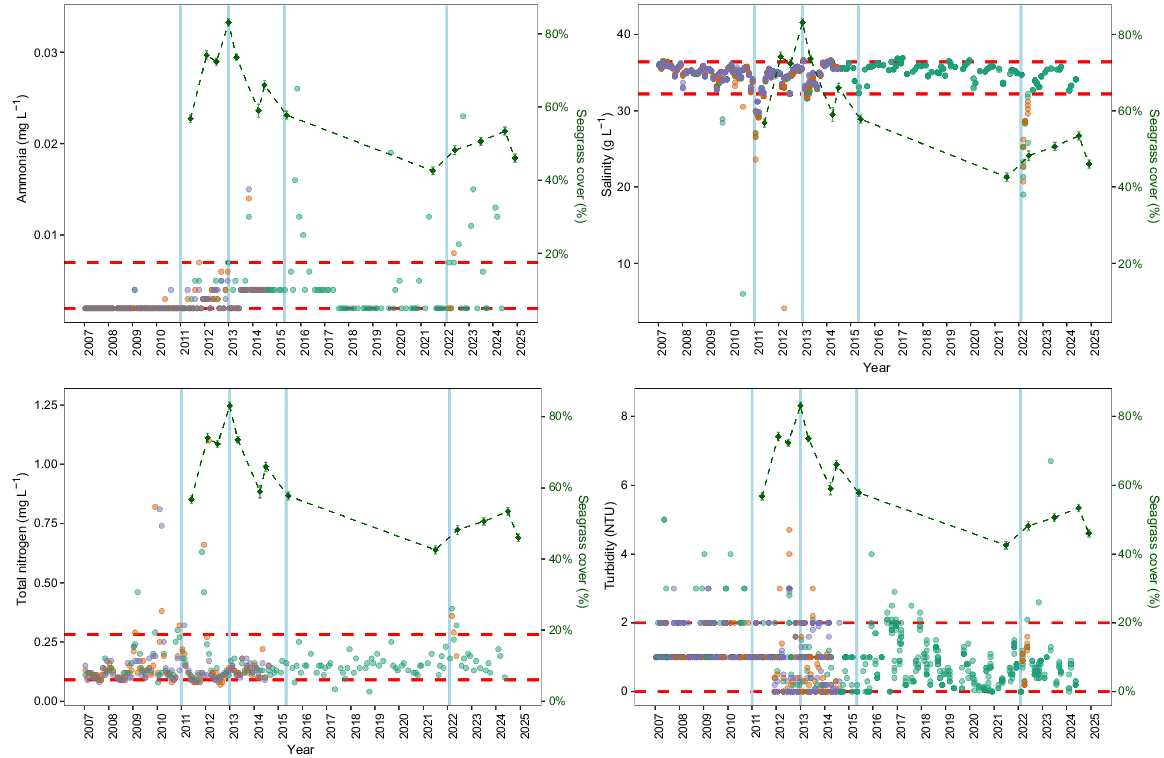
Water quality parameters showed notable deviations beyond the 95th percentile during the study period, particularly following flood events (Fig. 6). Ammonia concentrations exhibited several distinct peaks above the 95th percentile at location EHMP-506, with pronounced spikes occurring after flooding events. Total nitrogen similarly showed episodic elevations beyond the baseline conditions, with the most notable exceedances occurring between 2011 and 2012. Salinity demonstrated characteristic flood-related drops, particularly in 2011 and 2022, when values fell substantially below typical marine conditions. Turbidity was generally more variable throughout the monitoring period, with location EHMP-506 showing an increased frequency of elevated turbidity readings after 2016. These periodic departures from baseline water quality conditions, especially following flood events, suggest potential environmental stressors that may have influenced the observed changes in seagrass community composition.
Temporal trends in water quality variables (ammonia, salinity, total nitrogen and turbidity) and total seagrass cover across all banks over the study period. Red horizontal lines indicate the 95th percentile for each variable, whereas blue vertical lines mark the dates of significant flooding events in Brisbane. Dot colour represents EHMP monitoring sites EHMP 506 (green), EHMP 507 (orange) and EHMP 531 (purple).
Discussion
We documented overall declines in seagrass percentage cover across the Eastern Banks, along with clear shifts in seagrass community composition. This analysis was based on 13 years of monitoring data for seagrass species and percentage cover, encompassing a wide spatial area within the Eastern Banks. Our results align with global findings indicating that seagrass meadows are declining, leading to shifts in species composition and reductions in overall spatial cover (Amone-Mabuto et al. 2018; Arias-Ortiz et al. 2018; Buckee et al. 2021; Orth and Heck 2023). Such reductions in seagrass functioning have profound ecological and economic implications (Roca et al. 2016; Unsworth et al. 2019). In the discussion below we outline these ecological trajectories, considering both acute disturbance and environmental variability. We then frame this insight in terms of its implications for the continued functioning of seagrasses within the Bay and how this spatio-temporal understanding of seagrass dynamics can inform conservation and restoration efforts.
Past studies have documented seagrass decline across the banks between 1988 and 2010 through remote sensing (Lyons et al. 2013). Previous studies in Moreton Bay have documented substantial losses of Syringodium isoetifolium following major flood events (Hanington et al. 2015) and seagrass extent within the broader Moreton Bay has been shown to decline following flood events (Udy et al. 2024). Additionally, extreme weather events such as cyclones have led to seagrass uprooting and light deprivation in Hervey Bay, located ~240 km north of the study area (Preen et al. 1995). These results contribute to the growing body of evidence showing a widespread reduction in seagrass extent in Moreton Bay, more regionally (i.e. south-eastern Queensland) and worldwide (Short et al. 2006, 2014; Buckee et al. 2021; Green et al. 2021; Leblanc et al. 2023).
In addition to overall declines in seagrass cover, shifts in community composition have also been observed, with notable differences among the four banks. For instance, Amity and Wanga-Wallen banks share a similar species composition over time, whereas Moreton and Maroom exhibit greater divergence. This variation appears to be primarily driven by the presence of Oceana serrulata, which has replaced Zostera muelleri as the dominant species at Amity and Wanga-Wallen during the monitoring period. By contrast, Moreton and Maroom have lost most of their seagrass cover. In particular, O. serrulata is known for its ability to rapidly colonise disturbed areas (Collier et al. 2012). Seagrass species with colonising life-history traits (i.e. fast growth, rapid reproduction and wide dispersal) are generally expected to recover quickly from disturbance, whereas opportunistic species, such as Z. muelleri, recover more slowly, resulting in community composition change after disturbance events (Turschwell et al. 2021). Similar shifts have been observed elsewhere, including in Shark Bay, Western Australia, where opportunistic species replaced more persistent species following a heatwave, leading to a decline in ecosystem services (Nowicki et al. 2017). The ecological drivers behind the apparent shift from Z. muelleri to O. serrulata remain unclear. It is uncertain whether O. serrulata is outcompeting Z. muelleri because of faster growth or whether Z. muelleri is more sensitive to specific environmental pressures that do not affect O. serrulata as strongly. Further research is needed to clarify these dynamics; however, the pattern in changing species composition observed at the Eastern Banks is consistent with the broad environmental disturbances experienced within Moreton Bay.
Changes in seagrass percentage cover and species composition have important ecological consequences for Moreton Bay, affecting primary production, carbon storage and trophic interactions (Walker and McComb 1992; Hughes et al. 2009; Do et al. 2013). Different seagrass species contribute varying amounts of biomass for the same percentage cover, influencing carbon cycling and habitat structure (Duarte and Chiscano 1999; Roelfsema et al. 2014; Stankovic et al. 2018). Oceana serrulata has a particularly high below-ground biomass and greater physiological resilience than do the other species present on the banks (Kilminster et al. 2015). Faunal grazing dynamics may also shift in response to these changes. Halophila ovalis is a key food source for dugongs and green turtles and is resilient to grazing (Kuiper-Linley et al. 2007). A decline in H. ovalis could therefore have cascading effects on herbivore populations, as seen in studies linking seagrass loss to declining green turtle populations (Meylan et al. 2022). Furthermore, shifts in seagrass composition can alter benthic infaunal communities (Mills and Berkenbusch 2009), potentially disrupting ecosystem services such as sediment stabilisation, carbon sequestration and nutrient cycling.
The observed changes in seagrass composition and cover show a critical vulnerability of coastal marine ecosystems to environmental fluctuations. Climate-change models predict increased frequency of extreme weather events, including more intense flooding and prolonged periods of environmental stress (Pörtner et al. 2022). Our findings indicated that seagrass communities might not simply recover linearly after disturbances, but could undergo fundamental restructuring. The replacement of Z. muelleri by O. serrulata at Amity and Wanga-Wallen banks between 2011 and 2024 demonstrates this adaptive response in the face of changing environmental conditions.
Water quality may be a key driver of these changes, particularly in response to extreme weather events. Seagrass meadows are highly sensitive to fluctuations in sediment composition and light availability (Dennison 1987; de Boer 2007; Cabaço et al. 2008; Carr et al. 2016). The timing of the observed decline coincides with major climatic disturbances. Salinity, turbidity and nutrient inputs have been previously identified as significant predictors of seagrass cover and composition, underscoring the role of water quality in shaping these ecosystems (Longstaff and Dennison 1999; Udy et al. 1999; Lirman and Cropper 2003; Saunders et al. 2017; Bell et al. 2019). Previous studies have shown that when exposed to prolonged light stress, seagrasses shed leaves and shoots as a survival response (York et al. 2013). In Moreton Bay, declining water quality has already been linked to losses in rock oyster populations (Diggles 2013), reduced coral cover and condition (Lybolt et al. 2011; Hammerman et al. 2022) and shifts in benthic diatom communities (Grinham et al. 2011). Projected sea level rise and sediment accretion could further exacerbate this decline, with models predicting a 17% reduction in seagrass extent across Moreton Bay by 2100 (Saunders et al. 2013). In addition, major flood events (e.g. 2022) have elevated sediment resuspension (i.e. turbidity) and nutrient loads (e.g. ammonium, nitrates, total nitrogen) to levels ~10 times above background concentrations and such fine sediment deposition has affected 98% of the Bay’s seafloor (Grinham et al. 2024). These habitats are increasingly under threat from acute disturbances such as flooding, coastal development, dredging, urbanisation and ocean warming. Increased urbanisation can lead to greater coastal development and the expansion of paved surfaces, which in turn alters natural water flow and increases stress on coastal ecosystems. These changes could contribute to higher freshwater runoff, sedimentation and nutrient loads, posing significant risks to the ecological health of Moreton Bay.
There are several limitations to this study that should be considered. The classification accuracy for H. ovalis was lower than for other species, introducing some uncertainty in abundance estimates. This is perhaps due to the cryptic nature of H. ovalis, forming small leaves, which often occur as mixed communities with other larger species of seagrass. However, we elected to keep H. ovalis in our dataset because of its ecological importance as a food source for dugongs and green sea turtles. Regardless of this inclusion, we do acknowledge the lower accuracy score of H. ovalis from our ReefCloud model, and this warrants careful consideration of assessing its ecological trajectory.
Additionally, the photoquadrats were originally intended as validation and calibration data points for remote-sensing work throughout the Eastern Banks (Roelfsema et al. 2013, 2015a, 2015b). Hence, sites were selected to represent variation in habitat and were not permanent quadrats. As a result, variation in location could introduce some spatial variability. However, the strength of these data is that they cover a large spatial area over each bank and were designed to encompass all the possible types of substrate and seagrass communities expected. Water quality data were also coarser in resolution and not directly aligned with seagrass monitoring events, which may have obscured potential correlations. This temporal mismatch means that water quality measurements were not taken at the exact timing of disturbance events and these measurements were not taken directly overtop our study area (i.e. the HLW monitoring stations were adjacent to our banks rather than directly over them and led us to utilise these data qualitatively).
Through this study, we have provided novel insights into seagrass dynamics over extended spatial and temporal scales. Our results have highlighted a significant decline in seagrass percentage cover since 2011, alongside a shift in community composition, with O. serrulata emerging as the dominant species in two of the four banks. These findings suggest that acute disturbance and a broader trend in declining water quality across Moreton Bay may have potentially played a major role in shaping the seagrass assemblages observed today.
Although changes in water quality appear to coincide with seagrass decline, further research is needed to quantify these relationships more precisely. Water quality programs that more closely match seagrass monitoring surveys spatially and temporally may help untangle such relationships. The Eastern Banks may also provide a valuable site for future seagrass restoration efforts, particularly for Z. muelleri, which has been the focus of recent restoration trials in Australia (Wendländer et al. 2020). However, such work often focuses on restoration following near complete loss of seagrass, rather than when there are shifts in community composition, as was observed at Amity and Wanga-Wallen banks. As such, traditional restoration approaches may need refinement. Instead of attempting to recreate historical ecosystem states, management strategies should focus on enhancing adaptive capacity and promoting resilience. This could involve identifying and protecting areas with more stable seagrass communities, developing targeted restoration protocols that consider species-specific responses to environmental stress, and implementing comprehensive water quality management strategies that mitigate the impact of flood events and urban runoff. Continued monitoring of these seagrass communities is critical for understanding long-term environmental drivers and detecting shifts in spatial and temporal patterns. Future research should focus on the resilience mechanisms of seagrass in Moreton Bay, as well as the potential for restoration to mitigate ongoing declines and sustain the critical ecosystem services these meadows provide.
Data availability
Data used in this study are accessible through the GitHub repository (see https://github.com/joannasmart/seagrass_photoquadrat_analysis). Code used in the analyses and further supplementary information is provided within the repository.
Declaration of funding
Funding was provided by the: University of Queensland; CSIRO; Cooperative Research Centre Coastal Zone, Estuaries and Waterways Management; ARC Linkage Grant awarded to Prof. J. Marshall and Prof. S. Phinn; UQ-UWA Collaborative Research Grant awarded to Prof. van Niel; Goodman Foundation; SmartSat CRC and The Lott Corporation.
Author contributions
C. Roelfsema and J. Smart conceived the idea. J. Smart, C. Roelfsema and N. Hammerman designed the methodology. J. Smart, C. Roelfsema, N. Hammerman, K. Golding, E. Kovacs, K. Markey and C. Roelfsema collected the data. J. Smart, N. Hammerman, K. Golding, E. Kovacs and K. Markey contributed to data training and validation. J. Smart conducted the formal analysis, investigation and visualisation. J. Smart and N. Hammerman contributed to writing of the original draft. C. Roelfsema supervised the research. All authors contributed critically to the drafts and gave final approval for publication.
Acknowledgements
We acknowledge the Quandamooka People as the Traditional Owners and their custodianship of the lands on which Moreton Bay Research Station operates and the Sea Country within which this research was conducted. We pay our respects to their ancestors and their descendants, who continue cultural and spiritual connections to Country. We recognise their valuable contributions to Australian and global society. We thank the Healthy Land and Water Environmental Health Monitoring Program for providing water quality data. We thank Moreton Bay Research Station, and all staff and volunteers involved in collecting the data.
References
Abal EG, Dennison WC (1996) Seagrass depth range and water quality in southern Moreton Bay, Queensland, Australia. Marine and Freshwater Research 47(6), 763-771.
| Crossref | Google Scholar |
Amone-Mabuto M, Bandeira S, Da Silva A (2018) Long-term changes in seagrass coverage and potential links to climate-related factors: the case of Inhambane Bay, southern Mozambique. WIO Journal of Marine Science 16(2), 13-25.
| Google Scholar |
Arias-Ortiz A, Serrano O, Masqué P, Lavery PS, Mueller U, Kendrick GA, Rozaimi Jamaludin M, Esteban A, Fourqurean JW, Marba N, Mateo MA, Murray K, Rule MJ, Duarte CM (2018) A marine heatwave drives massive losses from the world’s largest seagrass carbon stocks. Nature Climate Change 8, 338-344.
| Crossref | Google Scholar |
Arthur KE, O’Neil JM, Limpus CJ, Abernathy K, Marshall G (2007) Using animal-borne imaging to assess green turtle (Chelonia mydas) foraging ecology in Moreton Bay, Australia. Marine Technology Society Journal 41, 9-13.
| Crossref | Google Scholar |
Australian Government Initiative (2023) Using monitoring data to derive and assess against guideline values. In ‘Australian and New Zealand Guidelines for Fresh and Marine Water Quality’. (Australian Government: Canberra, ACT, Australia) Available at https://www.waterquality.gov.au/anz-guidelines/monitoring/data-analysis/derivation-assessment
Barbier EB, Hacker SD, Kennedy C, Koch EW, Stier AC, Silliman BR (2011) The value of estuarine and coastal ecosystem services. Ecological Monographs 81, 169-193.
| Crossref | Google Scholar |
Bass AV, Falkenberg LJ (2023) Two tropical seagrass species show differing indicators of resistance to a marine heatwave. Ecology and Evolution 13, e10304.
| Crossref | Google Scholar | PubMed |
Bell SY, Fraser MW, Statton J, Kendrick GA (2019) Salinity stress drives herbivory rates and selective grazing in subtidal seagrass communities. PLoS ONE 14, e0214308.
| Crossref | Google Scholar | PubMed |
Buckee J, Hetzel Y, Nyegaard M, Evans S, Whiting S, Scott S, Ayvazian S, van Keulen M, Verduin J (2021) Catastrophic loss of tropical seagrass habitats at the Cocos (Keeling) Islands due to multiple stressors. Marine Pollution Bulletin 170, 112602.
| Crossref | Google Scholar | PubMed |
Cabaço S, Santos R, Duarte CM (2008) The impact of sediment burial and erosion on seagrasses: a review. Estuarine, Coastal and Shelf Science 79, 354-366.
| Crossref | Google Scholar |
Carr JA, D’Odorico P, McGlathery KJ, Wiberg PL (2016) Spatially explicit feedbacks between seagrass meadow structure, sediment and light: habitat suitability for seagrass growth. Advances in Water Resources 93, 315-325.
| Crossref | Google Scholar |
Clemente KJE, Thomsen MS, Zimmerman RC (2023) The vulnerability and resilience of seagrass ecosystems to marine heatwaves in New Zealand: a remote sensing analysis of seascape metrics using PlanetScope imagery. Remote Sensing in Ecology and Conservation 9, 803-819.
| Crossref | Google Scholar |
Collier CJ, Waycott M, Ospina AG (2012) Responses of four Indo-West Pacific seagrass species to shading. Marine Pollution Bulletin 65, 342-354.
| Crossref | Google Scholar | PubMed |
Cribari-Neto F, Zeileis A (2010) Beta regression in R. Journal of Statistical Software 34, 1-24.
| Crossref | Google Scholar |
de Boer WF (2007) Seagrass–sediment interactions, positive feedbacks and critical thresholds for occurrence: a review. Hydrobiologia 591, 5-24.
| Crossref | Google Scholar |
Dennison WC (1987) Effects of light on seagrass photosynthesis, growth and depth distribution. Aquatic Botany 27, 15-26.
| Crossref | Google Scholar |
Diggles BK (2013) Historical epidemiology indicates water quality decline drives loss of oyster (Saccostrea glomerata) reefs in Moreton Bay, Australia. New Zealand Journal of Marine and Freshwater Research 47, 561-581.
| Crossref | Google Scholar |
Do VT, Blanchet H, De Montaudouin X, Lavesque N (2013) Limited consequences of seagrass decline on benthic macrofauna and associated biotic indicators. Estuaries and Coasts 36, 795-807.
| Crossref | Google Scholar |
Douma JC, Weedon JT (2019) Analysing continuous proportions in ecology and evolution: a practical introduction to beta and Dirichlet regression. Methods in Ecology and Evolution 10, 1412-1430.
| Crossref | Google Scholar |
Duarte CM, Chiscano CL (1999) Seagrass biomass and production: a reassessment. Aquatic Botany 65, 159-174.
| Crossref | Google Scholar |
Duarte CM, Krause-Jensen D (2017) Export from seagrass meadows contributes to marine carbon sequestration. Frontiers in Marine Science 4, 13.
| Crossref | Google Scholar |
Dunic JC, Brown CJ, Connolly RM, Turschwell MP, Côté IM (2021) Long-term declines and recovery of meadow area across the world’s seagrass bioregions. Global Change Biology 27, 4096-4109.
| Crossref | Google Scholar | PubMed |
Felisberto P, Jesus SM, Zabel F, Santos R, Silva J, Gobert S, Beer S, Björk M, Mazzuca S, Procaccini G, Runcie JW, Champenois W, Borges AV (2015) Acoustic monitoring of O2 production of a seagrass meadow. Journal of Experimental Marine Biology and Ecology 464, 75-87.
| Crossref | Google Scholar |
Grech A, Coles R, Marsh H (2011) A broad-scale assessment of the risk to coastal seagrasses from cumulative threats. Marine Policy 35, 560-567.
| Crossref | Google Scholar |
Green AE, Unsworth RKF, Chadwick MA, Jones PJS (2021) Historical analysis exposes catastrophic seagrass loss for the United Kingdom. Frontiers in Plant Science 12, 629962.
| Crossref | Google Scholar |
Grinham A, Gale D, Udy J (2011) Impact of sediment type, light and nutrient availability on benthic diatom communities of a large estuarine bay: Moreton Bay, Australia. Journal of Paleolimnology 46, 511-523.
| Crossref | Google Scholar |
Grinham A, Costantini T, Deering N, Jackson C, Klein C, Lovelock C, Pandolfi J, Eyal G, Linde M, Dunbabin M, Duncan B, Hutley N, Byrne I, Wilson C, Albert S (2024) Nitrogen loading resulting from major floods and sediment resuspension to a large coastal embayment. Science of The Total Environment 918, 170646.
| Crossref | Google Scholar | PubMed |
Hammerman NM, Roff G, Lybolt T, Eyal G, Pandolfi JM (2022) Unraveling Moreton Bay reef history: an urban high-latitude setting for coral development. Frontiers in Ecology and Evolution 10, 884850.
| Crossref | Google Scholar |
Hanington P, Hunnam K, Johnstone R (2015) Widespread loss of the seagrass Syringodium isoetifolium after a major flood event in Moreton Bay, Australia: implications for benthic processes. Aquatic Botany 120, 244-250.
| Crossref | Google Scholar |
Healthy Land and Water (2023) Ecosystem Health Montioring Program Moreton Bay Water Quality. (Healthy Land and Water, Brisbane, Qld, Australia) Available at https://app.powerbi.com/view?r=eyJrIjoiMDIxNTczNGQtOGRjZi00NjRjLWIyZTctOGFhNjBkOGUzN2JmIiwidCI6IjI2YzVlZTI0LWVjYTQtNDlkNS1hZjdjLTg5MmFiNTM3Y2ZlZCJ9 [Dataset]
Heck KL Jr, Carruthers TJB, Duarte CM, Hughes AR, Kendrick G, Orth RJ, Williams SW (2008) Trophic transfers from seagrass meadows subsidize diverse marine and terrestrial consumers. Ecosystems 11, 1198-1210.
| Crossref | Google Scholar |
Hughes AR, Williams SL, Duarte CM, Heck KL Jr, Waycott M (2009) Associations of concern: declining seagrasses and threatened dependent species. Frontiers in Ecology and the Environment 7, 242-246.
| Crossref | Google Scholar |
Human LRD, Snow GC, Adams JB, Bate GC, Yang S-C (2015) The role of submerged macrophytes and macroalgae in nutrient cycling: a budget approach. Estuarine, Coastal and Shelf Science 154, 169-178.
| Crossref | Google Scholar |
Kilminster K, McMahon K, Waycott M, Kendrick GA, Scanes P, McKenzie L, O’Brien KR, Lyons M, Ferguson A, Maxwell P, Glasby T, Udy J (2015) Unravelling complexity in seagrass systems for management: Australia as a microcosm. Science of The Total Environment 534, 97-109.
| Crossref | Google Scholar | PubMed |
Kovacs EM, Roelfsema C, Udy J, Baltais S, Lyons M, Phinn S (2022) Cloud processing for simultaneous mapping of seagrass meadows in optically complex and varied water. Remote Sensing 14, 609.
| Crossref | Google Scholar |
Kuiper-Linley M, Johnson CR, Lanyon JM (2007) Effects of simulated green turtle regrazing on seagrass abundance, growth and nutritional status in Moreton Bay, south-east Queensland, Australia. Marine and Freshwater Research 58, 492-503.
| Crossref | Google Scholar |
Lanyon JM (2003) Distribution and abundance of dugongs in Moreton Bay, Queensland, Australia. Wildlife Research 30, 397-409.
| Crossref | Google Scholar |
Leblanc ML, O’Connor MI, Kuzyk ZZA, Noisette F, Davis KE, Rabbitskin E, Sam LL, Neumeier U, Costanzo R, Ehn JK, Babb D, Idrobo CJ, Gilbert JP, Leblon B, Humphries MM (2023) Limited recovery following a massive seagrass decline in subarctic eastern Canada. Global Change Biology 29, 432-450.
| Crossref | Google Scholar | PubMed |
Lirman D, Cropper WP (2003) The influence of salinity on seagrass growth, survivorship, and distribution within Biscayne Bay, Florida: field, experimental, and modeling studies. Estuaries 26, 131-141.
| Crossref | Google Scholar |
Longstaff BJ, Dennison WC (1999) Seagrass survival during pulsed turbidity events: the effects of light deprivation on the seagrasses Halodule pinifolia and Halophila ovalis. Aquatic Botany 65, 105-121.
| Crossref | Google Scholar |
Lüdecke D, Ben-Shachar MS, Patil I, Waggoner P, Makowski D (2021) performance: an R package for assessment, comparison and testing of statistical models. Journal of Open Source Software 6, 3139.
| Crossref | Google Scholar |
Lybolt M, Neil D, Zhao J, Feng Y, Yu K-F, Pandolfi J (2011) Instability in a marginal coral reef: the shift from natural variability to a human-dominated seascape. Frontiers in Ecology and the Environment 9, 154-160.
| Crossref | Google Scholar |
Lyons M, Phinn S, Roelfsema C (2011) Integrating quickbird multi-spectral satellite and field data: mapping bathymetry, seagrass cover, seagrass species and change in Moreton Bay, Australia in 2004 and 2007. Remote Sensing 3(1), 42-64.
| Crossref | Google Scholar |
Lyons MB, Phinn SR, Roelfsema CM (2012) Long term land cover and seagrass mapping using Landsat and object-based image analysis from 1972 to 2010 in the coastal environment of South East Queensland, Australia. ISPRS Journal of Photogrammetry and Remote Sensing 71, 34-46.
| Crossref | Google Scholar |
Lyons MB, Roelfsema CM, Phinn SR (2013) Towards understanding temporal and spatial dynamics of seagrass landscapes using time-series remote sensing. Estuarine, Coastal and Shelf Science 120, 42-53.
| Crossref | Google Scholar |
Macreadie PI, Baird ME, Trevathan-Tackett SM, Larkum AWD, Ralph PJ (2014) Quantifying and modelling the carbon sequestration capacity of seagrass meadows – a critical assessment. Marine Pollution Bulletin 83, 430-439.
| Crossref | Google Scholar | PubMed |
Maritime Safety Queensland, Department of Transport and Main Roads (2024) Queensland Tide Tables Standard Port Tide Times. (Queensland Government: Brisbane, Qld, Australia) Available at https://www.msq.qld.gov.au/tides/tide-tables.aspx [Data tables]
McKenzie LJ, Nordlund LM, Jones BL, Cullen-Unsworth LC, Roelfsema C, Unsworth RKF (2020) The global distribution of seagrass meadows. Environmental Research Letters 15, 074041.
| Crossref | Google Scholar |
Meylan PA, Hardy RF, Gray JA, Meylan AB (2022) A half-century of demographic changes in a green turtle (Chelonia mydas) foraging aggregation during an era of seagrass decline. Marine Biology 169, 74.
| Crossref | Google Scholar |
Mills VS, Berkenbusch K (2009) Seagrass (Zostera muelleri) patch size and spatial location influence infaunal macroinvertebrate assemblages. Estuarine, Coastal and Shelf Science 81, 123-129.
| Crossref | Google Scholar |
Moir T, Huggett MJ, Kirkman T, Smith TM, Gaston TF (2025) Decadal long sub-lethal temperature increases alter the production of non-structural carbohydrates in Zostera muelleri. Marine Environmental Research 208, 107124.
| Crossref | Google Scholar | PubMed |
Naidu G, Zuva T, Sibanda EM (2023) A review of evaluation metrics in machine learning algorithms. In ‘Artificial intelligence application in networks and systems’. (Eds R Silhavy, P Silhavy) pp. 15–25. (Springer International Publishing: Cham, Switzerland) doi:10.1007/978-3-031-35314-7_2
Nordlund LM, Unsworth RKF, Gullström M, Cullen-Unsworth LC (2018) Global significance of seagrass fishery activity. Fish and Fisheries 19, 399-412.
| Crossref | Google Scholar |
Nowicki RJ, Thomson JA, Burkholder DA, Fourqurean JW, Heithaus MR (2017) Predicting seagrass recovery times and their implications following an extreme climate event. Marine Ecology Progress Series 567, 79-93.
| Crossref | Google Scholar |
Ondiviela B, Losada IJ, Lara JL, Maza M, Galván C, Bouma TJ, van Belzen J (2014) The role of seagrasses in coastal protection in a changing climate. Coastal Engineering 87, 158-168.
| Crossref | Google Scholar |
Orth RJ, Heck KL Jr (2023) The dynamics of seagrass ecosystems: history, past accomplishments, and future prospects. Estuaries and Coasts 46, 1653-1676.
| Crossref | Google Scholar |
Orth RJ, Carruthers TJB, Dennison WC, Duarte CM, Fourqurean JW, Heck KL, Hughes AR, Kendrick GA, Kenworthy WJ, Olyarnik S, Short FT, Waycott M, Williams SL (2006) A global crisis for seagrass ecosystems. BioScience 56, 987-996.
| Crossref | Google Scholar |
Orth RJ, Williams MR, Marion SR, Wilcox DJ, Carruthers TJB, Moore KA, Kemp WM, Dennison WC, Rybicki NB, Peter B, Batiuk RA (2010) Long-term trends in submersed aquatic vegetation (SAV) in Chesapeake Bay, USA, related to water quality. Estuaries and Coasts 33, 1144-1163.
| Crossref | Google Scholar |
Pante E, Dustan P (2012) Getting to the point: accuracy of point count in monitoring ecosystem change. Journal of Marine Biology 2012, 802875.
| Crossref | Google Scholar |
Perkins NR, Foster SD, Hill NA, Barrett NS (2016) Image subsampling and point scoring approaches for large-scale marine benthic monitoring programs. Estuarine, Coastal and Shelf Science 176, 36-46.
| Crossref | Google Scholar |
Phinn SR, Dekker AG, Brando VE, Roelfsema CM (2005) Mapping water quality and substrate cover in optically complex coastal and reef waters: an integrated approach. Marine Pollution Bulletin 51, 459-469.
| Crossref | Google Scholar | PubMed |
Phinn S, Roelfsema C, Dekker A, Brando V, Anstee J (2008) Mapping seagrass species, cover and biomass in shallow waters: an assessment of satellite multi-spectral and airborne hyper-spectral imaging systems in Moreton Bay (Australia). Remote Sensing of Environment 112, 3413-3425.
| Crossref | Google Scholar |
Pörtner H-O, Roberts DC, Tignor M, Poloczanska ES, Mintenbeck K, Alegría A, Craig M, Langsdorf S, Löschke S, Möller V, Okem A, Rama B (Eds) (2022) ‘Climate Change 2022: Impacts, Adaptation, and Vulnerability. Contribution of Working Group II to the Sixth Assessment Report of the Intergovernmental Panel on Climate Change.’ (Cambridge University Press: Cambridge, UK, and New York, NY, USA) doi:10.1017/9781009325844
Preen AR, Lee Long WJ, Coles RG (1995) Flood and cyclone related loss, and partial recovery, of more than 1000 km2 of seagrass in Hervey Bay, Queensland, Australia. Aquatic Botany 52, 3-17.
| Crossref | Google Scholar |
Priya AK, Muruganandam M, Rajamanickam S, Sivarethinamohan S, Gaddam MKR, Velusamy P, Gomathi R, Ravindiran G, Gurugubelli TR, Muniasamy SK (2023) Impact of climate change and anthropogenic activities on aquatic ecosystem – a review. Environmental Research 238, 117233.
| Crossref | Google Scholar |
Roca G, Alcoverro T, Krause-Jensen D, Balsby TJS, van Katwijk MM, Marbà N, Santos R, Arthur R, Mascaró O, Fernández-Torquemada Y, Pérez M, Duarte CM, Romero J (2016) Response of seagrass indicators to shifts in environmental stressors: a global review and management synthesis. Ecological Indicators 63, 310-323.
| Crossref | Google Scholar |
Roelfsema C, Kovacs EM, Saunders MI, Phinn S, Lyons M, Maxwell P (2013) Challenges of remote sensing for quantifying changes in large complex seagrass environments. Estuarine, Coastal and Shelf Science 133, 161-171.
| Crossref | Google Scholar |
Roelfsema CM, Lyons M, Kovacs EM, Maxwell P, Saunders MI, Samper-Villarreal J, Phinn SR (2014) Multi-temporal mapping of seagrass cover, species and biomass: a semi-automated object based image analysis approach. Remote Sensing of Environment 150, 172-187.
| Crossref | Google Scholar |
Roelfsema C, Lyons D, Kovacs EM, Phinn S (2015a) Integrating field survey data with satellite image data to improve shallow water seagrass maps: the role of AUV and snorkeller surveys? Remote Sensing Letters 6(2), 135-144.
| Crossref | Google Scholar |
Roelfsema CM, Kovacs EM, Phinn SR (2015b) Field data sets for seagrass biophysical properties for the Eastern Banks, Moreton Bay, Australia, 2004–2014. Scientific Data 2, 150040.
| Crossref | Google Scholar | PubMed |
Saunders MI, Leon J, Phinn SR, Callaghan DP, O’Brien KR, Roelfsema CM, Lovelock CE, Lyons MB, Mumby PJ (2013) Coastal retreat and improved water quality mitigate losses of seagrass from sea level rise. Global Change Biology 19, 2569-2583.
| Crossref | Google Scholar | PubMed |
Saunders MI, Atkinson S, Klein CJ, Weber T, Possingham HP (2017) Increased sediment loads cause non-linear decreases in seagrass suitable habitat extent. PLoS ONE 12, e0187284.
| Crossref | Google Scholar | PubMed |
Short FT, Koch EW, Creed JC, Magalhães KM, Fernandez E, Gaeckle JL (2006) SeagrassNet monitoring across the Americas: case studies of seagrass decline. Marine Ecology 27, 277-289.
| Crossref | Google Scholar |
Short FT, Coles R, Fortes MD, Victor S, Salik M, Isnain I, Andrew J, Seno A (2014) Monitoring in the Western Pacific region shows evidence of seagrass decline in line with global trends. Marine Pollution Bulletin 83, 408-416.
| Crossref | Google Scholar | PubMed |
Stankovic M, Tantipisanuh N, Rattanachot E, Prathep A (2018) Model-based approach for estimating biomass and organic carbon in tropical seagrass ecosystems. Marine Ecology Progress Series 596, 61-70.
| Crossref | Google Scholar |
Strydom S, Murray K, Wilson S, Huntley B, Rule M, Heithaus M, Bessey C, Kendrick GA, Burkholder D, Fraser MW, Zdunic K (2020) Too hot to handle: unprecedented seagrass death driven by marine heatwave in a World Heritage Area. Global Change Biology 26, 3525-3538.
| Crossref | Google Scholar | PubMed |
Turschwell MP, Connolly RM, Dunic JC, Sievers M, Buelow CA, Pearson RM, Tulloch VJD, Côté IM, Unsworth RKF, Collier CJ, Brown CJ (2021) Anthropogenic pressures and life history predict trajectories of seagrass meadow extent at a global scale. Proceedings of the National Academy of Sciences 118, e2110802118.
| Crossref | Google Scholar |
Udy JW, Dennison WC (1997) Growth and physiological responses of three seagrass species to elevated sediment nutrients in Moreton Bay, Australia. Journal of Experimental Marine Biology and Ecology 217, 253-277.
| Crossref | Google Scholar |
Udy JW, Dennison WC, Lee Long WJ, McKenzie LJ (1999) Responses of seagrass to nutrients in the Great Barrier Reef, Australia. Marine Ecology Progress Series 185, 257-271.
| Crossref | Google Scholar |
Unsworth RKF, McKenzie LJ, Collier CJ, Cullen-Unsworth LC, Duarte CM, Eklöf JS, Jarvis JC, Jones BL, Nordlund LM (2019) Global challenges for seagrass conservation. Ambio 48, 801-815.
| Crossref | Google Scholar | PubMed |
Venegas RM, Acevedo J, Treml EA (2023) Three decades of ocean warming impacts on marine ecosystems: a review and perspective. Deep Sea Research Part II: Topical Studies in Oceanography 212, 105318.
| Crossref | Google Scholar |
Walker DI, McComb AJ (1992) Seagrass degradation in Australian coastal waters. Marine Pollution Bulletin 25, 191-195.
| Crossref | Google Scholar |
Waycott M, Duarte CM, Carruthers TJB, Orth RJ, Dennison WC, Olyarnik S, Calladine A, Fourqurean JW, Heck KL, Hughes AR, Kendrick GA, Kenworthy WJ, Short FT, Williams SL (2009) Accelerating loss of seagrasses across the globe threatens coastal ecosystems. Proceedings of the National Academy of Sciences 106, 12377-12381.
| Crossref | Google Scholar |
Wendländer NS, Lange T, Connolly RM, Kristensen E, Pearson RM, Valdemarsen T, Flindt MR (2020) Assessing methods for restoring seagrass (Zostera muelleri) in Australia’s subtropical waters. Marine and Freshwater Research 71, 996-1005.
| Crossref | Google Scholar |
York PH, Gruber RK, Hill R, Ralph PJ, Booth DJ, Macreadie PI (2013) Physiological and morphological responses of the temperate seagrass Zostera muelleri to multiple stressors: investigating the interactive effects of light and temperature. PLoS ONE 8, e76377.
| Crossref | Google Scholar | PubMed |
York PH, Smith TM, Coles RG, McKenna SA, Connolly RM, Irving AD, Jackson EL, McMahon K, Runcie JW, Sherman CDH, Sullivan BK, Trevathan-Tackett SM, Brodersen KE, Carter AB, Ewers CJ, Lavery PS, Roelfsema CM, Sinclair EA, Strydom S, Tanner JE, van Dijk K-J, Warry FY, Waycott M, Whitehead S (2017) Identifying knowledge gaps in seagrass research and management: an Australian perspective. Marine Environmental Research 127, 163-172.
| Crossref | Google Scholar | PubMed |
Young PC, Kirkman H (1975) The seagrass communities of Moreton Bay, Queensland. Aquatic Botany 1, 191-202.
| Crossref | Google Scholar |
Yu Y, Zhang H, Lemckert CJ (2011) The response of the river plume to the flooding in Moreton Bay, Australia. Journal of Coastal Research 2011(SI 64), 1214-1218 https://www.jstor.org/stable/26482367.
| Google Scholar |
Zeileis A, Hothorn T (2002) Diagnostic checking in regression relationships. R News 2, 7-10.
| Google Scholar |