
Native flora receive more visits than exotics from bees, especially native bees, in an urbanised biodiversity hotspot
Kit S. Prendergast A *
A *
A Curtin University, School of Molecular and Life Sciences, Kent Street, Bentley, WA 6102, Australia.
Abstract
Identifying floral resources preferred by bee assemblages is important for their conservation.
Here, I assess the association of flowering plant community composition, with that of honey bees and native bee abundance and diversity. I investigate flower preferences in terms of plant origin (native or exotic), and evaluate niche breadth, of introduced honey bees and native bee taxa. I also consider if habitat influences these patterns.
This was evaluated through recording flower visitation by honey bees and native bees in the urbanised region of the south-west Western Australian Floristic Region in seven bushland remnants and seven residential gardens over 2 years.
Both native bees and honey bees visited more native than exotic flora, however native bees visited a higher proportion of native flora than honey bees. The 10-most visited plants by native bees were exclusively native, whereas for honey bees, although their 10-most visited plants were predominantly native plant species, this selection also included exotic plant species. Niche breadth was broader in bushland remnants, indicating a greater range of preferred flora in bushland remnants. Honey bees however visited more plant families in residential gardens. With increased honey bee abundance, this was associated with native bees expanding their niche breadth, which may be a response to reduce competition. Flower preference patterns and niche breadth often differed between habitats, indicating that foraging patterns may be mediated by habitat context.
Native flora are preferred by bees, and native bees have relatively restricted flower preferences, especially compared with honey bees.
High proportions of preferred native flora are needed to support diverse native bee assemblages in urban areas.
Keywords: conservation, honey bees, Hymenoptera, native bees, niche breadth, pollinators, urbanisation, wild bees, wildflowers.
Introduction
Bees (Hymenoptera, Anthophila) are highly reliant on flowering resources – pollen and nectar – for nutrition at all stages of their life-cycle. However, not all flowers are equally suitable for bees (Matteson and Langellotto 2011). Flowers can have inferior nectar or pollen qualities, quantities or compositions (Potts et al. 2003). For example, some contain toxic compounds (e.g. alkaloids, saponins, cardiac glycosides and cyanogenic glycosides present at concentrations that can cause harmful effects to bees (Detzel and Wink 1993; Tiedeken et al. 2014)). Other flowers do not provide the correct nutritional profile for bee larval development (Jeannerod et al. 2022) (e.g. some pollen species fail to support successful larval development; such as Tanacetum pollen for generalist megachilids (Sedivy et al. 2011)). Importantly, some native bee taxa have co-evolved with a restricted range of flora, and if their host flowers are not present, they will not be present (Waser and Ollerton 2006).
Conversion of natural landscapes to anthropogenic ones, and associated loss of native wildflowers (Brown and Paxton 2009), to be replaced by exotic flora (Vanbergen et al. 2018), is considered a major threat to wild bees. Urbanisation heavily contributes to loss of native vegetation, with cities expected to expand across the globe (Güneralp et al. 2013). However, cities can also present benefits to bees. Compared with agricultural and some natural habitats, cities often have the highest species richness of plants (McKinney 2008). Hülsmann et al. (2015) found that for bumblebees, an increased plant diversity associated with urbanisation compensated for the negative effects of large areas of impervious surfaces that accompany urbanisation.
However, increased flowering species may not result in benefits for bees. Flowering plants in urban gardens include horticulturally modified varieties unsuitable for bees e.g. owing to petal modifications that reduce accessibility to floral resources (Corbet et al. 2001). For example, horticultural modifications can change features that have co-evolved with insect visitors, leading to a loss in attractiveness or nutritional value. This can include loss of a functional spur (and therefore loss of nectar), whilst alterations in size, form or colour of the corolla that can obstruct access to nectar/pollen, come at the cost of reducing investment in nectar/pollen quality or quantity, or result in disruption of co-evolved preferences (Comba et al. 1999).
Therefore, the general finding of greater plant diversity in cities (McKinney 2008) may still result in a loss of preferred floral species. Specialists are especially vulnerable to urbanisation if vital mutualisms are severed with native flora reductions (Frankie et al. 2005; Prendergast et al. 2022a). Exotic flowering plants may end up benefitting exotic generalists – in particular, European honey bees (Apis mellifera), at the expense of native bees (Richardson et al. 2000; Prendergast et al. 2021). In natural habitats it has been demonstrated that native bees tend to prefer native flora, whereas a plant community dominated by exotic, invasive flora is favoured by the exotic honey bees (Abe et al. 2011). The range of floral resources a species uses is also constrained by competition; if honey bees outcompete native bees, native bees will be excluded from certain resources (Prendergast et al. 2023). This may lead to a narrowing of niche breadth (Smith 1982; Hudewenz and Klein 2015). However, there exists evidence that exotic flora may support a greater diversity of bees than native flora (Petanidou et al. 2008; Montero-Castaño and Vilà 2017). Horticultural varieties with large floral displays and high nectar crops may be even more attractive to bees (Comba et al. 1999).
The flowering species composition may be of overriding importance for bee assemblages, including in urban areas (Hülsmann et al. 2015). In cities, much of the original flowering community is lost and remains as fragmented wildland remnants (Stenhouse 2004), with other greenspaces being determined by practical and aesthetic preferences of the homeowner or manager (Hoyle 2021), such that urban flower composition represents a diversity of flora based on both the natural pool of flowers, as well as those introduced for gardening or urban landscaping purposes, or unintentionally as weeds (Cane 2005). Which flower species are present, and their particular nectar and pollen chemistry, impacts bee populations and communities This importance of flower composition has been supported by numerous studies – both manipulative and mensurative (Weiner et al. 2010; Eckhardt et al. 2014; Vanderplanck et al. 2014). Wild bees in Australia can be predicted to be particularly sensitive to flower origin and composition: as Australia is a continent that has been biogeographically isolated from the rest of the globe for millions of years, many species are endemic, and have co-evolved in isolation (Hopper 2009). Examples include the diverse and predominantly oligolectic Euryglossinae, and Stenotritidae (Houston 2018). In contrast, generalist bees like the introduced European honey bee Apis mellifera may be indifferent, or even capitalise on, increased representations of exotic flora, especially if exotic plant species offer good quality sources of nutrition (Miller et al. 2015; Drossart et al. 2017).
The response of bees to flower resources can be quantified in terms of niche breadth. Numerous indexes exist in the ecological literature, but generally relate how many resource states a species uses out of all resource states available in a given time and space (Krebs 2009). Such metrics however ignore taxonomic identity, which is critical in terms of categorising bees in the mellitological literature. Bees are categorised as specialists if they forage for pollen from flowers in just one family across the species’ range, or as oligolectic, if they forage for pollen from flowers across multiple families (Michener 2007).
Supporting and conserving bee populations requires identifying which flower species – be they exotic or native – are major resources. Lists and schemes for supplying evidence-based, region-specific bee-friendly flowers to support native bees in cities is an area of great interest. Most attention to date into creating pollinator habitats however has focused on agricultural areas, and on managed, generalist pollinators (Decourtye et al. 2010). Moreover, success of such schemes may be limited to generalist bees (Wood et al. 2015, 2017), and flowers marketed as ‘pollinator-friendly’ may not be supported by empirical evidence or provide food to native bees (Garbuzov et al. 2017).
Understanding how the shift from a native vegetation landscape to that with high diversity of exotics influences bee assemblages is important as we continue to design and manage urban greenspaces, given the increasing proportion of urbanised landscapes across the globe (Prendergast 2022a). Identifying major nutritional foraging resources for wild bees can allow targeted plantings, and furthermore, unlike in production dominated landscapes, we have a greater opportunity to actively design gardens with native pollinators in mind. This is important due to wild bee declines, increasing urbanisation, and the potential for urban habitats to represent either conservation hubs or areas of bee decline depending on their management (Prendergast 2020a). Nurseries and gardens, and the flora they contain, are a major means by which citizens can improve managed greenspaces for bee conservation under urbanisation (Egerer et al. 2020; Prendergast 2020a, 2022a). Discerning which plants are particularly attractive for native bees, i.e. ‘bee-friendly’, is of great interest from both a conservation and socioeconomical–ecological perspective (Wollaeger et al. 2015), yet empirical data to support flowering plants that are key ‘bee-friendly’ flowers is currently largely absent (Turo and Gardiner 2019; Prendergast 2020a, 2020b).
This study sought to clarify foraging niches of native bees and honey bees in an urban region with respect to plant community and plant origin of the flowers visited, and whether this differed between native vegetation remnants and residential gardens. Key plants supporting the majority of bees in this urbanised biodiversity hotspot were listed to assist future management practices.
It was hypothesised that:
Floral species composition significantly influences bee numbers, diversity, and taxonomic community composition of native bees
Honey bees visit more exotic flora than native flora, whereas native bees visit more native flora than exotic flora
Niche breadth of honey bees is greater than that of native bees
Niche breadth of both honey bees and native bees is greater in residential gardens than native vegetation remnants
Niche breadth of native bees is reduced when honey bee abundances are higher
Methods
Study region
The study was conducted around Perth, the capital city of Western Australia; it is located on the Swan Coastal Plain region of the south-west Western Australian (SWWA) biodiversity hotspot. Harbouring 7239 vascular plant species, the region is characterised by a high diversity of native flora, of which almost 80% is endemic (Lambers 2014). Only 39% of the area covered by native vegetation pre-European settlement (prior to 1829) remains, with only 10% of the remaining patches protected for conservation (Government of Western Australia 2019). Surveys of native bees were conducted at 14 sites representing two distinct habitat types: seven were residential gardens, and seven were native vegetation remnants within the urbanised region. Sites of the two habitat types were interspersed, and all sites were more than 1 km apart to ensure they were independent. Bushland remnants were selected such that they were dispersed across the region interspersed by more urbanised areas, and covered metropolitan Perth, both north and south of the Swan River. For residential gardens, a request for gardens to be included was publicised and shared over social media in Perth and Western Australian garden and flower Facebook groups. Residential gardens were selected based on their interspersion with these bushland remnants, but were otherwise selected without any prior knowledge of the vegetation, so that there could be no pre-selection bias, and were in theory a representative selection of gardens in the region. For more information about the sites refer to Prendergast (2020b). Data on the flower communities present during each survey are presented in Prendergast (2020b). The current paper continues a history of work at these sites involving bee–plant interactions in the urbanised region of the south-west Western Australian biodiversity hotspot (Prendergast 2020a; Prendergast and Ollerton 2021, 2022; Prendergast et al. 2022b).
Study organisms
Over 800 species of native bees are estimated to occur in Western Australia (Houston 2000), with over 300 species known to occur on the Swan Coastal Plain of the south-west Western Australian biodiversity hotspot (Prendergast 2020a, 2020c, 2021a, 2021b, 2021c, 2022b). In south-west Western Australia the majority of native bee species are solitary. There are no eusocial native bee species, however some taxa exhibit primitive sociality (communal nesting e.g. Allodapini and Halictidae (Houston 2018)). Many species of Australian native bees are undescribed, and information on their life-history and dietary breadth is sparse (Batley and Hogendoorn 2009). It is known, however, that a large proportion of Australian bee fauna show specialisation in terms of foraging from plants in a single family: Trichocolletes and many Megachile specialise on native peas (Fabaceae); Lithurgini on Malvaceae; many Hylaeinae specialise on Myrtaceae; and the majority of Euryglossinae, Australia’s most species-rich subfamily, are oligolectic (mainly Mytraceae, but also some species on Fabaceae and Eremophila (Scrophulariaceae)) (Houston 2000, 2018). The European honey bee Apis mellifera is the only non-native species in this region.
Bee and flower surveys
Sites were visited monthly between November–February 2016/17, and October–March 2017/18. Native bees in the region are seasonal, and for the majority of species, their activity season coincides with the warmer weather and blooming of flora in the spring and summer months (Houston 2000). Observations were conducted for 3 h per site between 10:30 and 13:30 hours on days with no to low cloud cover, wind speeds below 40 km/h and with temperatures above 18°C (assessed using the Bureau of Meteorology weather forecast from the closest weather station to the site). A single site was visited each day, with no sites of the same habitat type visited more than three times in succession. The order of site visits was randomised, but within the constraints of permission to visit residential gardens and weather conditions (e.g. fire hazards in bushland remnants). During each survey flowering patches within a 1 ha area were observed for bee visitors whilst one surveyor (the author) walked slowly (at the pace of approximately 0.3 m/s) around the site. For bushland remnants this was a 100 m × 100 m area located at least 20 m from roads to avoid edge effects and was representative of the vegetation type of the remnant. For residential gardens the 1 ha comprised the front and back yard and verge vegetation, such that the area surveyed was standardised across all sites. Patches of flowers (flowering trees, shrubs, or a 2 m × 2 m area of ground with more than three flowers) were observed for 1 min and if no activity was observed, the surveyor moved on. Observations of bees were recorded in the field on a clipboard, and numbers of each bee taxon – European honey bees (Apis mellifera) and native taxa – visiting flowers was tallied (Prendergast 2020b). Native bees were identified to the following taxonomic categories that could be discerned in the field by observation, and represent similarities in ecologies (based on the principle of phylogenetic inertia and phylogenetic signals in responses of bees to environmental filters (Sydenham et al. 2015)): Exoneura, Amegilla, Euryglossinae, Homalictus, Hylaeinae, Lasioglossum, Leioproctus, Lipotriches, Megachile, Coelioxys, Thyreus, and Trichocolletes (Prendergast 2020b, see also Prendergast and Ollerton 2021). In addition to direct observations, specimens were collected with an entomological sweep net, enabling confirmation of their taxonomic identity (Prendergast 2020d). Bees were identified by the author using Houston (2018) and references therein, and verifying identifications by reference to the Western Australian Museum Entomology Collection. All specimens collected have been deposited in the WA Museum Entomology collection.
Each bee survey was followed by a plant survey of the same area. The number of plant species in flower, their species identity, origin (native to Australia vs exotic), and number of flower units for each plant species were recorded (Prendergast 2020b). As a geographically isolated continent, I considered species that evolved in Australia to be native, and any introduced plant species to be exotic (ANPSA 2020). Native flora were identified with reference to a field guide for the region (Barrett and Tay 2016), and in consultation with botanists K. Dixon, C. Tauss, M. Cambridge, or H. Lambers; non-native flora were identified by consulting M. Tusak (Domas nursery) and through public garden plant forums. Flower units were inflorescences for most flowers, but were capitula for composite flowers (e.g. Asteraceae). From these floral surveys the total number of flowering plants, number of flowers, number of native flowers, number of native flowering plant species, and proportion of native flowers and flowering species present during each survey were calculated.
Data analyses
Data from each of the 2 years of surveys were analysed separately due to the different durations over which the surveys were conducted in the first vs second year (4 months and 6 months, respectively), and variation in plant and pollinator assemblages between years (refer to Supplementary Material).
Influence of floral species composition was assessed in PRIMER v.7 using the RELATE function (Clark and Gorley 2015) on a Bray–Curtis species × site matrix of floral species and their abundances (log +1 transformed), in relation to native bee abundance (square-root transformed), honey bee abundance (fourth-root transformed), and native bee species richness. As the bee datasets were univariate, Euclidean distance matrixes were used (Anderson 2014). The correlation method used was Spearman rank, and executed with 9999 permutations. From this analysis I calculated ρ = Spearman rank correlation (rho) between the bee and flower assemblages, and their significance level, where a percentage of 5% corresponds to a P-value of 0.05, such that values <5% are deemed statistically significant (Clark and Gorley 2015).
Preference for flower origin, was assessed in terms of numbers of visits by native bees and honeybees to native vs exotic flowers, and on numbers of visits to native vs exotic flowering plant species. This was modelled using generalised linear mixed effect model (glmer) models (package ‘lme4’, in the R statistical computing platform (https://www.r-project.org/)), with a Poisson distribution, and with site as a random factor. The package ‘blmeco’, function ‘dispersion_glmer’ was used to check for overdispersion (Korner-Nievergelt et al. 2015). If there was significant overdispersion, as indicated by a dispersion factor of >1.4 (Korner-Nievergelt et al. 2015), for models of numbers of flower visits, and warnings suggesting rescaling, the response variable was transformed with natural logarithms. If overdispersion still occurred, a glmer model with a random observation level was used (Harrison 2014). Where overdispersion was found when modelling plant species visited, due to zero-inflated data, a negative binomial generalised linear mixed effect model (glmer.nb) was used. Whether honey bees and native bees differed from each other in the proportion of native flowers or native plant species they visited was assessed with a glmer with a binomial family. The interaction with habitat type was investigated; if found to be significant, the main effect of plant origin was also tested separately in each habitat type.
The significance of the explanatory variables and interactions with habitat type were assessed using a log-likelihood test, which involves performing an ANOVA between a model with and without that variable (or interaction). An estimate of the effect and direction of the floral metric on the response variables was determined from the summary output. The coefficient of determination, as the marginal R2 value, represents the variance explained by fixed effects in mixed effect models. This value was calculated using the function ‘r.squaredGLMM’, package ‘MuMln’ (Nakagawa and Schielzeth 2013).
We assessed if collinearities between these floral parameters may influence interpretation of any bee–flower associations by calculating a partial correlation coefficient matrix among the variables (function ‘cor2pcor’, package ‘corpcor’ (Schafer et al. 2017)), where I considered a correlation of >0.7 to indicate collinearity (Dormann et al. 2013). I investigated all floral parameters, as they are ecologically relevant (see Dormann et al. 2013), but draw attention to the implications when variables exhibited collinearity.
To provide practical guidance to policymakers and the public, the 10 most-visited flowering plant species, their family, origin, and proportion of bees that visited these plants were tabulated for each year and for native bees and honey bees separately.
Niche breadth was calculated for honey bees and each bee taxonomic group from observations of bees foraging on flora at each site per month. The measure of niche breadth used was Smith’s (Smith 1982):
where FT = Smith’s measure of niche breadth, pj = proportion of individuals found in or using resource state j, aj = proportion resource j is of the total resources, n = total number of possible resource states.
This measure takes into account resource availability, and varies from 0 to 1. Unlike many other current metrics of niche breadth, it is a standardised measure, and is less sensitive to selectivity of rare species (Krebs 2009).
Comparisons of niche breadth between taxa, between habitats, bee taxa, and the influence of honey bee abundance on native bee niche breadth, were performed in R using models constructed with the glmmTMB package (Brooks et al. 2017), due to the bounded nature of the data, with site as a random effect. Differences between honey bees and native bees, and habitat type, were assessed using ANOVAs to compare models with and without the factor of interest. The relationship between honey bee abundance and native bee niche breadth was assessed with a summary output of the model, and the coefficient of determination calculated using the ‘r2 function’ in the package ‘sjstats’ (Lüdecke 2019). Tukey’s pairwise differences between bee taxa in niche breadth were tested using the package ‘emmeans’, using a Bonferroni correction to account for multiple comparisons (Lenth 2022).
Statistical calculations and indexes of niche breadth however have the drawback on obscuring the identity of the resources foraged on – some species can have a taxonomically narrow niche breadth (i.e. in terms of lecty) but a broad niche breadth based on indexes. I therefore assessed, for each bee taxon, the number of plant genera they foraged on. Differences in number of families visited were tested with a glmer model with a random factor for site and a fixed factor for year using a Poisson distribution. The significance of bee taxon, habitat type, or their interaction were tested using the ANOVA approach involving log-likelihood tests between models. Tukey’s pairwise differences between bee taxa in number of plant families visited were tested using the above approach involving the package ‘emmeans’.
Ethics approval
No ethics approval was required. Permission to collect native bees was given by Department of Parks and Wildlife (DPaW Permit Number: 08-000936-1). Permission to undertake scientific activities and permits were approved for all bushland sites, and permission to survey residential gardens was kindly granted by the homeowners.
Results
Effect of plant species community composition
Community composition of the plants at a site was significantly related to native bee abundance (Year One: rho = 0.111, P = 0.001; Year Two: abundance: rho = 0.102, P = 0.0002) and native bee species richness (Year One: rho = 0.201, P = 0.001; Year Two: rho = 0.081, P = 0.0027). Honey bee abundance however was unrelated to floral species composition in both Year One (rho = 0.001, P = 0.467) and Year Two (rho = 0.031, P = 0.124).
Preferences for plant origin of visited flora
Native bees visited more native than exotic flowers in both years (P < 0.001, Table 1; Appendix 1 in Supplementary Material). There was a flower origin × habitat type interaction in both years (P < 0.001): the preference for native flowers occurred in both habitat types, however was greater in residential gardens (Table 1; Appendix 1). Native bees also visited more native plant species than exotic plant species in both years (P < 0.001, Table 1; Appendix 1). This also varied by habitat type, whereby although there were more visits to native plants in bushlands, in residential gardens the number of visits to native and exotic plants were not significantly different (Table 1; Appendix 1).
| Native flower visits | Exotic flower visits | Native plant species visited | Exotic plant species visited | |||||||
|---|---|---|---|---|---|---|---|---|---|---|
| Mean | s.e. | Mean | s.e. | Mean | s.e. | Mean | s.e. | |||
| Native bees | Year One | 82.54 | 11.27 | 3.66 | 1.31 | 1.96 | 0.14 | 0.57 | 0.14 | |
| Bushland remnants | 117.68 | 17.73 | 1.00 | 0.82 | 2.46 | 0.20 | 0.14 | 0.07 | ||
| Residential gardens | 47.39 | 10.55 | 6.32 | 2.41 | 1.46 | 0.16 | 1.00 | 0.25 | ||
| Year Two | 150.02 | 16.34 | 7.23 | 1.66 | 3.26 | 0.20 | 1.15 | 0.20 | ||
| Bushland remnants | 190.25 | 25.65 | 2.48 | 1.15 | 3.95 | 0.30 | 0.32 | 0.10 | ||
| Residential gardens | 105.78 | 17.31 | 12.45 | 3.06 | 2.50 | 0.19 | 2.08 | 0.35 | ||
| Honey bees | Year One | 234.56 | 66.08 | 28.44 | 9.40 | 2.41 | 0.21 | 1.78 | 0.29 | |
| Bushland remnants | 277.77 | 128.66 | 3.54 | 2.19 | 2.31 | 0.28 | 0.38 | 0.12 | ||
| Residential gardens | 194.43 | 46.62 | 51.57 | 17.00 | 2.50 | 0.31 | 3.07 | 0.41 | ||
| Year Two | 383.29 | 86.84 | 62.08 | 17.34 | 3.76 | 0.22 | 2.98 | 0.37 | ||
| Bushland remnants | 543.55 | 167.11 | 16.25 | 7.28 | 3.68 | 0.28 | 0.78 | 0.18 | ||
| Residential gardens | 223.03 | 36.16 | 107.90 | 32.53 | 3.85 | 0.35 | 5.18 | 0.51 | ||
Significant preferences based on flower origin are shown in bold. For statistical model outputs refer to Appendix 1.
Similarly, honey bees made significantly more visits to native flowers than exotics in both years and in both habitat types (P < 0.001, Table 1; Appendix 1). There was a significant interaction effect with habitat type, reflecting a stronger tendency of bees in bushland sites to visit native flowers (P < 0.001, Table 1; Appendix 1). In both years honey bees also visited more native plants than exotic plants (P < 0.001, Table 1; Appendix 1). This preference however varied according to habitat type (P < 0.001, Table 1; Appendix 1). In Year One, more visits to native plants only occurred in bushland remnants, whereas honey bees exhibited no preference for plants based on origin in residential gardens. In the second year honey bees visited more native plants in bushland remnants, and more exotic plants in residential gardens (Table 1; Appendix 1).
The preference for native flora differed significantly between native bees and honey bees in both years. Native bees visited a higher proportion (mean ± s.e.) of native flowers than honey bees (Year One: 0.910 ± 0.03 visits by native bees vs 0.80 ± 0.04 visits by honey bees; Year Two: 0.92 ± 0.02 visits by native bees vs 0.82 ± 0.03 visits by honey bees) (Table 1; Appendix 1). Native bees also visited a higher proportion of native plant species than honey bees (Year One: 0.83 ± 0.04 visits by native bees vs 0.68 ± 0.04 visits by honey bees; Year Two: 0.79 ± 0.03 visits by native bees vs 0.67 ± 0.03 visits by honey bees) (Table 1; Appendix 1). This did not vary by habitat type (Table 1; Appendix 1).
Ten most-visited flower species
In the first year native bees visited a total of 65 flowering plant species, and the 10 most-visited plant species received 83.3% of all visits (Table 2). In the second year, native bees visited 127 flowering plant species, and the 10 most-visited flowering plant species received 73.2% of native bee visits (Table 2). In both years, all of these most-visited plant species were native to Australia, and belonged to the two largest Australian plant families, Myrtaceae and Fabaceae (Table 2).
| Year One | Year Two | ||||||
|---|---|---|---|---|---|---|---|
| Plant species | Family | Proportion of visits | Plant species | Family | Proportion of visits | ||
| Native bees | Jacksonia furcellataBR | Fabaceae | 0.245 | Astartea scopariaB | Myrtaceae | 0.243 | |
| Jacksonia sericeaB | Fabaceae | 0.166 | Jacksonia furcellataBR | Fabaceae | 0.114 | ||
| Jacksonia sternbergianaBR | Fabaceae | 0.088 | Eucalyptus marginataBR | Myrtaceae | 0.094 | ||
| Melaleuca lanceolataB | Myrtaceae | 0.087 | Jacksonia sternbergianaBR | Fabaceae | 0.086 | ||
| Corymbia callophylaBR | Myrtaceae | 0.073 | Jacksonia sericeaR | Fabaceae | 0.077 | ||
| Melaleuca huegeliiR | Myrtaceae | 0.061 | Corymbia callophylaBR | Myrtaceae | 0.077 | ||
| Corymbia ficifoliaBR | Myrtaceae | 0.037 | Eucalyptus erythrocorysBR | Myrtaceae | 0.043 | ||
| Gompholobium aristatumR | Fabaceae | 0.031 | Melaleuca lanceolataBR | Myrtaceae | 0.030 | ||
| Thryptomene saxicolaBR | Myrtaceae | 0.024 | Melaleuca huegeliiR | Myrtaceae | 0.021 | ||
| Jacksonia gracillimaB | Fabaceae | 0.023 | Melaleuca seriataBR | Myrtaceae | 0.021 | ||
| Honey bees | Eucalyptus camaldulensisB | Myrtaceae | 0.224 | Schinus terebinthifoliusB | Anacardiaceae | 0.251 | |
| Corymbia ficifoliaBR | Myrtaceae | 0.108 | Callistemon viminalisBR | Myrtaceae | 0.142 | ||
| Melaleuca lanceolataBR | Myrtaceae | 0.082 | Eucalyptus marginataBR | Myrtaceae | 0.080 | ||
| Corymbia callophylaBR | Myrtaceae | 0.073 | Eucalyptus erythrocorysBR | Myrtaceae | 0.062 | ||
| Grevillea whiteanaBR | Proteaceae | 0.063 | Melaleuca lanceolataBR | Myrtaceae | 0.051 | ||
| Eucalyptus erythrocorys | Myrtaceae | 0.040 | Corymbia callophylaBR | Myrtaceae | 0.047 | ||
| Melaleuca huegeliiR | Myrtaceae | 0.032 | Corymbia ficifoliaBR | Myrtaceae | 0.032 | ||
| Vitis viniferaR | Vitaceae | 0.032 | Xanthorrhoea preissiiBR | Asphodelaceae | 0.029 | ||
| Callistemon viminalisBR | Myrtaceae | 0.032 | Lagerstroemia indicaR | Lythraceae | 0.028 | ||
| Melaleuca bracteataB | Myrtaceae | 0.028 | Banksia sessilisBR | Proteaceae | 0.019 | ||
Flower species in bold are native to Australia, unbolded species are exotic. Proportion of visits are calculated from a total number of visits to all flora across all surveys of 4949 in Year One and 17 567 in Year Two for native bees, and 13 421 in Year One and 33 630 in Year Two for honey bees. Superscripts refer to habitat these plants occurred in: B = bushland remnant, R = residential garden, BR = both. Note that these habitat associations are only for surveyed sites; these species may occur in the other habitat type.
In the first year, honey bees visited 113 flowering plant species – almost 75% more than all native bee species combined. The 10 most-visited plants received 71.4% of honey bee visits (Table 2). Only one of these species (Vitis vinifera (Vitaceae) – grapes) was exotic (Table 2). Eight of the 10 most-visited plant species were all in Myrtaceae, Australia’s dominant plant family. In the second year honey bees visited 204 flowering plant species – almost 50% more species than native bees. Despite this large diversity visited, the 10 most-visited plants received 74.1% of all honey bees (Table 2). The species that received the most visits (25%) was Schinus terebinthifolius – an introduced species, recognised as a potentially significant environmental weed in Western Australia (Hussey et al. 1997). All others except one species were native flora (Table 2). Six of the most-visited species were all in the family Myrtaceae. In the first year, two flowering plant species were in the 10 most-visited plant species of both native bees and honey bees, and in the second year, three of the most-visited species were shared between honey bees and native bees (Table 2).
Niche breadth
In both years, niche breadth varied widely (Figs 1 and 2). In Year One, the narrowest niche breadth was 0.015 (Lipotriches at a residential site in November), whereas the maximum niche breadth was 1.00 (honey bees at a residential site in February). Niche breadth similarly covered a large range in the second year, ranging from a minimum of 0.002 (Lasioglossum at a residential site in November), to a max of 0.987 (Hylaeinae bees at a bushland site in November). With the median niche breadth being 0.470 in Year One, and 0.399 in Year Two, overall the bee assemblages in this urbanised region have fairly narrow niche breadths.
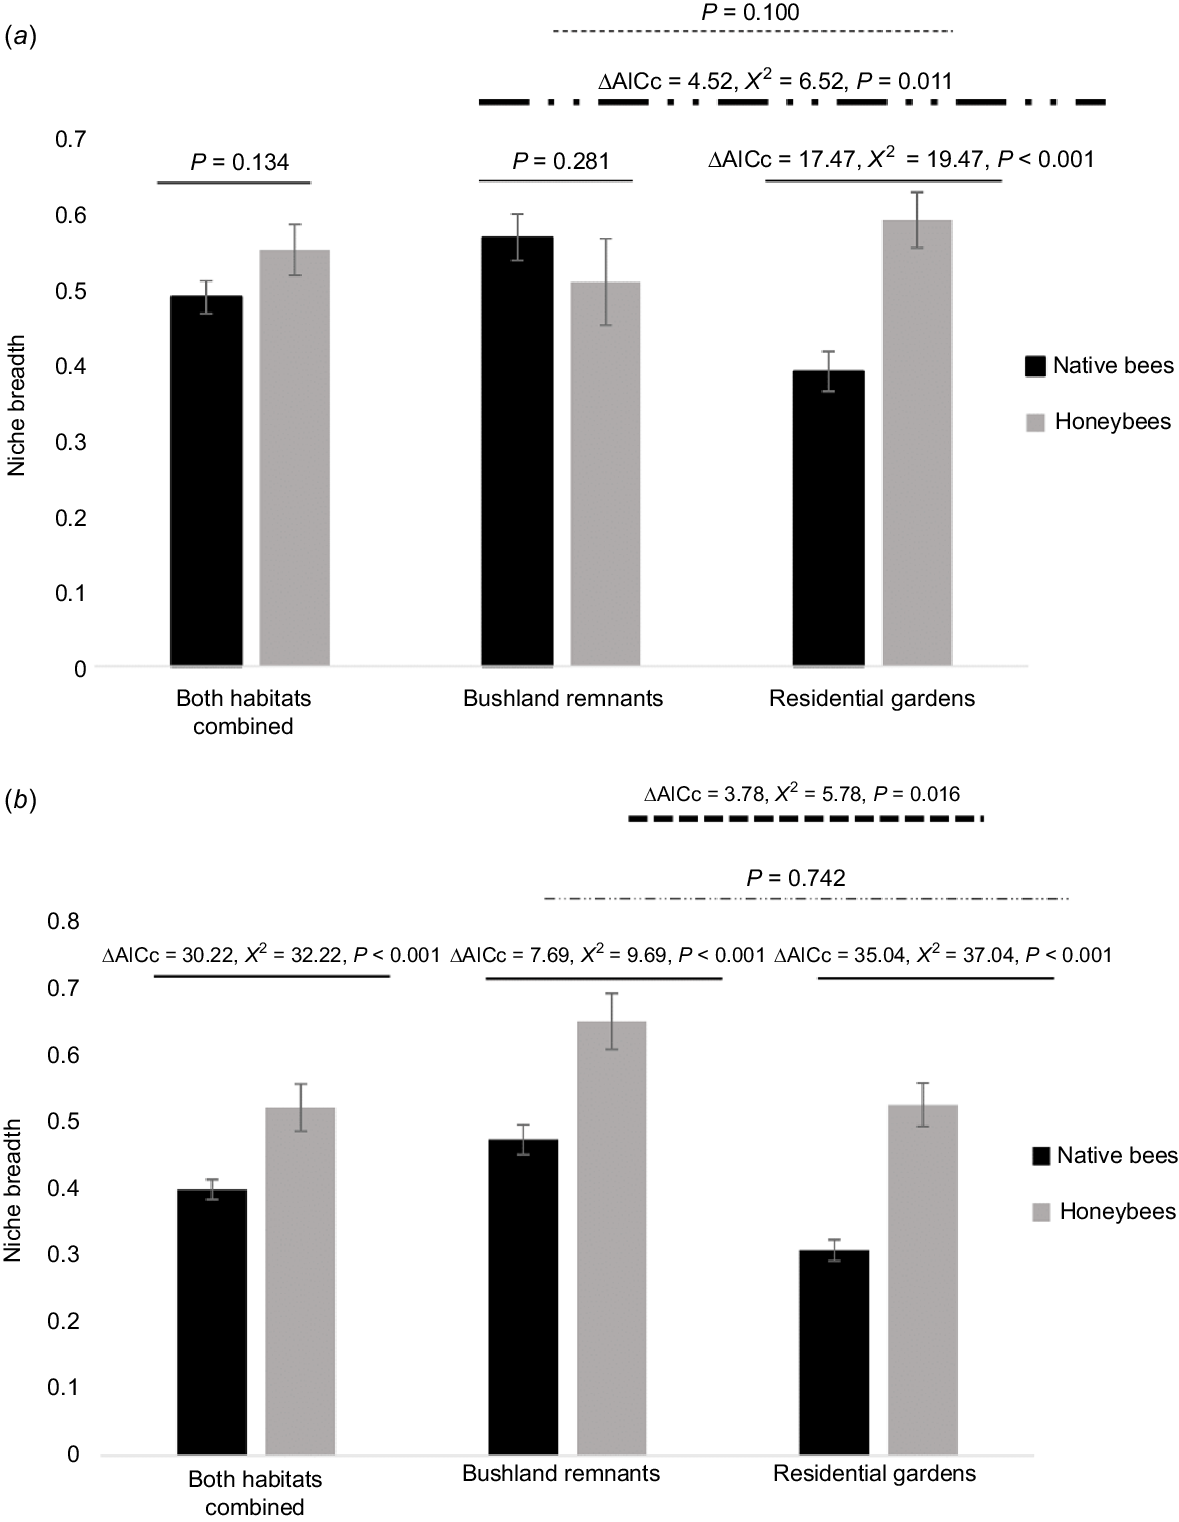
Niche breadth (mean ± standard error) of native bees and honey bees (Apis mellifera) according to habitat type in (a) Year One and (b) Year Two. ΔAICc, corrected Akaike information criterion.
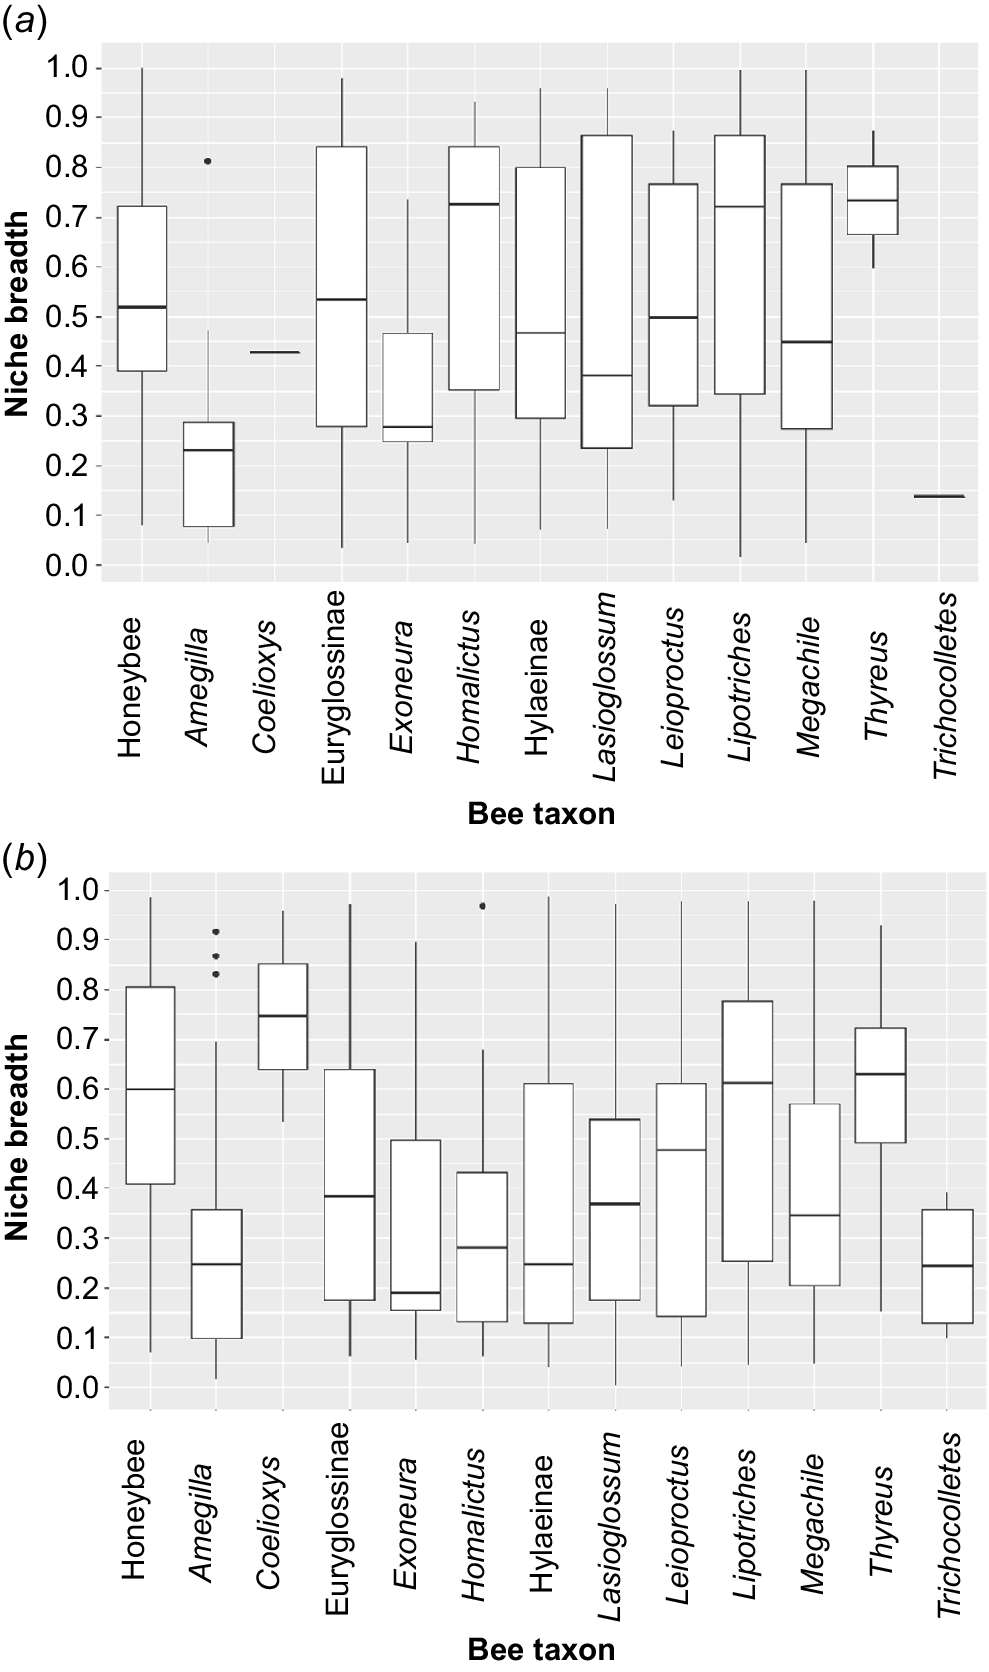
Niche breadths of native bee taxa and the honey bee (Apis mellifera) in (a) Year One and (b) Year Two. The box represents the range between the 1st and 3rd quartiles, and the whiskers represent the values above and below the interquartile range.
Niche breadth of the overall bee community did not differ between urban vs residential garden habitats in the first year of surveys (mean bushland remnant: 0.551 ± 0.027 vs mean residential garden: 0.437 ± 0.023; X2 = 2.70, P = 0.100), however in the second year niche breadth was significantly different between habitat types for the overall bee assemblage, being significantly greater (broader) in native vegetation than residential sites (mean bushland remnant: 0.505 ± 0.353 vs mean residential garden: 0.353 ± 0.02; X2 = 5.78, P = 0.016) (Fig. 1).
No significant differences in niche breadth were found between honey bees and the group of native bees in Year One (X2 = 2.24, P = 0.134) (Fig. 1a). However, there was a significant interaction between native/honey bee niche breadth with habitat type (X2 = 12.0, P < 0.001), such that differences in niche breadth between native bees and honey bees varied depending on habitat type. Niche breadth of native bees was higher in bushland remnants than in residential gardens, whereas there was no difference between habitats for honey bee niche breadth (Fig. 1a). Native bees and honey bees did not differ in niche breadth in bushland remnants, however honey bees had significantly broader niche breadths than native bees in residential gardens (Fig. 1a). In Year Two there was no interaction effect (X2 = 0.109, P = 0.742), with honey bees have significantly broader niche breadths than native bees across habitats (Fig. 1b).
Niche breadth did not vary significantly by taxa in Year One (X2 = 20.6, P = 0.057) (Fig. 2a), whereas niche breath varied significantly by bee taxa in Year Two (X2 = 56.3, P < 0.0001) (Fig. 2b). In the second year pairwise differences were significant between Amegilla–Lipotriches (P = 0.007) and Amegilla–Homalictus (P < 0.001), Homalictus–Exoneura (P = 0.003), Homalictus–Lasioglossum (P = 0.003), Homalictus–Hylaeinae (P = 0.030) and Homalictus–Megachile (P = 0.002) (Appendix 2).
In the first year of surveys, native bee niche breadth was significantly positively correlated with honey bee abundance (estimate = 0.261, s.e. = 0.061, z-value = 4.25, P < 0.001, R2 = 0.357). In the second year, however, niche breadth was unrelated to honey bee abundance (estimate = −0.006, s.e. = 0.048, z-value = −0.121, P = 0.905, R2 < 0.001).
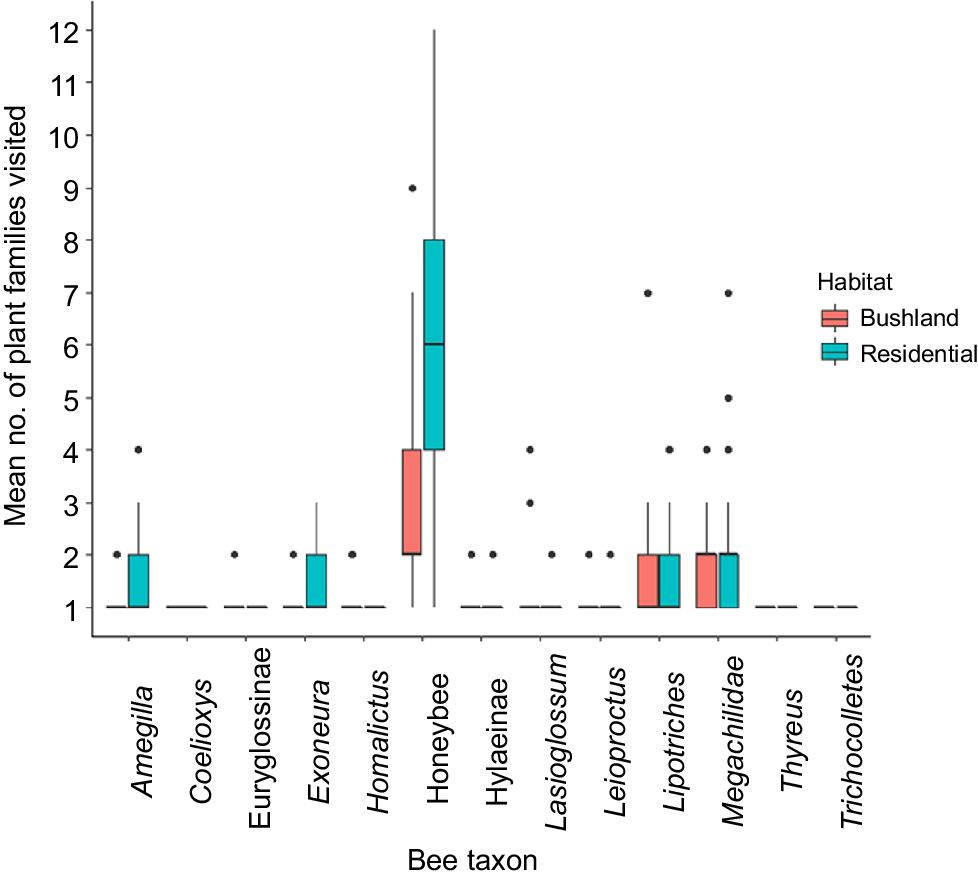
The number of plant families visited by bees ranged from one to a maximum of 12 per taxon per survey. There was a significant main effect of habitat (X2 = 53.7, P < 0.0001), bee taxon (X2 = 503, P < 0.0001), and a significant interaction between habitat × bee taxon (X2 = 41.0, P < 0.0001) (Fig. 3). There was no interaction with year (X2 = 0.002, P = 0.982). There were fewer plant species visited in bushland remnants (1.6 ± 0.06) than residential gardens (2.4 ± 0.14). The average number of families visited per survey was greater for honey bees than all other native bee taxa (P < 0.001). Megachilidae also visited a greater number of families on average compared with Euryglossinae (P = 0.02) and Hylaeinae (P = 0.02). No other pairwise comparisons between the native bee taxa were significantly different (P > 0.05). Whilst there were clear differences by habitat for honey bees, Amegilla, and Exoneura, these were not apparent for the other native bee taxa (Fig. 3). Indeed as a whole, native bees did not differ in the number of families visited between bushland remnants and residential gardens (X2 = 0.39, P = 0.530), whereas honey bees visited more plant families in residential gardens (X2 = 13.9, P = 0.0002).
Discussion
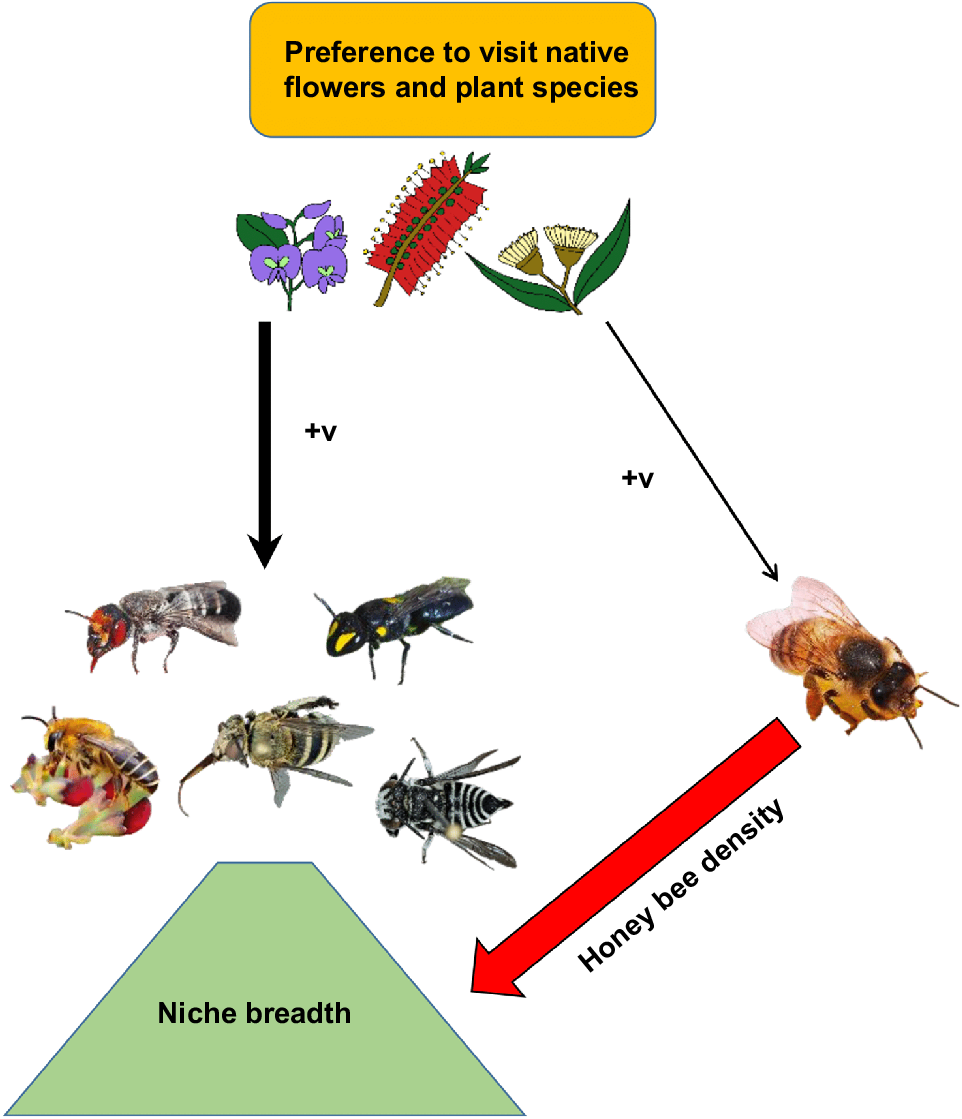
Native bees, in abundance and diversity, are more strongly associated with the relative availability of native plant species than honey bees. Community composition was important in influencing native bee abundance and species richness, but not honey bee abundance. In line with predictions, native bees visited more native flowers than exotic flowers. Whereas, contrary to predictions, the introduced European honey bee also followed this pattern, native bees were more strongly associated with native flowers. Native bees also appeared to be impacted by honey bee competition, as reflected by altering niche breadth (Fig. 4). Thus native bees had stronger preferences for native flora than honey bees, whilst honey bees foraged at greater abundances, and on a broader range, of exotic flora than did native bees.
Schematic of main findings of the preference for native flowers by both native bees and European honey bees (Apis mellifera), as a subset of total available flora, and the influence of A. mellifera on native bee niche breadth. Arrows connect variables, with +v meaning a positive association. Photographs and illustrations by K. S. Prendergast.
These results add to the growing body of evidence that native plants are preferred over exotic plants, and native plants are especially important for native bees (Pawelek et al. 2009; Rollin et al. 2013). The preference for visiting native flowers in this study can be explained by how the native bee fauna of Australia have co-evolved with the flora for millions of years in isolation (Hopper 2009). An urban pollinator study on the east coast of Australia likewise emphasised the importance of native vegetation, as opposed to a high diversity of flowering plants (Threlfall et al. 2015). Other studies that have failed to support the idea that non-native flowers are relatively unattractive to bees relative to native flowers tend to be from regions where there has been the opportunity for dispersal and interchange of biota e.g. Europe and the USA (Cane 2005; MacIvor et al. 2014, Salisbury et al. 2015; Lowenstein et al. 2019). It may be that biogeographic history of a region and the degree of co-evolution of the bees and flowering plant species will influence the relative attractiveness of introduced flora. This has been suggested by the theory that conservation of biodiversity requires different approaches between old, climatically-buffered, infertile landscapes (OCBILs), such as that in south-west Western Australia, compared with young, often disturbed, fertile landscapes (YODFELs), located mainly in the Northern Hemisphere, and from which most conventional ecological theory and practice is derived (Hopper 2009). As such, my results suggest that the biogeographic system is important when devising strategies for pollinator conservation, and ecosystems that have evolved in relative geological isolation, including Australia, as well as New Zealand, South Africa’s Western Cape and Madagascar, may need different considerations from strategies developed for pollinators in the northern Hemisphere. It is worth noting that there is a major research bias towards bee conservation in the global north, with the global south being substantially under-represented (see for example, Prendergast et al. 2022a on urban bee research). Supported by the OCBIL theory of the influence biogeographic history of a landscape has on its biota (Hopper 2009), the dominance of research of pollinator preference in the norther hemisphere may not be generalisable on a global scale, pointing to greater research attention needed in these under-represented regions. In the context of native bee conservation in urbanised Australia, unlike in the Northern Hemisphere, many native flowering plant species are not herbs but rather trees or shrubs – which tend to be coniferous in the Northern Hemisphere rather than mass-blooming like the Australian eucalypts (Armstrong 1979). In addition, Australia has been biogeographically isolated from other continents, allowing a long period of co-evolution with minimal disruptions from glaciation events in old, climatically-buffered infertile landscapes (Hopper et al. 2021). This therefore creates present ecological interactions that have a different evolutionary history from plant–pollinator networks in the Northern Hemisphere.
Although the hypothesis of a preference for native flowers by native bees was supported, the prediction that honey bees, in contrast, would prefer exotic flowers was not. The highly polylectic behaviour of honey bees means they are less constrained to foraging on species from their region of origin. In addition, as with native bees, honey bees foraged prolifically on Myrtaceae – six (Year Two) and eight (Year One) of the 10 most-visited plants being from this family. This preference for native flowers, driven by Myrtaceae, can be linked to how most Myrtaceae – the dominant native plant family in Australia – have highly-accessible open-cup flowers, they flower prolifically, and produce high quantities of nectar and pollen, and furthermore the main visited species here provide high-quality resources with high antibacterial properties, and a high protein content, with beneficial impacts on bee health (Coleman 1962; Frias et al. 2016; Manning 2011).
The clear preference of both native bees and honey bees for foraging on native flora was further supported when looking at the 10 most-visited species, which comprised over 70% of visits. These 10 most-visited flower species provide clear guidance for citizens and policymakers, as just by planting these 10 species, the majority of native bees and honey bees can be supported. These top 10 flowers for native bees were from the two most common plant families, indicating the co-evolution between dominant plants in Australia’s ecosystems and their insect visitors. Some overlap in the most preferred flora between honey bees and native bees suggests competition may occur over these resources, especially if honey bees are allowed to increase in abundance (Prendergast et al. 2022a). This is not to suggest that other flora should be excluded from consideration in plantings, and planting designs should also include hosts of known specialists in the region. As the most-visited species by honey bees in the second year – Schinus terebinthifolius – is an environmental introduced weed that is dioecious and insect-pollinated (Hussey et al. 1997; Cuda et al. 2004), this is cause for concern. These two introduced species may be favouring each other’s success, as has been found for other invasive weeds and A. mellifera in Australia (Goulson and Derwent 2004).
Identifying the top-10 most-visited plants is valuable from a management perspective (Hegland et al. 2010). Given that 70% of visits were to 10 highly attractive flora, this allows gardeners, land managers and urban planners in the region a guide for restoration, urban greening and gardening, since the majority of bees can be catered for with this selection. Further research is required if the aim is to protect a particular species of interest; however, with systematic bee biodiversity surveys only recently being conducted (Prendergast 2020a, 2020c, 2021a, 2021b, 2021c, 2022a), many species remaining undescribed (see the recent new species description of the oligolectic Leioproctus zephyr (Prendergast 2022c), and only six species having been formally assessed for legislative protection (Department of Biodiversity Conservation and Attractions 2022), these top-10 flowers provide a heuristic (Rollings and Goulson 2019).
It would be of interest to evaluate which plant traits were associated with particularly attractive plant species (and conversely, unattractive plant species). Due to the hundreds of plant species present, and lack of funding available to measure many plant traits, this was not possible. Potential variables include flower shape (Mačukanović-Jocić et al. 2011), petal colour (de Camargo et al. 2019), flower colour and pattern (de Ibarra et al. 2015; Dyer et al. 2015), nectar volume and sugar concentration and composition (Nicolson 2022), pollen nutritional composition (Nicholls and Hempel de Ibarra 2017), floral scent (Dötterl and Vereecken 2010), and secondary plant metabolites in nectar or pollen (Stevenson 2020).
Previous research in this study system found that native bee abundance and species richness were positively related to the proportion of native flora at a site, yet – unexpectedly – negatively associated with native flower species richness (Prendergast et al. 2022b). It was hypothesised this was a result of the restrictive foraging preferences of native bees in the south-west Australian biodiversity hotspot (Prendergast et al. 2022b). This explanation is supported by the current results where overall, number of flowering plant species visited were fairly low relative to the total number of plant species available at a site (Prendergast 2020b), and reflected in the calculations of niche breadth, which explicitly considers the resources used in relation the total resources present. Many flowering plants present were not visited, even those that had a high relative abundance of flowers (Prendergast 2020b), indicating that general calls to ‘plant more flowers’ for bees may be misguided if flower identity is not taken into account. Instead, what is required are particular preferred plant species at high relative abundances, indicated by the consistent positive association between proportion of native flora and native bee abundances (Prendergast 2020b).
Foraging patterns differed between the residential garden habitats and the native vegetation remnant habitats, indicating that environmental context is influential. No previous studies have compared flower preferences of native bees based on whether they are foraging in urban remnant native vegetation patches or in gardens within a city. However, there is evidence that landscape context influences foraging behaviour in other landscapes. For example, floral plantings have been found to attract bumblebees to a greater extent in landscapes that have greater proportions of intensively farmed areas (Carvell et al. 2011). In an urban corridor, greater habitat heterogeneity in the surrounding landscapes was associated with bees exhibiting higher foraging specialisation, whereas greater semi-natural habitat was associated with fewer visits to flowering species (Pardee et al. 2023). Research has also found that varying levels of urbanisation and presumably stressors associated with urbanisation intensity can modulate the attractiveness of native vs exotic plant species (Buchholz and Kowarik 2019).
The hypothesis that honey bees had a wider niche breadth than native bees was partially supported: honey bees had significantly greater niche breadth in the second year of study, and in residential gardens in the first. A wider niche breadth is consistent with honey bees being super-generalists (Giannini et al. 2015). Interannual variation in results may relate to the extra months surveyed in the second year: by extending the period of observations, this included flowering plants whose phenology was not captured in the first year, meaning there were additional resources options to forage on in the second year. The role of the range of resources available in influencing honey bee niche breadth was also evident in how, in the first year, honey bees had wider niche breadths only in residential gardens, which offered a greater range of potential resources that the super-generalist honey bee could exploit compared with bushland remnants. Niche breadth varied considerably within and between native bee taxa, with sometimes counter-intuitive results i.e. the wide niche breadth of euryglossines (oligoleges), and the narrow niche breadth of Amegilla (polyletic) (Houston 2000). Although there are many indexes that have been created, there is no consensus over which one is ‘best’ (Krebs 2009). Whilst the formula used here has advantages in that it takes into account the availability of resources present, it has drawbacks in being sensitive to the number of individuals observed foraging in each taxon, and does not control for phylogeny i.e. euryglossines foraged on a number of species that were in just a few plant families, whereas Amegilla foraged on plant families encompassing a wide taxonomic range (Prendergast 2020b). The impracticality of identifying most native bees to species-level in the field, and the rarity of most species, make statistical calculations of niche breadth of most species impossible; so for this purpose native bees were grouped into taxonomic categories. This does mean that whilst native bees were represented by >1 species, honey bees were represented by a single species. Yet, despite native bee taxonomic groups representing two to tens of species based on reliable identification by observation in the field, their niche breadth was in fact narrower than the single honey bee species in most instances.
Niche breadth also was calculated from total flower visits. When expressed in terms of lecty, this focuses solely on pollen, and thus is largely based on female foragers (Michener 2007). Whilst bees have preferences for nectar (Parachnowitsch et al. 2019), species are often more flexible in their nectar than pollen foraging (Cane and Sipes 2006) – explaining broader niches of kleptoparasitic species that do not need to collect pollen for their brood (Michener 2007). Determining the sex of a bee in the field was not possible for most species (especially not the tiny Euryglossinae and Hylaeinae), nor was distinguishing between pollen vs nectar foraging (again, likely for these small colletids, which comprised a large proportion of all visits). Consequently, to utilise the full dataset, these finer details could not be assessed but should be borne in mind when interpreting these results.
The hypothesis of niche breadth being broader in the residential gardens than native vegetation remnants was not supported; indeed, the opposite occurred. Although a greater range of floral species available in residential gardens could be inferred to allow bees to expand the range of flowers they forage on, my finding of a narrowing of niche breadth in residential gardens relative to bushland remnants can be explained by the fact that many native bee species are restrictive in the flora they visit. Thus, of the flora they actually will forage on, there is a broader suitable range of preferred plant species present at native vegetation sites, contrasting with a narrow range of preferred flora present at residential sites.
The hypothesis that high honey bee abundances would cause native bee taxa to decrease their niche breadth, predicted as a means of avoiding competition, was not supported. Instead, in Year One, the niche breadth of native bees was broader when honey bee abundances were higher. This may arise if native bees under competition with honey bees expand their niche breadth (Fontaine et al. 2008; Pianka 2011). If native bees forage on a wider range of resources, especially those not utilised by honey bees, and focus on resources that are in relatively high abundance, then the intensity of competition is reduced. (This consideration is accounted for in Smith’s measure of niche breadth used here). If native bees are excluded from preferred flowers and must switch to and forage on a greater range of potentially less suitable flowering resources, this may have fitness consequences (Pyke 1984). There is also the possibility that under higher honey bee abundances, specialised native bees were outcompeted, leaving a community of largely generalist species.
It is of interest to compare niche breadth, in terms of an ecological index of niche breadth, with niche breadth expressed simply in terms of how many plant families were visited. Smith’s index considers both the relative visits to different plant species, irrespective of phylogeny, and their relative availability in the environment. The advantages of Smith’s measure is that it means that the number of visits take into account how much of a particular resource is present, but ignore taxonomic identity. When looking at the number of families visited, results were in line with predictions of the super-generalist honey bee visiting more families than native bee taxa, especially in residential gardens, whereas the oligolectic Hylaeinae and Euryglossinae visited very few families. The flexibility of polylectic taxa such as the honey bee, Megachilidae, Amegilla, and Exoneura, also enabled them to expand their niche breadth in residential gardens, whereas more specialised taxa did not change their niche breadths according to habitat type. The two indexes thus provide a complementary picture of foraging specialisation, depending on whether the focus is on relative resource specialisation vs taxonomic specialisation.
Some hypotheses were supported during one year, but not the other. Interannual variation in ecological interactions is not unusual (e.g. Roubik et al. 1986; Prendergast et al. 2023; Prendergast and Ollerton 2022). These findings indicate that niche breadth and competitive pressure were not invariant across time. Long-term monitoring is required to determine how consistently the patterns observed here arise, and tease apart potential causes such as climatic influences (e.g. Thomson 2016). The finding of native bees increasing their niche breadth under increasing honey bee densities in the first but not second year may relate to how in the second year, October was included – a month where many flowering plants are blooming (Lambers 2014), permitting native bee species to forage on other resources when honey bee abundances were high as a mechanism to enable co-existence under resource competition (Heinrich 1976). Although I found that native bees may expand their niche breadth when honey bee abundances are higher, at least under certain conditions, further research is required to verify this experimentally, and determine if this has fitness consequences (Prendergast et al. 2023).
The data here revealed that community composition strongly influences the native bee assemblage, and thus the identity of which plants occur in urban greenspaces will be important in aiding, or conversely, threatening, the preservation of thriving native bee assemblages. The list of 10 most-visited plants can guide the public and land managers in how to create flowering resources for bees in this region. Obtaining region-specific empirical data for other urban regions would be advisable, so that they likewise have an evidence-based guide for selecting flowers that will maximise bees.
That specific floral resource composition is a strong determinant of native bee abundance and diversity has implications for the potential for competition with honey bees. A study in the present region found that greater overall flower diversity led to increased competitive effects of honey bees on native bees (Prendergast et al. 2021), and a study investigating the potential for honey bee competition to impact upon bumblebee abundance found that the abundance of specific floral resources within habitats was the most important factor limiting bumblebees, and co-existence was permitted due to forage resource partitioning (Franklin et al. 2018). Taken together, these findings suggest that rather than increase overall flower abundance or species richness, to mitigate competition from honey bees, what is required is increasing the availability of flowering species preferred by native bees.
Conclusion
Our study demonstrates that flowers that are native in origin, are important for supporting native bees in urban areas. Despite the high availability and diversity of flowering plant resources, native bees, and even honey bees, foraged on only a small subset. Under honey bee competition, native bees may be forced to expand their dietary breadths to forage on non-preferred resources, potential causing negative impacts on fitness. This study provides key empirical information to guide management of native bees in urban areas.
Acknowledgements
I would like to acknowledge the financial support of the Forrest Research Foundation and The Australian Wildlife Society and Hesperia, and BeeDay Australia support to depositing the native bee specimens in the Western Australian Museum Entomology Collection. Thank you to the home owners for permitting me to survey their gardens. I would also like to thank Dr Leanda Mason for feedback on earlier drafts of the manuscript, and to thank the editor and anonymous reviewers for the constructive feedback to improve it.
References
Abe T, Wada K, Kato Y, Makino S, Okochi I (2011) Alien pollinator promotes invasive mutualism in an insular pollination system. Biological Invasions 13, 957-967.
| Crossref | Google Scholar |
ANPSA (2020) Australian Native Plants Society (Australia). Available at http://anpsa.org.au/ [accessed 1 August 2022]
Armstrong JA (1979) Biotic pollination mechanisms in the Australian flora – a review. New Zealand Journal of Botany 17, 467-508.
| Crossref | Google Scholar |
Batley M, Hogendoorn K (2009) Diversity and conservation status of native Australian bees. Apidologie 40(3), 347-354.
| Crossref | Google Scholar |
Brooks ME, Kristensen K, van Benthem KJ, Magnusson A, Berg CW, Nielsen A, Skaug HJ, Mächler M, Bolker BM (2017) Glmmtmb balances speed and flexibility among packages for zero-inflated generalized linear mixed modeling. The R journal 9, 378-400.
| Crossref | Google Scholar |
Brown MJF, Paxton RJ (2009) The conservation of bees: a global perspective. Apidologie 40, 410-416.
| Crossref | Google Scholar |
Buchholz S, Kowarik I (2019) Urbanisation modulates plant-pollinator interactions in invasive vs. native plant species. Scientific Reports 9, 6375.
| Crossref | Google Scholar |
Carvell C, Osborne JL, Bourke AFG, Freeman SN, Pywell RF, Heard M (2011) Bumble bee species’ responses to a targeted conservation measure depend on landscape context and habitat quality. Ecological Applications 21, 1760-1771.
| Crossref | Google Scholar |
Coleman RS (1962) Bee farming: Honey flora of western australia. Journal of the Department of Agriculture, Western Australia, Series 4 3, 649-664.
| Google Scholar |
Comba L, Corbet SA, Barron A, Bird A, Collinge S, Miyazaki N, Powell M (1999) Garden flowers: Insect visits and the floral reward of horticulturally-modified variants. Annals of Botany 83, 73-86.
| Crossref | Google Scholar |
Corbet SA, Bee J, Dasmahapatra K, Gale S, Gorringe E, La Ferla B, Moorhouse T, Trevail A, Van Bergen Y, Vorontsova M (2001) Native or exotic? Double or single? Evaluating plants for pollinator-friendly gardens. Annals of Botany 87, 219-232.
| Crossref | Google Scholar |
Cuda JP, Habeck DH, Hight SD, Medal JC, Pedrosa-Macedo JH (2004) Brazilian Peppertree, Schinus terebinthfolius: Sumac Family-Anacardiaceae. In ‘Biological Control of Invasive Plants in the United States’. (Eds EM Combs, JK Clark, GL Piper, AF Cofrancesco Jr), pp. 439–441. (Oregon State University Press: Corvallis, OR, USA)
de Camargo MGG, Lunau K, Batalha MA, Brings S, de Brito VLG, Morellato LPC (2019) How flower colour signals allure bees and hummingbirds: a community-level test of the bee avoidance hypothesis. New Phytologist 222, 1112-1122.
| Crossref | Google Scholar |
de Ibarra NH, Langridge KV, Vorobyev M (2015) More than colour attraction: behavioural functions of flower patterns. Current Opinion in Insect Science 12, 64-70.
| Crossref | Google Scholar |
Decourtye A, Mader E, Desneux N (2010) Landscape enhancement of floral resources for honey bees in agro-ecosystems. Apidologie 41(3), 264-277.
| Crossref | Google Scholar |
Department of Biodiversity Conservation and Attractions (2022) Threatened and Priority Fauna List. Threatened animals. Available at https://www.dpaw.wa.gov.au/plants-and-animals/threatened-species-and-communities/threatened-animals
Detzel A, Wink M (1993) Attraction, deterrence or intoxication of bees (Apis mellifera) by plant allelochemicals. Chemoecology 4, 8-18.
| Crossref | Google Scholar |
Dormann CF, Elith J, Bacher S, Buchmann C, Carl G, Carré G, Marquéz JRG, Gruber B, Lafourcade B, Leitão PJ, Münkemüller T, McClean C, Osborne PE, Reineking B, Schröder B, Skidmore AK, Zurell D, Lautenbach S (2013) Collinearity: a review of methods to deal with it and a simulation study evaluating their performance. Ecography 36, 27-46.
| Crossref | Google Scholar |
Drossart M, Michez D, Vanderplanck M (2017) Invasive plants as potential food resource for native pollinators: a case study with two invasive species and a generalist bumble bee. Scientific Reports 7, 16242.
| Crossref | Google Scholar |
Dyer AG, Garcia JE, Shrestha M, Lunau K (2015) Seeing in colour: a hundred years of studies on bee vision since the work of the Nobel laureate Karl von Frisch. Proceedings of the Royal Society of Victoria 127, 66-72.
| Crossref | Google Scholar |
Dötterl S, Vereecken NJ (2010) The chemical ecology and evolution of bee–flower interactions: a review and perspectives. Canadian Journal of Zoology 88, 668-697.
| Crossref | Google Scholar |
Eckhardt M, Haider M, Dorn S, Müller A (2014) Pollen mixing in pollen generalist solitary bees: a possible strategy to complement or mitigate unfavourable pollen properties? Journal of Animal Ecology 83, 588-597.
| Crossref | Google Scholar |
Egerer M, Cecala JM, Cohen H (2020) Wild bee conservation within urban gardens and nurseries: effects of local and landscape management. Sustainability 12, 293.
| Crossref | Google Scholar |
Fontaine C, Collin CL, Dajoz I (2008) Generalist foraging of pollinators: diet expansion at high density. Journal of Ecology 96, 1002-1010.
| Crossref | Google Scholar |
Frankie GW, Thorp RW, Schindler M, Hernandez J, Ertter B, Rizzardi M (2005) Ecological patterns of bees and their host ornamental flowers in two northern california cities. Journal of the Kansas Entomological Society 78, 227-246.
| Crossref | Google Scholar |
Franklin E, Carroll T, Blake D, Rickard K, Diaz A (2018) Bumble bee forager abundance on lowland heaths is predicated by specific floral availability rather than the presence of honey bee foragers: evidence for forage resource partitioning. Journal of Pollination Ecology 24, 172-179.
| Crossref | Google Scholar |
Frias BED, Barbosa CD, Lourenço AP (2016) Pollen nutrition in honey bees (Apis mellifera): Impact on adult health. Apidologie 47, 15-25.
| Crossref | Google Scholar |
Garbuzov M, Alton K, Ratnieks FLW (2017) Most ornamental plants on sale in garden centres are unattractive to flower-visiting insects. PeerJ 5, e3066.
| Crossref | Google Scholar |
Giannini TC, Garibaldi LA, Acosta AL, Silva JS, Maia KP, Saraiva AM, Guimarães PR, Jr, Kleinert AM (2015) Native and non-native supergeneralist bee species have different effects on plant-bee networks. PLoS ONE 10, e0137198.
| Crossref | Google Scholar |
Goulson D, Derwent LC (2004) Synergistic interactions between an exotic honeybee and an exotic weed: pollination of Lantana camara in australia. Weed Research 44, 195-202.
| Crossref | Google Scholar |
Government of Western Australia (2019) 2018 Statewide Vegetation Statistics incorporating the CAR Reserve Analysis (Simplified Report). Current as of March 2019. WA Department of Biodiversity, Conservation and Attractions, Perth. Available at https://catalogue.data.wa.gov.au/dataset/dbca-statewide-vegetation-statistics [Accessed 10 November 2019]
Güneralp B, McDonald RI, Fragkias M, Goodness J, Marcotullio PJ, Seto KC (2013) Urbanization forecasts, effects on land use, biodiversity, and ecosystem services. In ‘Urbanization, biodiversity and ecosystem services: challenges and opportunities’. (Eds T Elmqvist, M Fragkias, J Goodness, B Guneralp, PJ Marcotullio, RI McDonald, S Parnell, M Schewenius, M Sendstad, KC Seto, C Wilkinson) pp. 437–452. (Springer)
Harrison XA (2014) Using observation-level random effects to model overdispersion in count data in ecology and evolution. PeerJ 2, e616.
| Crossref | Google Scholar |
Hegland SJ, Dunne J, Nielsen A, Memmott J (2010) How to monitor ecological communities cost-efficiently: The example of plant–pollinator networks. Biological Conservation 143, 2092-2101.
| Crossref | Google Scholar |
Heinrich B (1976) Resource partitioning among some eusocial insects: bumblebees. Ecology 57, 874-889.
| Crossref | Google Scholar |
Hopper SD (2009) OCBIL theory: towards an integrated understanding of the evolution, ecology and conservation of biodiversity on old, climatically buffered, infertile landscapes. Plant and Soil 322, 49-86.
| Crossref | Google Scholar |
Hopper SD, Lambers H, Silveira FAO, Fiedler PL (2021) OCBIL theory examined: reassessing evolution, ecology and conservation in the world’s ancient, climatically buffered and infertile landscapes. Biological Journal of the Linnean Society 133, 266-296.
| Crossref | Google Scholar |
Hoyle HE (2021) Climate-adapted, traditional or cottage-garden planting? Public perceptions, values and socio-cultural drivers in a designed garden setting. Urban Forestry & Urban Greening 65, 127362.
| Crossref | Google Scholar |
Hudewenz A, Klein A-M (2015) Red mason bees cannot compete with honey bees for floral resources in a cage experiment. Ecology and Evolution 5, 5049-5056.
| Crossref | Google Scholar |
Hülsmann M, von Wehrden H, Klein A-M, Leonhardt SD (2015) Plant diversity and composition compensate for negative effects of urbanization on foraging bumble bees. Apidologie 46, 760-770.
| Crossref | Google Scholar |
Jeannerod L, Carlier A, Schatz B, Daise C, Richel A, Agnan Y, Baude M, Jacquemart A-L (2022) Some bee-pollinated plants provide nutritionally incomplete pollen amino acid resources to their pollinators. PLoS ONE 17, e0269992.
| Crossref | Google Scholar |
Lenth R (2022) emmeans: Estimated Marginal Means, aka Least-Squares Means. R package version 1.7.5. Available at https://CRAN.R-project.org/package=emmeans.
Lüdecke D (2019) Sjstats: Statistical functions for regression models (version 0.17.7). Available at https://CRAN.R-project.org/package=sjstats
Matteson KC, Langellotto GA (2011) Small scale additions of native plants fail to increase beneficial insect richness in urban gardens. Insect Conservation and Diversity 4, 89-98.
| Crossref | Google Scholar |
Mačukanović-Jocić M, Stevanović ZD, Mladenović M, Jocić G (2011) Flower morphophysiology of selected Lamiaceae species in relation to pollinator attraction. Journal of Apicultural Research 50, 89-101.
| Crossref | Google Scholar |
McKinney ML (2008) Effects of urbanization on species richness: a review of plants and animals. Urban Ecosystems 11, 161-176.
| Crossref | Google Scholar |
Miller AE, Brosi BJ, Magnacca K, Daily GC, Pejchar L (2015) Pollen carried by native and nonnative bees in the large-scale reforestation of pastureland in Hawai‘i: implications for pollination. Pacific Science 69, 67-79.
| Crossref | Google Scholar |
Montero-Castaño A, Vilà M (2017) Influence of the honeybee and trait similarity on the effect of a non-native plant on pollination and network rewiring. Functional Ecology 31, 142-152.
| Crossref | Google Scholar |
Nakagawa S, Schielzeth H (2013) A general and simple method for obtaining R2 from generalized linear mixed-effects models. Methods in Ecology and Evolution 4, 133-142.
| Crossref | Google Scholar |
Nicholls E, Hempel de Ibarra N (2017) Assessment of pollen rewards by foraging bees. Functional Ecology 31, 76-87.
| Crossref | Google Scholar |
Nicolson SW (2022) Sweet solutions: nectar chemistry and quality. Philosophical Transactions of the Royal Society B: Biological Sciences 377, 20210163.
| Crossref | Google Scholar |
Parachnowitsch AL, Manson JS, Sletvold N (2019) Evolutionary ecology of nectar. Annals of Botany 123, 247-261.
| Crossref | Google Scholar |
Pardee GL, Ballare KM, Neff JL, Do LQ, Ojeda D, Bienenstock EJ, Brosi BJ, Grubesic TH, Miller JA, Tong D, Jha S (2023) Local and landscape factors influence plant-pollinator networks and bee foraging behavior across an urban corridor. Land 12, 362.
| Crossref | Google Scholar |
Pawelek J, Frankie GW, Thorp RW, Przybylski M (2009) Modification of a community garden to attract native bee pollinators in urban San Luis Obispo, California. Cities and the Environment (CATE) 2, 7.
| Google Scholar |
Petanidou T, Kallimanis AS, Tzanopoulos J, Sgardelis SP, Pantis JD (2008) Long-term observation of a pollination network: fluctuation in species and interactions, relative invariance of network structure and implications for estimates of specialization. Ecology Letters 11, 564-575.
| Crossref | Google Scholar |
Potts SG, Vulliamy B, Dafni A, Ne’eman G, Willmer P (2003) Linking bees and flowers: How do floral communities structure pollinator communities? Ecology 84, 2628-2642.
| Crossref | Google Scholar |
Prendergast KS (2020a) Urban native bee assemblages and the impact of the introduced European honey bee on plant-pollinator networks in the southwest Australian biodiversity hotspot. PhD thesis, Curtin University of Technology. Available at https://espace.curtin.edu.au/handle/20.500.11937/84947
Prendergast K (2020b) Plant-pollinator network interaction matrices and flowering plant species composition in urban bushland remnants and residential gardens in the southwest Western Australian biodiversity hotspot. Curtin University. Available at https://doi.org/10.25917/5f3a0aa235fda
Prendergast K (2020d) Species of native bees in the urbanised region of the southwest Western Australian biodiversity hotspot. Curtin University. Available at https://doi.org/10.25917/5ee09df795b7c
Prendergast KS (2022a) The influence of plant species, origin and color of garden nursery flowers on the number and composition of pollinating insect visitors. Journal of Agricultural and Urban Entomology 38, 21-40.
| Crossref | Google Scholar |
Prendergast KS (2022c) Leioproctus zephyr Prendergast (Hymenoptera, Colletidae, Leioproctus), an oligoletic new bee species with a distinctive clypeus. Journal of Hymenoptera Research 93, 167-188.
| Crossref | Google Scholar |
Prendergast KS, Ollerton J (2021) Plant-pollinator networks in Australian urban bushland remnants are not structurally equivalent to those in residential gardens. Urban Ecosystems 24, 973-987.
| Crossref | Google Scholar |
Prendergast KS, Ollerton J (2022) Spatial and temporal scale of analysis alter conclusions about the effects of urbanisation on plant–pollinator networks. Arthropod-Plant Interactions 16, 553-565.
| Crossref | Google Scholar |
Prendergast KS, Dixon KW, Bateman PW (2021) Interactions between the introduced european honey bee and native bees in urban areas varies by year, habitat type and native bee guild. Biological Journal of the Linnean Society 133, 725-743.
| Crossref | Google Scholar |
Prendergast KS, Dixon KW, Bateman PW (2022a) A global review of determinants of native bee assemblages in urbanised landscapes. Insect Conservation and Diversity 15, 385-405.
| Crossref | Google Scholar |
Prendergast KS, Tomlinson S, Dixon KW, Bateman PW, Menz MHM (2022b) Urban native vegetation remnants support more diverse native bee communities than residential gardens in Australia’s southwest biodiversity hotspot. Biological Conservation 265, 109408.
| Crossref | Google Scholar |
Prendergast KS, Dixon KW, Bateman PW (2023) The evidence for and against competition between the European honey bee and Australian native bees. Pacific Conservation Biology 29, 89-109.
| Crossref | Google Scholar |
Pyke GH (1984) Optimal foraging theory: a critical review. Annual Review of Ecology and Systematics 15, 523-575.
| Crossref | Google Scholar |
Richardson DM, Allsopp N, D’antonio CM, Milton SJ, Rejmanek M (2000) Plant invasions—the role of mutualisms. Biological Reviews of the Cambridge Philosophical Society 75, 65-93.
| Crossref | Google Scholar |
Rollin O, Bretagnolle V, Decourtye A, Aptel J, Michel N, Vaissière BE, Henry M (2013) Differences of floral resource use between honey bees and wild bees in an intensive farming system. Agriculture, Ecosystems & Environment 179, 78-86.
| Crossref | Google Scholar |
Rollings R, Goulson D (2019) Quantifying the attractiveness of garden flowers for pollinators. Journal of Insect Conservation 23, 803-817.
| Crossref | Google Scholar |
Roubik DW, Moreno JE, Vergara C, Wittmann D (1986) Sporadic food competition with the African honey bee: projected impact on neotropical social bees. Journal of Tropical Ecology 2(2), 97-111.
| Crossref | Google Scholar |
Salisbury A, Armitage J, Bostock H, Perry J, Tatchell M, Thompson K (2015) Editor’s choice: enhancing gardens as habitats for flower-visiting aerial insects (pollinators): should I plant native or exotic species? Journal of Applied Ecology 52, 1156-1164.
| Crossref | Google Scholar |
Schafer J, Opgen-Rhein R, Zuber V, Ahdesmaki M, Silva APB, Strimmer K. (2017) corpcor: Efficient Estimation of Covariance and (Partial) Correlation. R package version 1.6.9. Available at https://CRAN.R-project.org/package=corpcor
Sedivy C, Müller A, Dorn S (2011) Closely related pollen generalist bees differ in their ability to develop on the same pollen diet: evidence for physiological adaptations to digest pollen. Functional Ecology 25, 718-725.
| Crossref | Google Scholar |
Smith EP (1982) Niche breadth, resource availability, and inference. Ecology 63, 1675-1681.
| Crossref | Google Scholar |
Stenhouse RN (2004) Fragmentation and internal disturbance of native vegetation reserves in the Perth metropolitan area, Western Australia. Landscape and Urban Planning 68, 389-401.
| Crossref | Google Scholar |
Stevenson PC (2020) For antagonists and mutualists: the paradox of insect toxic secondary metabolites in nectar and pollen. Phytochemistry Reviews 19, 603-614.
| Crossref | Google Scholar |
Sydenham MAK, Moe SR, Totland Ø, Eldegard K (2015) Does multi-level environmental filtering determine the functional and phylogenetic composition of wild bee species assemblages? Ecography 38, 140-153.
| Crossref | Google Scholar |
Thomson DM (2016) Local bumble bee decline linked to recovery of honey bees, drought effects on floral resources. Ecology Letters 19, 1247-1255.
| Crossref | Google Scholar |
Threlfall CG, Walker K, Williams NSG, Hahs AK, Mata L, Stork N, Livesley SJ (2015) The conservation value of urban green space habitats for Australian native bee communities. Biological Conservation 187, 240-248.
| Crossref | Google Scholar |
Tiedeken EJ, Stout JC, Stevenson PC, Wright GA (2014) Bumblebees are not deterred by ecologically relevant concentrations of nectar toxins. Journal of Experimental Biology 217, 1620-1625.
| Crossref | Google Scholar |
Turo KJ, Gardiner MM (2019) From potential to practical: conserving bees in urban public green spaces. Frontiers in Ecology and the Environment 17, 167-175.
| Crossref | Google Scholar |
Vanbergen AJ, Espíndola A, Aizen MA (2018) Risks to pollinators and pollination from invasive alien species. Nature Ecology & Evolution 2, 16-25.
| Crossref | Google Scholar |
Vanderplanck M, Moerman R, Rasmont P, Lognay G, Wathelet B, Wattiez R, Michez D (2014) How does pollen chemistry impact development and feeding behaviour of polylectic bees? PLoS ONE 9, e86209.
| Crossref | Google Scholar |
Weiner CN, Hilpert A, Werner M, Linsenmair KE, Blüthgen N (2010) Pollen amino acids and flower specialisation in solitary bees. Apidologie 41, 476-487.
| Crossref | Google Scholar |
Wollaeger HM, Getter KL, Behe BK (2015) Consumer preferences for traditional, neonicotinoid-free, bee-friendly, or biological control pest management practices on floriculture crops. HortScience Horts 50, 721-732.
| Crossref | Google Scholar |
Wood TJ, Holland JM, Goulson D (2015) Pollinator-friendly management does not increase the diversity of farmland bees and wasps. Biological Conservation 187, 120-126.
| Crossref | Google Scholar |
Wood TJ, Holland JM, Goulson D (2017) Providing foraging resources for solitary bees on farmland: current schemes for pollinators benefit a limited suite of species. Journal of Applied Ecology 54, 323-333.
| Crossref | Google Scholar |