

Deriving a population estimate for Eld’s deer (Rucervus eldii siamensis) in Siem Pang Wildlife Sanctuary, Cambodia
Paul Meek A B * , Rachel Ladd A , Jonathan C. Eames C and Luke K.-P. Leung A D
A
B
C
D
Abstract
Eld’s deer (Rucervus eldii) was once widely distributed across Southeast Asia but is now endangered. The strong hold of the subspecies R. e. siamensis is largely restricted to north and east Cambodia, with only small, spatially isolated populations known to occur.
To assess if camera traps and spatial capture–recapture methodology can estimate population size of Eld’s deer in Siem Pang Wildlife Sanctuary (SMWS).
Infra-red and white flash camera traps were set at 83 grid-point locations (83 km2) over a 5-month sampling period and used a Spatially Explicit Capture Recapture (SECR) model to estimate population size, relying on natural markings to identify males and using sex ratios to extrapolate a population estimate.
We estimated the number of Eld’s deer in SMWS to be 272 (95% CI: 169–435). We affirmed that white flash camera traps are advantageous in identifying individuals without significantly affecting detection probability.
Monitoring the small and difficult to detect subpopulations of R. e. siamensis is challenging. Camera traps can be used although there are challenges to resolve when using the SECR model that can be improved by using white flash cameras to improve the identification of individuals, and assisted with sex and age determination.
The SPWS population may potentially be the largest of the R. e. siamensis subspecies in Southeast Asia and it is therefore of critical conservation importance that long term camera trap monitoring is established.
Keywords: camera trapping, conservation practice, monitoring, population estimation, SECR, sub-species, threatened species, white flash.
Introduction
The world is experiencing rapid biodiversity loss, with severe declines in abundance and distribution of many species (Ceballos et al. 2017). Reliable estimates of appropriate population metrics are required to evaluate whether conservation objectives are being met (Nichols and Williams 2006). Abundance and density are among the most commonly used population metrics to guide species conservation efforts (Otis et al. 1978; Seber 1982; Karanth and Nichols 1998; Nichols and Williams 2006).
Small populations can be particularly challenging to monitor, with low densities and potentially elusive behaviour making detection of individual animals difficult (Swann and Perkins 2014). Furthermore, small, threatened populations are also likely to be of particular interest as key targets for active conservation management (Rising Phoenix 2022). On top of the deterministic threats such as habitat loss and over-exploitation, small and isolated populations are at increased risk of extirpation due to environmental, demographic and genetic stochasticity (Shaffer 1981; Lande 1993; O’Grady et al. 2006).
Eld’s deer (Rucervus eldii) were once common throughout Southeast Asia, but it is now endangered, with a dramatically reduced distribution and population size (Gray et al. 2015; Ladd et al. 2022). The majority of the wild population is believed to reside in Myanmar and Cambodia. However, population demographics for this species in Cambodia is limited, with the country-wide population estimated to be less than 700 individuals (Gray et al. 2015), and as low as 400 individuals (Ladd et al. 2022). In Cambodia, Eld’s deer are located in the north and east, with a small number of scattered populations within the system of protected areas (Ladd et al. 2022).
The use of distance sampling to monitor ungulates in eastern Cambodia have been hampered by very few sightings, making it impossible to estimate Eld’s deer density or assess population trends (Griffin and Nuttall 2020; Groenenberg et al. 2020). Monitoring of this species at other known sites have been inadequate to produce any population estimates (Ladd et al. 2022). Clearly, robust estimates of the Eld’s deer population in Cambodia is critically required to inform current conservation management. Camera trapping and the use of capture recapture modelling is potentially useful for monitoring this low-density and difficult to detect species, given other methods dependent on direct sightings have not succeeded (Ladd et al. 2022). Camera trapping has almost exclusively replaced other methods of surveillance for detection efficacy and cost and time benefits (O’Connell et al. 2011; Meek et al. 2014, 2015a; Rovero and Zimmerman 2016).
Capture recapture methods are one of the most common techniques for estimating animal populations (Caughley 1977; Zimmerman and Foresti 2016). Advances in technology, such as camera traps and various DNA sampling methods, have enabled an expansion of this method to taxa that had previously been extremely difficult, if not impossible to study with this method (Royle et al. 2013). Capture recapture methods for abundance estimation are designed to account for imperfect detection (Otis et al. 1978; Williams et al. 2002). Recent advances have enabled the incorporation of spatial information in these methods. The development of spatially explicit capture recapture methods makes the processes of density, spatial organisation, movement, and space use explicit in the model to yield more robust demographic estimates (Efford 2004; Borchers 2012).
Siem Pang Wildlife Sanctuary (SPWS) is thought to have one of the largest populations of Eld’s deer in Cambodia and is therefore a critical site for the conservation of this species. Monitoring methods used at this site were not scientifically robust to estimate population size (Ladd et al. 2022) prior to the present study. This study aims to provide the first population estimate of Eld’s deer in SPWS based on a spatially explicit capture recapture (SECR) analysis of camera trap data. This knowledge will be useful in developing strategies for future monitoring and conservation of this species at SPWS and other sites.
Materials and methods
Study site
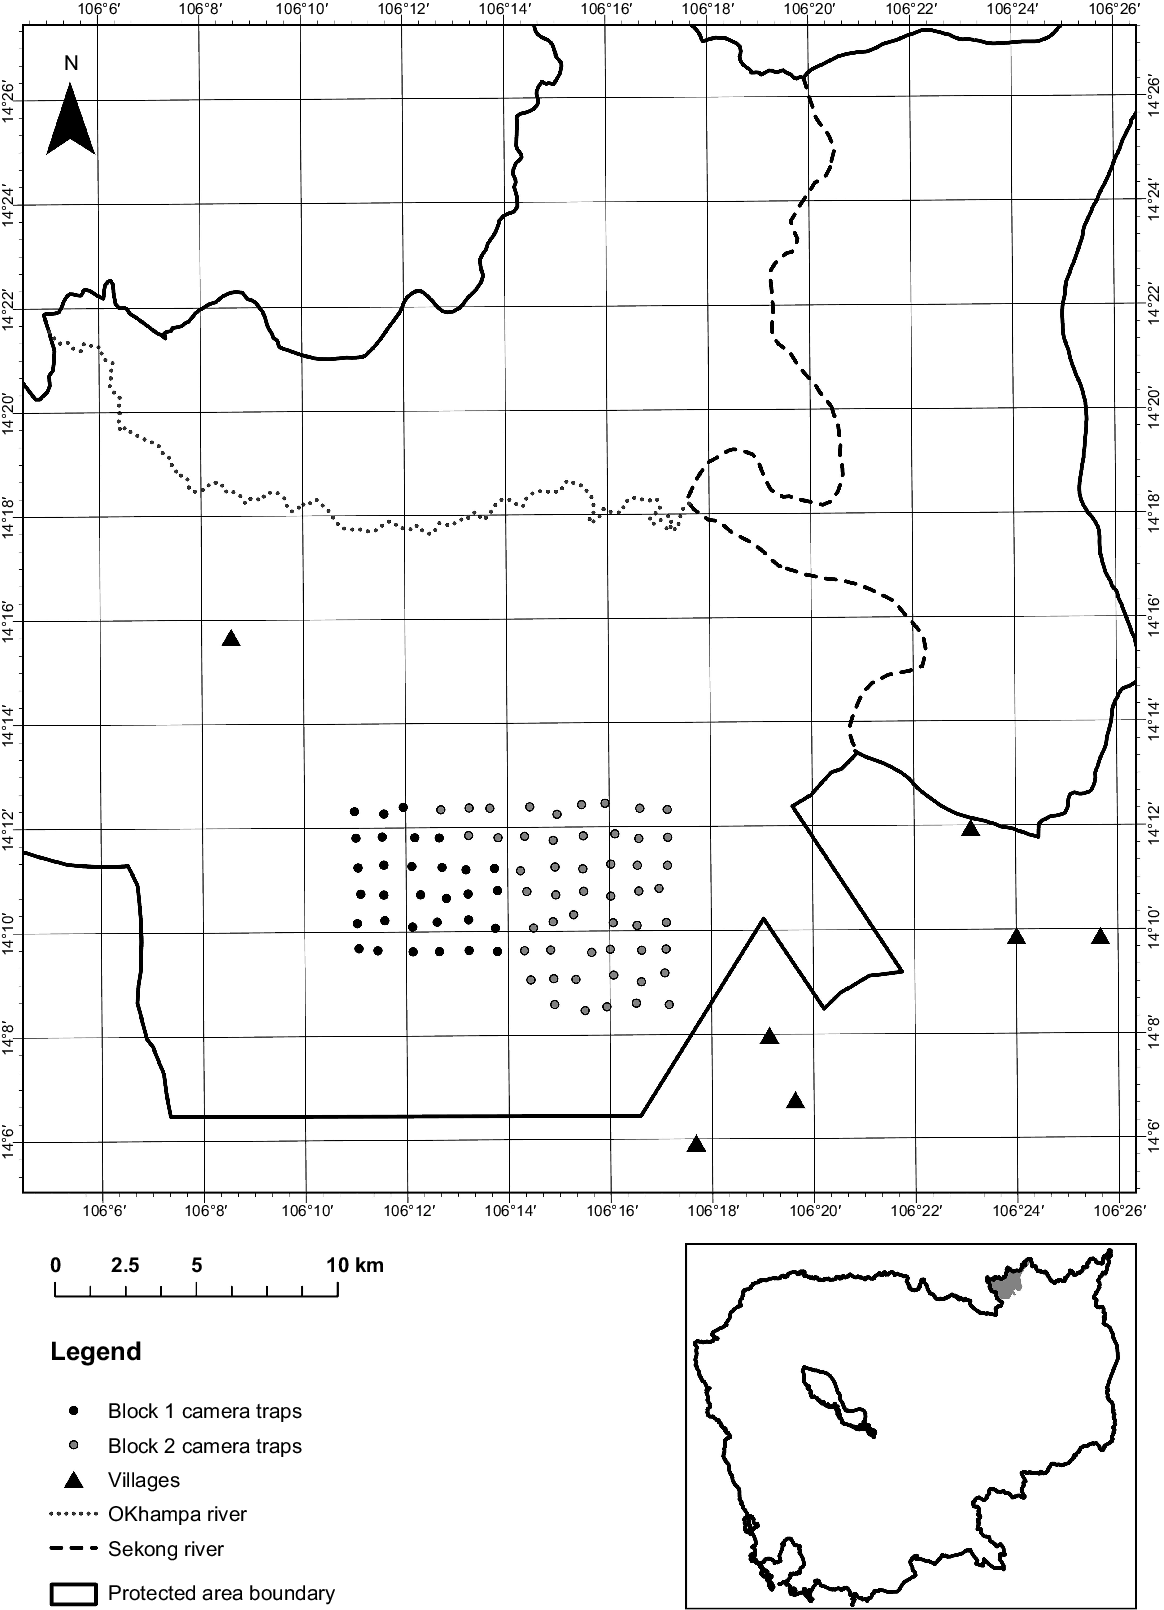
Siem Pang Wildlife Sanctuary (SPWS; 132,321 ha) is located in north-eastern Cambodia, in Stung Treng Province (Fig. 1). The sanctuary includes deciduous dipterocarp, semi-evergreen and riverine forest habitats at low elevations (<350 m asl). The southern part of the sanctuary, west of the Sekong River and south of the O’Khampa River, is dominated by deciduous dipterocarp forest (DDF). This study was undertaken entirely within the DDF in the south, where the population of Eld’s deer (Rucervus eldii siamensis) is distributed in their preferred habitat. In addition to Eld’s deer, this southern part of the sanctuary supports few mammals larger than wild pigs (Sus scrofa), although Guar (Bos javanicus) and Sambar (Rusa unicolor) have been recorded, and the largest remaining carnivore in the DDF landscape may be the Asiatic golden jackal (Canis aureus) (Loveridge et al. 2018). In addition to these wild animals, domestic cattle (Bos indicus) and buffalo (Bubalus bubalis) are commonly grazed within the sanctuary, with one village located within the sanctuary and six in close proximity to the reserve boundary. The area has strongly seasonal rainfall, with the rainy season occurring May–October and the dry season occurring November–April.
Camera trap survey and photo processing
Between January and May 2020, we deployed camera traps at 83 points within SPWS in two consecutively surveyed blocks that were deployed for 2.5 months each (Fig. 1). The camera grid was positioned to sample the area with the most frequently reported Eld’s deer sightings (BirdLife International, unpubl. data.). To achieve a relatively systematic placement, a grid with cells of 1 km2 was generated in ArcGIS 10.5 (ESRI 2011) using the fishnet tool, giving a camera trapping grid size of 83 km2. The cell size was chosen based on the recommendation of Sun et al. (2015) that the distance between cameras should be less than 2σ, where σ is the scale parameter for the target species, as well as experience from a previous survey of the site (R. Ladd, P.D. Meek, J.C. Eames and L.K.P. Leung unpubl. data.). The average female home range of 7.25 km2 for the subspecies of Eld’s deer (Rucervus eldii thamin) in Myanmar (Aung et al. 2001) was used to calculate the scale parameter. A single passive infra-red (PIR) camera trap was positioned within 200 m of the cell centre, with the selection of the exact camera location based on advice of a local Cambodian ranger to maximise photo captures of Eld’s deer. However, the targeting of naturally attractant features such as waterholes were avoided to minimise human interference with cameras. This resulted in an average trap spacing of 862 m. Due to camera availability, the grid was divided into two adjacent blocks, which were surveyed consecutively for approximately 2.5 months each. Block 1 consisted of 32 sites on the western side of the grid and Block 2 included 51 sites on the eastern side of the grid (Fig. 1).
In Block 1, 32 Reconyx Hyperfire HC600 cameras were used; in Block 2, 31 Reconyx HC600 and 20 HP2W cameras were used, with the camera model randomly allocated to a cell. The HP2W cameras used a white flash, while the HC600 cameras used an infra-red flash. The flash type was not found to significantly affect the detection of Eld’s deer (Ladd et al. 2023) and the models are equivalent; therefore, the mixing of flash types would not affect the results of the study. Each camera was strapped to a tree at approximately 0.8 m above the ground. Vegetation within 2 m of the cameras was removed to minimise the risk of false triggers caused by vegetation as well as damage by fire, a common occurrence within the DDF during the early dry season, as well as to ensure an open field of view. The cameras were set for high sensitivity, with five photographs taken per trigger and no delay between triggers. The fast shutter night mode was selected in the HC600 cameras, while the HP2W cameras were set with a high flash output, 1/480th shutter speed and Max IS0 of 3200. The HP2W cameras were also put into the Hyperfire legacy PIR mode to minimise any differences in detection probability between the two models. Cameras were visited twice during each 2.5 month deployment block to change over batteries and memory cards.
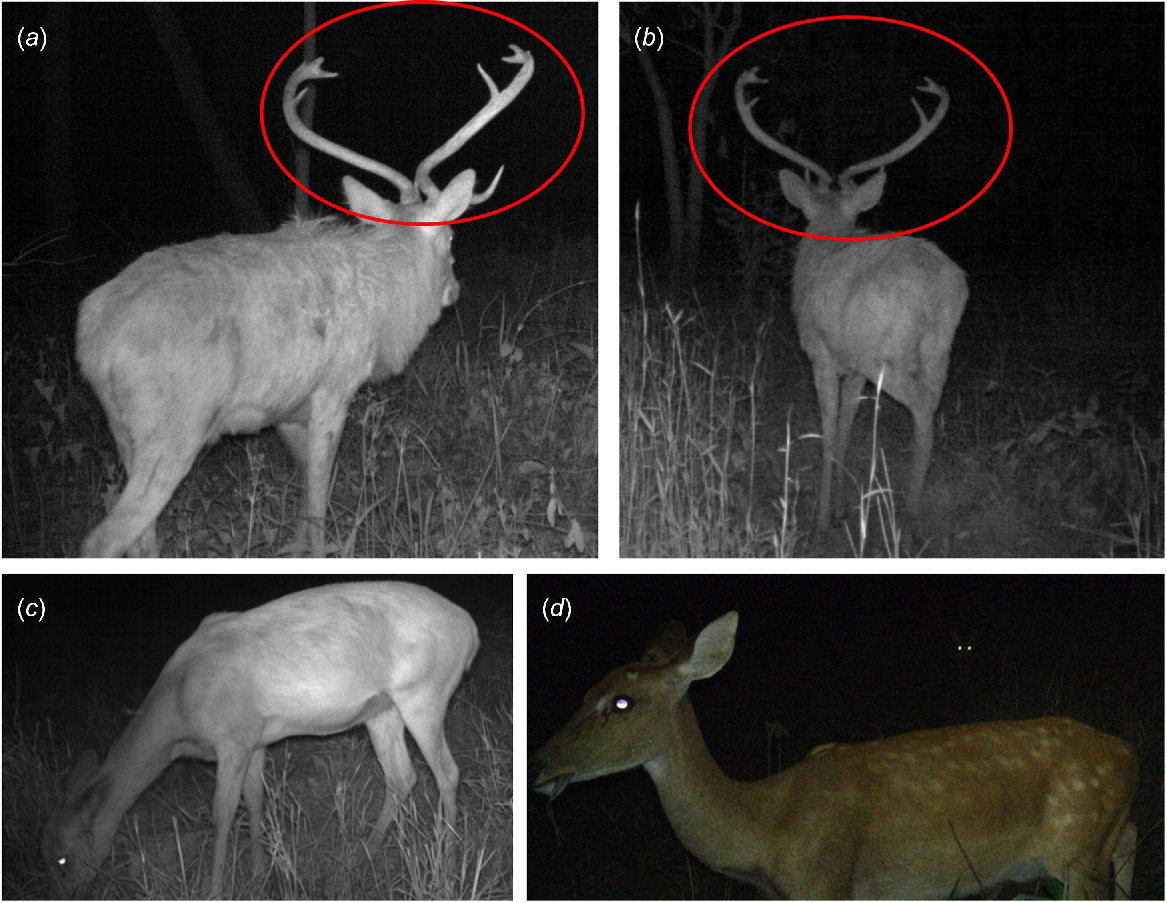
Species metadata tags were applied to photographs in the program ExifPro ver. 2.1 (Kowalski 2013). All photos of Eld’s deer were secondary tagged with the group size, sex, and age class of individuals. Eld’s deer were categorised as adult males, adult females, males with prongs, juveniles, or fawns. Individuals were defined as fawns rather than juveniles if their back was at or below the height of the adult female’s belly, with the appearance of the pelage and face also influencing the categorisation for borderline individuals. Temporal independence was defined by a 6-min interval, which has previously been empirically determined using a Lorelogram method, with researcher discretion used in a few cases (Ladd 2022). All individuals captured as part of a group were then counted as separate events for individual identification and detection histories. All individual identification was carried out by a single observer (RL) for consistency, and only adult males and females were individually identified as younger individuals either did not have readily distinguishable characteristics (e.g. prongs instead of antlers) or marks were temporary (e.g. fading spots on fawns). For adult males, the antlers were the primary identification feature used, although body size, shape, pelage, and any scars present also informed identification (Fig. 2). Identification of individual females was attempted using the pelage spot patterns present in a subset of the adult female population. However, these were only visible during daylight or when captured by white flash (Fig. 2), and only one side of the animal could be used for identification to prevent double counting. The inability to identify photographic detections due to photo quality (e.g. blurred or too distant), was likely random with respect to the individual, and the presence or absence of identifiable marks in the adult female population was assumed to be random. All adult male deer that could not be identified were classified as marked-but-unidentified, whereas only females with visible, but not resolvable marks were classified this way. The remainder of the detections were classified as unmarked.
Example of camera trap photos showing the distinguishing features of Eld’s deer used to identify individuals. (a, b) An adult male (20M) photographed at two separate camera sites, 1 day apart, (c) an adult female captured by infra-red flash with no spot pattern visible, and (d) an adult female captured by white flash with a visible spot pattern.
Density modelling and population estimation
Initially, a Spatially Explicit Mark Resight (SMR) model adapted from Efford and Hunter (2018) was attempted, as this method does not require all animals to be marked. Model estimation is achieved by maximising a pseudo-likelihood and a simulation-based adjustment for overdispersion (Efford and Hunter 2018). Only low numbers of adult females were identifiable. Maximisation of the SMR model failed and the model could not be fit. Instead, likelihood based Spatially Explicit Capture Recapture (SECR) models were implemented for the adult male population only, which was then extrapolated using demographic ratios to provide a whole population estimate. Daily camera trapping data was collapsed into 22 sampling occasions, with each occasion consisting of 7 days, except the last occasion, which was 5 days in duration. The camera location, model and sampling history (days active vs inactive for each sampling occasion) was inputted into an operational data matrix. All models were implemented using the package secr (Efford 2020) in R ver. 4.0.4 (R Core Team 2021).
Adapted from Borchers and Efford (2008), we assumed that each individual had an activity centre, which were distributed across a finite area. We defined this area by applying a buffer around the trapping grid, which was six times the scale parameter (σ), where σ was estimated from the trapping data. Activity centres were assumed to follow an inhomogeneous Poisson spatial distribution. For individually identifiable adult male deer, we assumed that the number of detections of individual i, at camera site j during sampling occasion k, was a Poisson random variable with a mean encounter rate of λijk (Borchers and Efford 2008). Λijk was assumed to decline according to the distance between the camera site and an individual’s activity centre, which was modelled by a half-normal detection function. The shape of the detection function was dependent on g0, the baseline encounter rate or intercept, and σ, the scale parameter. Models that included covariates for the camera trap type and the month of detection were fitted. Additionally, we compared inhomogeneous density models with the null homogenous density model, where density is the derived parameter. Overall densities were estimated by fitting Poisson processes through likelihood maximisation, with model selection made based on the Akaike information criterion score (AICc) corrected for small sample sizes.
The adult male Eld’s deer population was then estimated within the sampling area defined by the model, using the model selected by AICc. This estimate was then extrapolated to the entire Eld’s deer population using demographic ratios. Raw demographic ratios were calculated by dividing the total number of detections for each demographic category by the total number of adult male detections.
Monitoring a population for change is most useful when relatively small can be detected; for example, a 20% increase or decrease in population. This allows management to be responsive to changes in the population. We therefore conducted a power analysis following SECR model fitting, using the package pwr in R ver. 4.0.4 (R Core Team 2021) to determine the likely required sample size (individually identifiable deer detections) to detect a change of that size. A one-sample, two-sided t-test was conducted to estimate the required sample size that would allow an effect size of 20% to be detected, with a significance level of 0.05 and power of 0.8. As a power analysis is not able to consider the specifics of a particular sampling scenario and analytical method, we also examined the specific scenario of SECR analysis using the secr design app, an online tool for evaluating the design of SECR studies (Efford and Boulanger 2019). By inputting information on the basic design of the detector array and estimates of the density, encounter rate and scale parameter of the population, the tool is able to estimate the expected number of individuals and recaptures likely to be detected as well as an approximate relative standard error (RSE), indicating the effectiveness of the study design (Efford and Boulanger 2019). We inputted the estimated variables from the inhomogeneous model of this study and approximate details of the detector array. The online tool was not flexible enough to include the two-block design used; therefore, we assumed an increase in resources allowing all camera trap sites to be surveyed simultaneously for the 5-month study period. We then considered increases in the encounter rate that would allow for a 20% change in the population to be detected.
Results
A total of 297 independent events of Eld’s deer were recorded over 5979 trap days, resulting in 501 detections of individuals (Table 1). Approximately 60% of detections of adult males could be individually identified, while only about 6% of adult female detections could be individually identified due to a lack of or an inability to resolve visible marks (Table 1). The majority of adult male recaptures occurred at different trap stations, while there was only one recapture of an adult female, which occurred at a different trap station.
| Demographic group | Total Det. | No. Indiv. | Detection classification | Det. per Indiv. | Traps per Indiv. | Traps per Demo. | ||
|---|---|---|---|---|---|---|---|---|
| Indiv. ID | Unresolved | |||||||
| Adult male | 83 | 31 | 49 | 34 | 1 (1–3) | 1 (1–3) | 31 | |
| Adult female | 186 | 10 | 11 | 175 | 1 (1–2) | 1 (1–2) | 47 | |
| Male with prongs | 39 | – | – | 39 | – | – | 14 | |
| Juvenile | 28 | – | – | 28 | – | – | 18 | |
| Fawn | 99 | – | – | 99 | – | – | 36 | |
| Unknown | 66 | – | – | 66 | – | – | 25 | |
The number of individuals identified (No. Indiv.), classification of the detections based on whether they were individually identifiable (Indiv. ID) or unresolved (includes both marked and unmarked individuals), median number (range) of detections per individual (Det. per Indiv.), median number (range) of camera traps where an individual was photographed (Traps per Indiv.) and the total number of traps visited by a particular demographic group (Traps per Demo.) are also included.
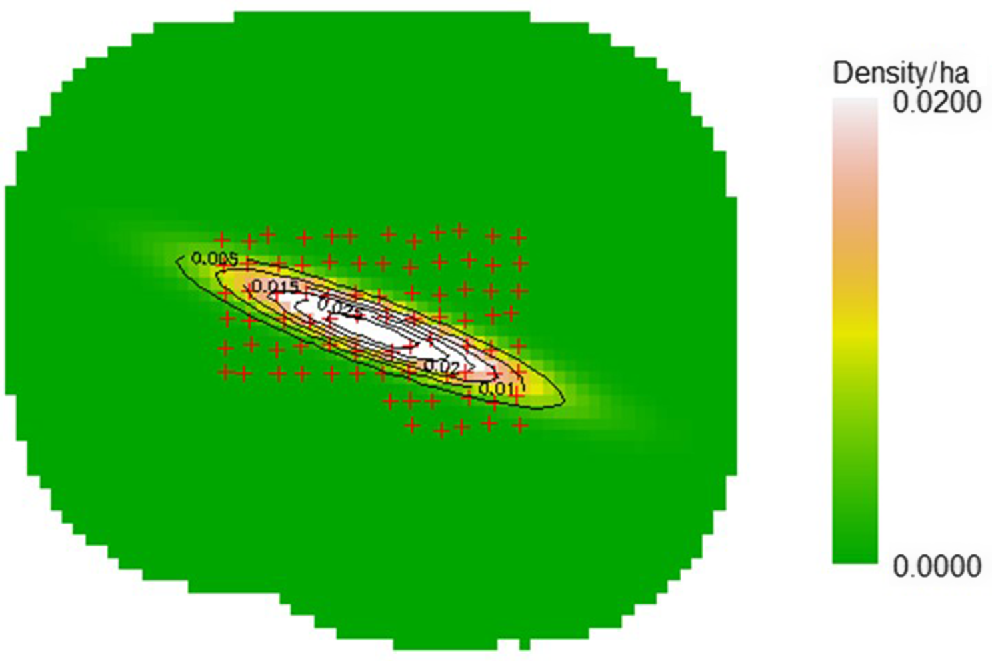
The total study area, as defined by a buffer around the trapping grid of 6σ, was calculated as 8082.1 ha. The null model was selected over the covariate models, although there was little difference according to the AICc ranking between the null model and the model including a covariate for camera trap type (Table 2). The model of quadratic inhomogeneous density was the preferred model for estimating the Eld’s deer adult male population (Table 3). This model provided a density estimate at the sample area centroid of 0.02997 adult male Eld’s deer per ha (95% CI: 0.007–0.125; s.e. 0.0251; Table 3). This density estimate does not apply to the entire modelled area, as shown by the density surface area (Fig. 3), which indicates the area of highest Eld’s deer density occurs diagonally through the camera trap array, with density declining towards zero beyond this. The abundance estimate for the adult male Eld’s deer population was 52 individuals with the 95% confidence interval being 32–83 (s.e. = 12.65) (Table 4).
| Model | D | g0 | σ | AICc | ||||
|---|---|---|---|---|---|---|---|---|
| Estimate | s.e. | Estimate | s.e. | Estimate | s.e. | |||
| D~1 g0~1 σ~1 (null) | 0.004 | 0.001 | 0.0013 | 0.0004 | 1537.23 | 241.55 | 318.35 | |
| D~1 g0~K σ~1 | 0.0041 | 0.0011 | 0.0014 | 0.0004 | 1550.81 | 245.37 | 319.23 | |
| D~1 g0~1 σ~m | 0.0039 | 0.001 | 0.0013 | 0.0004 | 1484.2 | 305.01 | 542.02 | |
| D~1 g0~m σ~1 | 0.0041 | 0.0011 | 0.001 | 0.0005 | 1561.01 | 251.73 | 543.97 | |
| D~1 g0~m σ~m | 0.0023 | 0.0012 | 0.0008 | 0.0008 | 2133.9 | 1098.68 | 549.96 | |
Parameters are the intercept (g0) and scale (σ) of a half normal detection function. Covariate effects are the camera trap model (K) and the month of detection (m).
| Model | D | g0 | σ | AICc | ||||
|---|---|---|---|---|---|---|---|---|
| Estimate | s.e. | Estimate | s.e. | Estimate | s.e. | |||
| D~x + y + x2 + y2 + xy g0~1 σ~1 | 0.03 | 0.0251 | 0.0012 | 0.0004 | 1450.81 | 193.64 | 312.44 | |
| D~1 g0~1 σ~1 (null) | 0.004 | 0.001 | 0.0013 | 0.0004 | 1537.23 | 241.55 | 318.35 | |
| D~x g0~1 σ~1 | 0.0041 | 0.001 | 0.0013 | 0.0004 | 1539.59 | 243.05 | 320.32 | |
| D~x + y g0~1 σ~1 | 0.004 | 0.001 | 0.0013 | 0.0004 | 1544.79 | 245.48 | 322.91 | |
Parameters are the intercept (g0) and scale (σ) of a half normal detection function. Note that for the inhomogeneous density models, the density estimate is for the maximum density within the state space/estimate at the sample area centroid.
| Estimate | s.e. estimate | Lower CI | Upper CI | N | |
|---|---|---|---|---|---|
| 52.2857 | 12.65480 | 32.75609 | 83.45965 | 31 |
The demographic ratios calculated from the raw detection rate indicate that this population has more than twice as many adult females as adult males (Table 5), and the female to fawn ratio was 0.53. Extrapolation of the estimated adult male population to the entire population using these ratios results in a total abundance estimate of 272 individuals (95% CI: 169–435).
| Adult male | Adult female | Male with prongs | Juvenile | Fawn | ||
|---|---|---|---|---|---|---|
| Raw photographic rate | 83 | 186 | 39 | 28 | 99 | |
| Ratio | 1 | 2.24 | 0.47 | 0.34 | 1.19 |
The power analysis estimated a sample size of 198 individuals would be required to detect a 20% change in population size, approximately four times greater than the total number of identified adult males achieved in this study. The secr design evaluation tool estimated an RSE of 37.5% for the survey with all camera sites active over the 5-month survey period. However, if the encounter rate was able to be increased from 0.001 to 0.002, then the survey was estimated to achieve an RSE of 19.6%.
Discussion
We succeeded in estimating the size of the Eld’s deer population at SPWS, although the precision of this estimate was relatively low and possibly slightly inflated. A major source of uncertainty in our estimate is in the extrapolation of the estimated number of individual adult males to the entire population using demographic ratios. Using the raw detection rate of the different demographic groups assumes that each group has the same detectability. This is unlikely to be true, given that males have larger home ranges than females (Aung et al. 2001), and that the camera height in relation to the size of the target animal influences camera trap detection (Meek et al. 2015b, 2016; Apps and McNutt 2018), which may result in reduced detections of fawns. The number of females may therefore be overestimated, and the number of fawns underestimated. However, the biased sex ratios reported here are consistent with those recorded for Eld’s deer in Shwesettaw Wildlife Sanctuary in Myanmar (Thu et al. 2019), although lower than the average recorded for Eld’s deer in Chatthin Wildlife Sanctuary in Myanmar during the same seasonal period as our study (Aung et al. 2001). Our efforts to standardise the demographic ratios using linear regression and nonparametric bootstrapping to measure uncertainty, as described by Weckel et al. (2011), resulted in biologically improbable ratios. This was likely due to the small sample sizes typically recorded at individual camera trap sites. Therefore, the raw ratios were the only option, but exactly how it influenced the whole population estimate is unclear, with potential positive or negative bias occurring for the different demographic groups.
To make use of more of the collected data, a SMR model was attempted first to estimate the entire population. This method incorporates the data from the identified males, the few adult female identities made, as well as the marked-but-unidentified and unmarked detections to inform the model. However, maximisation failed and the model was unable to be fitted. SMR under a Bayesian framework is more flexible than the likelihood-based method, and it is more effective in accommodating the challenge of modelling activity centres for unmarked animals using a latent-variable approach (Chandler and Royle 2013; Sollmann et al. 2013b). Furthermore, an extension of the SMR models accommodates partially identifiable individuals through categorical markings such as sex and age, which has been shown to increase the reliability and precision of parameter estimates (Augustine et al. 2018). While SMR estimates tend to have greater variance than SECR models, this would allow for the entire adult population to be estimated without the use of potentially problematic demographic ratios. Further investigation into SMR modelling under a Bayesian framework is therefore warranted.
Relatively few females were able to be identified due to the majority use of infra-red flash cameras, which did not allow spot patterns to be discerned when present. Other distinctive marks, such as scars, were almost non-existent. If only white flash camera traps were used, it would have increased the number of females that could have been identified, as well as making categorisation of marked status more accurate. Allowing the adult population to be estimated without the use of raw demographic ratios and increase the reliability of the estimate. We therefore recommend the use of white flash cameras for surveying Eld’s deer to improve individual identification and discernment of marked status, given that the use of white flash does not have adverse effects on the detection rate (Ladd et al. 2023).
Accurate identification of individuals is essential for SECR model estimates, with inaccuracies leading to potential positive or negative bias. The misclassification of individuals using natural markings from photographs is a recognised limitation, particularly when variability in markings is small (Kelly et al. 2008; Johansson et al. 2020). It was challenging to classify male Eld’s deer as their antlers displayed subtle differences in shape, degree of palmation and the size, shape and position of snags and minimal branches (Fig. 2). Photographs are therefore required to be of good quality, with the animal being relatively close to the camera in order to discern individuals. This was often aided by multiple sequential photos of an individual at slightly different angles. These challenges resulted in only 60% of adult male detections being identified. A single observer ensured consistency; however, this did not allow any measure of uncertainty in identification. Multiple independent observers identifying individuals may allow for a greater degree of confidence in the identification of individual deer.
Improving estimate precision is crucial for this approach to become an effective management tool for conserving Eld’s deer. The power analysis estimated a sample size of 198 individuals would be needed to detect a 20% change in population size, around four times greater than the total number of identified adult males achieved in this study. However, consider the scenario of all sites being active for the entire survey and adopting white flash cameras, allowing for a greater number of adult females to be identified, which, along with a more flexible Bayesian approach, may allow for the successful fitting of an SMR model. The present survey resulted in 13.5% of adult females being identified at white flash camera sites, whereas only 3.6% of adult females were identified at infra-red flash camera sites. If all sites used white flash camera traps, but all other variables stayed the same, then around 74 adult Eld’s deer, male and female, would be expected to be identified. This is still well short of the ideal sample size of 198 individuals; however, SMR modelling also makes use of the detection data of marked-but-unidentified and unmarked individuals to inform the model. If all of these detections are included in the target sample size, then it would exceed that indicated by the power analysis. It is likely that the model would perform reasonably well in such a scenario. The results of the secr online tool were able to provide greater insight into the SECR method. The finding that an increase in the encounter rate from 0.001 to 0.002 would allow the desired 20% change in population to be detected is promising, particularly given the results of this tool are specific to SECR models and the density parameter used for the simulation was therefore for adult male Eld’s deer only. However, if an SMR method could be achieved, as per the scenario discussed above, then this would mean an increased density due to the inclusion of all animals in the population, and the encounter rate would also increase. It is likely that only a relatively small improvement in encounter rate would improve the method in this scenario to allow the model to detect relatively small changes in population size.
An easily implemental option to increase the encounter rate and improve precision is to relax the constraints on camera placement to a much greater degree, allowing cameras to be positioned further from cell centres and prioritising the targeting of attractive natural features. Waterholes were originally excluded from targeting in large part due to concerns of theft and vandalism, as waterholes are frequently used by local people to fish and catch frogs. Prior to this study’s sampling period, and since there had been several camera traps stolen when close to waterholes. However, during this study no such incidents occurred, and a simultaneously run camera trap survey of waterholes also resulted in no theft or vandalism incidents (Legrand et al 2024). A high degree of targeted placement typically results in more detections and this increased sample size improves the precision of the density estimate (Despres-Einspenner et al. 2017). The diagonal pattern of density across the study area observed by the model is interesting and warrants further investigation (Fig. 3). There is no sufficiently detailed vegetation mapping available for SPWS that may explain this pattern, and it is unclear what features along this diagonal zone through the trapping grid may contribute to this area supporting a higher density. Given the small population, it is reasonable to assume that the deer are occupying the most optimal habitat in SPWS. Identifying the features of this higher density zone within the study area may provide information useful for improving habitat for Eld’s deer and promoting population growth.
The small population size of Eld’s deer at SPWS makes it vulnerable to issues of demographic, environmental and genetic stochasticity, which can result in reduced population growth (Shaffer 1981; Lande 1993). Even so, it is potentially the largest wild population of the R. e. siamensis subspecies in Southeast Asia, exceeding the population estimate at Xonnabouly Eld’s deer Sanctuary in Lao PDR (Khotpathoom and Vu 2021), although the difference is not statistically significant. As an inhomogeneous male Eld’s deer density was estimated in the present study, it is not possible to directly compare this with the homogenous Eld’s deer population densities recorded elsewhere. However, with 1.8 individuals per km2 recorded in Shwesettaw Wildlife Sanctuary (Thu et al. 2019), and 0.58 individuals per km2 recorded at Xonnabouly Eld’s deer Sanctuary (Khotpathoom and Vu 2021), density at Siem Pang is likely even lower, and it is generally accepted that all of these populations are below carrying capacity.
Conclusion
The challenges of monitoring a small, difficult to detect population were demonstrated in this study. Despite these, we succeeded in providing the first population estimate for this species in Cambodia. This estimate is useful for developing strategies for protecting and conserving the population. It provides a baseline for future population monitoring and also identifies the location of highest Eld’s deer density in SPWS.
Camera trapping was demonstrated to be an effective method for detecting Eld’s deer and is therefore recommended for monitoring this species. Improvements to implementation and augmentation with other data sources should be used to increase precision. This includes the adoption of white flash cameras instead of infra-red and more targeted camera placement described by Meek et al (2024). Investigation of the analytical framework (Bayesian vs Maximum Likelihood) is also required to ensure that the optimal approach is used for improved precision and modelling stability. This study has provided a foundation for the development of a long-term monitoring process for the conservation management of Eld’s deer.
Data availability
Data collected and analysed in this study are archived in the library of the University of Queensland, Gatton, Qld, Australia.
Conflicts of interest
Paul Meek is an Associate Editor of Pacific Conservation Biology but was not involved in the peer review or any decicion-making process for this paper. The authors have no further conflicts of interest to declare.
Declaration of funding
This work was supported by Conservation Force and the funders had no role in study design, data collection and analysis or decision to publish or preparation of the manuscript. Rachel Ladd was supported by an Australian Government Research Training Program (RTP) Stipend and RTP Fee-Offset Scholarship through the University of Queensland. Paul Meek was supported by the NSW Department of Primary Industries and Regional Development.
Acknowledgements
We thank BirdLife International Cambodia Programme and Rising Phoenix Co. Ltd. for providing field support for this research. We also thank all Rising Phoenix staff for field assistance, and Conservation Force for contributing funding to this project. Statistical advice was given by Vincent Mellor. Rachel Ladd was supported by an Australian Government Research Training Program (RTP) Stipend and RTP Fee-Offset Scholarship through the University of Queensland. Paul Meek was supported by the Vertebrate Pest Research Unit, NSW Department of Primary Industries (now NSW DPIRD).
References
Apps P, McNutt JW (2018) Are camera traps fit for purpose? A rigorous, reproducible and realistic test of camera trap performance. African Journal of Ecology 56(4), 710-720.
| Crossref | Google Scholar |
Augustine BC, Royle JA, Kelly MJ, Satter CB, Alonso RS, Boydston EE, Crooks KR (2018) Spatial capture-recapture with partial identity: an application to camera traps. Annals of Applied Statistics 12(1), 67-95.
| Crossref | Google Scholar |
Aung M, McShea WJ, Htung S, Than A, Soe TM, Monfort S, Wemmer C (2001) Ecology and social organization of a tropical deer (Cervus eldi thamin). Journal of Mammalogy 82, 836-847.
| Google Scholar |
Borchers D (2012) A non-technical overview of spatially explicit capture–recapture models. Journal of Ornithology 152, 435-444.
| Crossref | Google Scholar |
Borchers DL, Efford MG (2008) Spatially explicit maximum likelihood methods for capture–recapture studies. Biometrics 64(2), 377-385.
| Crossref | Google Scholar | PubMed |
Ceballos G, Ehrlich PR, Dirzo R (2017) Biological annihilation via the ongoing sixth mass extinction signaled by vertebrate population losses and declines. Proceedings of the National Academy of Sciences 114(30), E6089-E6096.
| Crossref | Google Scholar |
Chandler RB, Royle JA (2013) Spatially explicit models for inference about density in unmarked or partially marked populations. The Annals of Applied Statistics 7(2), 936-954.
| Crossref | Google Scholar |
Despres-Einspenner ML, Howe EJ, Drapeau P, Kühl HS (2017) An empirical evaluation of camera trapping and spatially explicit capture-recapture models for estimating chimpanzee density. American Journal of Primatology 79(7), e22647.
| Crossref | Google Scholar |
Efford M (2004) Density estimation in live-trapping studies. Oikos 106(3), 598-610.
| Crossref | Google Scholar |
Efford MG, Boulanger J (2019) Fast evaluation of study designs for spatially explicit capture–recapture. Methods in Ecology and Evolution 10, 1529-1535.
| Crossref | Google Scholar |
Efford MG, Hunter CM (2018) Spatial capture–mark–resight estimation of animal population density. Biometrics 74(2), 411-420.
| Crossref | Google Scholar | PubMed |
Gray TNE, Brook SM, McShea WJ, Mahood S, Ranjitsingh MK, Miyunt A, Hussain SA, Timmins R (2015) Rucervus eldii. The IUCN Red List of Threatened Species 2015, e.T4265A22166803.
| Google Scholar |
Johansson Ö, Samelius G, Wikberg E, Chapron G, Mishra C, Low M (2020) Identification errors in camera-trap studies result in systematic population overestimation. Scientific Reports 10(1), 6393.
| Crossref | Google Scholar | PubMed |
Karanth KU, Nichols JD (1998) Estimation of tiger densities in India using photographic captures and recaptures. Ecology 79(8), 2852-2862.
| Google Scholar |
Kelly MJ, Noss AJ, Di Bitetti MS, Maffei L, Arispe RL, Paviolo A, De Angelo CD, Di Blanco YE (2008) Estimating puma densities from camera trapping across three study sites: bolivia, argentina, and belize. Journal of Mammalogy 89(2), 408-418.
| Crossref | Google Scholar |
Khotpathoom T, Vu TT (2021) An estimation of density and population size for Eld’s deer in the Xonnabouly Eld’s deer sanctuary, Lao PDR. Mammalia 85(2), 109-114.
| Crossref | Google Scholar |
Kowalski M (2013) ExifPro 2.1. Available at www.exifpro.com/index.html [accessed 202-22].
Ladd R, Crouthers R, Brook S, Eames JC (2022) Reviewing the status and demise of the Endangered Eld’s deer and identifying priority sites and conservation actions in Cambodia. Mammalia 86(5), 407-421.
| Crossref | Google Scholar |
Ladd R, Meek P, Leung LK-P (2023) The influence of camera-trap flash type on the behavioural response, detection rate and individual recognition of Eld’s deer. Wildlife Research 50, 475-483.
| Crossref | Google Scholar |
Lande R (1993) Risks of population extinction from demographic and environmental stochasticity and random catastrophes. The American Naturalist 142(6), 911-927.
| Crossref | Google Scholar | PubMed |
Legrand R, Ladd R, Samnang E, Meek PD, Eames J (2024) Use of trapeangs by Eld’s deer Rucervus eldii siamensis in Siem Pang Wildlife Sacntuary, Cambodia. Cambodian Journal of Natural History 2, 101-111.
| Google Scholar |
Loveridge R, Cusack JJ, Eames JC, Eang S, Willcox D (2018) Mammal records and conservation threats in Siem Pang Wildlife Sanctuary and Siem Pang Khang Lech Wildlife Sanctuary, Cambodia. Cambodian Journal of Natural History 2, 76-89.
| Google Scholar |
Meek PD, Ballard G-A, Fleming PJS (2015a) The pitfalls of wildlife camera trapping as a survey tool in Australia. Australian Mammalogy 37(1), 13-22.
| Crossref | Google Scholar |
Meek PD, Ballard G-A, Vernes K, Fleming PJS (2015b) The history of wildlife camera trapping as a survey tool in Australia. Australian Mammalogy 37(1), 1-12.
| Crossref | Google Scholar |
Meek PD, Ballard GA, Falzon G (2016) The higher you go the less you will know: placing camera traps high to avoid theft will affect detection. Remote Sensing in Ecology and Conservation 2(4), 204-211.
| Crossref | Google Scholar |
Meek PD, Collingridge L, Smith D, Ballard G (2024) A calibration method for optimizing detection of species using camera traps. JOJ Wildlife & Biodiversity 5(2), 555655.
| Crossref | Google Scholar |
Nichols JD, Williams BK (2006) Monitoring for conservation. Trends in Ecology & Evolution 21(12), 668-673.
| Crossref | Google Scholar | PubMed |
Otis DL, Burnham KP, White GC, Anderson DR (1978) Statistical inference from capture data on closed animal populations. Wildlife Monographs 62, 3-135.
| Google Scholar |
O’Grady JJ, Brook BW, Reed DH, Ballou JD, Tonkyn DW, Frankham R (2006) Realistic levels of inbreeding depression strongly affect extinction risk in wild populations. Biological Conservation 133(1), 42-51.
| Crossref | Google Scholar |
Shaffer ML (1981) Minimum population sizes for species conservation. BioScience 31(2), 131-134.
| Crossref | Google Scholar |
Sollmann R, Gardner B, Parsons AW, Stocking JJ, McClintock BT, Simons TR, Pollock KH, O’Connell AF (2013b) A spatial mark–resight model augmented with telemetry data. Ecology 94(3), 553-559.
| Crossref | Google Scholar |
Sun CC, Fuller AK, Royle JA (2015) Trap configuration and spacing influences parameter estimates in spatial capture-recapture models. PLoS ONE 10(10), e0141634.
| Crossref | Google Scholar |
Thu AM, Li G-G, Zhang MX, Thang TH, Soe AM, Naing W, Quan R-C (2019) Group size and social organization of the endangered Eld’s deer (Rucervus eldii thamin): results from a long-term study in Myanmar. Global Ecology and Conservation 18, e00618.
| Crossref | Google Scholar |
Weckel M, Rockwell RF, Secret F (2011) A modification of Jacobson et al.’s (1997) individual branch-antlered male method for censusing white-tailed deer. Wildlife Society Bulletin 35(4), 445-451.
| Crossref | Google Scholar |