

Review of emissions from smouldering peat fires and their contribution to regional haze episodes
Yuqi Hu A , Nieves Fernandez-Anez A B , Thomas E. L. Smith C D and Guillermo Rein A EA Department of Mechanical Engineering, Imperial College London, London SW7 2AZ, UK.
B Department of Fire Safety and HSE Engineering, Western Norway University of Applied Sciences, Bjørnsons gate 45, 5528, Haugesund, Norway.
C Department of Geography and Environment, London School of Economics and Political Science, London WC2A 2AE, UK.
D Department of Geography, King’s College London, London WC2R 2 LS, UK.
E Corresponding author. Email: g.rein@imperial.ac.uk
International Journal of Wildland Fire 27(5) 293-312 https://doi.org/10.1071/WF17084
Submitted: 20 May 2017 Accepted: 20 March 2018 Published: 22 May 2018
Journal Compilation © IAWF 2018 Open Access CC BY-NC-ND
Abstract
Smouldering peat fires, the largest fires on Earth in terms of fuel consumption, are reported in six continents and are responsible for regional haze episodes. Haze is the large-scale accumulation of smoke at low altitudes in the atmosphere. It decreases air quality, disrupts transportation and causes health emergencies. Research on peat emissions and haze is modest at best and many key aspects remain poorly understood. Here, we compile an up-to-date inter-study of peat fire emission factors (EFs) found in the literature both from laboratory and from field studies. Tropical peat fires yield larger EFs for the prominent organic compounds than boreal and temperate peat fires, possibly due to the higher fuel carbon content (56.0 vs 44.2%). In contrast, tropical peat fires present slightly lower EFs for particulate matter with diameter ≤2.5 μm (PM2.5) for unknown reasons but are probably related to combustion dynamics. An analysis of the modified combustion efficiency, a parameter widely used for determining the combustion regime of wildfires, shows it is partially misunderstood and highly sensitive to unknown field variables. This is the first review of the literature on smouldering peat emissions. Our integration of the existing literature allows the identification of existing gaps in knowledge and is expected to accelerate progress towards mitigation strategies.
Additional keywords: emission factor, modified combustion efficiency, smoke, wildfires.
Introduction
Smouldering peat fires propagate horizontally and vertically through deep layers, leading to the largest fires on Earth (in terms of mass of fuel consumed per unit surface) (Rein 2013; Huang and Rein 2017). They are frequently reported in tropical, temperate and boreal regions including North America, Siberia, the British Isles, the sub-Arctic, south-east Asia and southern Africa (for example, Botswana in 2000, Scotland in 2006, the USA in 2004, central Russia in 2010 and Indonesia in 2015) (Rein 2013). Peatlands are an important terrestrial carbon pool, storing one-third of the world’s soil carbon (500–600 Gt C (1 Gt = 1 × 10⁹ tonnes)), as much carbon as surface vegetation globally (IPCC 2006; Turetsky et al. 2014). Carbon emissions derived from peat fires are equivalent to 15% of anthropogenic emissions, creating large perturbations to the global carbon cycle (Poulter et al. 2006).
Peat is a carbon-rich organic soil that contains at least 12% organic carbon (~20% organic material) with less than 20–35% mineral content (Couwenberg 2009; Turetsky et al. 2014). It is composed of partially decomposed organic material (mostly from plants) accumulated in waterlogged, anaerobic, acidic and nutrient-deficient conditions, over centuries to millennia (Turetsky et al. 2014; IPCC 2006). Peatlands are areas with a naturally accumulated peat layer at the surface (peat thickness at least 20 cm if drained, 30 cm if undrained), and are the most widespread of all wetland types in the world, covering over 4 000 000 km2 (~3% of the Earth’s land surface) (World Energy Council 2013; Turetsky et al. 2014). Peatlands are mainly distributed at northern high latitudes, while tropical peatlands comprise ~11% of global peatland areas (mainly in south-east Asia) (Page et al. 2011). A total of 85% of the global peatland areas are in four countries only: Russia, Canada, the USA and Indonesia (World Energy Council 2013). A full description of the global and regional distribution of peatlands can be found in World Energy Council (2013). In addition to peatland area, Page et al. (2011) provided the best estimates of mean peat thickness in tropical countries (varying from 1.3 to 11 m) and adopted a default best estimate of 0.5 m peat thickness for most other countries in calculating global peat volumes. It is estimated that global peat volume is 7093 Gm3 (1Gm3 = 1 × 10⁹ m3) (Page et al. 2011).
Because peat accumulation only takes place in water-saturated environments, the bulk of peat in pristine peatlands usually has a very high moisture content and is thus naturally protected from burning. However, natural droughts (e.g. El Niño) or human activities (anthropogenic drainage, peat harvesting) lower the watertable in peatlands (Turetsky et al. 2014) and reduce the moisture content of the peat profile (Kettridge et al. 2015), rendering them susceptible to smouldering fires – the slow, low-temperature, flameless burning of porous fuels and the most persistent type of combustion phenomena (Rein 2015). Smouldering peat fires emit substantial quantities of aerosols that lead to severe regional haze episodes. However, information regarding emissions and health effects of regional haze episodes from smouldering peat fires is limited to a handful of studies.
The present paper is a review of the emissions from smouldering peat fires and their contribution to regional haze episodes for the first time. There are three main objectives: (1) to provide an overview of past haze episodes evolved from peat fires and to summarise the potential health effects of haze; (2) to conduct an up-to-date and comprehensive compilation of pollutant emission factors produced from peat fires; (3) to review the origins and to verify the applicability of modified combustion efficiency, a parameter widely used to evaluate the combustion regime of peat fire. This analysis will allow identification of knowledge gaps and move us forward in developing mitigation strategies.
Overview of past haze episodes
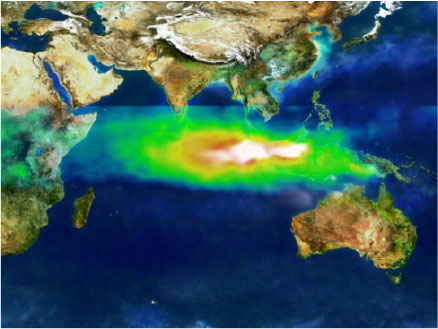
This section reviews regional haze episodes that have resulted from smouldering peat fires. Notorious haze episodes are frequently reported, especially when extended droughts intensify the vulnerability of peatlands to fire (Page et al. 2002; Heil 2007; Rein 2013; Turetsky et al. 2014). These fires generate smoke plumes that remain close to the ground owing to their weak buoyancy. The whitish colour of the haze indicates a predominant content of organic carbon particles, which is characteristic for haze aerosols (Heil 2007; Black et al. 2016). Dispersal of haze is slow, with the smoke plume tending to accumulate near the ground, driven by wind. It can migrate long distances into populated areas, causing regional haze for long periods of time (days or weeks) (Rein 2013). In contrast, flaming wildfires generate a strong fire plume of black or dark grey colour with a lower concentration of organic carbon particles but a higher concentration of soot than smouldering peat fires (Akagi et al. 2011; Drysdale 2011). A comparison between the plumes of the two types of fire is presented in Fig. 1.

|
Since 1991, the haze that results from smouldering peat fires has been a particularly acute and recurrent problem in south-east Asia, especially in 1997, 2006, 2009, 2013 and 2015 (Rein 2013; Koplitz et al. 2016). Because the main source of the south-east Asia haze is ascribed to peat fires occurring on the islands of Sumatra and Borneo, Indonesia has been the target of criticism from affected countries in the Association of South-East Asian Nations (ASEAN) region (Heil and Goldammer 2001; Glover and Jessup 2006; Heil 2007). In addition to south-east Asia, the USA and Russia are among other areas suffering from haze evolving from peat fires. For example, in June 2008, large-scale burning of peat deposits occurred in the eastern plains of North Carolina, and the emitted air pollutants caused a haze episode in this region (Black et al. 2016). During the summer of 2010, large urban regions in Russia were blanketed in smoky haze from severe peat fires raging outside Moscow, threatening a total population exceeding 15 million (Konovalov et al. 2011).
The effects of haze are diverse. Local regional air quality can seriously deteriorate. In addition, haze leads to strong and persistent impairment in visibility, which can severely affect local transportation, construction, tourism and agriculture-based industries (Heil and Goldammer 2001). An example of widespread disruption due to peatland fires is the unprecedented peatland mega-fire that occurred on the islands of Indonesia during the 1997 El Niño event, resulting in the transboundary 1997–98 south-east Asia haze episode (Fig. 2) (Page et al. 2002; Rein 2013). This event led to severe air pollution with more than 2000 μg m−3 total suspended particulates (TSP, particles with an aerodynamic diameter ≤100 μm) detected in Kalimantan and Sumatra (Heil 2007). An airplane crash with 234 deaths in northern Sumatra and ship collisions in the Strait of Malacca were partly attributed to the impaired visibility at that time. This haze affected 100 million people across five south-east Asian countries, with total damages estimated to be US$4.5 billion (Heil and Goldammer 2001). During the 2010 Russian haze event, the Moscow region suffered from extremely high levels of daily mean carbon monoxide (CO) and coarse particle (PM10, particles with an aerodynamic diameter ≤10 μm) concentrations (estimated up to 10 mg m−3 and 700 µg m−3 respectively) (Konovalov et al. 2011). The hourly Singapore fine particle (PM2.5, particle with an aerodynamic diameter ≤2.5 μm) concentration during the acute 2013 south-east Asian haze conditions soared ~22 times above background levels, degrading local air quality from a ‘Good’ to ‘Hazardous’ level. In the fall (autumn) of 2015, widespread peatland fires burned once again over large parts of equatorial Asia and induced the worst haze episode since 1997 (Huijnen et al. 2016; Koplitz et al. 2016).
|
More importantly, haze exposes populations to high concentrations of various pollutants. However, little is known about the health effects associated with haze emanating from smouldering peat fire emissions (Hinwood and Rodriguez 2005; Rein 2015). Generally, exposure to pollutants during haze events results in various deleterious physiological responses, predominantly to the respiratory and cardiovascular systems (World Health Organisation 2006). Specifically, haze-related diseases include conjunctivitis, acute upper respiratory tract infection, allergic rhinitis, asthma, bronchitis, eczema, pneumonia, emphysema, acute myocardial infarct and other ischaemic heart diseases (Kunii et al. 2002; Sastry 2002; Glover and Jessup 2006; Rein 2013; Durán et al. 2014; Ho et al. 2014). Individual adverse health outcomes are influenced by the composition and the amount of pollutants, the exposure duration, and personal health status (age, physique) (Hinwood and Rodriguez 2005). The health effects of some individual components found in haze are briefly discussed below.
CO exposure leads to health effects that range from tension-type headaches and dizziness symptomatic of mild poisoning to unconsciousness or death after prolonged exposure at high concentrations. Also, trace gas species such as sulfur dioxide (SO2) emitted from peat fires are associated with pulmonary dysfunction and respiratory symptoms (Hinwood and Rodriguez 2005; World Health Organisation 2006).
Particulate matter (PM) exposure can cause cardiovascular disease and may aggravate arrhythmias; PM can affect the central nervous system and the reproductive system, and can induce cancer (World Health Organisation 2006; Durán et al. 2014). PM10 can be inhaled into the human respiratory tract, and the deposition of these particles in the lungs can induce a systemic inflammatory response (Hinwood and Rodriguez 2005; Glover and Jessup 2006; Heil 2007). PM2.5 from peat fires can penetrate into lower respiratory tracts and exacerbate respiratory diseases including chronic bronchitis, emphysema and asthma (World Health Organisation 2006; Durán et al. 2014). Epidemiologic studies have shown a correlation between PM2.5 uptake and an increase of morbidity, as well as an increase in death rates related to respiratory complications, heart problems and lung cancer (Dockery et al. 1993; Lighty et al. 2000; Kunii et al. 2002; Sastry 2002; Hinwood and Rodriguez 2005; Heil 2007; Jayachandran 2009; Durán et al. 2014). Ultrafine particles (UFP, particles with an aerodynamic diameter ≤0.1 μm) can deposit deep in the lungs by diffusion and can enter the blood through the alveoli of the lung (Lighty et al. 2000). Recently, a cardiopulmonary toxicity study showed that PM10 from smouldering peat fires induced larger lung inflammatory responses, whereas UFP caused significant adverse cardiac effects (Kim et al. 2014).
Metals (Fe, Cu, Ni) that are enriched in PM can catalyse the formation of reactive oxygen species, which are implicated via cellular activity to a variety of inflammatory responses including cardiovascular diseases (Lighty et al. 2000). Additionally, peat fires release mercury (Hg) into the atmosphere at a rate 15 times greater than upland forest fires, creating serious human health concerns (Durán et al. 2014; Turetsky et al. 2014). The inhalation of mercury can induce harmful effects on the nervous, digestive and immune systems, lungs and kidneys, with increased risks of cardiovascular disease and severe neurological damage to humans (Durán et al. 2014).
Volatile organic compounds (VOCs) are by-products of the incomplete combustion of smouldering peat that can pose great health threats to people suffering from exposure (Heil 2007; Durán et al. 2014). VOCs include a wide range of chemical substances such as hydrocarbons (e.g. methane, benzene and toluene), halocarbons and oxygenates. The prolonged exposure to typical hydrocarbons like benzene may increase susceptibility to leukaemia. Among the VOCs, one of the few classes established for epidemiological purposes are the polycyclic aromatic hydrocarbons (PAHs) (e.g. fluorene, phenanthrene, pyrene). Substances identified in haze like xylene and PAHs are known or suspected carcinogens, mutagens and teratogens, with the potential to cause serious long-term effects (Muraleedharan et al. 2000a). Exposure to PAHs has also been linked with cardiovascular disease and poor foetal development (Kunii et al. 2002).
Epidemiological evidence of haze effects
There are a few epidemiological studies of haze from peat fire events in Indonesia, Malaysia, Singapore and the USA (Kunii et al. 2002; Sastry 2002; Glover and Jessup 2006; Jayachandran 2009; Rappold et al. 2011; Ho et al. 2014). The 1997 south-east Asian transboundary haze event caused acute health risk to 105 million people, mainly in Indonesia, Singapore, Malaysia, Brunei and Thailand. The number of acute respiratory infection cases increased by 3.8 times in south Sumatra from 1996 to 1997 (Hinwood and Rodriguez 2005). A total of 16 400 Indonesian infant and foetal deaths were attributable to this haze pollution (Jayachandran 2009). Kunii et al. (2002) interviewed 543 persons in terms of their response to haze and conducted lung-function tests. More than 90% of the respondents had respiratory symptoms, and elderly individuals suffered a serious deterioration of their overall health. According to their statistics, there were 527 haze-related deaths, 298 125 cases of asthma, 58 095 cases of bronchitis, and 1 446 120 cases of acute respiratory infection reported in the country of Indonesia for this haze episode alone (Kunii et al. 2002). Compared with 1995, the attendance at hospital accident and emergency (A and E) in Singapore in the 1997 haze period increased by 5588 cases for asthma, bronchitis, emphysema and pneumonia (Glover and Jessup 2006). In Malaysia, the haze of 1997 increased total all-cause mortality by 22%, and non-traumatic mortality among the population aged 65–74 increased by 72% (Sastry 2002). Overall, the number of additional premature deaths in adults related to this haze exposure was estimated to be between 22 200 and 53 700 (total mortality among the adult population increased by ~3%) (Heil 2007).
A study of the 2013 south-east Asia haze showed that the most common physical symptoms during the crisis were mouth, throat and nose discomfort, eye discomfort, headache and breathing difficulty (Ho et al. 2014). More than 28 000 000 people in Indonesia were affected by the 2015 south-east Asian haze, of which more than 140 000 residents reported respiratory illness. It is estimated that this recent haze episode resulted in 91 600 excess deaths across Indonesia, 6500 in Malaysia and 2200 in Singapore (Koplitz et al. 2016).
Russia and the USA are also among countries suffering from haze. There were close to 11 000 excess deaths from non-accidental causes during the 2010 Russian peat fire event; the most pronounced effects were cardiovascular, respiratory, genitourinary and nervous system diseases or deaths (Shaposhnikov et al. 2014). During the 2008 North Carolina severe peat fire event (Black et al. 2016), asthma-related visits accounted for 44% of all respiratory events (2081 cases) considered, and heart failure accounted for 33% of all cardiac events (1817 cases) (Rappold et al. 2011).
Smouldering peat fires
This section summarises the characteristics of smouldering peat fires and their feedback on local ecosystems and climate systems. In physical terms, peat is a porous and charring natural fuel that consists of a permeable medium. When above the watertable and available to burn, this aggregate nature provides a large surface area per unit volume, which facilitates the heterogeneous reaction with oxygen, and permits in-depth transport of oxygen through the fuel bed, which is thus prone to smouldering (Rein 2013, 2015; Rein et al. 2008). Smouldering combustion is sustained by the heat released when oxygen directly attacks the surface of a solid fuel, whereas flaming combustion dominates when the oxidation takes place in the gas phase (Rein 2015). Owing to the difference in combustion regimes, the temperature and spread rate characteristics in smouldering combustion are low compared with flaming combustion (Rein 2013, 2015). Typical peak temperatures for smouldering are in the range from 450 to 700°C, whereas the typical temperature for flaming is ~1500°C (Rein 2015; Huang et al. 2016). Additionally, smouldering spreads in a creeping fashion, typically ~1 mm min−1, which is two orders of magnitude slower than flame spread (Rein 2015). Despite the large differences between smouldering and flaming combustion, they are closely related, and one can lead to the other (Rein 2015). Transition from flaming to smouldering can occur as residual smouldering combustion, i.e. persistent smouldering of thick fuels and biomass accumulated below ground that can be observed for days after a flaming wildfire has passed by (Bertschi et al. 2003; Urbanski 2014). The reverse, the transition from smouldering to flaming, can happen under enhanced oxygen supply (e.g. strong winds) (Rein 2013).
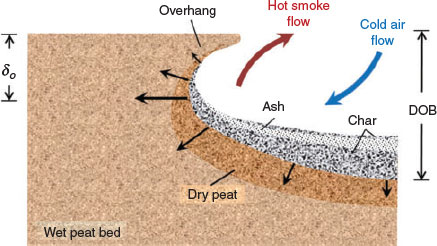
In the presence of a large quantity of fuel, a smouldering fire can be initiated with a weak ignition source and sustained for very long periods (months, years or even decades) despite firefighting attempts, extensive rains or weather changes. For these two reasons – easy ignition and difficult suppression – smouldering fires present the most persistent combustion phenomena on Earth (Rein 2013). Moisture content is the most important property governing the ignition and the spread of smouldering peat fires (Rein 2015; Archibald et al. 2017), while oxygen supply and heat transfer are the two mechanisms controlling its spread rate (Huang and Rein 2015; Rein 2015). Real smouldering fires are a multidimensional phenomenon, which includes two main components: in-depth vertical and surface lateral spread (Rein 2013; Huang and Rein 2017). Complex behaviours like the ‘overhang’ phenomenon, where smouldering spreads fastest beneath the free surface, is formed by the spread rate difference between the top and lower peat layers as well as the competition between oxygen supply and heat losses (Fig. 3) (Huang et al. 2016).
|
Smouldering peat fires result in the widespread destruction of ecosystems, bringing fatal damage to the forest soil, its micro-flora and micro-fauna (Rein et al. 2008). The long residence time of smouldering means that heat can penetrate deep into the soil layers and largely consume the fuel bed (>90% mass loss) (Rein 2013). In contrast, flaming combustion is a surface phenomenon that produces high temperatures above the ground for short periods of time (in the order of 15 min), thus leading to perhaps less severe impacts on the soil and its micro-fauna and flora (Doerr and Cerdà 2005; Rein 2013). Thermal conditions in smouldering peat are more severe than medical sterilisation treatments, and mean that the soil is exposed to conditions that are lethal to biological agents. Furthermore, peat fires can burn down to the watertable, exposing tree roots and leading to forest vegetation instability. This long-term impact of peat fires on local vegetation (e.g. changes in flora species, incomplete vegetation recovery) has been observed in boreal, temperate and tropical peatland settings (Maltby et al. 1990; Hoscilo et al. 2011; Kettridge et al. 2015).
Smouldering fires in peatlands involve the burning of ancient (up to >10 000 years) carbon (Rein 2013; Archibald et al. 2017). The sheer volume of carbon being emitted from peat fires contributes greatly to greenhouse gas (GHG) emissions to the atmosphere, accelerating climate change. Warmer climates at a global scale will have the most pronounced effect on peatlands that have been impacted by anthropogenic activities (i.e. where hydrology, vegetation cover, etc., have been modified). The warmer climate will also lead to more frequent and more extensive smouldering fires from areas where warmer and drier peatlands are induced (Rein 2013). This is because smouldering ignition and self-heating are known to have a strong dependence on peat moisture and temperature (Rein et al. 2008; Drysdale 2011; Huang and Rein 2015, 2017; Huang et al. 2016). Drying as a result of climate change and human activities has raised questions regarding the vulnerability of peatlands to fire (Rein 2013; Turetsky et al. 2014). In addition, more frequent flaming wildfires under warmer climates will lead to more frequent residual smouldering peat events (Flannigan et al. 2009). As a result, peat fires form a positive feedback within the climate system, a self-accelerating process (Rein 2013).
Pollutant emissions
Peat fire emissions are a rich and complex mixture of gases (more than 100 detectable gas species) and aerosols (Stockwell et al. 2014, 2015, 2016; Hatch et al. 2015). The trace gas species detected during peat fire events mainly comprise CO2, CO, CH4, HCN, NH3 and a series of alkanes (ethane, propane and butane), alkenes (e.g. ethylene, propylene), aldehydes (formaldehyde, acetaldehyde, glycolaldehyde) and other organic compounds (methanol, acetic acid, furan, etc.) (Yokelson et al. 1997; Christian et al. 2003; Wilson et al. 2015; Stockwell et al. 2014). The sum of CO2 and CO comprises the largest mass or mole fraction of emissions from peat fires (alongside water vapour). A detailed characterisation of the emission species can be found in Hatch et al. (2015) and Stockwell et al. (2015). Among all the gaseous species, CO2 and CH4 are significant sources of GHGs, while trace gases including CO, NH3 and the other non-methane organic compounds (NMOCs) play a main role in radiative forcing through their photochemical processing. These trace gases can impact atmospheric levels of CO2, CH4, tropospheric O3, and PM (Urbanski 2014). PM derived from peat fires varies greatly in size, ranging from nanoscale ultrafine fraction UFP to microscale PM1 (particles with an aerodynamic diameter ≤1.0 μm), PM2.5, PM10, and TSP.
Although peat fires contribute a large fraction of atmospheric pollutant emissions, they have not been explicitly considered in most of the previous studies of biomass combustion emissions (IPCC 2006; Yokelson et al. 2008; McMeeking et al. 2009; Wilson et al. 2015). Specifically, this section comprises a review of the emissions from peat fires; an up-to-date and comprehensive compilation of gas and PM emission factors (EFs) from both laboratory experiments and field measurements available in peat fire emission studies (all EFs are categorised into and compared between boreal and temperate peat, and tropical peat); and a discussion of the uncertainties in peat fire emission estimates.
Emissions and emission factors
Inventories of biomass fire emissions are an essential input for atmospheric chemical transport models, used to understand the influence of fire emissions on the atmosphere and climate change (Urbanski 2014). Overall, there are two different groups of methodologies for calculating total emissions from biomass fires: top–down and bottom–up approaches. Top–down approaches generally utilise satellite atmospheric emission observations in combination with modelling techniques to derive total emission estimates (Page et al. 2002; Huijnen et al. 2016). For bottom–up methods, information regarding the individual components that contribute to the total amount of fuel burned, and the amount of gas emitted per unit of burned fuel are used to approximate the total emissions (IPCC 2006) (Eqn 1).

where, for any given emission species, ET is the total emission from biomass fires, usually expressed in the form of emission mass flux; A is the annual burnt area (m2 year−1), B is the fuel load (g dry matter m−2), C is the burning efficiency (sometimes called the combustion completeness), and EF is the emission factor, defined as the mass of the species emitted per mass of dry fuel consumed, usually expressed in units of grams per kilogram (Urbanski 2014).
Most total emissions studies focus on carbon emissions flux (mC, equivalent carbon mass per unit area), as substantial carbon losses from the terrestrial carbon reservoir are of great importance in terms of global carbon budgets and climate change (Rein 2013; Turetsky et al. 2014). Established approaches for estimating total carbon emissions from peat fires relied on direct field-based measurement campaigns, where information including peat bulk density, moisture content and depth of burn were used to estimate the carbon emission fluxes during a specific peat fire episode. Benscoter and Wieder (2003) found that the boreal western Canadian peatlands have an average carbon emission of 2.1 ± 0.4 kg carbon m−2. They also provided a summary of carbon emissions from early boreal region peat combustion studies using both field measurements and remote sensing data. Davies et al. (2013) surveyed a temperate peatland fire episode in the Scottish Highlands during the summer of 2006 and estimated that average carbon emissions reached 9.6 ± 1.5 kg carbon m−2. Davies et al. (2013) summarised peat fire carbon emission fluxes obtained from different field-based estimates, finding that drained boreal peat fire carbon emissions can reach 16.8 kg carbon m−2 (Turetsky et al. 2011), while maximum tropical peat fire carbon emissions have been reported up to 31.5 kg carbon m−2 (Page et al. 2002).
The development of satellite remote sensing algorithms and products has enabled the provision of estimates of global or regional peat fire emissions on an annual basis. Page et al. (2002) estimated that the 1997 Indonesian forested peatland fires emitted between 0.81 and 2.57 Gt carbon. This was equivalent to 13–40% of mean annual global carbon emissions from fossil fuels. Poulter at al. (2006) proposed that temperate peatland fires may emit up to 0.32 Gt of carbon during drought years. van der Werf et al. (2008) looked into fire emissions from Indonesia, Malaysia and Papua New Guinea during 2000–06 and found that average fire emissions (peat fires, forest fires, etc.) from the region reached 0.128 ± 0.051 Gt carbon year−1. van der Werf et al. (2010) revealed that during 1997–2009, carbon emissions from tropical deforestation, degradation and peatland fires were on average 0.5 Gt carbon year−1, while tropical peat fire contributed to 3% of global fire emissions from 2001 to 2009. Huijnen et al. (2016) estimated that the total carbon released by the 2015 south-east Asia peatland fires was 0.227 ± 0.067 Gt; the daily 0.0113 Gt CO2 emissions during the fire episode exceeded the fossil fuel CO2 release rate of the European Union (0.0089 Gt CO2 day−1). In recent work by van der Werf et al. (2017), it is estimated that the carbon emissions from peat fire contribute 3.7% of the global fire emissions estimates during 1997–2016.
In addition to the emission fluxes approaches discussed above, a different approach for quantifying peat fire emissions is to measure the mass concentration (usually expressed in the units of milligram per cubic metre or microgram per cubic metre) of different emission species during a specific peat fire episode. For example, Muraleedharan et al. (2000a) reported the concentration of both PM10 and a series of VOCs during the 1998 Brunei haze episodes evolved from local peat fires. Fujii et al. (2014) found that PM2.5 aerosols emitted from the 2012 Sumatra peatland fire were at high concentrations of 7120 ± 3620 µg m−3. These peat fire emission concentrations data are widely used in public haze health impact studies (Koplitz et al. 2016).
Characterisation of EFs is critical for the calculation of total peat fire emissions, and to determine their impacts in the context of global climate change. EF for species i can be calculated with Eqn 2:
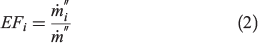
where  is the mass flux of the released species i and
  is the total mass loss rate (fuel consumption rate) of the dry fuel.
Among the studies to reveal the importance of biomass fire emissions, Andreae and Merlet (2001) and Akagi et al. (2011) compiled the biomass burning EFs (which include peat fires) from previous studies. Their synthesised EFs are widely used as the recommended EFs in the atmospheric modelling community to calculate total fire emissions such as Global Fire Emissions Database (GFED), a global fire emissions database that provides the estimates of fire emissions from different areas and time periods (van der Werf et al. 2010, 2017). With more attention paid to peat fire emissions, more gas and particle EFs have been reported from both laboratory and field measurements in recent years. In the next two subsections, we provide an up-to-date and comprehensive compilation of inter-study peat fire gas and particle species EFs. According to the geographical origins of the peat used in fire emission studies, we classified the samples into two categories: boreal and temperate peat (we merge these two climate zones into one category owing to the limited sampling location information reported in the literature), and tropical peat. It is worth noting that the separation of boreal and temperate peats from tropical peats is based only on data reported in studies of peat combustion or peat fire emissions. By doing this, in the following sections, the best estimate peat fire EFs were calculated and compared between the two peat categories for the first time.
Owing to the different forms of the EFs reported in the peat fire emission studies (for example, Christian et al. (2003) reported study-averaged EF means, Geron and Hays (2013) reported the EFs as a range, whereas other studies reported both study-averaged EF means and their variability – usually expressed in standard deviation), a reasonably simple approach was adopted in the present paper to conservatively estimate the overall EFs for each species in a peat category (boreal and temperate-, or tropical). When the variability is not given in the original data, a general range of 20–50% of the EF mean is assumed. For EFs reported in ranges, the mean and variability are calculated from the data provided by the authors (e.g. Geron and Hays 2013). We assumed different studies were independent random variables that were normally distributed. Based on this assumption, the overall EFs of different peat categories shown in the present paper are reported in the form of inter-study EF mean ± variability (variability is defined as the inter-study standard deviation). Inter-study EF means are calculated by averaging the mean EFs for each study; for variability, we first summed the EF variances (square of standard deviation) of each study, and then divide them by the number of studies. Next, we took the square root of the averaged variance to derive the inter-study standard deviation for a peat category. By doing this, the EF variability within each peat fire emission study was included in calculating the overall inter-study EF variability.
Gas species EFs
In this subsection, EFs of peat fire gas species that are commonly reported in the literature (19 species) are compiled in Table 1 and compared with savanna-burning EFs from Akagi et al. (2011) in Fig. 4 (left). Compared with smouldering-dominated peat fires, the majority of biomass in a savanna fire is consumed by flaming combustion. Generally, peat fires have higher EFs of incomplete combustion products like CO and CH4 than flaming savanna fires owing to departure from stoichiometric combustion (Rein 2015). Peat fires emit significant amounts of CO2 and CH4, with the potential to shift peatlands from being a major atmospheric and terrestrial carbon sink to becoming a major GHG emission source (Turetsky et al. 2014). Smouldering peat fire EFs of HCN and NH3 are approximately 10 times those for flaming savanna fires; these two species are thought to be primarily emitted by smouldering and not flaming combustion, and were therefore proposed as atmospheric tracers for peat fires (McMeeking et al. 2009; Akagi et al. 2011). As a result, CO2, CO, CH4, HCN and NH3 are selected as the main characteristic peat fire gas species analysed in this review.

|

|
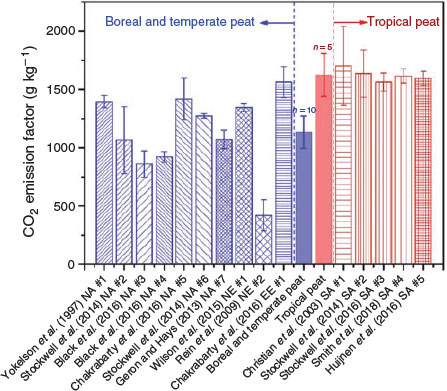
CO2 is the dominant gas species released during a peat fire event, with EFs reported in the order of 103 g kg−1. Fig. 5 shows CO2 EFs from peat burning available in the literature. The largest CO2 EF value (1703 g kg−1) was reported from the burning of south Sumatra tropical peat (Christian et al. 2003), whereas the smallest value of CO2 EFs in the literature (149–185 g kg−1) was reported from the combustion of Brunei peat (Muraleedharan et al. 2000b). Given that this unusually low EF range was derived from peat thermodecomposition rather than open combustion, this EF is not included in our compilation. Comparatively, tropical peat fires emit higher amounts of CO2 with an average EF of 1615 g kg−1 (n = 5, where n is the number of studies), whereas boreal and temperate peat fires have an average CO2 EF of 1134 g kg−1 (n = 10).
|
CO is the second most predominant gaseous species emitted during peat fire events. Compared with flaming biomass, smouldering peat has a much higher CO EF; the highest value of CO EF (291 g kg−1) reported in the literature comes from a peat fire field measurement (Stockwell et al. 2016). This may be explained by the predominance of incomplete smouldering combustion in peat fires, from which CO emissions are more predominant (Rein 2015). Similarly to CO2, tropical peat fires emit higher amounts of CO, with an average EF of 248 g kg−1 (n = 5), whereas boreal and temperate peat fires have an average CO EF of 179 g kg−1 (n = 10). Peat fires EFs of CO from different studies are summarised in Fig. S1 available as Supplementary Material to this paper.
The third most abundant compound in peat fire emissions is methane (CH4). CH4 EFs from peat fires are approximately two times higher than those for tropical forest fires, and are almost six times higher than savanna fire EFs (Akagi et al. 2011). Consistent with CO2 and CO, tropical peat fires are found to emit more CH4 per unit mass of dry fuel burned (12.3 g kg−1, n = 5) than boreal and temperate peat fires (8.1 g kg−1, n = 4).
The EFs for CH4, HCN and NH3 from peat fires are summarised in Figs S2–S4. To summarise, by categorising the peat into tropical peat and boreal and temperate peat, it is found that tropical peat fires have overall larger EFs of main gas species (CO2, CO, CH4, HCN and NH3) than boreal and temperate peat fires (Fig. 4).
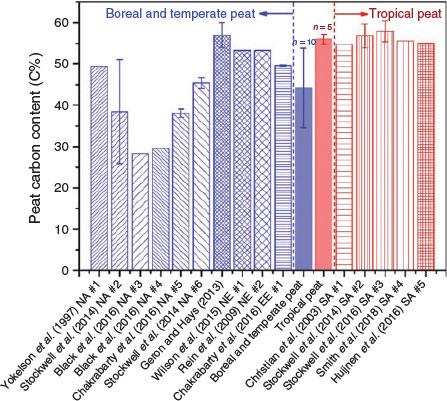
The carbon content of peat, which is of critical importance in terms of the carbon emissions, varies among different locations and climate zones. Several non-fire studies provide comprehensive and systematic databases of soil carbon (which includes peat soil). Page et al. (2011) briefly reviewed peat soil carbon and found that the carbon content of south-east Asian peat is in the range of 41.6 to 62%. Liu et al. (2013) provided a unified North American soil map, where they assumed that soil organic carbon accounts for 58% of soil organic matter. Consistent with peat classification ruled for EF compilation, for this review, we rely mostly on peat carbon content measurements associated with peat combustion or peat fire emissions to classify and compare the peat carbon content. Our comparison shows that by contrast, tropical peat has an average carbon content of 56.0% (n = 5), whereas the boreal and temperate peat samples have a lower average carbon content of 44.2% (n = 10) (Fig. 6). To summarise the peat carbon content associated with fire emission studies, we first investigate the correlation of peat carbon content with the corresponding inter-study EFs of CO2 and CO, the most abundant carbon-containing gas species from peat fires.
|
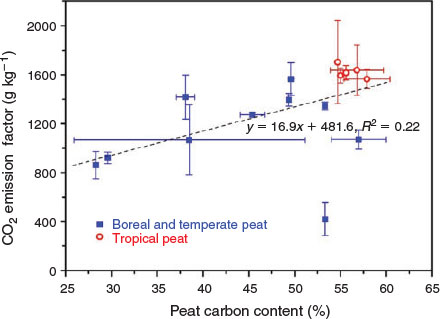
Fig. 7 reveals a positive correlation between the carbon content of the peat and the CO2 EFs, with higher peat carbon contents associated with higher CO2 EFs. CO2 is the main product of complete combustion and, taking into account that it is formed by one atom of carbon and two of oxygen, its formation directly depends on the availability of both elements. Compared with boreal and temperate peat, tropical peat samples have higher carbon content, and as such will produce higher CO2 emissions per unit of dry fuel mass. As observed for CO2 emissions, the carbon content is positively correlated with CO EFs (Fig. S5). Tropical peats have higher carbon content, emitting more CO on average, possibly owing to the same reasons as explained above for CO2.
|
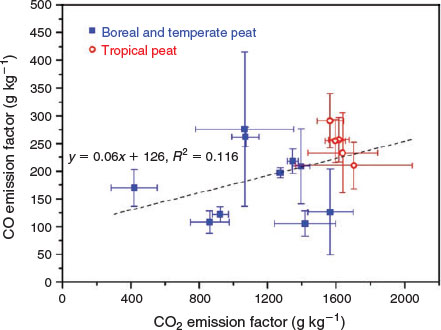
Regarding the relationships between different gas species EFs, CO EFs from tropical peat fires showed a negative correlation with CO2 EFs, whereas the relationship in boreal and temperate peat remains inconclusive (Fig. 8). The relationships between CO2 EFs and the EFs of CH4, HCN and NH3 are depicted in Figs S6–S8. The relationships remain inconclusive for most of the gas species, possibly owing to the limited amount of available data reported in the literature. For example, there are only four studies that have quantified CH4, HCN and NH3 EFs from boreal and temperate peat fires, and only four HCN and NH3 EF values are reported for tropical peat fires.
|
Generally, the EFs of all other trace gases (gas species listed in Table 1, exclusive of CO2, CO, CH4, HCN and NH3) are below 10 g kg−1 and most of them are NMOCs, which can influence secondary organic aerosol and ozone formation (Akagi et al. 2011). However, most NMOCs are reactive, and it is still challenging to identify and quantify all trace gas species properly. Additional studies measuring peat carbon content and emissions and advanced gas species detection technologies could improve their incorporation into EF quantification.
Particle EFs
Research focusing on PM emissions from wildland fires, especially smouldering peat fires, is limited. Tissari et al. (2008) found that for smouldering combustion, PM1 yields were six times those from flaming combustion. Iinuma et al. (2007) found that peat burning yields significantly higher PM2.5 emissions in comparison with other biofuels (softwood, hardwood and grass). Tropical peat fires can emit 3–6 times as much PM as grassland, forest or plantation fires per unit carbon combusted (Turetsky et al. 2014).
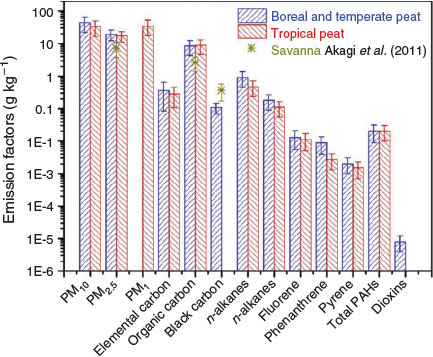
In this subsection, we have compiled the EFs for PM (PM10, PM2.5 and PM1) reported in peat fire emission studies (Table 2). Geron and Hays (2013) found that most peat smoke particles are in the PM2.5 size range. Reported peat fire PM2.5 EFs in the literature vary from 5.9 g kg−1 (Black et al. 2016) to 44.5 g kg−1 (Geron and Hays 2013). Fig. 9 provides a comparison of PM EFs for both boreal and temperate peat and tropical peat fires, with flaming savanna EFs from Akagi et al. (2011) for contrast. Generally, peat fires emit larger quantities of PM2.5 than flaming savanna (averaged PM2.5 EFs for all types of peat fires and savanna burning are 18.7 and 7.17 g kg−1 respectively). In comparison, boreal and temperate peat fires emit slightly more PM2.5 (EF = 19.17 g kg−1, n = 3) than tropical peat fires (EF = 17.3 g kg−1, n = 1), although the number of studies is low. This variation may partly be caused by differences in the carbon content of the peat samples and the PM EF determination method used in each study. It is clear that there is a serious shortage of PM EFs, especially for tropical peat fires; additional thorough peat fire PM studies are required to fill this knowledge gap.

|
|
Organic carbon (OC) constitutes the main component of PM2.5, accounting for 71% of PM2.5 aerosols in a study of a Sumatran peat fire (Fujii et al. 2014). Black carbon (BC), a major component of soot and an important compound for atmospheric warming owing to its low albedo, is present only in trace amounts (~0.1 g kg−1) in boreal and temperate peat fires. There is no available BC EF data for tropical peat fires. A recent study showed that aerosols emitted from the burning of Alaskan and Siberian peatlands are predominantly brown carbon (BrC), a class of visible-light-absorbing OC, with a negligible amount of BC (Chakrabarty et al. 2016). Although BrC is very unsteady and can be lost quickly through chemical loss and evaporation, it can amplify the warming effects of BC emitted from these fires (Forrister et al. 2015). However, it is noticeable that OC is light-scattering in nature; it can offset the warming effects of GHGs and BC. Therefore, the co-existence of OC, BC and BrC complicates assessing radiative impacts and adds large uncertainties to the atmospheric feedback from peat fire PM emissions (Chakrabarty et al. 2016).
A range of VOCs including BTEX (benzene, toluene, ethylbenzene and xylene) and PAHs can also be enriched in the PM (Durán et al. 2014). Specifically, PAH emissions from boreal and temperate peat fires were dominated by naphthalene, fluorene and phenanthrene (Black et al. 2016). Black et al. (2016) found that dioxins, a group of toxic compounds, can also be produced from peat fires. The polychlorinated dibenzodioxins and dibenzofurans (PCDD-F) EFs (8.1 ng kg−1) from boreal and temperate peat are noticeably higher than the EFs from other various biomass types. No dioxin EFs from tropical peat fires are reported in the literature.
Uncertainties in peat fire EF determination and total emission estimates
Theoretically, EFs can be calculated by using species mass flux and dry fuel mass loss rate (Eqn 2); however, the mass loss rate is difficult to obtain under most measurement conditions, especially for field measurements (Huijnen et al. 2016; Stockwell et al. 2016; Smith et al. 2018). As a result, a carbon mass balance approach is widely used to calculate the EFs from peat fires. This approach utilises the fuel carbon content and the amount of carbon species released to approximate the fuel consumption rate (Eqn 3) (Yokelson et al. 1997; Christian et al. 2003; Stockwell et al. 2014; Wilson et al. 2015):
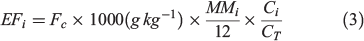
where Fc is the measured carbon content of the peat, MMi is the molar mass of species i, Ci is the number of moles of species i; CT is the total number of moles of carbon emitted.
Detailed different forms of calculating gas species EFs by using the carbon balance approach (e.g. calculating directly from species excess mole fractions or emission ratios) are summarised in Paton-Walsh et al. (2014). Particle EFs are generally determined by representative PM sampling and gravimetric analysis (Black et al. 2016). There are inherent advantages and uncertainties rooted in both laboratory experiments and field measurements for calculating EFs for peat fires. The availability of advanced gas identification techniques and instrumentation (e.g. high-resolution proton-transfer-reaction time-of-flight mass spectrometry and two-dimensional gas chromatography–time-of-flight mass spectrometry) in laboratory studies enables best practice for the identification of the gas species present in peat smoke (Hatch et al. 2015; Stockwell et al. 2015). However, any peat samples used for laboratory tests or peat in situ in field measurements have an inherent inhomogeneity in composition (e.g. carbon content, moisture content), cracks and gas permeability. Owing to the complexity of the peat burning environment, challenges remain in terms of how to scale up the EFs derived from laboratory fires to a natural peat fire.
Stockwell et al. (2016) provide the best available EF for peat fires from field measurements. However, the transient emission composition and concentration from field measurements are highly dependent on the combustion efficiency and sampling environment (e.g. wind and smoke aging) (Akagi et al. 2011). Many species emitted from peat burning are unidentified and semivolatile, rendering them very difficult to quantify by field-based techniques. Furthermore, when using the carbon balance approach in calculating the EFs from field measurements, the large natural peat carbon variations that cannot be measured in field studies can become an issue affecting the emission estimation results. The variability of peat carbon content from small-scale laboratory studies (for example, 56.0% for tropical peats vs 44.2% for boreal and temperate peat, discussed above) needs to be taken into consideration when applying the EFs to total peat fire emissions estimates. Careful comparison and synthesis of controlled laboratory results with field measurements have a key role in improving the accuracy of EF determinations into the future (Akagi et al. 2011).
Importantly for total fire emission estimates for use in atmospheric modelling, peat must not be considered as a one-dimensional surface ground fuel owing to its uneven depth distribution in natural peatlands (Page et al. 2011). Smouldering peat fires are a multidimensional phenomenon. They can burn deep into underground peat layers, resulting in variable burn depth within a single fire episode or among the recurrent fires at the same location (Lukenbach et al. 2015; Konecny et al. 2016). Given that peat fires tend to keep smouldering underground without becoming outwardly apparent on the surface, fire ‘hotspot’ and burnt area remote sensing detection technologies developed from studies of flaming combustion become ineffective and produce large uncertainties when applied to smouldering peat fires (Rein 2013). To summarise, unavoidable uncertainties exist in this application; significant advances could be achieved by improved detection technologies and more extensive research in this area.
Combustion regimes, ‘combustion efficiency’ and ‘modified combustion efficiency’
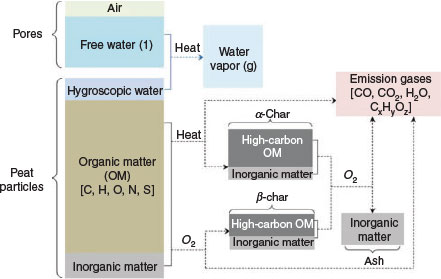
Emissions from peat fires are highly dependent on the combustion regime. There are four different sub-fronts in a smouldering fire: preheating, drying, pyrolysis and oxidation (Rein et al. 2009). The preheating front, occurring in a range of temperatures up to 100°C, emits water vapour in large quantities and is not involved in chemical reactions (some volatiles may also be released at this stage but are in trace amounts) (Usup et al. 2004; Rein et al. 2009; Yang et al. 2016). At temperatures above 200°C, pyrolysis dominates. Subsequent heating above this temperature increases the pyrolysis rate, forming carbonaceous char as a product. In this front, peat emits VOCs, PAHs, trace levels of CO, CO2 and water vapour (Usup et al. 2004; Yang et al. 2016). Peat oxidation starts at temperatures of ~350°C and is the main source of CO and CO2 (Rein et al. 2009). It produces a layer of ash as solid residue. This oxidation front could overlap with the pyrolysis front, depending on oxygen availability (Fig. 10). Rein et al. (2009) verified that by changing the combustion dynamics (heat losses and oxygen supply), the emissions from peat burning vary significantly. This section provides a critical review of the validity of the indices available to quantify the combustion regime that are widely used in wildfire emission studies.
|
Combustion efficiency (CE) is defined as the fraction of fuel carbon converted to CO2 and it indicates the completeness of a combustion process (Ward and Hardy 1991). Compared with flaming, smouldering combustion has lower combustion efficiency due to the predominant incomplete combustion (Rein 2015). Based on their seven fuel types test results, Ward and Hardy (1991) suggested that smouldering and flaming fires can be easily differentiated by the CE: values of CE from 50 to 80% are characteristic of smouldering fires, whereas values from 80 to 95% represent flaming fires.
The main disadvantage of determining CE is that it requires the measurement of all the carbon released, including CH4, NMOC and PM, which is impractical under most field and laboratory conditions. As a solution, Ward and Hao (1991) defined a parameter named modified combustion efficiency (MCE) as a substitute for CE (Eqn 4):

where  is the mass of carbon emitted as CO2, and
  is the mass of carbon emitted as CO. However, the most cited paper in terms of the historical origin of MCE is the one written by Ward and Radke (1993), which recommended the use of MCE in correlating carbon emissions to combustion regimes. Using previous field and laboratory measurement results dating back to the 1980s (for example, Ward and Hardy (1984) found that CO2 and CO comprise ~95% of the total carbon emissions for most fire types) (Ward and Hardy 1991), MCE was found to be linearly correlated with CE (Eqn 5) and was used as an independent variable to model the release of carbon-containing combustion products (Ward and Hao 1991):

For practical measurement purposes, MCE was used in correlating species EFs instead of CE during biomass fire studies, from which Eqn 6 is used to calculate MCE (Yokelson et al. 1996):

where the term MCEΔ represents the MCE reported from literature (calculated with Eqn 6); excess mixing ratio (EMR) is defined as the mole ratio of species X in smoke minus its mole ratio in background air (Xsmoke – Xbackground). The EMR of X is often denoted by ‘ΔX’ (Akagi et al. 2011): ΔCO2 is the EMR of CO2; ΔCO is the EMR of CO.
Yokelson et al. (1997) built on MCEΔ as an index of the relative amount of flaming and smouldering in biomass fires. Since then, MCEΔ has been widely used with this objective and it has been regarded as an authoritative index to determine the importance of flaming or smouldering in a fire (Christian et al. 2003; Stockwell et al. 2014; Urbanski 2014; Wilson et al. 2015). It is believed that pure flaming combustion presents an MCEΔ of 0.99 (Akagi et al. 2011; Stockwell et al. 2014); in contrast, the MCEΔ of smouldering widely differs in the literature (Urbanski 2014). For example, Stockwell et al. (2016) proposed that an MCEΔ ~0.75 to 0.84 designates pure biomass smouldering. Akagi et al. (2011) summarised that smouldering MCEΔ ranges from ~0.65 to 0.85 but most often is near 0.8, whereas an overall MCEΔ near 0.9 suggests approximately equal amounts of flaming and smouldering.
The relationships between real-time MCEΔ and the real-time EFs of the biomass fire emission have received some attention in the literature. MCEΔ is found to be linearly correlated with the EFs for many compounds (for example, CH4, CH3OH and CH3COOH) during the combustion of fine fuels (savanna fires) with a high MCEΔ value (>~0.9) (Christian et al. 2003; Stockwell et al. 2014; Urbanski 2014). This dependence allows the calculation of the EFs of a specific species under a specific MCEΔ. Meyer et al. (2012) found that for tropical savanna fires with a larger range of MCE (~0.7 to 0.99), an exponential relationship provides a better empirical description (R2 = 0.74) between MCE and CH4 EFs. However, during the measurements of smouldering fires, little or no dependence of EFs on MCE was observed (Akagi et al. 2011; Burling et al. 2011; Stockwell et al. 2016; Smith et al. 2018).
In practice, fire-averaged MCEΔ are reported in the literature to represent the overall combustion regime of a peat fire. Fig. 11 shows the relationship between the fire-averaged MCEΔ and the corresponding reported EF values of CO2, CO and CH4 listed in Table 1. There is no significant difference in MCEΔ between boreal and temperate peat, and tropical peat. A larger MCEΔ implies more complete combustion, which means CO2 EFs are expected to be higher; however, almost no correlation exists between MCEΔ and CO2 EFs (R2 = 0.045) in Fig. 11a. MCEΔ and the EFs of CO and CH4 correlate poorly (R2 for MCEΔ and CO EFs, and CH4 EFs are 0.003 and 0.06 respectively) (Fig. 11b, c). Owing to the limited amount of studies reporting EFs of HCN, NH3 and other trace gases in the literature, the relationships between MCEΔ and the EFs of those species are omitted here. This is the first time that relationships between inter-study MCEΔ and the EFs of CO2, CO and CH4 have been investigated. Based on the result, we confirm that EFs for smouldering peat fires are poorly correlated with MCEΔ, and that a new proxy is needed to describe the relationship between combustion regimes and emissions.

|
According to Eqn 2, EF is derived from the mass of species emitted per mass of dry fuel consumed. Factoring the original definition of MCE (Ward and Hao 1991), it can be alternatively calculated with the EFs of CO2, CO and their molar mass (Eqn 7):

where EFCO2 and EFCO are the EF of CO2 and CO, MMCO and MMCO2 are the molar mass of CO2 and CO.
Here we introduce the term ‘MCEEF’, which stands for the MCE calculated with EFs. As can be seen in Fig. 12, compared with MCEΔ, MCEEF correlates better with EFs of CO2 and CO from peat fires listed in Table 1. MCEEF and CO2 EFs show a positive correlation (R2 = 0.40). In contrast, MCEEF and CO EFs show a negative correlation (R2 = 0.2). These correlation results correspond to the rationale that more complete combustion emits more CO2 but less CO. There is no correlation between MCEEF and the EFs of CH4 (R2 = 0.08).

|
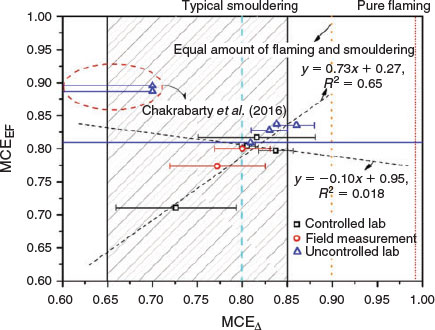
Ideally, in spite of the different expressions, MCEEF and MCEΔ should have a strong correlation with each other, as both variables are representative of CE (Ward and Hao 1991; Ward and Radke 1993). The relationship between MCEEF and MCEΔ is shown in Fig. 13. Given the experimental methods reported in the literature, we have arranged the data according to three different types of peat fire EF measurement conditions: controlled laboratory conditions; uncontrolled laboratory conditions and field measurements. Controlled laboratory conditions use preconditioned moisture content peat that is ignited in a controlled manner to ensure a smouldering combustion process (Rein et al. 2009; Stockwell et al. 2014; Wilson et al. 2015), whereas uncontrolled laboratory conditions utilise strong flames or a pilot igniter to initiate the burning of peat (Yokelson et al. 1997; Christian et al. 2003; Black et al. 2016; Chakrabarty et al. 2016). Field measurements unavoidably entail a mixture of peat fire and the burning of aboveground vegetation (Geron and Hays 2013; Huijnen et al. 2016; Stockwell et al. 2016; Smith et al. 2018). As can be seen from Fig. 13, peat fire MCEΔ are generally lower than 0.85, suggesting a smouldering-dominant combustion regime. However, variations of MCEΔ are substantial, especially under the uncontrolled laboratory environment. MCEΔ and MCEEF showed almost no correlation (R2 = 0.018), possibly due to two significantly deflected data points reported by Chakrabarty et al. (2016) as a MCE of less than 0.7, without reporting any exact value. Stockwell et al. (2014) presented a significant uncertainty of MCE (the longest error bars shown in Fig. 12) in the measurement reported by Yokelson et al. (1997). When excluding the deflected data from Chakrabarty et al. (2016), MCEΔ and MCEEF show good correlation (R2 = 0.65). As pointed out in Ward and Hao (1991), although the MCE measurement provides insight regarding the completeness of the combustion process, it does not explain the variances. MCEΔ is highly sensitive to uncontrolled variables, and more well controlled measurements are needed to verify the validity of its use as a universal criterion to determine the combustion regime of a peat fire.
|
Factoring all trace gas species, a parameter named ‘CEEF’ is defined as the mass of carbon emitted in the form of CO2, divided by the mass of carbon emitted as the carbon-containing species reported in peat fire emission studies. Similarly to Eqn 7, the CEEF can be calculated from the EFs of all the carbon-containing species reported in the literature and the molar mass of each species (Eqn 8):
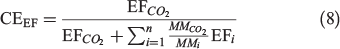
where EFi is the EF of carbon-containing species i; MMi is the molar mass of carbon-containing species i. For practical purposes, here we employ the carbon-containing species listed in Table 1 (CO2, CO, CH4, C2H2, C2H4, C2H6, C3H6, CH3OH, HCHO, CH3CHO, C2H4O2, HCOOH, CH3COOH, C4H4O and HCN) to calculate the ‘best-approximate CE’ (CEEF) in peat fire emission measurements.
Although the CEEF is not identical to CE (the accurate calculation of CE requires the EFs of all species including NMOC and PM, which has never been done with current analysis methods), in theory it is closer to CE than MCE, owing to its consideration of a larger number of carbon-containing species (MCE only considers CO2 and CO). In the present work, CEEF is also used to correlate with the EFs of CO2, CO and CH4. Surprisingly, the R coefficient between CEEF and CO2 EFs decreases to 0.274 (Fig. 14a), meaning that it is a poorer correlation than MCEEF. This result is unexpected as the CEEF is thought to indicate the completeness of a combustion process better than MCE (Ward and Hao 1991). However, when using CEEF to correlate with CO EFs, it reveals a better R coefficient than MCEEF (R2 = 0.298) (Fig. 14b). CEEF and peat fire CH4 EFs are found to be uncorrelated (R2 = 0.003) (Fig. 14c).

|
To summarise, the correlation existing between CO2 EFs and MCEEF (R2 = 0.397), CEEF (R2 = 0.274) and MCEΔ (R2 = 0.045) successively decreases; as for CO, the highest correlation observed is between CO EFs and CEEF (R2 = 0.298), followed by the one observed with MCEEF (R2 = 0.201) and MCEΔ (R2 = 0.003). Regarding CH4 EFs, the highest correlation is the one observed with MCEEF (R2 = 0.08), the second highest is the one with MCEΔ (R2 = 0.06), and the last one observed with CEEF (R2 = 0.003), indicating that the peat fire CH4 EFs are correlated with neither MCE nor CE. The variation of these correlations shows that the validity of CEEF and MCEEF is inconclusive, and not as good as it is assumed in the literature. As a result, we believe that currently no single parameter is capable of describing accurately the relationship between the combustion regime and comprehensive emissions from smouldering peat fires. Therefore, more studies investigating the effect of combustion dynamics are needed.
Conclusions
This paper provides the first review of fire emissions for smouldering peat, and their contribution to haze events. Smouldering peat fire is an incomplete combustion process and generates weak buoyant smoke plumes that accumulate near the ground. Substantial quantities of pollutants emitted from these fires lead to acute and recurrent regional haze episodes, especially in south-east Asia, Russia and the USA. Haze induces air quality deterioration, transportation disruption, impaired visibility and vast economic losses. It also carries broad negative health effects, predominantly to the respiratory and cardiovascular systems.
Overall, research investigating emissions from peat fire is limited to a handful of laboratory and field studies. The relationships between peat fire emissions and the combustion dynamics associated with fire evolution remain poorly understood. Our up-to-date compilation of inter-study gas species and PM EFs reveals that there is large variability of EFs among the literature: tropical peat fires exhibit larger EFs for the prominent gas species (CO2, CO, CH4, HCN and NH3) than those from boreal and temperate peat fires, whereas boreal and temperate peat fires have slightly higher PM2.5 EFs (19.2 g kg−1) than tropical peat fires (17.3 g kg−1). We conclude that this EF variability is mainly attributable to the variations of carbon content between tropical peats (56.0%) and boreal and temperate peats (44.2%), together with the complex combustion dynamics.
The discussion of the uncertainties of peat fire emission indicates that laboratory-based techniques enable the thorough detection of species that are present in the peat fire emissions (more than 100 gas species), while uncertainties remain in terms of scaling up the EFs derived from laboratory experiments and applying to total fire emission estimation. In contrast, given the complexity of natural fires, field measurements provide the best available EFs for peat fires. However, high uncertainties are introduced in these EFs owing to the limitation of field-based techniques. The variability in the fuel carbon content needs to be taken into consideration when applying the carbon balance approach to calculate field-based EFs; additional field studies measuring the carbon content across the regions of interest are required. This allows the conclusion that the combination of controlled laboratory experiments with field measurements helps minimise the large uncertainties that exist in peat fire EF quantification and total emission estimates.
The review of MCE, a parameter widely used in biomass fire combustion regime determination, shows that it is often misunderstood and highly sensitive to several uncontrollable variables. The validity of MCE, MCEEF (calculating from the EFs of CO2, CO and their molar mass) and CEEF (calculating from the EFs of all the carbon-containing species reported in the literature and the molar mass of each species) in correlating EFs for smouldering peat fires is inconclusive. There is a lack of a clear smouldering combustion signature in the literature, emphasising the importance of more studies investigating peat combustion dynamics.
Although international efforts such as haze control agreements have been made, regional haze episodes as a result of peat fires still remain an unresolved environmental and health crisis. Given the massive impact of haze episodes, more experimental and theoretical studies and a multidisciplinary research approach to smouldering peat fires are needed to develop both fundamental understanding and provide technological solutions to these overlooked fires and their associated haze phenomena.
Conflicts of interest
The authors declare they have no conflicts of interest.
Acknowledgements
The research was funded by the China Scholarship Council (CSC) and the European Research Council (ERC) Consolidator Grant HAZE (682587). The authors thank Eirik Christensen and Dr Francesco Restuccia from Imperial College London for valuable discussions. Data supporting this publication can be obtained from Hu Y and Rein G (2018) Review of emissions from smouldering peat fires [Data set]. Zenodo. http://doi.org/10.5281/zenodo.1216074 (Verified 10 April 2018).
References
Akagi SK, Yokelson RJ, Wiedinmyer C, Alvarado MJ, Reid JS, Karl T, Crounse JD, Wennberg PO (2011) Emission factors for open and domestic biomass burning for use in atmospheric models. Atmospheric Chemistry and Physics 11, 4039–4072.| Emission factors for open and domestic biomass burning for use in atmospheric models.Crossref | GoogleScholarGoogle Scholar |
Andreae MO, Merlet P (2001) Emission of trace gases and aerosols from biomass burning. Global Biogeochemical Cycles 15, 955–966.
| Emission of trace gases and aerosols from biomass burning.Crossref | GoogleScholarGoogle Scholar |
Archibald S, Lehmann CE, Belcher C, Bond WJ, Bradstock RA, Daniau AL, Dexter K, Forrestel EJ, Greve M, He T, Higgins SI (2017) Biological and geophysical feedbacks with fire in the Earth system. Environmental Research Letters 13, 033003
Benscoter BW, Wieder RK (2003) Variability in organic matter lost by combustion in a boreal bog during the 2001 Chisholm fire. Canadian Journal of Forest Research 33, 2509–2513.
| Variability in organic matter lost by combustion in a boreal bog during the 2001 Chisholm fire.Crossref | GoogleScholarGoogle Scholar |
Bertschi I, Yokelson RJ, Ward DE, Babbitt RE, Susott RA, Goode JG, Hao WM (2003) Trace gas and particle emissions from fires in large-diameter and belowground biomass fuels. Journal of Geophysical Research, D, Atmospheres 112, D03307
| Trace gas and particle emissions from fires in large-diameter and belowground biomass fuels.Crossref | GoogleScholarGoogle Scholar |
Black RR, Aurell J, Holder A, George IJ, Gullett BK, Hays MD, Geron CD, Tabor D (2016) Characterization of gas and particle emissions from laboratory burns of peat. Atmospheric Environment 132, 49–57.
| Characterization of gas and particle emissions from laboratory burns of peat.Crossref | GoogleScholarGoogle Scholar |
Burling IR, Yokelson RJ, Akagi SK, Urbanski SP, Wold CE, Griffith DW, Johnson TJ, Reardon J, Weise DR (2011) Airborne and ground-based measurements of the trace gases and particles emitted by prescribed fires in the United States. Atmospheric Chemistry and Physics 11, 12197–12216.
| Airborne and ground-based measurements of the trace gases and particles emitted by prescribed fires in the United States.Crossref | GoogleScholarGoogle Scholar |
Chakrabarty RK, Gyawali M, Yatavelli RL, Pandey A, Watts AC, Knue J, Chen LW, Pattison RR, Tsibart A, Samburova V, Moosmüller H (2016) Brown carbon aerosols from burning of boreal peatlands: microphysical properties, emission factors, and implications for direct radiative forcing. Atmospheric Chemistry and Physics 16, 3033–3040.
| Brown carbon aerosols from burning of boreal peatlands: microphysical properties, emission factors, and implications for direct radiative forcing.Crossref | GoogleScholarGoogle Scholar |
Christian TJ, Kleiss B, Yokelson RJ, Holzinger R, Crutzen PJ, Hao WM, Saharjo BH, Ward DE (2003) Comprehensive laboratory measurements of biomass-burning emissions: 1. Emissions from Indonesian, African, and other fuels. Journal of Geophysical Research 108, 4719
| Comprehensive laboratory measurements of biomass-burning emissions: 1. Emissions from Indonesian, African, and other fuels.Crossref | GoogleScholarGoogle Scholar |
Couwenberg J (2009) ‘Emission factors for managed peat soils: an analysis of IPCC default values.’ (Wetlands International: Wageningen, the Netherlands)
Davies GM, Gray A, Rein G, Legg CJ (2013) Peat consumption and carbon loss due to smouldering wildfire in a temperate peatland. Forest Ecology and Management 308, 169–177.
| Peat consumption and carbon loss due to smouldering wildfire in a temperate peatland.Crossref | GoogleScholarGoogle Scholar |
Dockery DW, Pope CA, Xu X, Speizer FE, Spengler JD, Ferris BG (1993) Mortality risks of air pollution: a prospective cohort study. The New England Journal of Medicine 329, 1753–1759.
| Mortality risks of air pollution: a prospective cohort study.Crossref | GoogleScholarGoogle Scholar |
Doerr SH, Cerdà A (2005) Fire effects on soil system functioning: new insights and future challenges. International Journal of Wildland Fire 14, 339–342.
| Fire effects on soil system functioning: new insights and future challenges.Crossref | GoogleScholarGoogle Scholar |
Drysdale D (Ed.) (2011) ‘An introduction to fire dynamics.’ (John Wiley & Sons: Chichester, UK)
Durán S, Reisen F, Rideout K (Eds) (2014) ‘Evidence review: wildfire smoke and public health risk.’ (BC Centre for Disease Control: Vancouver, BC, Canada)
Flannigan MD, Krawchuk MA, de Groot WJ, Wotton BM, Gowman LM (2009) Implications of changing climate for global wildland fire. International Journal of Wildland Fire 18, 483–507.
| Implications of changing climate for global wildland fire.Crossref | GoogleScholarGoogle Scholar |
Forrister H, Liu J, Scheuer E, Dibb J, Ziemba L, Thornhill KL, Anderson B, Diskin G, Perring AE, Schwarz JP, Campuzano-Jost P (2015) Evolution of brown carbon in wildfire plumes. Geophysical Research Letters 42, 4623–4630.
| Evolution of brown carbon in wildfire plumes.Crossref | GoogleScholarGoogle Scholar |
Fujii Y, Iriana W, Oda M, Puriwigati A, Tohno S, Lestari P, Mizohata A, Huboyo HS (2014) Characteristics of carbonaceous aerosols emitted from peatland fire in Riau, Sumatra, Indonesia. Atmospheric Environment 87, 164–169.
| Characteristics of carbonaceous aerosols emitted from peatland fire in Riau, Sumatra, Indonesia.Crossref | GoogleScholarGoogle Scholar |
Geron C, Hays M (2013) Air emissions from organic soil burning on the coastal plain of North Carolina. Atmospheric Environment 64, 192–199.
| Air emissions from organic soil burning on the coastal plain of North Carolina.Crossref | GoogleScholarGoogle Scholar |
Glover D, Jessup T (Eds) (2006) ‘Indonesia’s fires and haze: the cost of catastrophe.’ (International Development Research Centre: Ottawa, ON, Canada)
Hatch LE, Luo W, Pankow JF, Yokelson RJ, Stockwell CE, Barsanti KC (2015) Identification and quantification of gaseous organic compounds emitted from biomass burning using two-dimensional gas chromatography–time-of-flight mass spectrometry. Atmospheric Chemistry and Physics 15, 1865–1899.
| Identification and quantification of gaseous organic compounds emitted from biomass burning using two-dimensional gas chromatography–time-of-flight mass spectrometry.Crossref | GoogleScholarGoogle Scholar |
Heil A (2007) Indonesian forest and peat fires: emissions, air quality, and human health. PhD thesis, University of Hamburg, Germany.
Heil A, Goldammer J (2001) Smoke-haze pollution: a review of the 1997 episode in south-east Asia. Regional Environmental Change 2, 24–37.
| Smoke-haze pollution: a review of the 1997 episode in south-east Asia.Crossref | GoogleScholarGoogle Scholar |
Hinwood AL, Rodriguez CM (2005) Potential health impacts associated with peat smoke: a review. Journal of the Royal Society of Western Australia 88, 133–138.
Ho RC, Zhang MW, Ho CS, Pan F, Lu Y, Sharma VK (2014) Impact of 2013 south Asian haze crisis: study of physical and psychological symptoms and perceived dangerousness of pollution level. BMC Psychiatry 14, 81
| Impact of 2013 south Asian haze crisis: study of physical and psychological symptoms and perceived dangerousness of pollution level.Crossref | GoogleScholarGoogle Scholar |
Hoscilo A, Page SE, Tansey KJ, Rieley JO (2011) Effect of repeated fires on land-cover change on peatland in southern central Kalimantan, Indonesia, from 1973 to 2005. International Journal of Wildland Fire 20, 578–588.
| Effect of repeated fires on land-cover change on peatland in southern central Kalimantan, Indonesia, from 1973 to 2005.Crossref | GoogleScholarGoogle Scholar |
Huang X, Rein G (2014) Smouldering combustion of peat in wildfires: INVERSE modelling of the drying and the thermal and oxidative decomposition kinetics. Combustion and Flame 161, 1633–1644.
| Smouldering combustion of peat in wildfires: INVERSE modelling of the drying and the thermal and oxidative decomposition kinetics.Crossref | GoogleScholarGoogle Scholar |
Huang X, Rein G (2015) Computational study of critical moisture and depth of burn in peat fires. International Journal of Wildland Fire 24, 798–808.
| Computational study of critical moisture and depth of burn in peat fires.Crossref | GoogleScholarGoogle Scholar |
Huang X, Rein G (2017) Downward spread of smouldering peat fire: the role of moisture, density and oxygen supply. International Journal of Wildland Fire 26, 907–918.
| Downward spread of smouldering peat fire: the role of moisture, density and oxygen supply.Crossref | GoogleScholarGoogle Scholar |
Huang X, Restuccia F, Gramola M, Rein G (2016) Experimental study of the formation and collapse of an overhang in the lateral spread of smouldering peat fires. Combustion and Flame 168, 393–402.
| Experimental study of the formation and collapse of an overhang in the lateral spread of smouldering peat fires.Crossref | GoogleScholarGoogle Scholar |
Huijnen V, Wooster MJ, Kaiser JW, Gaveau DL, Flemming J, Parrington M, Inness A, Murdiyarso D, Main B, van Weele M (2016) Fire carbon emissions over maritime south-east Asia in 2015 largest since 1997. Scientific Reports 6, 26886
| Fire carbon emissions over maritime south-east Asia in 2015 largest since 1997.Crossref | GoogleScholarGoogle Scholar |
Iinuma Y, Brüggemann E, Gnauk T, Müller K, Andreae MO, Helas G, Parmar R, Herrmann H (2007) Source characterization of biomass burning particles: the combustion of selected European conifers, African hardwood, savanna grass, and German and Indonesian peat. Journal of Geophysical Research 112, D08209
| Source characterization of biomass burning particles: the combustion of selected European conifers, African hardwood, savanna grass, and German and Indonesian peat.Crossref | GoogleScholarGoogle Scholar |
IPCC (2006) ‘IPCC guidelines for national greenhouse gas inventories.’ (Intergovernmental Panel on Climate Change: Geneva)
Jayachandran S (2009) Air quality and early-life mortality evidence from Indonesia’s wildfires. The Journal of Human Resources 44, 916–954.
| Air quality and early-life mortality evidence from Indonesia’s wildfires.Crossref | GoogleScholarGoogle Scholar |
Jayarathne T, Stockwell CE, Gilbert AA, Daugherty K, Cochrane MA, Ryan KC, Putra EI, Saharjo BH, Nurhayati AD, Albar I, Yokelson RJ, Stone EA (2018) Chemical characterization of fine particulate matter emitted by peat fires in central Kalimantan, Indonesia, during the 2015 El Niño. Atmospheric Chemistry and Physics 18, 2585–2600.
| Chemical characterization of fine particulate matter emitted by peat fires in central Kalimantan, Indonesia, during the 2015 El Niño.Crossref | GoogleScholarGoogle Scholar |
Kettridge N, Turetsky MR, Sherwood JH, Thompson DK, Miller CA, Benscoter BW, Flannigan MD, Wotton BM, Waddington JM (2015) Moderate drop in water table increases peatland vulnerability to post-fire regime shift. Scientific Reports 5, 8063
| Moderate drop in water table increases peatland vulnerability to post-fire regime shift.Crossref | GoogleScholarGoogle Scholar |
Kim YH, Tong H, Daniels M, Boykin E, Krantz QT, McGee J, Hays M, Kovalcik K, Dye JA, Gilmour MI (2014) Cardiopulmonary toxicity of peat wildfire particulate matter and the predictive utility of precision-cut lung slices. Particle and Fibre Toxicology 11, 29
| Cardiopulmonary toxicity of peat wildfire particulate matter and the predictive utility of precision-cut lung slices.Crossref | GoogleScholarGoogle Scholar |
Konecny K, Ballhorn U, Navratil P, Jubanski J, Page SE, Tansey K, Hooijer A, Vernimmen R, Siegert F (2016) Variable carbon losses from recurrent fires in drained tropical peatlands. Global Change Biology 22, 1469–1480.
| Variable carbon losses from recurrent fires in drained tropical peatlands.Crossref | GoogleScholarGoogle Scholar |
Konovalov IB, Beekmann M, Kuznetsova IN, Yurova A, Zvyagintsev AM (2011) Atmospheric impacts of the 2010 Russian wildfires: integrating modelling and measurements of an extreme air pollution episode in the Moscow region. Atmospheric Chemistry and Physics 11, 10031–10056.
| Atmospheric impacts of the 2010 Russian wildfires: integrating modelling and measurements of an extreme air pollution episode in the Moscow region.Crossref | GoogleScholarGoogle Scholar |
Koplitz SN, Mickley LJ, Marlier ME, Buonocore JJ, Kim PS, Liu T, Sulprizio MP, DeFries RS, Jacob DJ, Schwartz J, Pongsiri M (2016) Public health impacts of the severe haze in equatorial Asia in September–October 2015: demonstration of a new framework for informing fire management strategies to reduce downwind smoke exposure. Environmental Research Letters 11, 094023
| Public health impacts of the severe haze in equatorial Asia in September–October 2015: demonstration of a new framework for informing fire management strategies to reduce downwind smoke exposure.Crossref | GoogleScholarGoogle Scholar |
Kunii O, Kanagawa S, Yajima I, Hisamatsu Y, Yamamura S, Amagai T, Ismail IT (2002) The 1997 haze disaster in Indonesia: its air quality and health effects. Archives of Environmental Health: An International Journal 57, 16–22.
| The 1997 haze disaster in Indonesia: its air quality and health effects.Crossref | GoogleScholarGoogle Scholar |
Lighty JS, Veranth JM, Sarofim AF (2000) Combustion aerosols: factors governing their size and composition and implications to human health. Journal of the Air & Waste Management Association 50, 1565–1618.
| Combustion aerosols: factors governing their size and composition and implications to human health.Crossref | GoogleScholarGoogle Scholar |
Liu S, Wei Y, Post WM, Cook RB, Schaefer K, Thornton MM (2013) The Unified North American Soil Map and its implication on the soil organic carbon stock in North America. Biogeosciences 10, 2915–2930.
| The Unified North American Soil Map and its implication on the soil organic carbon stock in North America.Crossref | GoogleScholarGoogle Scholar |
Lukenbach MC, Hokanson KJ, Moore PA, Devito KJ, Kettridge N, Thompson DK, Wotton BM, Petrone RM, Waddington JM (2015) Hydrological controls on deep burning in a northern forested peatland. Hydrological Processes 29, 4114–4124.
| Hydrological controls on deep burning in a northern forested peatland.Crossref | GoogleScholarGoogle Scholar |
Maltby E, Legg CJ, Proctor MC (1990) The ecology of severe moorland fire on the North York moors: effects of the 1976 fires, and subsequent surface and vegetation development. Journal of Ecology 78, 490–518.
| The ecology of severe moorland fire on the North York moors: effects of the 1976 fires, and subsequent surface and vegetation development.Crossref | GoogleScholarGoogle Scholar |
May AA, McMeeking GR, Lee T, Taylor JW, Craven JS, Burling I, Sullivan AP, Akagi S, Collett JL, Flynn M, Coe H (2014) Aerosol emissions from prescribed fires in the United States: a synthesis of laboratory and aircraft measurements. Journal of Geophysical Research, D, Atmospheres 119, 11826–11849.
| Aerosol emissions from prescribed fires in the United States: a synthesis of laboratory and aircraft measurements.Crossref | GoogleScholarGoogle Scholar |
McMeeking GR, Kreidenweis SM, Baker S, Carrico CM, Chow JC, Collett JL, Hao WM, Holden AS, Kirchstetter TW, Malm WC, Moosmüller H (2009) Emissions of trace gases and aerosols during the open combustion of biomass in the laboratory. Journal of Geophysical Research 114, D19210
| Emissions of trace gases and aerosols during the open combustion of biomass in the laboratory.Crossref | GoogleScholarGoogle Scholar |
Meyer CP, Cook GD, Reisen F, Smith TE, Tattaris M, Russell‐Smith J, Maier SW, Yates CP, Wooster MJ (2012) Direct measurements of the seasonality of emission factors from savanna fires in northern Australia. Journal of Geophysical Research, D, Atmospheres 117,
| Direct measurements of the seasonality of emission factors from savanna fires in northern Australia.Crossref | GoogleScholarGoogle Scholar |
Muraleedharan TR, Radojevic M, Waugh A, Caruana A (2000a) Chemical characterisation of the haze in Brunei Darussalam during the 1998 episode. Atmospheric Environment 34, 2725–2731.
| Chemical characterisation of the haze in Brunei Darussalam during the 1998 episode.Crossref | GoogleScholarGoogle Scholar |
Muraleedharan TR, Radojevic M, Waugh A, Caruana A (2000b) Emissions from the combustion of peat: an experimental study. Atmospheric Environment 34, 3033–3035.
| Emissions from the combustion of peat: an experimental study.Crossref | GoogleScholarGoogle Scholar |
Page SE, Siegert F, Rieley JO, Boehm HD, Jaya A, Limin S (2002) The amount of carbon released from peat and forest fires in Indonesia during 1997. Nature 420, 61–65.
| The amount of carbon released from peat and forest fires in Indonesia during 1997.Crossref | GoogleScholarGoogle Scholar |
Page SE, John OR, Christopher JB (2011) Global and regional importance of the tropical peatland carbon pool. Global Change Biology 17, 798–818.
| Global and regional importance of the tropical peatland carbon pool.Crossref | GoogleScholarGoogle Scholar |
Paton-Walsh C, Smith TE, Young EL, Griffith DW, Guérette ÉA (2014) New emission factors for Australian vegetation fires measured using open-path Fourier-transform infrared spectroscopy – Part 1: Methods and Australian temperate forest fires. Atmospheric Chemistry and Physics 14, 11313–11333.
| New emission factors for Australian vegetation fires measured using open-path Fourier-transform infrared spectroscopy – Part 1: Methods and Australian temperate forest fires.Crossref | GoogleScholarGoogle Scholar |
Poulter B, Christensen NL, Halpin PN (2006) Carbon emissions from a temperate peat fire and its relevance to interannual variability of trace atmospheric greenhouse gases. Journal of Geophysical Research 111, D06301
| Carbon emissions from a temperate peat fire and its relevance to interannual variability of trace atmospheric greenhouse gases.Crossref | GoogleScholarGoogle Scholar |
Rappold AG, Stone SL, Cascio WE, Neas LM, Kilaru VJ, Carraway MS, Szykman JJ, Ising A, Cleve WE, Meredith JT, Vaughan-Batten H (2011) Peat bog wildfire smoke exposure in rural North Carolina is associated with cardiopulmonary emergency department visits assessed through syndromic surveillance. Environmental Health Perspectives 119, 1415–1420.
| Peat bog wildfire smoke exposure in rural North Carolina is associated with cardiopulmonary emergency department visits assessed through syndromic surveillance.Crossref | GoogleScholarGoogle Scholar |
Rein G (2013) Smouldering fires and natural fuels. In ‘Fire phenomena and the Earth system: an interdisciplinary guide to fire science’. (Ed. CM Belcher) pp. 15–34. (John Wiley & Sons: Oxford, UK)
Rein G (2015) Smouldering combustion. In ‘The SFPE handbook of fire protection engineering’. (Ed. MJ Hurley) pp. 581–603. (Springer: New York)
Rein G, Cleaver N, Ashton C, Pironi P, Torero JL (2008) The severity of smouldering peat fires and damage to the forest soil. Catena 74, 304–309.
| The severity of smouldering peat fires and damage to the forest soil.Crossref | GoogleScholarGoogle Scholar |
Rein G, Cohen S, Simeoni A (2009) Carbon emissions from smouldering peat in shallow and strong fronts. Proceedings of the Combustion Institute 32, 2489–2496.
| Carbon emissions from smouldering peat in shallow and strong fronts.Crossref | GoogleScholarGoogle Scholar |
Sastry N (2002) Forest fires, air pollution, and mortality in south-east Asia. Demography 39, 1
| Forest fires, air pollution, and mortality in south-east Asia.Crossref | GoogleScholarGoogle Scholar |
Shaposhnikov D, Revich B, Bellander T, Bedada GB, Bottai M, Kharkova T, Kvasha E, Lezina E, Lind T, Semutnikova E, Pershagen G (2014) Mortality related to air pollution with the Moscow heat wave and wildfire of 2010. Epidemiology 25, 359–364.
| Mortality related to air pollution with the Moscow heat wave and wildfire of 2010.Crossref | GoogleScholarGoogle Scholar |
Smith TEL, Evers S, Yule CM, Gan JY (2018) In situ tropical peatland fire emission factors and their variability, as determined by field measurements in Peninsula Malaysia. Global Biogeochemical Cycles 32, 18–31.
Stockwell CE, Yokelson RJ, Kreidenweis SM, Robinson AL, DeMott PJ, Sullivan RC, Reardon J, Ryan KC, Griffith DW, Stevens L (2014) Trace gas emissions from combustion of peat, crop residue, domestic biofuels, grasses, and other fuels: configuration and Fourier-transform infrared (FTIR) component of the fourth Fire Lab at Missoula Experiment (FLAME-4). Atmospheric Chemistry and Physics 14, 9727–9754.
| Trace gas emissions from combustion of peat, crop residue, domestic biofuels, grasses, and other fuels: configuration and Fourier-transform infrared (FTIR) component of the fourth Fire Lab at Missoula Experiment (FLAME-4).Crossref | GoogleScholarGoogle Scholar |
Stockwell CE, Veres PR, Williams J, Yokelson RJ (2015) Characterization of biomass burning emissions from cooking fires, peat, crop residue, and other fuels with high-resolution proton-transfer-reaction time-of-flight mass spectrometry. Atmospheric Chemistry and Physics 15, 845–865.
| Characterization of biomass burning emissions from cooking fires, peat, crop residue, and other fuels with high-resolution proton-transfer-reaction time-of-flight mass spectrometry.Crossref | GoogleScholarGoogle Scholar |
Stockwell CE, Jayarathne T, Cochrane MA, Ryan KC, Putra EI, Saharjo BH, Nurhayati AD, Albar I, Blake DR, Simpson IJ, Stone EA (2016) Field measurements of trace gases and aerosols emitted by peat fires in central Kalimantan, Indonesia, during the 2015 El Niño. Atmospheric Chemistry and Physics 16, 11711–11732.
| Field measurements of trace gases and aerosols emitted by peat fires in central Kalimantan, Indonesia, during the 2015 El Niño.Crossref | GoogleScholarGoogle Scholar |
Tissari J, Lyyränen J, Hytönen K, Sippula O, Tapper U, Frey A, Saarnio K, Pennanen AS, Hillamo R, Salonen RO, Hirvonen MR (2008) Fine particle and gaseous emissions from normal and smouldering wood combustion in a conventional masonry heater. Atmospheric Environment 42, 7862–7873.
| Fine particle and gaseous emissions from normal and smouldering wood combustion in a conventional masonry heater.Crossref | GoogleScholarGoogle Scholar |
Turetsky MR, Donahue WF, Benscoter BW (2011) Experimental drying intensifies burning and carbon losses in a northern peatland. Nature Communications 2, 514
| Experimental drying intensifies burning and carbon losses in a northern peatland.Crossref | GoogleScholarGoogle Scholar |
Turetsky MR, Benscoter B, Page S, Rein G, van Der Werf GR, Watts A (2014) Global vulnerability of peatlands to fire and carbon loss. Nature Geoscience 8, 11–14.
| Global vulnerability of peatlands to fire and carbon loss.Crossref | GoogleScholarGoogle Scholar |
Urbanski S (2014) Wildland fire emissions, carbon, and climate: emission factors. Forest Ecology and Management 317, 51–60.
| Wildland fire emissions, carbon, and climate: emission factors.Crossref | GoogleScholarGoogle Scholar |
Usup A, Hashimoto Y, Takahashi H, Hayasaka H (2004) Combustion and thermal characteristics of peat fire in tropical peatland in central Kalimantan, Indonesia. Tropics 14, 1–19.
| Combustion and thermal characteristics of peat fire in tropical peatland in central Kalimantan, Indonesia.Crossref | GoogleScholarGoogle Scholar |
van der Werf GR, Dempewolf J, Trigg SN, Randerson JT, Kasibhatla PS, Giglio L, Murdiyarso D, Peters W, Morton DC, Collatz GJ, Dolman AJ (2008) Climate regulation of fire emissions and deforestation in equatorial Asia. Proceedings of the National Academy of Sciences of the United States of America 105, 20350–20355.
| Climate regulation of fire emissions and deforestation in equatorial Asia.Crossref | GoogleScholarGoogle Scholar |
van der Werf GR, Randerson JT, Giglio L, Collatz GJ, Mu M, Kasibhatla PS, Morton DC, DeFries RS, Jin YV, van Leeuwen TT (2010) Global fire emissions and the contribution of deforestation, savanna, forest, agricultural, and peat fires (1997–2009). Atmospheric Chemistry and Physics 10, 11707–11735.
| Global fire emissions and the contribution of deforestation, savanna, forest, agricultural, and peat fires (1997–2009).Crossref | GoogleScholarGoogle Scholar |
van der Werf GR, Randerson JT, Giglio L, Van Leeuwen TT, Chen Y, Rogers BM, Mu M, Van Marle MJ, Morton DC, Collatz GJ, Yokelson RJ (2017) Global fire emissions estimates during 1997–2016. Earth System Science Data 9, 697–720.
| Global fire emissions estimates during 1997–2016.Crossref | GoogleScholarGoogle Scholar |
Ward DE, Hao W (1991) Projections of emissions from burning of biomass for use in studies of global climate and atmospheric chemistry. In ‘Proceedings of the 84th Air and Waste Management Association annual meeting and exhibition’, June 16–21, 1991, Vancouver, BC, Canada. Available at https://www.fs.fed.us/rm/pubs_other/rmrs_1991_ward_d001.pdf [Verified 13 April 2018]
Ward DE, Hardy CC (1984) Advances in the characterization and control of emissions from prescribed fires. In ‘Proceedings of the 77th annual meeting of the Air Pollution Control Association’, June 24–29, 1984, San Francisco, CA, USA.
Ward DE, Hardy CC (1991) Smoke emissions from wildland fires. Environment International 17, 117–134.
| Smoke emissions from wildland fires.Crossref | GoogleScholarGoogle Scholar |
Ward DE, Radke LF (1993). Emissions measurements from vegetation fires: a comparative evaluation of methods and results. In ‘Fire in the environment: the ecological, atmospheric, and climatic importance of vegetation fires’. (Eds PJ Crutzen, JG Goldammer) pp. 53–76. (John Wiley & Sons: Oxford, UK)
Wilson D, Dixon SD, Artz RR, Smith TE, Evans CD, Owen HJ, Archer E, Renou-Wilson F (2015) Deviation of greenhouse gas emission factors for peatlands managed for extraction in the Republic of Ireland and the United Kingdom. Biogeosciences 12, 5291–5308.
| Deviation of greenhouse gas emission factors for peatlands managed for extraction in the Republic of Ireland and the United Kingdom.Crossref | GoogleScholarGoogle Scholar |
World Energy Council (2013) ‘World energy resources 2013 survey.’ (World Energy Council: London)
World Health Organization (2006) ‘Air quality guidelines: global update 2005: particulate matter, ozone, nitrogen dioxide, and sulfur dioxide.’ (World Health Organization: Copenhagen)
Yang J, Chen H, Zhao W, Zhou J (2016) Combustion kinetics and emission characteristics of peat by using TG-FTIR technique. Journal of Thermal Analysis and Calorimetry 124, 519–528.
| Combustion kinetics and emission characteristics of peat by using TG-FTIR technique.Crossref | GoogleScholarGoogle Scholar |
Yokelson RJ, Griffith DW, Ward DE (1996) Open‐path Fourier transform infrared studies of large‐scale laboratory biomass fires. Journal of Geophysical Research, D, Atmospheres 101, 21067–21080.
| Open‐path Fourier transform infrared studies of large‐scale laboratory biomass fires.Crossref | GoogleScholarGoogle Scholar |
Yokelson RJ, Susott R, Ward DE, Reardon J, Griffith DW (1997) Emissions from smoldering combustion of biomass measured by open-path Fourier transform infrared spectroscopy. Journal of Geophysical Research, D, Atmospheres 102, 18865–18877.
| Emissions from smoldering combustion of biomass measured by open-path Fourier transform infrared spectroscopy.Crossref | GoogleScholarGoogle Scholar |
Yokelson RJ, Christian TJ, Karl TG, Guenther A (2008) The tropical forest and fire emissions experiment: laboratory fire measurements and synthesis of campaign data. Atmospheric Chemistry and Physics 8, 3509–3527.
| The tropical forest and fire emissions experiment: laboratory fire measurements and synthesis of campaign data.Crossref | GoogleScholarGoogle Scholar |