

An overview of the history, current contributions and future outlook of iNaturalist in Australia
Thomas Mesaglio A C and Corey T. Callaghan A B
A Centre for Ecosystem Science, School of Biological, Earth and Environmental Sciences, The University of New South Wales, UNSW Sydney, NSW 2052, Australia.
B Evolution & Ecology Research Centre, School of Biological, Earth and Environmental Sciences, The University of New South Wales, UNSW Sydney, NSW 2052, Australia.
C Corresponding author. Email: thomasmesaglio@gmail.com
Wildlife Research 48(4) 289-303 https://doi.org/10.1071/WR20154
Submitted: 3 September 2020 Accepted: 16 January 2021 Published: 19 March 2021
Journal Compilation © CSIRO 2021 Open Access CC BY-NC
Abstract
Citizen science initiatives and the data they produce are increasingly common in ecology, conservation and biodiversity monitoring. Although the quality of citizen science data has historically been questioned, biases can be detected and corrected for, allowing these data to become comparable in quality to professionally collected data. Consequently, citizen science is increasingly being integrated with professional science, allowing the collection of data at unprecedented spatial and temporal scales. iNaturalist is one of the most popular biodiversity citizen science platforms globally, with more than 1.4 million users having contributed over 54 million observations. Australia is the top contributing nation in the southern hemisphere, and in the top four contributing nations globally, with over 1.6 million observations of over 36 000 identified species contributed by almost 27 000 users. Despite the platform’s success, there are few holistic syntheses of contributions to iNaturalist, especially for Australia. Here, we outline the history of iNaturalist from an Australian perspective, and summarise, taxonomically, temporally and spatially, Australian biodiversity data contributed to the platform. We conclude by discussing important future directions to maximise the usefulness of these data for ecological research, conservation and policy.
Keywords: citizen science, iNaturalist, biodiversity data, conservation, community science.
Introduction
Citizen science, or community science – the cooperation between volunteers and professional scientists – is increasingly leveraged in the fields of ecology and conservation. Citizen science initiatives, and their associated data, are increasing at exponential rates (Pocock et al. 2017). As a result, biodiversity research is increasingly reliant on citizen science data to understand ecological patterns at spatial and temporal scales not possible mere decades ago. Concomitantly, there is an increasing reliance on the use of citizen science data for conservation planning and monitoring (Chandler et al. 2017; McKinley et al. 2017; Young et al. 2019). But despite the prevalence of citizen science data, there are still several barriers to its use as a primary research tool (Burgess et al. 2017).
A major reason for the reluctance towards using citizen science data is questions surrounding data quality, such as misidentifications or underlying biases skewing the data. Yet, recent work has highlighted that the accuracy of citizen science data is increasingly comparable to that collected by experts (Aceves-Bueno et al. 2017). An examination by external experts of 3287 records (2234 plants, 1053 moths) submitted to the platform iSpot (www.ispotnature.org) verified more than 92% of these as accurately identified by citizen scientists (Silvertown et al. 2015). Further, because the quantity of data collected by citizen scientists is so great, there are several statistical techniques that can be used to identify and account for the noise and bias in citizen science initiatives (Bird et al. 2014), ranging from hierarchical modelling using random effects to account for inherent noise (Isaac et al. 2014), to spatial and temporal subsampling to minimise biases (Wiggins et al. 2011), to integrating professionally collected data with opportunistically collected data (Fithian et al. 2015; Pacifici et al. 2017). Statistical techniques are increasingly being developed, which will continue to increase the utility of citizen science data for biodiversity and ecological research.
Citizen science initiatives generally range from structured (e.g. rigorous protocols, training, predetermined time and location of surveys, collection of effort information) to unstructured (e.g. no training necessary, opportunistic in nature, data collected at any time or place), and each of these has trade-offs. For example, structured initiatives are likely to collect data with less bias, but the quantity of data is often greater from unstructured initiatives with little to no formal protocols. Citizen science initiatives also vary in their approach, including contributory/participatory (i.e. participants engage in a project developed by professionals), or collaborative (i.e. participants are involved in defining the scope, purpose, and methodology) approaches (Danielsen et al. 2005; Pocock et al. 2019).
Of all citizen science initiatives, iNaturalist (www.inaturalist.org) is one of the most globally successful on the basis of participation and quantity of data collected. iNaturalist is a multi-taxa citizen science platform hosted by the California Academy of Sciences and National Geographic Society. Its primary goal is to connect people to nature, while also aiming to generate scientifically valuable biodiversity data. iNaturalist is an unstructured citizen science initiative that is opportunistic in nature, allowing participants to contribute observations (e.g. photos, sound recordings) of any living organism, or traces thereof, with associated spatiotemporal coordinates. Records are then identified to the lowest possible taxonomic resolution by other iNaturalist users. Data are presence-only, such as those data from iSpot or FrogID; conversely, citizen science initiatives such as eBird or Reef Life Survey involve the collection of species lists, allowing for easy inference of absences. An observation is deemed ‘Research Grade’ when it has two or more suggested identifications and more than two-thirds of these identifications agree. Although ‘Needs ID’ observations are not necessarily less taxonomically accurate than Research Grade observations (Hochmair et al. 2020), designation as Research Grade allows these records to be automatically exported to the Global Biodiversity Information Facility (GBIF; provided the observation is published under a CC0, CC BY, or CC BY-NC license). Australian observations (both Research Grade and Needs ID) are also automatically exported to the Atlas of Living Australia (ALA; provided the observation is shareable under a Creative Commons license). Importantly, any subsequent changes to these observations in iNaturalist, such as changed identifications, are also reflected in GBIF and the ALA.
Since the launch of iNaturalist in 2008, it has seen immense uptake on a global scale, with >54 million observations of ~306 000 identified species, contributed by >1.4 million observers and spanning 252 countries and territories. The data from iNaturalist have already made significant impacts in ecological and biodiversity research, and have been validated in their use for vegetation mapping, albeit at a small scale (Uyeda et al. 2020). More broadly, data from iNaturalist have been used to detect range extensions of alien species (Agarwal 2017; Vásquez-Restrepo and Lapwong 2018), quantify urban tolerance of organisms (Callaghan et al. 2020a), map character traits such as wing phenotypes and colour morphs (Drury et al. 2019; Lehtinen et al. 2020), and record the rediscovery of lost species (Jain et al. 2019; Richart et al. 2019).
Surprisingly, syntheses highlighting the advances of our knowledge as a result of iNaturalist are rare, with many papers instead focusing on singular records of interesting and unique data points (e.g. Fig. 1). Yet, such syntheses are important to (1) inform the scientific community of the value of the data, (2) provide feedback to the citizen science participants (de Vries et al. 2019) and iNaturalist staff, and (3) highlight future research questions. Here, we synthesise Australian biodiversity data contributed through the iNaturalist platform. We extracted all georeferenced and dated records of wild organisms from iNaturalist associated with a photograph or sound file (i.e. ‘verifiable’ observations), and uploaded on or before 21 November 2020 (api.inaturalist.org). We used observations within continental Australia, islands under Australian jurisdiction, and the waters constituting Australia’s Exclusive Economic Zone (which extends to a maximum distance of 200 nautical miles). We followed iNaturalist’s taxonomy for all taxa. First, we highlight the exponential growth of iNaturalist in Australia, providing a brief history of the platform from an Australian perspective. Second, we provide a taxonomic overview of the biodiversity data, including a summary of endangered and rare species data. Third, we provide a spatial summary of the data, highlighting important spatial gaps in these data. Fourth, we discuss significant projects, highlighting the broad utility and adaptability of the iNaturalist platform for targeted citizen science projects. Last, we conclude with an overview of significant next steps for the future for iNaturalist in Australia that will maximise the information content for researchers aiming to better understand biodiversity research in Australia. Ultimately, we hope that this overview will (1) help to encourage naturalists and professionals alike to become involved with the iNaturalist community in Australia, and (2) stimulate future research directions that will benefit the continuous improvement of iNaturalist as an entity in data collection for biodiversity research.

|
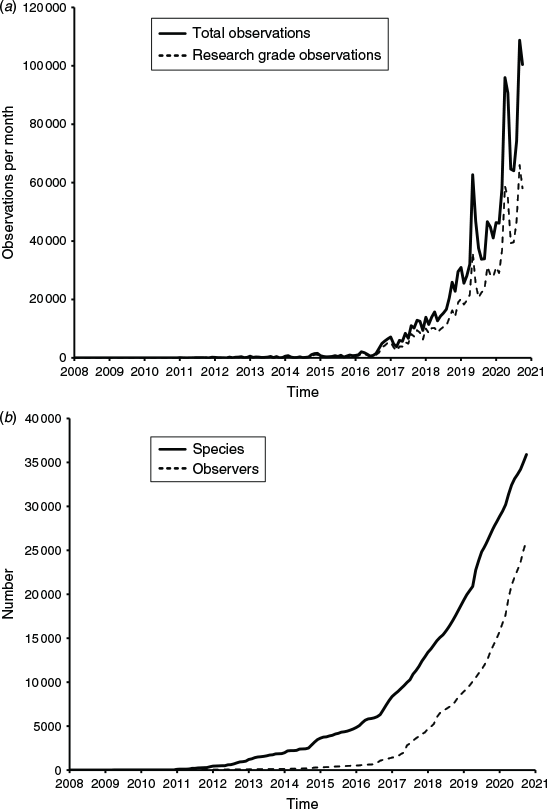
Temporal summary of Australian iNaturalist data
Current data contributions
As of 21 November 2020, 26 849 users have contributed 1 637 950 verifiable observations (of which 1 036 648 are Research Grade) of 36 391 identified species in Australia, with 11 433 users providing identifications. Although ranked fourth in the world for number of observations, Australia is ranked third for number of species, and second for average number of observations per observer (Table 1). Australian observers follow a strong long-tailed distribution, with the top 10 observers (representing 0.04% of all Australian observers) contributing 20.64% of all Australian observations, confirming the general pattern of ‘power users’ (Supplementary material Table S1; Wood et al. 2011; Rowley et al. 2019). The distribution of identifiers follows a similar pattern, with 16.6% of all identifications of Australian observations made by the top 10 users (Table S2).

|
History of iNaturalist in Australia
Use of iNaturalist in Australia started slowly, with little growth from 2008 to 2015. However, from mid-2016 onward, several events drove dramatic increases in observation rates, the number of observers, and the number of observed species (Fig. 2). First, in 2016, Questagame, a different citizen science biodiversity platform, gave users the option of syncing their account with iNaturalist, helping drive the first significant increase in Australian observation rates. In October 2016, the creation of the Australasian Fishes Project (https://www.inaturalist.org/projects/australasian-fishes) sparked a similar acceleration in observation rates. Before Australasian Fishes’ inception, the most observations uploaded in any given month only just exceeded 2000, and after its inception, observation rates more than tripled compared with the average monthly rate of the preceding year.
|
From 2016 onwards, observations of Australian taxa have continued to increase at an accelerating rate, with this sustained organic growth occasionally punctuated by increasingly large spikes driven by external events. The first of these major spikes occurred in May 2019 with the closure of BowerBird. Hosted by Museums Victoria, BowerBird was Australia’s core biodiversity citizen science platform. With a particularly strong focus on invertebrates, BowerBird users tracked large range expansions for invasive species (Baumann et al. 2016), rediscovered species assumed to be extinct (Richter 2015) and recorded undescribed species (Walker 2014). Over 70 000 records were migrated to iNaturalist from BowerBird, a merger that also attracted new users from BowerBird, helping further accelerate observation rates over time for the iNaturalist platform.
In May 2019, the Atlas of Living Australia (ALA) began collaborating with iNaturalist by forming iNaturalist Australia, a local node of the broader iNaturalist platform. This collaboration has allowed the ALA to access the strong network of identifiers provided by iNaturalist, while also prompting more Australian experts to join iNaturalist. In 2020, Australia participated in the City Nature Challenge (CNC; https://citynaturechallenge.org/) for the first time, with four cities, namely, Sydney, Adelaide, Geelong and Redland City, officially competing, and the rest of Australia being encouraged to also submit as many records as possible from 24 to 27 April. In just 4 days, 1476 Australian users, many of whom were new users recruited to iNaturalist through CNC advertising, submitted 24 881 observations of 4724 identified species. In May 2020, NatureShare (Victoria’s main biodiversity citizen science platform) closed down and its records were migrated across to iNaturalist. As with BowerBird, this process generated new iNaturalist observations and attracted new users.
After the successes of the CNC, the Australian organisers coordinated the Great Southern BioBlitz (https://greatsouthernbiobl.wixsite.com/website) to promote observations during the southern hemisphere spring. With 1446 observers uploading 32 213 observations of 5101 identified species from 25 to 28 September as part of the event, Australian uploads exceeded 100 000 in a single month for the first time.
Taxonomic summary of Australian iNaturalist data
Animals are the most observed kingdom in Australia on iNaturalist (68%), followed by plants (25%) and fungi (6.5%), with all other kingdoms constituting just 0.5% of all Australian observations on iNaturalist. Species diversity follows a similar pattern, with animals constituting 58.9% of recorded Australian species, plants 35.6%, fungi 4.7%, and the remaining kingdoms 0.8%.
Animalia
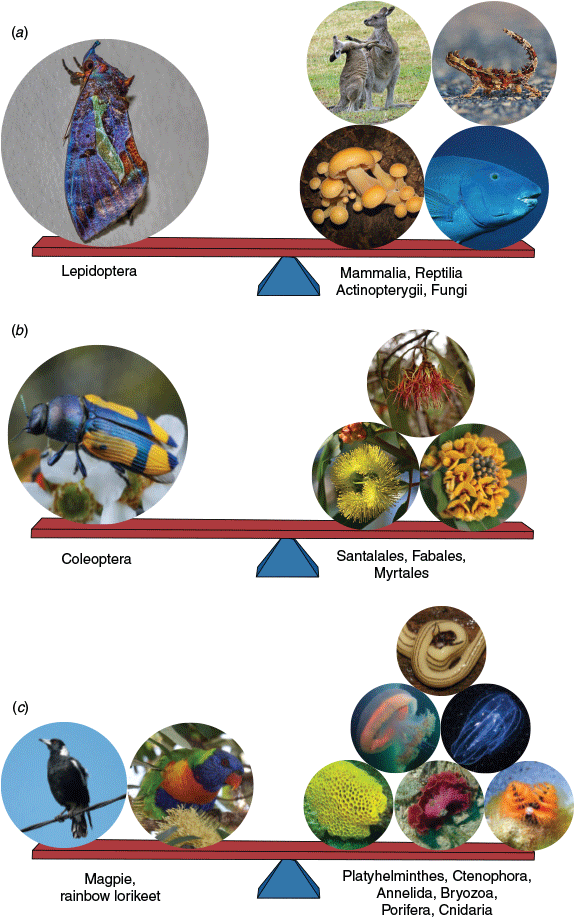
Australian animal observations are dominated by arthropods (51.9%) and chordates (41.8%), with all other phyla being represented by just 6.3% of observations. Most arthropod observations are insects (86.3%), and, indeed, insects comprise 30.5% of all Australian observations and 33.6% of Australian species across all taxa on iNaturalist. The most observed insect group is Lepidoptera (50.4% of all insect observations; Fig. 3).
|
Birds are strongly over-represented relative to their diversity, comprising 17.3% of Australian observations across all taxa despite comprising only 2.1% of all species. This strong sampling bias towards birds is pervasive across almost all biodiversity data and platforms (Troudet et al. 2017), because birds tend to be more charismatic, easier to photograph and easier to identify compared to other taxa (especially invertebrate groups). Within the chordates, fishes are strongly under-sampled relative to their diversity, comprising 50.1% of all identified Australian chordate species on iNaturalist, but only 16.7% of observations.
Plantae
Australian plant observations are almost entirely of vascular plants (96.6%), with bryophytes (1.1%) the next-most observed group. Most vascular plant observations are dicots (Magnoliopsida; 70.1%), followed by monocots (Liliopsida; 23.5%) and ferns (Polypodiopsida; 3.6%). The most observed dicot order is Asterales (asters, bellflowers, fanflowers, and allies; 14.3%), and the most observed monocot order is Asparagales (agaves, orchids, irises and allies; 64.6%).
The most speciose plant order observed in Australia on iNaturalist is Myrtales (myrtales, evening primroses and allies) with 1316 species, closely followed by Fabales (legumes, milkworts and allies) with 1244 species, and Asparagales with 1215 species.
Fungi
Australian fungi observations on iNaturalist are dominated by basidiomycetes both in observations (74.2%) and species (69.5%), with ascomycetes comprising 15.2% of observations and 29.9% of species. At the class level, 95.2% of basidiomycete observations (75 747) and 90% of species (1148) are agaricomycetes.
Applications of iNaturalist data for conservation
With Earth in the midst of ‘biological annihilation’ as part of the sixth mass extinction (Ceballos et al. 2017), it is more important than ever to understand patterns of biodiversity across space and time. This is especially true for Australia, which has more than 1800 threatened species and one of the worst extinction rates globally (Ward et al. 2019). However, monitoring threatened species can be difficult as many species’ distributions greatly overlap with private land (Bean and Wilcove 1997; Lepczyk 2005) and large-scale ecological monitoring programs are often expensive (Dickinson et al. 2012). The value of Australian iNaturalist data for conservation research has recently been realised (Rowley et al. 2019; Kirchhoff et al. 2021; Turak et al. 2020), highlighting the potential of iNaturalist as a powerful tool for the public to collect large quantities of data from private land at little to no cost. An important direction for future research is the quantification of contributions by iNaturalist to understanding biodiversity on private lands, especially through understanding the percentage of observations made on private land in comparison to professional science and other citizen science initiatives.
Threatened species
iNaturalist has potential for understanding the spatial and temporal distribution of threatened species, with more than 29 460 observations of 1101 Australian species with a conservation status of near threatened or higher (Fig. 4). One of the greatest challenges for conservation is detection; many threatened species are cryptic, have low numbers or have very restricted ranges (Campos-Cerqueira and Aide 2016), so estimates of population size are often difficult. By spreading monitoring efforts across a large number of participants, many of whom have access to private land that would otherwise be difficult to monitor, platforms such as iNaturalist allow the expansion of conservation efforts to scales that would otherwise be impossible without citizen scientists (Ellwood et al. 2017; Steven et al. 2019). Simultaneously, Australian cities are actually threatened species hotspots, with 30% of threatened species found in urban areas (Ives et al. 2016; Lloyd et al. 2020). Given that Australian observations on iNaturalist show a strong spatial bias towards major cities and urban areas (Fig. 5), iNaturalist is well poised to contribute strongly to threatened species monitoring and conservation more broadly.

|

|
The potential value of iNaturalist for conservation-based monitoring is already apparent, with 18 627 iNaturalist records of species with a conservation status of near threatened or above having been exported to the ALA. This value is especially clear for many individual taxa; 27% of all Caladenia fulva (endangered) records, almost 31% of all ngwayir (Pseudocheirus occidentalis; critically endangered) records, and 66% of all White’s seahorse (Hippocampus whitei; endangered) records on the ALA are Australian iNaturalist observations. Future research should aim to further quantify the contributions of iNaturalist data to conservation (e.g. Lloyd et al. 2020), and understand how these contributions may differ among taxa.
The value of iNaturalist for Australian insects
Despite insect populations across many of the major orders facing threats from a myriad of factors, including climate change, habitat destruction and the systemic use of agricultural pesticides (Harvey et al. 2020; Wagner 2020), insects are strongly under-represented in conservation efforts (Didham et al. 2020a), and, indeed, very few species have been evaluated and assigned a conservation status (Didham et al. 2020b). Although much of the data documenting insect declines are spatially biased towards North America and Europe (Simmons et al. 2019), population declines and the factors driving them have also been identified in an Australian context (Sands 2018). Concurrently, despite progress in recognising the importance of and implementing conservation efforts for Australian insects, there still remain major impediments to the field. Although limited funding, decreasing taxonomic expertise, and a lack of public interest all play a role (Taylor et al. 2018), the most significant hurdles are the Linnean and Wallacean shortfalls (Brito 2010; Cardoso et al. 2011), i.e. that Australian insects constitute a vast assemblage of undescribed species for which little to no data exist, and the geographical distributions of described species are similarly poorly characterised (Sands 2018; Hutchings 2019). Given recording when and where insect species occur is a priority action to combat this data paucity, citizen science is strongly positioned to help address these challenges (New 2018; Didham et al. 2020b; Wilson et al. 2020), and with insects comprising 30.5% of all Australian observations (the highest percentage for the top 15 contributing nations to iNaturalist) across more than 12 000 species, iNaturalist is driving efforts to overcome these shortfalls. Especially notable is the Australian contribution to the First Known Photographs of Living Specimens project (https://www.inaturalist.org/projects/first-known-photographs-of-living-specimens), with observations of 183 Australian insect species for which no other photographs of living specimens are readily available online; among these are also the first ever records of several species since their original description (Skejo et al. 2020).
Invasive species
As one of the top five drivers of global biodiversity loss, invasive species have been associated with more extinctions in the past 500 years than has any other factor (Blackburn et al. 2019), and established populations of invasive species are present within 10 km of the boundaries of almost 90% of the world’s protected areas (Liu et al. 2020). In Australia, invasive species have enormous ecological and economic impacts, incurring a cost of more than AU$13.6 billion (losses and control) in the 2011–2012 financial year alone (Hoffmann and Broadhurst 2016). Australian citizen science platforms such as FeralScan and MyPestGuide™ play an integral role in modelling the distribution of invasive species (Roy-Dufresne et al. 2019) and facilitating pest surveillance for biosecurity (Emery et al. 2016). With 70 638 observations of 932 introduced species in Australia, many of which are also invasive, iNaturalist is well positioned to contribute strongly to this field, particularly for significant invasive species such as the red fox (Vulpes vulpes; 1475 observations), cane toad (Rhinella marinus; 1043 observations) and lantana (Lantana camara; 791 observations).
Spatial summary of Australian iNaturalist data
Although Australian observations span the continent and much of its islands, there are strong spatial biases towards major cities, especially along the eastern and south-eastern coasts (Fig. 5). These biases are consistent with many citizen science initiatives (Geldmann et al. 2016; Callaghan et al. 2020c), and, indeed, ecological research more broadly (Boakes et al. 2010; Piccolo et al. 2020). This pattern is especially pronounced for Australian citizen science initiatives that contribute to threatened species monitoring and conservation, with strong correlations between project density and population density along the south-eastern and south-western coasts (Lloyd et al. 2020), mirroring the patterns seen in Fig. 5. Although many of the Australian iNaturalist observation hotspots are associated with the most populous capital cities, others are also driven by the presence of research institutions, such as the efforts of James Cook University students at Cairns, and the contributions of individual power users.
But despite strong spatial coverage along the eastern and south-eastern coasts, and south-western corner, there are still many large areas of Australia with little or no iNaturalist observations. Outside small, largely tourist-driven clusters around Alice Springs and Uluru–Kata Tjuta National Park, much of Australia’s arid interior is extremely data deficient, including vast tracts of the Nullabor, Great Victoria Desert and Simpson Desert. This under-sampling is also reflected in professional science for many taxa, especially at local scales (Schmidt‐Lebuhn et al. 2012), highlighting a key target area for future sampling.
Another conspicuous spatial gap exists in tropical northern Australia, with most of Arnhem Land being unsampled by iNaturalist. Improving sampling across this region is crucial given its high biodiversity and endemicity (Woinarski et al. 2009), the recent drastic decline of its small to medium mammal biota (Einoder et al. 2018), and the under-sampling of its fauna even in professional science and for charismatic taxa such as mammals (Ziembicki et al. 2015). Similarly, despite the region’s high threatened species richness, citizen science initiatives targeting these species are relatively low in number (Lloyd et al. 2020), reinforcing the value of engaging citizen scientists across this region.
Perhaps the most poorly sampled regions of Australia on iNaturalist are its offshore waters, particularly those beyond the continental shelf (>200 m water depth). These zones are characterised by low numbers of specimens, gaps in taxonomic knowledge and many species awaiting discovery and description (Williams et al. 2018). Although this data paucity is understandable given the inaccessibility of these regions and habitats, especially to citizen scientists, it highlights the importance of diversifying and recruiting new iNaturalist users from sectors such as commercial fisheries.
Leveraging an existing platform for focussed projects
One of iNaturalist’s most powerful attributes is the ‘Project’ feature. Projects allow users to filter and collect observations either automatically on the basis of their metadata, such as spatial coordinates or dates of observation (collection projects); or, manually by collating observations with some unifying theme, such as observations of feathers or records of predator–prey relationships (traditional projects). Although iNaturalist is broadly an unstructured, opportunistic data collection platform, projects provide the scope for more structured protocols and sampling designs; many projects are designed around customisable observation fields or the collection of additional metadata unique to a specific scientific objective or hypothesis (e.g. host plant, substrate, or habitat information), highlighting iNaturalist’s potential to shift towards semi-structured data collection when used in this way. Given projects are simple and fast to create, intuitive to interact with, and require minimal manipulation to be effective, they are an ideal tool for collecting both spatiotemporal and secondary data. Perhaps the greatest strength of projects is that they offer existing digital infrastructure ready-made for immediate data collection, obviating the need for project managers to build any data collection tools themselves.
Factors driving successful projects
Many of the most successful Australian projects (Table 2) are driven by one, or both, of two key factors. First, although many projects have a specific taxonomic or ecological focus, successful projects often collect observations and data at large spatial scales, maximising participation and allowing the development of a diverse community of users. Second, successful projects are often monitored and/or administrated by a core group of professional experts who consistently provide identifications and teach other users, driving the creation of a strong community with similar interests. This opportunity to collaborate with and learn from professionals is an important and highly valued aspect of citizen science initiatives (Johnson et al. 2014; Steven et al. 2019), and indeed in many cases, this learning is mutual (Dowthwaite and Sprinks 2019; Pearse 2020), further motivating the professionals.

|
Australasian Fishes, the longest-running and most successful Australian iNaturalist project, highlights the value of these two factors for project success. Created in late 2016 by Mark McGrouther (@markmcg), the former Ichthyology Collection Manager at the Australian Museum, the project focuses on fishes, sharks and rays across Australia and New Zealand. Almost 15% of all users who have contributed data for Australia have also contributed to Australasian Fishes, with an extensive network of museum curators, taxonomic experts, researchers and many passionate amateur naturalists from all around Australia helping build a strong community. These successes are reflected in the use of photographs and observation metadata from the project in research (e.g. Booth and Sear 2018; Fetterplace et al. 2018). Australasian Fishes members were also heavily involved in the first ever record of a hoodwinker sunfish (Mola tecta) in the northern hemisphere, which made international headlines in 2019 (https://www.bbc.com/news/world-us-canada-47424072). Cicadas of Australia is another popular taxon-specific, community-driven project, with almost 1300 contributors across Australia able to learn from a core group of Australian cicada experts, and, in return, provide valuable local knowledge that also benefits the experts.
Benefits of successful projects
Designed to rapidly collect data after the devastating 2019–2020 Australian bushfire season, the Environment Recovery Project run by the University of New South Wales’ Centre for Ecosystem Science has been hugely productive. The easy to use, ready-made digital infrastructure provided by the project feature, combined with a strong media campaign (e.g. https://www.abc.net.au/triplej/programs/hack/citizen-science-project-bushfire-recovery-needs-your-help/11910486), helped drive the upload of 10 000 observations by more than 300 observers across south-eastern Australia in just 10 months, including data collected within days of fires occurring. These successes have seen the project already generate research output (Kirchhoff et al. 2021), with invaluable data tracking the recovery of Australian ecosystems continuing to be collected.
Overcoming sampling biases towards charismatic taxa is another benefit of successful projects. Fungal taxonomy and conservation are largely neglected fields, especially in Australia; a paucity of mycologists, the cryptic nature of many species (especially owing to the ephemerality of fruiting bodies for many groups), and the prominence of pathogenic species in the public consciousness (Irga et al. 2018) have all contributed to a lack of knowledge of this group. Given that the conservation of fungi requires an understanding of how many species exist and the resolution of taxonomic opacity, iNaturalist Australia is well placed to contribute significantly, with Fungimap Australia featuring more than 30 000 observations of over 1000 species. The promotion of this project and the recruitment of professional mycologists to teach and collaborate with citizen scientists (Grube et al. 2017) will improve the quality of the fungal dataset of iNaturalist Australia and help drive conservation efforts.
The robust existing data collection frameworks created by projects also help attract more professional scientists. As Australia’s largest biodiversity discovery program, Bush Blitz’s involvement with iNaturalist through the Backyard Species Discovery with Bush Blitz project has driven a large uptick in Australian taxonomic experts joining iNaturalist, especially for many less charismatic taxa. This recruitment has been crucial for driving greater engagement between experts and amateur naturalists. An important future area will be quantifying the impact of these experts with respect to data quality and accuracy of identifications, similar to previous analyses of identification accuracy by platforms such as iSpot (Silvertown et al. 2015).
Directions for the future of iNaturalist in Australia
With Australian contributions to iNaturalist continuing to accelerate exponentially across all metrics, including number of observations, observers, and species, increasingly large datasets will become available to researchers in the future. By optimising when, where and how biodiversity is sampled and identified (Callaghan et al. 2019), the scope for research opportunities and applications of the data is immense. We propose the following four key future research directions for the use of iNaturalist data by Australian ecological researchers: (1) use of existing data to model species distributions in space and time, (2) extraction of secondary data from observations, (3) increased collaboration with taxonomic experts, and (4) dynamic use of the data and integration into policy planning.
Given the scale of massive citizen science datasets, many applications of these data lie in estimating the abundance of species across space and time (Tulloch et al. 2013; Chandler et al. 2017; Callaghan et al. 2020b). Indeed, outside Australia, iNaturalist data have already been used to inform local population trends (Erickson and Burt 2019) and model species distributions at a continental scale (Wang et al. 2018). With over 1.6 million observations having already been submitted for Australia, a major focus of research in the near future should be its use for modelling species distributions and detecting population trends in space and time. The paucity of current research from an Australian iNaturalist perspective highlights the need to focus on large-scale trends using massive datasets; many of the papers that do utilise Australian iNaturalist data are brief records of range shifts or rare species at novel locations (Booth and Sear 2018; Hewish 2019; Schubert 2020), whereas other papers have used Australian data as part of assessments of data quality (Hochmair et al. 2020). Although iNaturalist is largely restricted to presence-only data, there is an increasing number of methods able to account for missing absence data (Fithian et al. 2015; Roberts et al. 2017), mostly by integrating citizen science data with data from other sources such as remote sensing or professional surveys (He et al. 2015; Pacifici et al. 2017).
iNaturalist is also an untapped resource for valuable secondary data beyond spatiotemporal coordinates on a map (Gazdic and Groom 2019; Callaghan et al. 2020b). Although this potential has been recently realised in North America, with studies undertaking continent-scale assessments of phenotypic (Drury et al. 2019) and phenological data (Barve et al. 2020) using iNaturalist observations, these applications are mostly unrealised in an Australian context. Capitalising on this secondary information, for example, extracting plant–pollinator relationships or colour morphs across a species’ range, will vastly expand the already considerable potential of Australian iNaturalist observations as a source for understanding biodiversity (Tulloch et al. 2013).
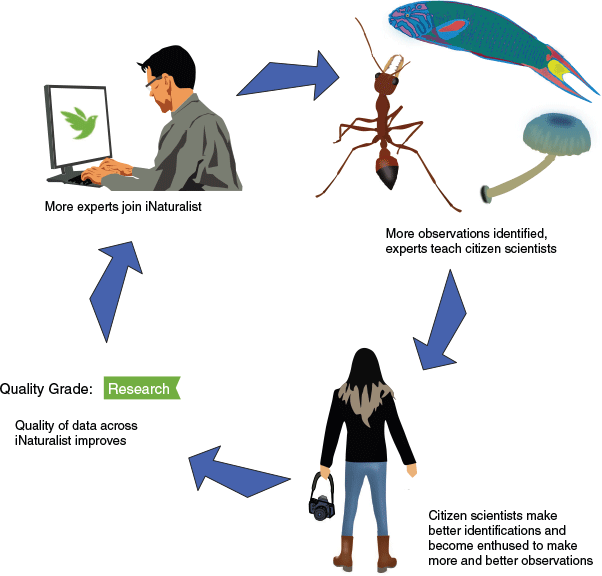
A crucial direction to help facilitate improvement of the data is the continued recruitment of Australian taxonomic experts, particularly for esoteric taxa for which iNaturalist currently has few trained identifiers. Greater involvement by these experts will facilitate learning by citizen scientists (Domroese and Johnson 2017; Parrish et al. 2018), motivating them to make more and better observations (e.g. learning which features are required for different taxa, and photographing these accordingly to promote easier identification). In turn, this will improve the data further, thus attracting more experts in a positive feedback loop (Fig. 6).
|
Finally, we highlight the need for, and importance of, using Australian iNaturalist data to inform policy. Scientific policy decisions are often dictated, for the worse, by the costs associated with data collection and research (Vuong 2018), and these decisions can have significant negative repercussions for biodiversity (Azevedo-Santos et al. 2017). Because citizen science data are typically collected and verified at little or no cost, a model followed by iNaturalist, integration with professional data collection greatly reduces the costs of ecological monitoring and expedites scientific discoveries (Cavalier and Kennedy 2016; Nascimento et al. 2018), providing incentivisation for policymakers to utilise these data so as to implement meaningful policies. This is especially important in Australian cities, where the disproportionate presence of threatened species compared with less urban areas provides many opportunities for conservation practitioners and policymakers to engage with citizen science (Ives et al. 2016). Collaboration within iNaturalist is also a boon for policy; the ability for taxonomic experts to review data points and provide identifications in real time increases the legitimacy of the data and better informs policy and legislation (Couvet et al. 2008; Jones et al. 2019), with the expediency of this data filtering being especially important to ameliorate the consistently slow transfer of research findings into policy (Dunn et al. 2018). Given that the science–policy interface in Australian government has been historically characterised by conflicting ideologies, poor communication and systemic inflexibility (Hickey et al. 2013), iNaturalist Australia has a critical role to play.
Conclusions
Australia’s contributions to iNaturalist are significant (e.g. Fig. 2). Moving beyond singular records of interesting and unique data points (e.g. Fig. 1) and, instead, focusing on the integration of Australian iNaturalist data into professional ecological research is an important future step towards fully realising the value of these data. That citizen science data can significantly contribute to broad-scale ecological databases and drive research in spatial ecology, conservation, and macro-ecology is clear (Kobori et al. 2016; Poisson et al. 2020), and although well structured citizen science projects produce the most robust data, even projects with opportunistic data collection and little participant training can still contribute to ecological monitoring (Brown and Williams 2019). Given that the establishment of robust databases is a crucial facet of ecological research (Osawa 2019), iNaturalist is well positioned to be a major source of ecological data into the future to better understand Australian ecology and conservation. Although the value of these data for use in broad ecological research and biodiversity monitoring is increasingly being recognised, there is still great potential for improvement. The optimisation of data sampling, recruitment of more taxonomic experts, and increased exploration of secondary data integration are all important drivers of this improvement, and will drive better science–policy communication.
Conflicts of interest
The authors declare no conflicts of interest.
Acknowledgements
We thank the thousands of contributors who have uploaded observations of Australian species, and identified these observations for others. Thanks also to Mark McGrouther for providing material for the Australasian Fishes section. Two anonymous reviewers provided thoughtful comments that substantially improved this manuscript. This research did not receive any specific funding.
References
Aceves‐Bueno, E., Adeleye, A. S., Feraud, M., Huang, Y., Tao, M., Yang, Y., and Anderson, S. E. (2017). The accuracy of citizen science data: a quantitative review. Bulletin of the Ecological Society of America 98, 278–290.| The accuracy of citizen science data: a quantitative review.Crossref | GoogleScholarGoogle Scholar |
Agarwal, M. (2017). First record of Dendronotus orientalis (Baba, 1932) (Nudibranchia: Dendronotidae) in the temperate eastern Pacific. BioInvasions Records 6, 135–138.
| First record of Dendronotus orientalis (Baba, 1932) (Nudibranchia: Dendronotidae) in the temperate eastern Pacific.Crossref | GoogleScholarGoogle Scholar |
Azevedo-Santos, V. M., Fearnside, P. M., Oliveira, C. S., Padial, A. A., Pelicice, F. M., Lima, D. P., Simberloff, D., Lovejoy, T. E., Magalhaes, A. L., Orsi, M. L., and Agostinho, A. A. (2017). Removing the abyss between conservation science and policy decisions in Brazil. Biodiversity and Conservation 26, 1745–1752.
| Removing the abyss between conservation science and policy decisions in Brazil.Crossref | GoogleScholarGoogle Scholar |
Barve, V. V., Brenskelle, L., Li, D., Stucky, B. J., Barve, N. V., Hantak, M. M., McLean, B. S., Paluh, D. J., Oswald, J. A., Belitz, M. W., and Folk, R. A. (2020). Methods for broad‐scale plant phenology assessments using citizen scientists’ photographs. Applications in Plant Sciences 8, e11315.
| Methods for broad‐scale plant phenology assessments using citizen scientists’ photographs.Crossref | GoogleScholarGoogle Scholar | 31993257PubMed |
Baumann, J. M., Walker, K., Threlfall, C., and Williams, N. S. (2016). African Carder bee, Afranthidium (Immanthidium) repetitum (Hymenoptera: Megachilidae): a new exotic species for Victoria. Victorian Naturalist 133, 21.
Bean, M. J., and Wilcove, D. S. (1997). The private-land problem. Conservation Biology 11, 1–2.
| The private-land problem.Crossref | GoogleScholarGoogle Scholar |
Bird, T. J., Bates, A. E., Lefcheck, J. S., Hill, N. A., Thomson, R. J., Edgar, G. J., Stuart-Smith, R. D., Wotherspoon, S., Krkosek, M., Stuart-Smith, J. F., Pecl, G. T., Barrett, N., and Frusher, S. (2014). Statistical solutions for error and bias in global citizen science datasets. Biological Conservation 173, 144–154.
| Statistical solutions for error and bias in global citizen science datasets.Crossref | GoogleScholarGoogle Scholar |
Blackburn, T. M., Bellard, C., and Ricciardi, A. (2019). Alien versus native species as drivers of recent extinctions. Frontiers in Ecology and the Environment 17, 203–207.
| Alien versus native species as drivers of recent extinctions.Crossref | GoogleScholarGoogle Scholar |
Boakes, E. H., McGowan, P. J., Fuller, R. A., Chang-qing, D., Clark, N. E., O’Connor, K., and Mace, G. M. (2010). Distorted views of biodiversity: spatial and temporal bias in species occurrence data. PLoS Biology 8, e1000385.
| Distorted views of biodiversity: spatial and temporal bias in species occurrence data.Crossref | GoogleScholarGoogle Scholar | 20532234PubMed |
Booth, D. J., and Sear, J. (2018). Coral expansion in Sydney and associated coral-reef fishes. Coral Reefs 37, 995.
| Coral expansion in Sydney and associated coral-reef fishes.Crossref | GoogleScholarGoogle Scholar |
Brito, D. (2010). Overcoming the Linnean shortfall: data deficiency and biological survey priorities. Basic and Applied Ecology 11, 709–713.
| Overcoming the Linnean shortfall: data deficiency and biological survey priorities.Crossref | GoogleScholarGoogle Scholar |
Brown, E. D., and Williams, B. K. (2019). The potential for citizen science to produce reliable and useful information in ecology. Conservation Biology 33, 561–569.
| The potential for citizen science to produce reliable and useful information in ecology.Crossref | GoogleScholarGoogle Scholar | 30242907PubMed |
Burgess, H. K., DeBey, L. B., Froehlich, H. E., Schmidt, N., Theobald, E. J., Ettinger, A. K., HilleRisLambers, J., Tewksbury, J., and Parrish, J. K. (2017). The science of citizen science: exploring barriers to use as a primary research tool. Biological Conservation 208, 113–120.
| The science of citizen science: exploring barriers to use as a primary research tool.Crossref | GoogleScholarGoogle Scholar |
Callaghan, C. T., Poore, A. G., Major, R. E., Rowley, J. J., and Cornwell, W. K. (2019). Optimizing future biodiversity sampling by citizen scientists. Proceedings. Biological Sciences 286, 20191487.
| Optimizing future biodiversity sampling by citizen scientists.Crossref | GoogleScholarGoogle Scholar | 31575364PubMed |
Callaghan, C. T., Ozeroff, I., Hitchcock, C., and Chandler, M. (2020a). Capitalizing on opportunistic science data to monitor urban biodiversity: a multi-taxa framework. Biological Conservation 251, 108753.
Callaghan, C. T., Poore, A. G., Mesaglio, T., Moles, A. T., Nakagawa, S., Roberts, C., Rowley, J. J., Vergés, A., Wilshire, J. H., and Cornwell, W. K. (2020b). Three frontiers for the future of biodiversity research using citizen science data. BioScience 71, 55–63.
| Three frontiers for the future of biodiversity research using citizen science data.Crossref | GoogleScholarGoogle Scholar |
Callaghan, C. T., Roberts, J. D., Poore, A. G., Alford, R. A., Cogger, H., and Rowley, J. J. (2020c). Citizen science data accurately predicts expert-derived species richness at a continental scale when sampling thresholds are met. Biodiversity and Conservation 29, 1323–1337.
| Citizen science data accurately predicts expert-derived species richness at a continental scale when sampling thresholds are met.Crossref | GoogleScholarGoogle Scholar |
Campos‐Cerqueira, M., and Aide, T. M. (2016). Improving distribution data of threatened species by combining acoustic monitoring and occupancy modelling. Methods in Ecology and Evolution 7, 1340–1348.
| Improving distribution data of threatened species by combining acoustic monitoring and occupancy modelling.Crossref | GoogleScholarGoogle Scholar |
Cardoso, P., Erwin, T. L., Borges, P. A., and New, T. R. (2011). The seven impediments in invertebrate conservation and how to overcome them. Biological Conservation 144, 2647–2655.
| The seven impediments in invertebrate conservation and how to overcome them.Crossref | GoogleScholarGoogle Scholar |
Cavalier, D., and Kennedy, E. B. (Eds) (2016). ‘The Rightful Place of Science: Citizen Science.’ (Consortium for Science, Policy & Outcomes.)
Ceballos, G., Ehrlich, P. R., and Dirzo, R. (2017). Biological annihilation via the ongoing sixth mass extinction signaled by vertebrate population losses and declines. Proceedings of the National Academy of Sciences of the United States of America 114, E6089–E6096.
| Biological annihilation via the ongoing sixth mass extinction signaled by vertebrate population losses and declines.Crossref | GoogleScholarGoogle Scholar | 28696295PubMed |
Chandler, M., See, L., Copas, K., Bonde, A. M., López, B. C., Danielsen, F., Legind, J. K., Masinde, S., Miller-Rushing, A. J., Newman, G., and Rosemartin, A. (2017). Contribution of citizen science towards international biodiversity monitoring. Biological Conservation 213, 280–294.
| Contribution of citizen science towards international biodiversity monitoring.Crossref | GoogleScholarGoogle Scholar |
Couvet, D., Jiguet, F., Julliard, R., Levrel, H., and Teyssedre, A. (2008). Enhancing citizen contributions to biodiversity science and public policy. Interdisciplinary Science Reviews 33, 95–103.
| Enhancing citizen contributions to biodiversity science and public policy.Crossref | GoogleScholarGoogle Scholar |
Danielsen, F., Burgess, N. D., and Balmford, A. (2005). Monitoring matters: examining the potential of locally-based approaches. Biodiversity and Conservation 14, 2507–2542.
| Monitoring matters: examining the potential of locally-based approaches.Crossref | GoogleScholarGoogle Scholar |
de Vries, M., Land-Zandstra, A., and Smeets, I. (2019). Citizen scientists’ preferences for communication of scientific output: a literature review. Citizen Science: Theory and Practice 4, 1–13.
Dickinson, J. L., Shirk, J., Bonter, D., Bonney, R., Crain, R. L., Martin, J., Phillips, T., and Purcell, K. (2012). The current state of citizen science as a tool for ecological research and public engagement. Frontiers in Ecology and the Environment 10, 291–297.
| The current state of citizen science as a tool for ecological research and public engagement.Crossref | GoogleScholarGoogle Scholar |
Didham, R. K., Barbero, F., Collins, C. M., Forister, M. L., Hassall, C., Leather, S. R., Packer, L., Saunders, M. E., and Stewart, A. J. (2020a). Spotlight on insects: trends, threats and conservation challenges. Insect Conservation and Diversity 13, 99–102.
| Spotlight on insects: trends, threats and conservation challenges.Crossref | GoogleScholarGoogle Scholar |
Didham, R. K., Basset, Y., Collins, C. M., Leather, S. R., Littlewood, N. A., Menz, M. H., Müller, J., Packer, L., Saunders, M. E., Schönrogge, K., and Stewart, A. J. (2020b). Interpreting insect declines: seven challenges and a way forward. Insect Conservation and Diversity 13, 103–114.
| Interpreting insect declines: seven challenges and a way forward.Crossref | GoogleScholarGoogle Scholar |
Domroese, M. C., and Johnson, E. A. (2017). Why watch bees? Motivations of citizen science volunteers in the Great Pollinator Project. Biological Conservation 208, 40–47.
| Why watch bees? Motivations of citizen science volunteers in the Great Pollinator Project.Crossref | GoogleScholarGoogle Scholar |
Dowthwaite, L., and Sprinks, J. (2019). Citizen science and the professional–amateur divide: lessons from differing online practices. Journal of Science Communication 18, A06.
| Citizen science and the professional–amateur divide: lessons from differing online practices.Crossref | GoogleScholarGoogle Scholar |
Drury, J. P., Barnes, M., Finneran, A. E., Harris, M., and Grether, G. F. (2019). Continent‐scale phenotype mapping using citizen scientists’ photographs. Ecography 42, 1436–1445.
| Continent‐scale phenotype mapping using citizen scientists’ photographs.Crossref | GoogleScholarGoogle Scholar |
Dunn, G., Bos, J. J., and Brown, R. R. (2018). Mediating the science-policy interface: insights from the urban water sector in Melbourne, Australia. Environmental Science & Policy 82, 143–150.
| Mediating the science-policy interface: insights from the urban water sector in Melbourne, Australia.Crossref | GoogleScholarGoogle Scholar |
Einoder, L. D., Southwell, D. M., Lahoz-Monfort, J. J., Gillespie, G. R., Fisher, A., and Wintle, B. A. (2018). Occupancy and detectability modelling of vertebrates in northern Australia using multiple sampling methods. PLoS One 13, e0203304.
| Occupancy and detectability modelling of vertebrates in northern Australia using multiple sampling methods.Crossref | GoogleScholarGoogle Scholar | 30335847PubMed |
Ellwood, E. R., Crimmins, T. M., and Miller-Rushing, A. J. (2017). Citizen science and conservation: recommendations for a rapidly moving field. Biological Conservation 208, 1–4.
| Citizen science and conservation: recommendations for a rapidly moving field.Crossref | GoogleScholarGoogle Scholar |
Emery, R. N., Fagan, L., McCauley, R., Hardie, D., Hammond, N., Cook, D., Wright, D., Cousins, D., Russell, J., and Garel, N. (2016). MyPestGuide – the ‘BEST’ suite of biosecurity engagement and surveillance tools. In ‘2016 International Congress of Entomology’. (Entomological Society of America: Annapolis, MD, USA.)
Erickson, R. A., and Burt, W. G. (2019). Additional information on a nonnative whiptail population (Aspidoscelis flagellicauda/sonorae complex) in suburban Orange County, California. Bulletin of the Southern California Academy of Sciences 118, 76–78.
| Additional information on a nonnative whiptail population (Aspidoscelis flagellicauda/sonorae complex) in suburban Orange County, California.Crossref | GoogleScholarGoogle Scholar |
Fetterplace, L. C., Turnbull, J. W., Knott, N. A., and Hardy, N. A. (2018). The devil in the deep: expanding the known habitat of a rare and protected fish. European Journal of Ecology 4, 22–29.
| The devil in the deep: expanding the known habitat of a rare and protected fish.Crossref | GoogleScholarGoogle Scholar |
Fithian, W., Elith, J., Hastie, T., and Keith, D. A. (2015). Bias correction in species distribution models: pooling survey and collection data for multiple species. Methods in Ecology and Evolution 6, 424–438.
| Bias correction in species distribution models: pooling survey and collection data for multiple species.Crossref | GoogleScholarGoogle Scholar | 27840673PubMed |
Gazdic, M., and Groom, Q. (2019). iNaturalist is an unexploited source of plant–insect interaction data. Biodiversity Information Science and Standards 3, e37303.
| iNaturalist is an unexploited source of plant–insect interaction data.Crossref | GoogleScholarGoogle Scholar |
Geldmann, J., Heilmann‐Clausen, J., Holm, T. E., Levinsky, I., Markussen, B., Olsen, K., Rahbek, C., and Tøttrup, A. P. (2016). What determines spatial bias in citizen science? Exploring four recording schemes with different proficiency requirements. Diversity & Distributions 22, 1139–1149.
| What determines spatial bias in citizen science? Exploring four recording schemes with different proficiency requirements.Crossref | GoogleScholarGoogle Scholar |
Grube, M., Gaya, E., Kauserud, H., Smith, A. M., Avery, S. V., Fernstad, S. J., Muggia, L., Martin, M. D., Eivindsen, T., Koljalg, U., and Bendiksby, M. (2017). The next generation fungal diversity researcher. Fungal Biology Reviews 31, 124–130.
| The next generation fungal diversity researcher.Crossref | GoogleScholarGoogle Scholar |
Harvey, J. A., Heinen, R., Armbrecht, I., Basset, Y., Baxter-Gilbert, J. H., Bezemer, T. M., Böhm, M., Bommarco, R., Borges, P. A., Cardoso, P., and Clausnitzer, V. (2020). International scientists formulate a roadmap for insect conservation and recovery. Nature Ecology & Evolution 4, 174–176.
| International scientists formulate a roadmap for insect conservation and recovery.Crossref | GoogleScholarGoogle Scholar |
He, K. S., Bradley, B. A., Cord, A. F., Rocchini, D., Tuanmu, M. N., Schmidtlein, S., Turner, W., Wegmann, M., and Pettorelli, N. (2015). Will remote sensing shape the next generation of species distribution models? Remote Sensing in Ecology and Conservation 1, 4–18.
| Will remote sensing shape the next generation of species distribution models?Crossref | GoogleScholarGoogle Scholar |
Hewish, M. (2019). Swamp Bluet Coenagrion lyelli Tillyard (Odonata: Zygoptera: Coenagrionidae) In South Australia. Victorian Entomologist 49, 81.
Hickey, G. M., Forest, P., Sandall, J. L., Lalor, B. M., and Keenan, R. J. (2013). Managing the environmental science–policy nexus in government: perspectives from public servants in Canada and Australia. Science & Public Policy 40, 529–543.
| Managing the environmental science–policy nexus in government: perspectives from public servants in Canada and Australia.Crossref | GoogleScholarGoogle Scholar |
Hochmair, H. H., Scheffrahn, R. H., Basille, M., and Boone, M. (2020). Evaluating the data quality of iNaturalist termite records. PLoS One 15, e0226534.
| Evaluating the data quality of iNaturalist termite records.Crossref | GoogleScholarGoogle Scholar | 32365126PubMed |
Hoffmann, B. D., and Broadhurst, L. M. (2016). The economic cost of managing invasive species in Australia. NeoBiota 31, 1–18.
| The economic cost of managing invasive species in Australia.Crossref | GoogleScholarGoogle Scholar |
Hutchings, P. (2019). An advocate for taxonomic research in Australia. Pacific Conservation Biology 25, 34–36.
| An advocate for taxonomic research in Australia.Crossref | GoogleScholarGoogle Scholar |
Irga, P. J., Barker, K., and Torpy, F. R. (2018). Conservation mycology in Australia and the potential role of citizen science. Conservation Biology 32, 1031–1037.
| Conservation mycology in Australia and the potential role of citizen science.Crossref | GoogleScholarGoogle Scholar | 29687520PubMed |
Isaac, N. J., van Strien, A. J., August, T. A., de Zeeuw, M. P., and Roy, D. B. (2014). Statistics for citizen science: extracting signals of change from noisy ecological data. Methods in Ecology and Evolution 5, 1052–1060.
| Statistics for citizen science: extracting signals of change from noisy ecological data.Crossref | GoogleScholarGoogle Scholar |
Ives, C. D., Lentini, P. E., Threlfall, C. G., Ikin, K., Shanahan, D. F., Garrard, G. E., Bekessy, S. A., Fuller, R. A., Mumaw, L., Rayner, L., and Rowe, R. (2016). Cities are hotspots for threatened species. Global Ecology and Biogeography 25, 117–126.
| Cities are hotspots for threatened species.Crossref | GoogleScholarGoogle Scholar |
Jain, A., Chan, S. K. M., Soh, M., and Chow, L. (2019). Rediscovery of the orange gull butterfly, Cepora iudith malaya, in Singapore. Singapore Biodiversity Records , 22–23.
Johnson, M. F., Hannah, C., Acton, L., Popovici, R., Karanth, K. K., and Weinthal, E. (2014). Network environmentalism: citizen scientists as agents for environmental advocacy. Global Environmental Change 29, 235–245.
| Network environmentalism: citizen scientists as agents for environmental advocacy.Crossref | GoogleScholarGoogle Scholar |
Jones, C. D., Glon, M. G., Cedar, K., Paiero, S. M., Pratt, P. D., and Preney, T. J. (2019). First record of paintedhand mudbug (Lacunicambarus polychromatus) in Ontario and Canada and the significance of iNaturalist in making new discoveries. Canadian Field Naturalist 133, 160–166.
| First record of paintedhand mudbug (Lacunicambarus polychromatus) in Ontario and Canada and the significance of iNaturalist in making new discoveries.Crossref | GoogleScholarGoogle Scholar |
Kirchhoff, C., Callaghan, C. T., Keith, D. A., Indiarto, D., Taseski, G., Ooi, M. K., Le Breton, T. D., Mesaglio, T., Kingsford, R. T., and Cornwell, W. (2021). Rapidly mapping fire effects on biodiversity at a large-scale using citizen science. The Science of the Total Environment 755, 142348.
| Rapidly mapping fire effects on biodiversity at a large-scale using citizen science.Crossref | GoogleScholarGoogle Scholar | 33045599PubMed |
Kobori, H., Dickinson, J. L., Washitani, I., Sakurai, R., Amano, T., Komatsu, N., Kitamura, W., Takagawa, S., Koyama, K., Ogawara, T., and Miller-Rushing, A. J. (2016). Citizen science: a new approach to advance ecology, education, and conservation. Ecological Research 31, 1–19.
| Citizen science: a new approach to advance ecology, education, and conservation.Crossref | GoogleScholarGoogle Scholar |
Lehtinen, R. M., Carlson, B. M., Hamm, A. R., Riley, A. G., Mullin, M. M., and Gray, W. J. (2020). Dispatches from the neighborhood watch: using citizen science and field survey data to document color morph frequency in space and time. Ecology and Evolution 10, 1526–1538.
| Dispatches from the neighborhood watch: using citizen science and field survey data to document color morph frequency in space and time.Crossref | GoogleScholarGoogle Scholar | 32076531PubMed |
Lepczyk, C. A. (2005). Integrating published data and citizen science to describe bird diversity across a landscape. Journal of Applied Ecology 42, 672–677.
| Integrating published data and citizen science to describe bird diversity across a landscape.Crossref | GoogleScholarGoogle Scholar |
Liu, X., Blackburn, T. M., Song, T., Wang, X., Huang, C., and Li, Y. (2020). Animal invaders threaten protected areas worldwide. Nature Communications 11, 1–9.
Lloyd, T. J., Fuller, R. A., Oliver, J. L., Tulloch, A., Barnes, M., and Steven, R. (2020). Estimating the spatial coverage of citizen science for monitoring threatened species. Global Ecology and Conservation 23, e01048.
| Estimating the spatial coverage of citizen science for monitoring threatened species.Crossref | GoogleScholarGoogle Scholar |
McKinley, D. C., Miller-Rushing, A. J., Ballard, H. L., Bonney, R., Brown, H., Cook-Patton, S. C., Evans, D. M., French, R. A., Parrish, J. K., Phillips, T. B., and Ryan, S. F. (2017). Citizen science can improve conservation science, natural resource management, and environmental protection. Biological Conservation 208, 15–28.
| Citizen science can improve conservation science, natural resource management, and environmental protection.Crossref | GoogleScholarGoogle Scholar |
Nascimento, S., Rubio Iglesias, J. M., Owen, R., Schade, S., and Shanley, L. (2018). Citizen science for policy formulation and implementation. In ‘Citizen Science: Innovation in Open Science, Society and Policy’. (Eds S. Hecker, M. Haklay, A. Bowser, Z. Makuch, J. Vogel, and A. Bonn.) pp. 219–240. (UCL Press: London, UK.)
New, T. R. (2018). Promoting and developing insect conservation in Australia’s urban environments. Austral Entomology 57, 182–193.
| Promoting and developing insect conservation in Australia’s urban environments.Crossref | GoogleScholarGoogle Scholar |
Osawa, T. (2019). Perspectives on biodiversity informatics for ecology. Ecological Research 34, 446–456.
| Perspectives on biodiversity informatics for ecology.Crossref | GoogleScholarGoogle Scholar |
Pacifici, K., Reich, B. J., Miller, D. A., Gardner, B., Stauffer, G., Singh, S., McKerrow, A., and Collazo, J. A. (2017). Integrating multiple data sources in species distribution modeling: a framework for data fusion. Ecology 98, 840–850.
| Integrating multiple data sources in species distribution modeling: a framework for data fusion.Crossref | GoogleScholarGoogle Scholar | 28027588PubMed |
Parrish, J. K., Burgess, H., Weltzin, J. F., Fortson, L., Wiggins, A., and Simmons, B. (2018). Exposing the science in citizen science: fitness to purpose and intentional design. Integrative and Comparative Biology 58, 150–160.
| 29790942PubMed |
Pearse, H. (2020). Deliberation, citizen science and covid‐19. The Political Quarterly 91, 571–577.
| Deliberation, citizen science and covid‐19.Crossref | GoogleScholarGoogle Scholar |
Piccolo, R. L., Warnken, J., Chauvenet, A. L. M., and Castley, J. G. (2020). Location biases in ecological research on Australian terrestrial reptiles. Scientific Reports 10, 9691.
| Location biases in ecological research on Australian terrestrial reptiles.Crossref | GoogleScholarGoogle Scholar | 32546845PubMed |
Pocock, M. J., Tweddle, J. C., Savage, J., Robinson, L. D., and Roy, H. E. (2017). The diversity and evolution of ecological and environmental citizen science. PLoS One 12, e0172579.
| The diversity and evolution of ecological and environmental citizen science.Crossref | GoogleScholarGoogle Scholar | 28369087PubMed |
Pocock, M. J., Roy, H. E., August, T., Kuria, A., Barasa, F., Bett, J., Githiru, M., Kairo, J., Kimani, J., Kinuthia, W., and Kissui, B. (2019). Developing the global potential of citizen science: assessing opportunities that benefit people, society and the environment in East Africa. Journal of Applied Ecology 56, 274–281.
| Developing the global potential of citizen science: assessing opportunities that benefit people, society and the environment in East Africa.Crossref | GoogleScholarGoogle Scholar |
Poisson, A. C., McCullough, I. M., Cheruvelil, K. S., Elliott, K. C., Latimore, J. A., and Soranno, P. A. (2020). Quantifying the contribution of citizen science to broad‐scale ecological databases. Frontiers in Ecology and the Environment 18, 19–26.
| Quantifying the contribution of citizen science to broad‐scale ecological databases.Crossref | GoogleScholarGoogle Scholar |
Richart, C. H., Chichester, L. F., Boyer, B., and Pearce, T. A. (2019). Rediscovery of the southern California endemic American Keeled Slug Anadenulus cockerelli (Hemphill, 1890) after a 68-year hiatus. Journal of Natural History 53, 1515–1531.
| Rediscovery of the southern California endemic American Keeled Slug Anadenulus cockerelli (Hemphill, 1890) after a 68-year hiatus.Crossref | GoogleScholarGoogle Scholar |
Richter, R. (2015). Rediscovery of the rare coccinellid Micraspis flavovittata (Crotch, 1874) in western Victoria (Coleoptera: Coccinellidae). Australian Entomologist 42, 73.
Roberts, D. R., Bahn, V., Ciuti, S., Boyce, M. S., Elith, J., Guillera‐Arroita, G., Hauenstein, S., Lahoz‐Monfort, J. J., Schröder, B., Thuiller, W., and Warton, D. I. (2017). Cross‐validation strategies for data with temporal, spatial, hierarchical, or phylogenetic structure. Ecography 40, 913–929.
| Cross‐validation strategies for data with temporal, spatial, hierarchical, or phylogenetic structure.Crossref | GoogleScholarGoogle Scholar |
Rowley, J. J., Callaghan, C. T., Cutajar, T., Portway, C., Potter, K., Mahony, S., Trembath, D. F., Flemons, P., and Woods, A. (2019). FrogID: citizen scientists provide validated biodiversity data on frogs of Australia. Herpetological Conservation and Biology 14, 155–170.
Roy‐Dufresne, E., Saltré, F., Cooke, B. D., Mellin, C., Mutze, G., Cox, T., and Fordham, D. A. (2019). Modeling the distribution of a wide‐ranging invasive species using the sampling efforts of expert and citizen scientists. Ecology and Evolution 9, 11053–11063.
| Modeling the distribution of a wide‐ranging invasive species using the sampling efforts of expert and citizen scientists.Crossref | GoogleScholarGoogle Scholar | 31641454PubMed |
Sands, D. P. (2018). Important issues facing insect conservation in Australia: now and into the future. Austral Entomology 57, 150–172.
| Important issues facing insect conservation in Australia: now and into the future.Crossref | GoogleScholarGoogle Scholar |
Schmidt‐Lebuhn, A. N., Knerr, N. J., and González‐Orozco, C. E. (2012). Distorted perception of the spatial distribution of plant diversity through uneven collecting efforts: the example of Asteraceae in Australia. Journal of Biogeography 39, 2072–2080.
| Distorted perception of the spatial distribution of plant diversity through uneven collecting efforts: the example of Asteraceae in Australia.Crossref | GoogleScholarGoogle Scholar |
Schubert, J. (2020). First records of Maratus robinsoni Otto & Hill 2012 and Maratus vultus Otto & Hill 2016 (Araneae: Salticidae: Euophryini: Maratus Karsch 1878) from Victoria, Australia. Peckhamia 206, 1–7.
Silvertown, J., Harvey, M., Greenwood, R., Dodd, M., Rosewell, J., Rebelo, T., Ansine, J., and McConway, K. (2015). Crowdsourcing the identification of organisms: a case-study of iSpot. ZooKeys 480, 125–146.
| Crowdsourcing the identification of organisms: a case-study of iSpot.Crossref | GoogleScholarGoogle Scholar |
Simmons, B. I., Balmford, A., Bladon, A. J., Christie, A. P., De Palma, A., Dicks, L. V., Gallego‐Zamorano, J., Johnston, A., Martin, P. A., Purvis, A., and Rocha, R. (2019). Worldwide insect declines: an important message, but interpret with caution. Ecology and Evolution 9, 3678–3680.
| Worldwide insect declines: an important message, but interpret with caution.Crossref | GoogleScholarGoogle Scholar | 31015957PubMed |
Skejo, J., Connors, M., Hendriksen, M., Lambert, N., Chong, G., McMaster, I., Monaghan, N., Rentz, D., Richter, R., Rose, K., and Franjević, D. (2020). Online social media tells a story of Anaselina, Paraselina, and Selivinga (Orthoptera, Tetrigidae), rare Australian pygmy grasshoppers. ZooKeys 948, 107–119.
| Online social media tells a story of Anaselina, Paraselina, and Selivinga (Orthoptera, Tetrigidae), rare Australian pygmy grasshoppers.Crossref | GoogleScholarGoogle Scholar | 32765173PubMed |
Steven, R., Barnes, M., Garnett, S. T., Garrard, G., O’Connor, J., Oliver, J. L., Robinson, C., Tulloch, A., and Fuller, R. A. (2019). Aligning citizen science with best practice: threatened species conservation in Australia. Conservation Science and Practice 1, e100.
| Aligning citizen science with best practice: threatened species conservation in Australia.Crossref | GoogleScholarGoogle Scholar |
Taylor, G. S., Braby, M. F., Moir, M. L., Harvey, M. S., Sands, D. P., New, T. R., Kitching, R. L., McQuillan, P. B., Hogendoorn, K., Glatz, R. V., and Andren, M. (2018). Strategic national approach for improving the conservation management of insects and allied invertebrates in Australia. Austral Entomology 57, 124–149.
| Strategic national approach for improving the conservation management of insects and allied invertebrates in Australia.Crossref | GoogleScholarGoogle Scholar |
Troudet, J., Grandcolas, P., Blin, A., Vignes-Lebbe, R., and Legendre, F. (2017). Taxonomic bias in biodiversity data and societal preferences. Scientific Reports 7, 9132.
| Taxonomic bias in biodiversity data and societal preferences.Crossref | GoogleScholarGoogle Scholar | 28831097PubMed |
Tulloch, A. I. T., Possingham, H. P., Joseph, L. N., Szabo, J., and Martin, T. G. (2013). Realising the full potential of citizen science monitoring programs. Biological Conservation 165, 128–138.
| Realising the full potential of citizen science monitoring programs.Crossref | GoogleScholarGoogle Scholar |
Turak, E., Bush, A., Dela-Cruz, J., and Powell, M. (2020). Freshwater reptile persistence and conservation in cities: insights from species occurrence records. Water (Basel) 12, 651.
| Freshwater reptile persistence and conservation in cities: insights from species occurrence records.Crossref | GoogleScholarGoogle Scholar |
Uyeda, K. A., Stow, D. A., and Richart, C. H. (2020). Assessment of volunteered geographic information for vegetation mapping. Environmental Monitoring and Assessment 192, 554.
| Assessment of volunteered geographic information for vegetation mapping.Crossref | GoogleScholarGoogle Scholar | 32737593PubMed |
Vásquez-Restrepo, J. D., and Lapwong, Y. (2018). Confirming the presence of a fourth species of non-native house gecko of the genus Hemidactylus Oken, 1817 (Squamata, Gekkonidae) in Colombia. Check List 14, 665.
| Confirming the presence of a fourth species of non-native house gecko of the genus Hemidactylus Oken, 1817 (Squamata, Gekkonidae) in Colombia.Crossref | GoogleScholarGoogle Scholar |
Vuong, Q. H. (2018). The (ir)rational consideration of the cost of science in transition economies. Nature Human Behaviour 2, 5.
| The (ir)rational consideration of the cost of science in transition economies.Crossref | GoogleScholarGoogle Scholar | 30980055PubMed |
Wagner, D. L. (2020). Insect declines in the Anthropocene. Annual Review of Entomology 65, 457–480.
| Insect declines in the Anthropocene.Crossref | GoogleScholarGoogle Scholar | 31610138PubMed |
Walker, K. (2014). BowerBird: a home for Australian citizen science. Wildlife Australia 51, 34.
Wang, Y., Casajus, N., Buddle, C., Berteaux, D., and Larrivée, M. (2018). Predicting the distribution of poorly-documented species, Northern black widow (Latrodectus variolus) and Black purse-web spider (Sphodros niger), using museum specimens and citizen science data. PLoS One 13, e0201094.
| Predicting the distribution of poorly-documented species, Northern black widow (Latrodectus variolus) and Black purse-web spider (Sphodros niger), using museum specimens and citizen science data.Crossref | GoogleScholarGoogle Scholar | 30589881PubMed |
Ward, M. S., Simmonds, J. S., Reside, A. E., Watson, J. E., Rhodes, J. R., Possingham, H. P., Trezise, J., Fletcher, R., File, L., and Taylor, M. (2019). Lots of loss with little scrutiny: the attrition of habitat critical for threatened species in Australia. Conservation Science and Practice 1, e117.
| Lots of loss with little scrutiny: the attrition of habitat critical for threatened species in Australia.Crossref | GoogleScholarGoogle Scholar |
Wiggins, A., Newman, G., Stevenson, R. D., and Crowston, K. (2011). Mechanisms for data quality and validation in citizen science. In ‘2011 IEEE Seventh International Conference on e-Science Workshops’. pp. 14–19. (IEEE Computer Society: Washington, DC, USA.)
Williams, A., Althaus, F., Pogonoski, J., Osterhage, D., Gomon, M., Graham, K., Appleyard, S. A., Gledhill, D., Bray, D., McMillan, P., and Green, M. (2018). Composition, diversity and biogeographic affinities of the deep-sea (200–3000 m) fish assemblage in the Great Australian Bight, Australia. Deep-sea Research. Part II, Topical Studies in Oceanography 157–158, 92–105.
| Composition, diversity and biogeographic affinities of the deep-sea (200–3000 m) fish assemblage in the Great Australian Bight, Australia.Crossref | GoogleScholarGoogle Scholar |
Wilson, J. S., Pan, A. D., General, D. E. M., and Koch, J. B. (2020). More eyes on the prize: an observation of a very rare, threatened species of Philippine Bumble bee, Bombus irisanensis, on iNaturalist and the importance of citizen science in conservation biology. Journal of Insect Conservation 24, 727–729.
| More eyes on the prize: an observation of a very rare, threatened species of Philippine Bumble bee, Bombus irisanensis, on iNaturalist and the importance of citizen science in conservation biology.Crossref | GoogleScholarGoogle Scholar |
Woinarski, J. C., Russell-Smith, J., Andersen, A. N., and Brennan, K. (2009). Fire management and biodiversity of the western Arnhem Land Plateau. In ‘Culture, Ecology and Economy of Fire Management in North Australian Savannas: Rekindling the Wurrk Tradition’. (Eds J. Russell-Smith, P. J. Whitehead, and P. M. Cooke.) pp. 201–228. (CSIRO Publishing: Melbourne, Vic., Australia.)
Wood, C., Sullivan, B., Iliff, M., Fink, D., and Kelling, S. (2011). eBird: engaging birders in science and conservation. PLoS Biology 9, e1001220.
| eBird: engaging birders in science and conservation.Crossref | GoogleScholarGoogle Scholar | 22205876PubMed |
Young, B. E., Dodge, N., Hunt, P. D., Ormes, M., Schlesinger, M. D., and Shaw, H. Y. (2019). Using citizen science data to support conservation in environmental regulatory contexts. Biological Conservation 237, 57–62.
| Using citizen science data to support conservation in environmental regulatory contexts.Crossref | GoogleScholarGoogle Scholar |
Ziembicki, M. R., Woinarski, J. C., Webb, J. K., Vanderduys, E., Tuft, K., Smith, J., Ritchie, E. G., Reardon, T. B., Radford, I. J., Preece, N., and Perry, J. (2015). Stemming the tide: progress towards resolving the causes of decline and implementing management responses for the disappearing mammal fauna of northern Australia. Therya 6, 169–226.
| Stemming the tide: progress towards resolving the causes of decline and implementing management responses for the disappearing mammal fauna of northern Australia.Crossref | GoogleScholarGoogle Scholar |