

High survivorship and rapid population growth of the greater bilby (Macrotis lagotis) reintroduced to a feral predator exclosure
Cassandra M. Arkinstall A * , Sean I. FitzGibbon A , Kevin J. Bradley B , Katherine E. Moseby C and Peter J. Murray D
A
B
C
D
Abstract
The distribution of the threatened greater bilby (Macrotis lagotis) has significantly contracted since the introduction of feral cats and foxes. To counteract these threats, bilbies have been reintroduced to multiple feral predator exclosures and offshore islands across Australia.
The aims of this study were to monitor the reintroduction of bilbies to the feral predator exclosure at Currawinya National Park and assess three hypotheses: (1) captive-born founders would establish stable home ranges and utilise habitats similar to those of wild-born bilbies in the exclosure; (2) founders would maintain adequate body condition and weight, enabling the survival of >50% of founders at 12 months post-release; and (3) the population would rapidly increase in the absence of feral predators, due to the high reproductive potential of bilbies.
We used VHF/GPS telemetry to compare home range size and habitat use of 12 founders and 11 wild-born bilbies. Founders were monitored intensively to assess reproductive success, weight, body condition and survival. Pouch activity was monitored to examine reproductive output. Spatially explicit capture–recapture modelling was used to estimate population density/size.
The population rapidly increased to >450 bilbies after 3 years, and founder survivorship was high (70% at 12 months post-release). Male founder home ranges (248.46 ha ± 97.22) were comparable in size to wild-born males (216.74 ha ± 54.19), but female founder home ranges (51.23 ha ± 12.22) were significantly larger than wild-born females (20.80 ha ± 2.94) (P = 0.04). The doubling of the population between 2021 and 2022 may have resulted in the contraction of female home ranges. Reproductive output decreased significantly in 2022, indicating that reproduction may be density-dependent at high densities. There was a significant relationship between track counts and population estimates, indicating that track counts are a reliable method for estimating population size inside the exclosure.
This reintroduction has been highly successful to date, demonstrating that bilbies are an adaptable species capable of rapid population growth in the absence of feral predators.
Bilbies are a model species for reintroductions to feral predator exclosures due to high survival rates, reproductive output, dietary flexibility and the ability to utilise a broad range of environments.
Keywords: autocorrelated kernel density estimation, conservation translocation, Currawinya National Park, GPS telemetry, greater bilby, habitat selection, home range, marsupial, post-release monitoring, spatially explicit capture–recapture, threatened species.
Introduction
A key tool in conservation biology is the reintroduction of threatened species, particularly to sites where feral predators have either been eradicated or are at low densities (Short 2009; Armstrong et al. 2015; Legge et al. 2018; Moseby et al. 2018). There are many examples of successful mammalian reintroductions in Australia, but failures are also commonplace (Morris et al. 2015; Kanowski et al. 2018; Palmer et al. 2020). Most failed mammal reintroductions (>70%) have been directly attributed to predation by feral cats (Felis catus) or red foxes (Vulpes vulpes) (Fischer and Lindenmayer 2000; Short 2009; Moseby et al. 2011; Woinarski et al. 2019). Consequently, reintroductions to feral predator exclosures are far more likely to result in populations establishing and persisting, compared with sites where feral predators are present (Kleiman 1989; Fischer and Lindenmayer 2000; Palmer et al. 2020).
Reintroductions typically require founders to adapt rapidly to unfamiliar habitats and environmental conditions in order to survive (Stamps and Swaisgood 2007; Berger-Tal et al. 2020; Pero et al. 2022). This adjustment can involve widespread spatial exploration of the new environment soon after release (Mihoub et al. 2011; Le Gouar et al. 2012; Berger-Tal and Saltz 2014). This exploratory phase may reduce the time an individual allocates to foraging, predator vigilance or reproduction, resulting in lower rates of survival and reproductive success (Le Gouar et al. 2012). Where founders are sourced from intensively managed captive populations, their experience and behavioural responses (e.g. foraging, shelter site selection, anti-predator response, habitat selection, social interactions and mating) may not be well-suited to the release environment (Stamps and Swaisgood 2007; Berger-Tal et al. 2020). The inability of founders to develop effective behavioural responses to the release environment can rapidly lead to reintroduction failures (Moseby et al. 2016; West et al. 2018; Ross et al. 2019). Post-release monitoring is therefore critical in the early stages of a reintroduction project, to determine whether founders have successfully adapted to their new environment, while also providing invaluable information for future reintroductions (Armstrong and Seddon 2008; Hayward et al. 2015; Watkins et al. 2018; Berger-Tal et al. 2020; West et al. 2020; Moseby et al. 2023).
The threatened greater bilby (Macrotis lagotis, herein referred to as ‘bilby’) is an omnivorous, nocturnal marsupial that was once widespread across mainland Australia, occupying a broad range of habitats (Southgate 1990a, 1990b; Bradley et al. 2015; Silcock et al. 2023). Since European colonisation, the distribution of wild bilby populations has contracted to <20% of their former range, and wild populations are now found only in areas within the arid and semi-arid zones of Australia (Southgate 1990a; DCCEEW 2023). Multiple interacting factors continue to threaten remaining wild bilby populations, with predation by feral cats and foxes recognised as key threats (Paltridge 2002; Moseby et al. 2011; Burbidge et al. 2014; Bradley et al. 2015). To counteract these threats, bilbies have been successfully reintroduced to 10 fenced exclosures and one offshore island, where feral predators have been eradicated (Moseby and O’Donnell 2003; Berris et al. 2020a; Palmer et al. 2020; DCCEEW 2023).
The success of these bilby reintroductions is likely due, in part, to several key intrinsic life history traits. Bilbies have a flexible and opportunistic dietary strategy that enables them to respond rapidly to seasonal changes in food resources (Gibson 2001; Gibson and Hume 2004; Southgate and Carthew 2006; Bice and Moseby 2008). Bilbies also have high reproductive potential due to several characteristics of their reproductive biology: short gestation (~14 days); year-round reproduction (dependent on resource availability); ability to rear up to three young per litter and produce up to four litters per year; and early sexual maturation (5–6 months) (McCracken 1986; McCracken 1990; Southgate et al. 2000; McRae 2004). These traits are likely adaptations to life in unpredictable environments, enabling rapid reproduction and population growth to exploit ephemeral resources (McCracken 1990).
Evidence from previous reintroductions suggests that bilbies can adapt to a range of environments and successfully establish populations, particularly in the absence of feral predators (Moseby and O’Donnell 2003; Berris et al. 2020a; Moseby et al. 2023). Post-release monitoring of bilbies reintroduced to an exclosure in arid South Australia showed that founder mortality rates were low and reproductive output was high, despite prior landscape degradation by domestic stock and feral species (Moseby and O’Donnell 2003). Similarly, in South Australia, bilbies were reintroduced and successfully established on an offshore island with a long pastoral history (Berris et al. 2020a). Even where reintroduction sites do not appear to be high-quality habitat for bilbies, they are capable of establishing stable home ranges and successfully reproducing in the absence of feral predators (Moseby and O’Donnell 2003). Although several publications document aspects of successful bilby reintroductions, there is a lack of information relating to the survival and reproductive rates of reintroduced bilbies and population growth during the critical establishment phase (though see Moseby and O’Donnell 2003).
In this study, we monitored the reintroduction of bilbies to a feral predator exclosure in south-western Queensland during the initial 3 years, collecting data on both captive-born founders and multiple generations of their wild-born offspring. Prior to the reintroduction, the study site experienced 2–3 years of drought (Bureau of Meteorology 2020). Conditions improved after the initial release of founders in 2019, with annual rainfall at, or above, average for the latter 2 years of the study. Based on these favourable environmental conditions, the advantageous life history traits of bilbies and the prior success of similar reintroductions, we hypothesised that: (1) captive-born founders would adapt to the reintroduction site, establish stable home ranges and use habitats similar to that of wild-born bilbies at the exclosure; (2) founders would maintain adequate body condition and weight, enabling the survival of >50% of founders at 12-months post-release; and (3) the population would rapidly increase in the absence of feral predators, due to the high reproductive potential of bilbies. To assess these hypotheses, we implemented several monitoring methods (i.e. cage trapping, GPS and VHF tracking, track counts, spatially explicit capture–recapture density models), which can be adapted to other species or reintroduction sites. We also present detailed information on the release protocols implemented as a case study for conservation managers to consider when planning reintroductions in the future.
Materials and methods
Study site
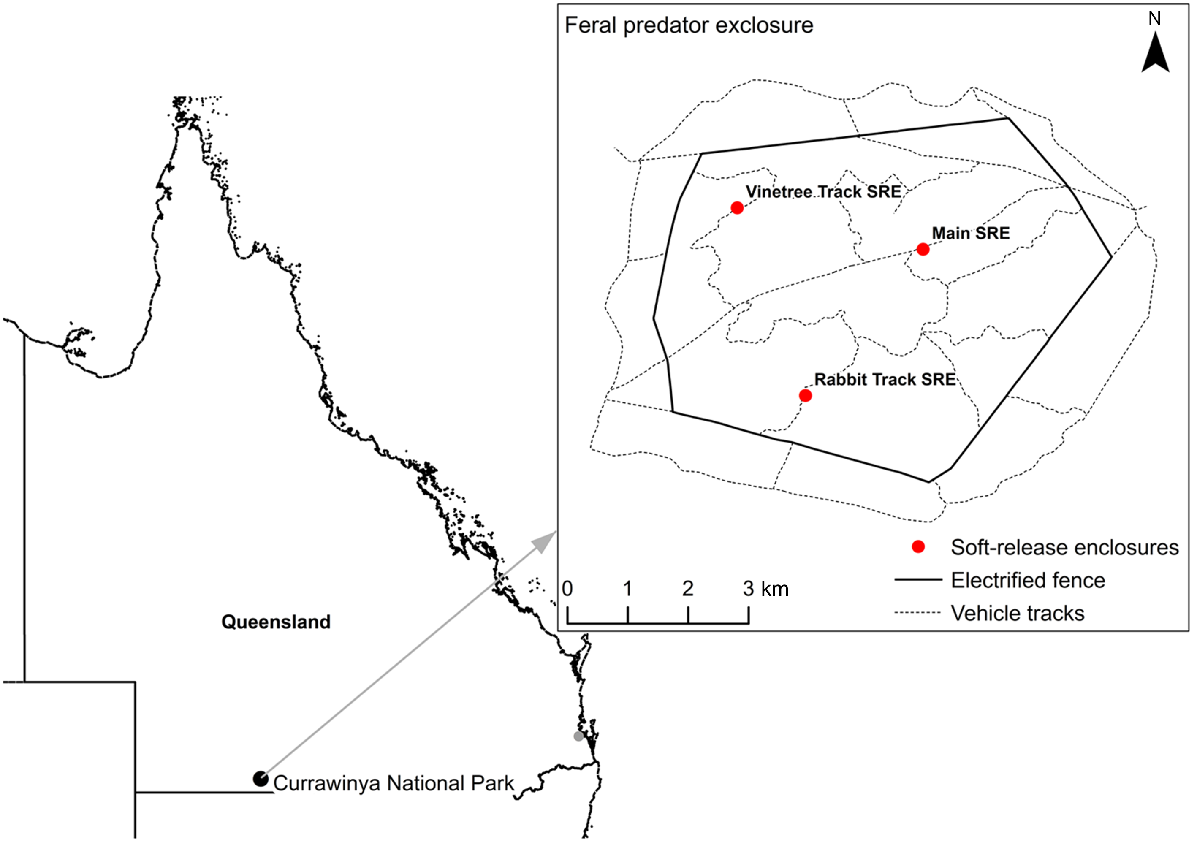
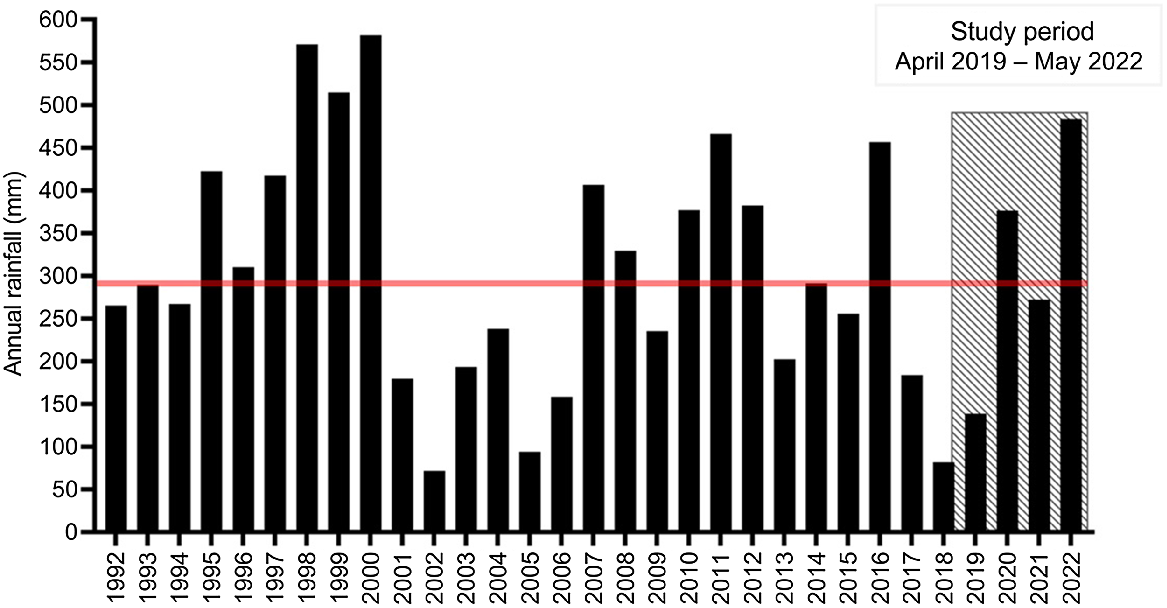
The 28-km2 fenced, feral predator exclosure is situated on Currawinya National Park (CNP) in south-west Queensland (Fig. 1). CNP has a semi-arid climate with a mean annual rainfall of 294 mm, varying significantly from year to year (Bureau of Meteorology 2022) (Fig. 2). In the 2 years prior to the reintroduction of bilbies in 2019, the region received below-average rainfall (Bureau of Meteorology 2022). Immediately after the reintroduction of bilbies, 68 mm of rain was recorded in April 2019, the highest monthly rainfall in more than 2 years. Vegetation inside the exclosure responded rapidly, with substantial growth of native groundcover (e.g. herbs, forbs and grasses). The total rainfall was below average in 2019 (139 mm), but this was followed by above-average annual rainfall in 2020 (376 mm) and average rainfall in 2021 (272 mm). By the end of the study in May 2022, the region had already received >70% of the average annual rainfall (205 mm) during that calendar year.
Location of Currawinya National Park and the feral predator exclosure where bilbies were reintroduced in 2019.
Annual rainfall over the past 30 years for the region surrounding the exclosure. Average annual rainfall is indicated by the red line, and the study period by the shaded box. Data is from the Hungerford (Paroo River) weather station (044181), 9 km south of the exclosure.
The exclosure is characterised by mixed shrublands on low sand dunes and sandy plains (Supplementary Fig. S1). Claypans occur throughout the exclosure, some fringed by black box trees (Eucalyptus largiflorens) and others that are completely bare or contain cane grass tussocks (Eragrostis australasica). Mulga (Acacia aneura) woodlands are restricted to a few sand plains and run-on flats. A variety of vertebrate species occur within the exclosure, including echidnas (Tachyglossus aculeatus), small rodents and dasyurids, European rabbits (Oryctolagus cuniculus), birds of prey and reptiles such as goannas (Varanus species) and snakes.
Release cohorts and protocols
Thirty-six bilbies (19M, 17F) were reintroduced into the exclosure at CNP between April 2019 and April 2021 (Table 1). Founders were selected from captive breeding facilities across Australia, in consultation with the Australasian Species Management Program and the Greater Bilby National Recovery Team. Prior to release at CNP, bilbies were held in outdoor pens at the Save the Bilby Fund Intensive Bilby Breeding and Creching facility in Charleville, Queensland, to acclimate to the regional climate. During this time, they were examined by an experienced wildlife veterinarian to assess their overall health and suitability for release. Morphometric data were collected and microchips implanted between the scapulae of each bilby to allow for individual identification.
| Cohort | Release date (to soft-release enclosures) | Number of bilbies released (M, F) | Soft-release enclosure(s) used for release | |
|---|---|---|---|---|
| 1 | April 2019 | 6 (2, 4) | Main soft-release enclosure | |
| 2 | July 2019 | 2 (2, 0) | Main soft-release enclosure | |
| 3 | September 2019 | 12 (4, 8) | Rabbit Track and Vinetree Track soft-release enclosures | |
| 4 | October 2020 | 6 (6, 0) | Main, Rabbit Track and Vinetree Track soft-release enclosures | |
| 5 | April 2021 | 10 (5, 5) | Main, Rabbit Track and Vinetree Track soft-release enclosures | |
| Total number of bilbies released | 36 (19, 17) | |||
‘M’, male; ‘F’, female. The location of the soft-release enclosures is shown in Fig. 1.
Bilbies were subsequently transported to CNP and released after sunset into one of three 50 × 50 m soft-release enclosures inside the feral predator exclosure, where supplementary food and water were provided (Fig. 1). Bilbies remained in the soft-release enclosures for 2–10 weeks before exit points were opened, allowing bilbies to leave of their own accord. Once all bilbies had left the soft-release enclosures, supplementary food and water were relocated to the outside perimeter of these enclosures and refilled, as necessary. Provision of supplementary food and water was ceased after bilbies from ‘cohort 5’ (released in April 2021) had exited the soft-release enclosures (Table 1).
Bilby capture and health assessment
Founder bilbies were recaptured at least once while in the soft-release enclosures, and then at approximately 1-month intervals for up to 12 months post-release. After this period, bilbies were captured opportunistically (i.e. during trapping surveys, or trapping for GPS attachment/retrieval). Bilbies were captured using cage traps, burrow traps (McGregor and Moseby 2014) and/or modified pen traps (Southgate et al. 1995; McRae 2004).
Captured bilbies were given general health assessments and detailed morphometric data were collected. Wild-born bilbies (i.e. born inside the exclosure) captured for the first time had a microchip inserted between the scapulae. Morphometric data collection included weight, assessment of body condition, and pouch activity and estimated age of pouch young for females. Body condition scores (1–5 scale) were assigned by assessing fat and muscle mass coverage of the vertebral spinal processes and ribs: 1 = emaciated/poor; 2 = thin; 3 = good; 4 = fat; 5 = obese. Examinations took approximately 15 min per individual, after which, bilbies were released at their point of capture.
Home ranges
Location data were collected using a combined tail-mounted package including a 3.8 g VHF transmitter (ATS, Isanti, Minnesota, United States of America) and 4.8 g PinPoint 120 GPS logger (Lotek Wireless, Havelock North, New Zealand). The VHF/GPS package was attached to the tail using adhesive veterinary tape as described in Cornelsen et al. (2022). We attached the packages to a total of 16 captive-born bilbies (7M, 9F) in 2019 and 15 wild-born bilbies (9M, 6F) in 2021. The combined weight of the package (8.6 g) was ≤1% of the body weight of the smallest bilby tracked during the study (875 g). GPS loggers collected fixes every hour for up to 13 h per night for 20–24 days, after which time they were retrieved and a new unit was attached if required. At the end of the study, VHF/GPS packages were removed and study animals were given a health check before being released. We did not observe any injuries resulting from the tail-mounted packages.
Although movement data were collected over relatively short time periods (i.e. between 20 and 43 nights for each bilby), it was sufficient to observe most of the normal activities associated with a home range (e.g. burrowing, foraging, seeking mates and rearing young). Prior to calculation of short-term bilby home ranges, we filtered the GPS data. The first two nights after capture/recapture were excluded, to reduce potential behavioural effects associated with trapping and handling (Dennis and Shah 2012). We also excluded any GPS fixes that were clearly erroneous (i.e. fixes located outside of the exclosure). During the first month post-release, several GPS logger antennas broke (reinforced antennas were used on subsequent deployments). This significantly reduced the number of fixes for founders during this time. Therefore, we excluded the first month of GPS data for the founders from all movement analyses. This also allowed an acclimation period for the founders released into the exclosure.
Once the data were filtered, we reviewed the incremental area plots for each bilby in Ranges 9.0 (Anatrack Ltd., UK) to determine which individuals established stable ranges suitable for further analyses. We calculated home ranges for 12 captive-born bilbies (5M, 7F) and 11 wild-born bilbies (6M, 5F) using autocorrelated kernel density estimation (AKDE) in the R package ‘ctmm’ (Fleming et al. 2022). We were unable to calculate home ranges for an additional four captive-born and four wild-born bilbies due to insufficient GPS fixes, or loss of the VHF/GPS packages during tracking. We followed the workflow outlined in Calabrese et al. (2016) for AKDE home range estimation, and included an additional step for modelling the device-specific logger error from data collected during a stationary logger test (Noonan et al. 2019; Fleming et al. 2020). The stationary logger test was conducted at a nearby known survey location (i.e. marked by a qualified surveyor), in habitat representative of the study site, with six GPS loggers scheduled to collect fixes for nine nights. The results of the stationary test were imported into ‘ctmm’ to transform the unit-less horizontal dilution of precision (HDOP) values into an error circle around each location fix. Both the location fix and the associated error circle are accounted for when modelling home ranges in ‘ctmm’ (Fleming et al. 2020). We therefore included filtered GPS data of all HDOP values in the data set for home range analyses (HDOP range: 0.9–188.0). Of the 4743 fixes in the filtered data set, the mean HDOP value was 3.10 (s.e. ±0.12), and 92% of fixes had a HDOP ≤5.0.
We compared home ranges of founders (tracked in 2019) and the wild-born bilbies (tracked in 2021) to examine differences in size and variability using unpaired t-tests, with Welch’s Correction where variances were not equal. All statistical tests were conducted in R (R Core Team 2023).
Habitat selection and use
Habitat selection was assessed at two spatial scales using compositional analyses (Aebischer et al. 1993) in the R package ‘adehabitatHS’ (Calenge and Basille 2022). Firstly, we examined the selection of bilby home ranges (95% AKDE) relative to the available habitat within the exclosure (i.e. second order habitat selection). Secondly, we examined the selection and use of habitats within an individual’s home range (i.e. third order habitat selection). For third order habitat selection, we included only GPS fixes with a HDOP ≤4.0. We excluded the first month of post-release GPS data for the founders due to antenna breakages and to allow for a post-release acclimation period. As the wild-born bilbies were born inside the exclosure, a post-release acclimation period was not necessary. Wilk’s lambda statistic was used to establish second order habitat selection, and multivariate analysis of variation (MANOVA) with log-odds ratios was used to rank third order habitat selection (Aebischer et al. 1993).
Reproduction
Female bilbies weighing more than 600 g were classified as sexually mature, following the observations of Southgate et al. (2000). Reproductive status of mature females was classified as either: inactive pouch (not carrying pouch young and not lactating); active with pouch young present; or active without pouch young (one or more teats actively lactating). The age of pouch young was estimated using developmental charts in McCracken (1983). The first 12 female founders were recaptured monthly for between 5 and 12 months to monitor closely the development of their initial litters. This enabled accurate estimation of pouch young age, expected date of final pouch emergence (i.e. transition to young-at-foot) and litter size.
We compared the proportion of active and inactive pouches of mature females captured between 2019 and 2022 to examine the reproductive output of the population. Some recaptures of females were excluded to avoid overestimation and/or underestimation of reproductive output. We used Pearson’s Chi-squared tests and post-hoc tests with a Bonferroni correction to identify any significant difference in pouch activity between years. All statistical tests were conducted in R (R Core Team 2023).
Track counts and population estimates
We monitored tracks and spoor on 12 × 1-km transects throughout the exclosure, to examine changes in bilby activity and geographical range post-release. The surface of the transects was cleared 1–2 h before sunset by dragging two horizontal car tyres behind a vehicle. Tracks were counted over three consecutive mornings by one or two experienced observers in a slow-moving all-terrain vehicle (Southgate et al. 2005). Tracks were counted as they entered the transect, but not again on exit. We averaged track counts from the 3 days to obtain the mean number of bilby tracks per km. Track transects were monitored at 1–2-month intervals during the initial releases, and then twice per year, when weather was suitable for establishing a tracking surface.
Linear regression analyses were used to determine if there was a significant relationship between mean track counts and population estimates obtained during the study. Regression analyses were undertaken in the base ‘stats’ package in R (R Core Team 2023).
Intensive radiotracking of the founder bilbies enabled accurate population estimates to be obtained between April and November 2019 through direct counts (i.e. trapping of founders and their offspring and use of motion sensor cameras at burrows). By December 2019, the first generation of bilbies born in the exclosure had reached sexual maturity and were likely to be reproductively active. From this time onward, it was not possible to directly count all individuals in the population.
Spatially explicit capture–recapture (SECR) modelling was then used to estimate population size, using data from exclosure-wide trapping events in March 2021 (four nights) and April–May 2022 (12 nights). Up to 45 traps were set each night at the edges of vehicle tracks in both years. The number of trapping nights varied across years as the time to recapture individuals increased in 2022, thus additional trapping nights were required. Additionally, in 2022, we extended the trapping array to include additional vehicle tracks, covering a larger proportion of the exclosure (due to population expansion). SECR models can accommodate various spatial designs and trap arrays (Efford and Fewster 2013), thus we were able to compare population estimates between 2021 and 2022.
Density and population estimates were obtained using the R package ‘secr’ (Efford 2022a). Detection function selection was based on the null model with the lowest AICC (Burnham and Anderson 2002; Brewer et al. 2016). Several models with different covariates were run using either the Newton–Raphson or the Nelder–Mead maximisation methods and compared using AICC (Efford 2022b). Model selection was based on the lowest AICC, with model averaging performed where Δ AICC ≤2 because they were considered a reasonable fit for the data.
Ethical note
This research was conducted with approved permits from Queensland Government Department of Agriculture and Fisheries Animal Ethics Committee (SA 2018/10/658), the Queensland Government Department of Environment and Science (PTU19-001769) and the University of Queensland Animal Ethics Committee (2022/AE000180). The reintroduction project was conducted in accordance with a release strategy approved by the Queensland Government Department of Environment and Science. The Intensive Bilby Breeding and Creching facility in Charleville is managed in accordance with the Captive Breeding Agreement between Save the Bilby Fund and the Queensland Government Department of Environment and Science.
Results
Home ranges
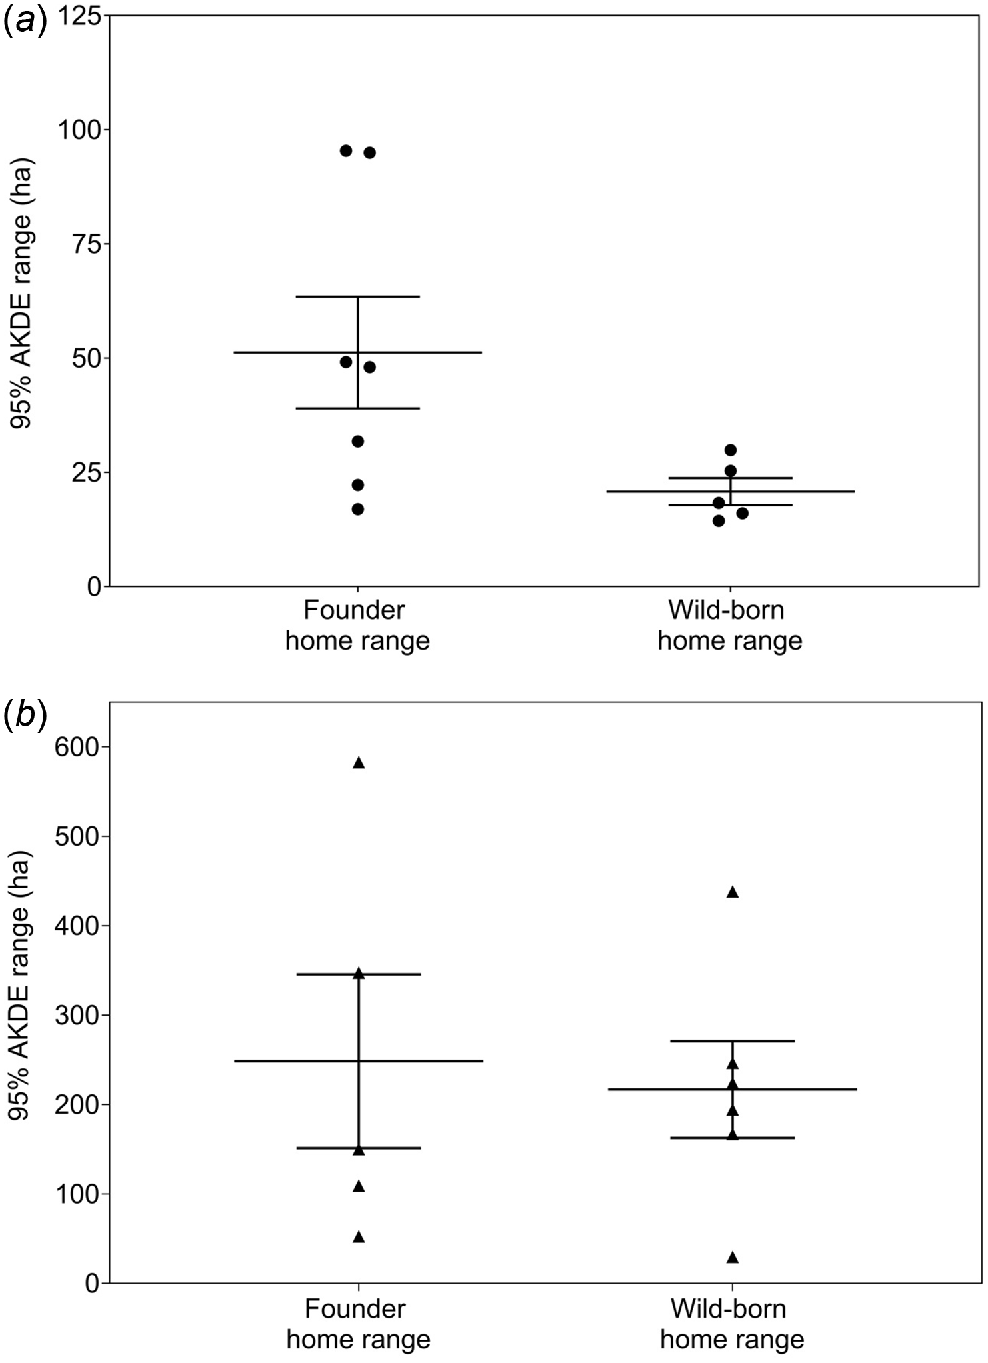
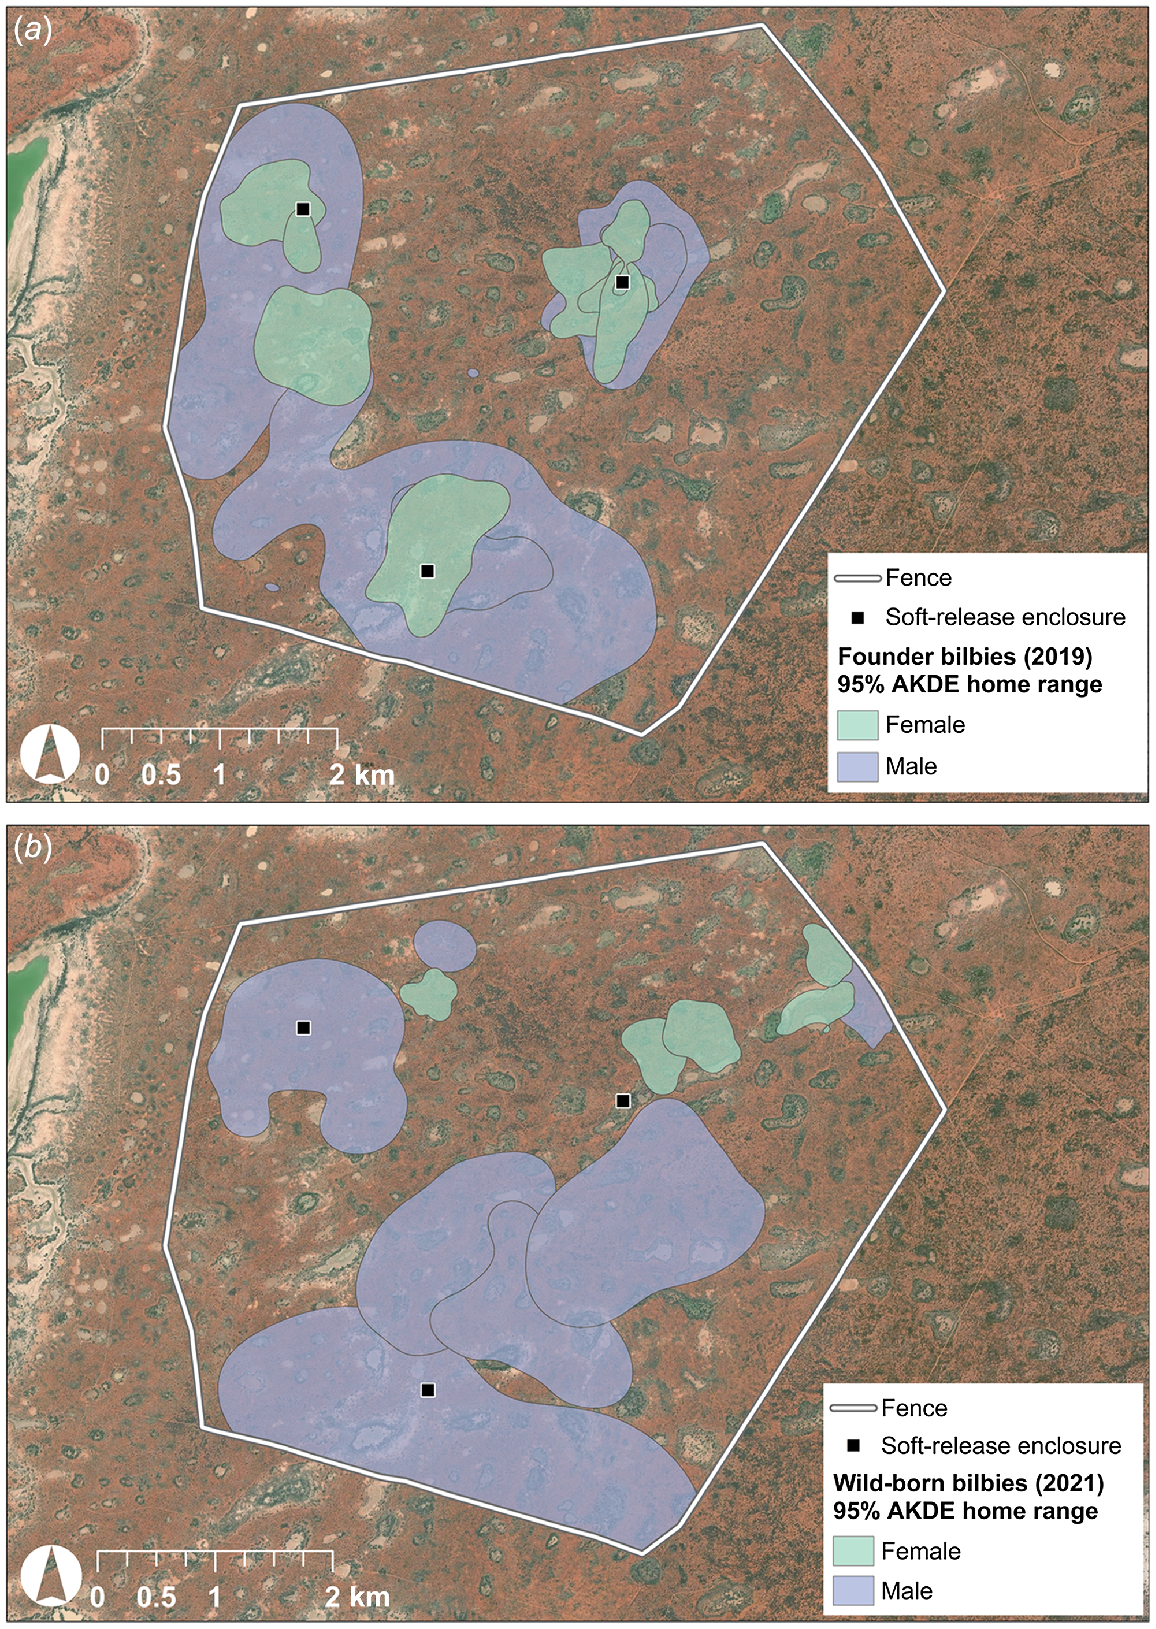
Home ranges (AKDE) were calculated for 12 founders (5M, 7F) and 11 wild-born bilbies (6M, 5F) (Tables 2, S1 and S2). Male home ranges for founders and wild-born bilbies were highly variable, with the majority (>80%) ranging between 100 and 600 ha. Five of the female founders (71%) had home ranges larger than 30 ha, whereas all five wild-born females had home ranges <30 ha (Figs 3 and 4). Mean home range size for female founders (51.23 ha, s.e. ±12.22) was significantly larger than the mean for wild-born females (20.80 ha, s.e. ±2.94) (t = 2.42, P = 0.04). For male founders, mean home range size (248.46 ha, s.e. ±97.22) was marginally larger than that of wild-born males (216.74 ha, s.e. ±54.19), though the difference was not significant (t = 0.30, P = 0.77). When excluding the male founder that was returned to captivity due to ongoing loss of condition, the mean male founder home range size increased to 297.43 ha (s.e. ±108.42). However, there was no significant difference when compared with the mean home range size for wild-born males (t = 0.74, P = 0.48). There was significantly more variation in the home range sizes of female founder bilbies compared with wild-born females, though not for males (female: F6,4 = 24.11, P < 0.01; male: F4,5 = 2.68, P = 0.31).
| Sex | Group | n | Mean number of tracking nights (±s.e.) | Mean 95% AKDE range in hectares (±s.e.) | |
|---|---|---|---|---|---|
| Female | Founder home range | 7 | 28.00 (±2.80) | 51.23 (±12.22) | |
| Wild-born home range | 5 | 25.60 (±1.83) | 20.80 (±2.94) | ||
| Male | Founder home range | 5 | 26.60 (±1.47) | 248.46 (±97.22) | |
| Founder home range excluding male returned to captivity A | 4 | 26.75 (±1.89) | 297.43 (±108.42) | ||
| Wild-born home range | 6 | 23.67 (±0.80) | 216.74 (±54.19) |
Habitat selection and use
Bilbies showed preferential selection of habitat types when establishing their home ranges in both the founder group (λ = 0.16, d.f. = 3; P < 0.0001) and the wild-born group (λ = 0.34, d.f. = 3; P < 0.01). Both groups showed a significant (P < 0.05) preference for establishing home ranges that included shrublands and claypans with fringing trees (E. largiflorens) (Tables S3 and S4, Fig. S2). The order of preference of these habitat types is interchangeable – there was no detectable difference in their ranking.
Founders did not preferentially utilise habitat types within their home ranges (λ = 0.66; d.f. = 3; P = 0.18), whereas wild-born bilbies preferentially utilised shrubland habitats within their home ranges (λ = 0.37; d.f. = 3; P = 0.01). Although habitat use of the founders was not significantly different from random, there is evidence that the founders used claypans proportionally less than mulga shrublands and shrubland habitats (P < 0.05).
Survival of founder bilbies
Survival rates for founders were determined from the first three intensively tracked release cohorts and were based on the proportion of bilbies from each cohort that were known to be alive (KTBA) (Table 3). This method excludes individuals that were not able to be recaptured/recorded, though not necessarily confirmed to have died (Krebs 1966). Therefore, these survival rates should be viewed as minima for founder bilbies.
| Release cohort | Release date into soft-release enclosure(s) | Number released (M, F) | Number (%) of individuals KTBA between 1 and 6 months post-release | Fate of individuals at 12 months post-release (%) | ||||||
|---|---|---|---|---|---|---|---|---|---|---|
| 1 month | 3 months | 6 months | KTBA | Confirmed or presumed dead | Returned to captivity | Fate unknown | ||||
| 1 | April 2019 | 6 (2M, 4F) | 6 (100) | 4 (67) | 4 (67) | 4 (67) | 2 (33) | 0 (0) | 0 (0) | |
| 2 | July 2019 | 2 (2M, 0F) | 2 (100) | 2 (100) | 2 (100) | 1 (50) | 0 (0) | 1 (50) | 0 (0) | |
| 3 | September 2019 | 12 (4M, 8F) | 12 (100) | 12 (100) | 10 (83) | 9 (75) | 1 (8) | 0 (0) | 2 (17) | |
| Cohorts combined | 20 (8M, 12F) | 20 (100) | 18 (90) | 16 (80) | 14 (70) | 3 (15) | 1 (5) | 2 (10) | ||
‘KTBA’, known to be alive; ‘M’, male; ‘F’, female.
All 20 bilbies released in 2019 were known to be alive at 1-month post-release. At 3 months post-release, the known survival rate decreased to 90%, with two males found deceased from unknown causes (carcasses found intact in burrows). At 6 months post-release, known survival was at 80%, with one female presumed deceased (partial remains found near a burrow) and one female not able to be recaptured. At 12 months post-release, 14 (7M, 7F) of the 20 bilbies (70%) were known to be alive, with one male returned to captivity due to poor condition and one male not recaptured/recorded after 10 months.
Weight and body condition
Six male founders were recaptured regularly in the first 6 months post-release. Weights of these males fluctuated in the first 3 months, before stabilising (Fig. S3). In comparison with their pre-release weights, these males lost an average of 7.78% (± 3.02%) of their total bodyweight in the first 3 months post-release. At 5 months post-release, males had lost an average of 4.84% (± 2.21%) compared with pre-release weights (i.e. average male weight increased between 3 and 5 months post-release). One male lost weight continually for 4–5 months post-release and was subsequently returned to captivity for veterinary assessment (‘Macro’, Fig. S3).
Weights of female founders fluctuated after their release, due largely to the development and emergence of pouch young. Of 11 female founders that were regularly recaptured in the first 12 months post-release, only one lost >10% bodyweight in a single month that was not associated with the emergence/weaning of pouch young.
Body condition of bilbies captured between 2019 and 2022 marginally decreased over time compared with the founders’ pre-release condition (Fig. S4). There was a reduction in the number of individuals with body condition scores of 4–5 (fat/obese) from pre-release (14%) to post-release (0–3%). There was also an increase in the proportion of scores between 2 and 3 (thin to good) from pre-release (8%) to post-release (18–29%). Comparing pre-release and post-release condition scores, there were no significant differences in the proportion of bilbies with scores of 3–5 (good to obese condition) or <3 (thin to emaciated) during the study period (X2 = 8.60, P = 0.07).
Reproduction
Pouch young were observed in all seasons at CNP. However, because most females (founders and wild-born) were captured on 1–3 occasions over the study period, it was not possible to examine total annual reproductive output for females.
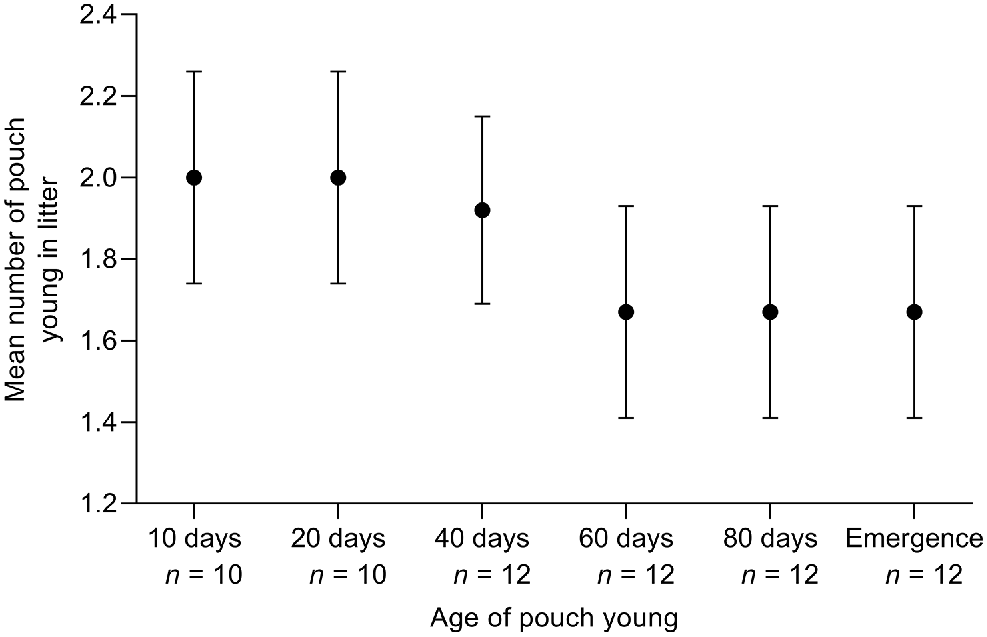
All 12 female founders were observed with pouch young post-release, with 11 conceiving in the first 2 weeks while in the soft-release enclosures. The mean time from release to conception was 15.75 days (s.e. ±3.73 days) and ranged from 3 to 40 days. The mean number of pouch young in the initial 12 litters was 2.00 (s.e. ±0.21, range 1–3) in the early stages of pouch development (up to 20 days old) (Fig. 5). Reductions in litter size during pouch young development were observed in two litters (17%), between 40 and 60 days post-parturition. The mean number of young per litter decreased to 1.92 young (s.e. ±0.23) at 40 days of development, and 1.67 young (s.e. ±0.26) from 60 days through to emergence from the pouch (Fig. 5). We captured independent young from six of these 12 litters to determine the sex ratio. Six males and four females were captured, producing a sex ratio of 1.5, which was not significantly different to parity (X2 = 3.75, P = 0.59). Of these 12 females, nine were subsequently recaptured with a second litter in the first 12 months post-release.
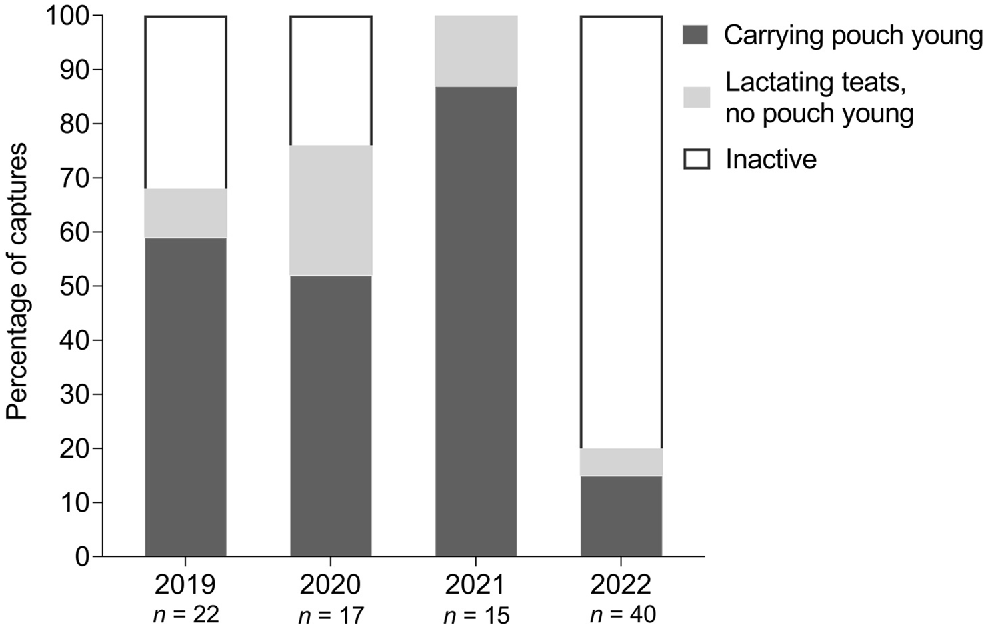
The proportion of mature females with active pouches (i.e. those carrying pouch young, or with lactating teats but no pouch young) differed significantly across years (X2 = 36.67, P < 0.0001) (Fig. 6). In 2019, the proportion of active pouches was 68%, which increased to 76% in 2020. In 2021, all sexually mature females examined had active pouches, a significant increase from previous years (P < 0.01). This was followed by a significant decrease in 2022 (P < 0.01), where only eight of 40 (20%) sexually mature females captured had active pouches.
Track counts
Track count data were collected for up to 33 months post-release (Fig. 7). There was a significant increase in mean bilby tracks on transects from 8.83 km−1 at 16 months to 50.61 km−1 at 21 months (t = −4.91, d.f. = 11, P < 0.001). During the track count session in January 2022 (33 months post-release), the average track count on transects was >84 tracks km−1.
(a) Mean bilby tracks per kilometre (±s.e.) on the left y-axis, observed on track transects up to 33 months post-release. The right y-axis shows the percentage of transects (n = 12) where bilby tracks were observed during each track count session. (b) Spatially explicit capture–recapture (SECR) population estimates (±s.e.) for 2021 and 2022 (24 and 36 months post-release, respectively) on the right y-axis and mean bilby tracks per kilometre (±s.e.) on the left y-axis.
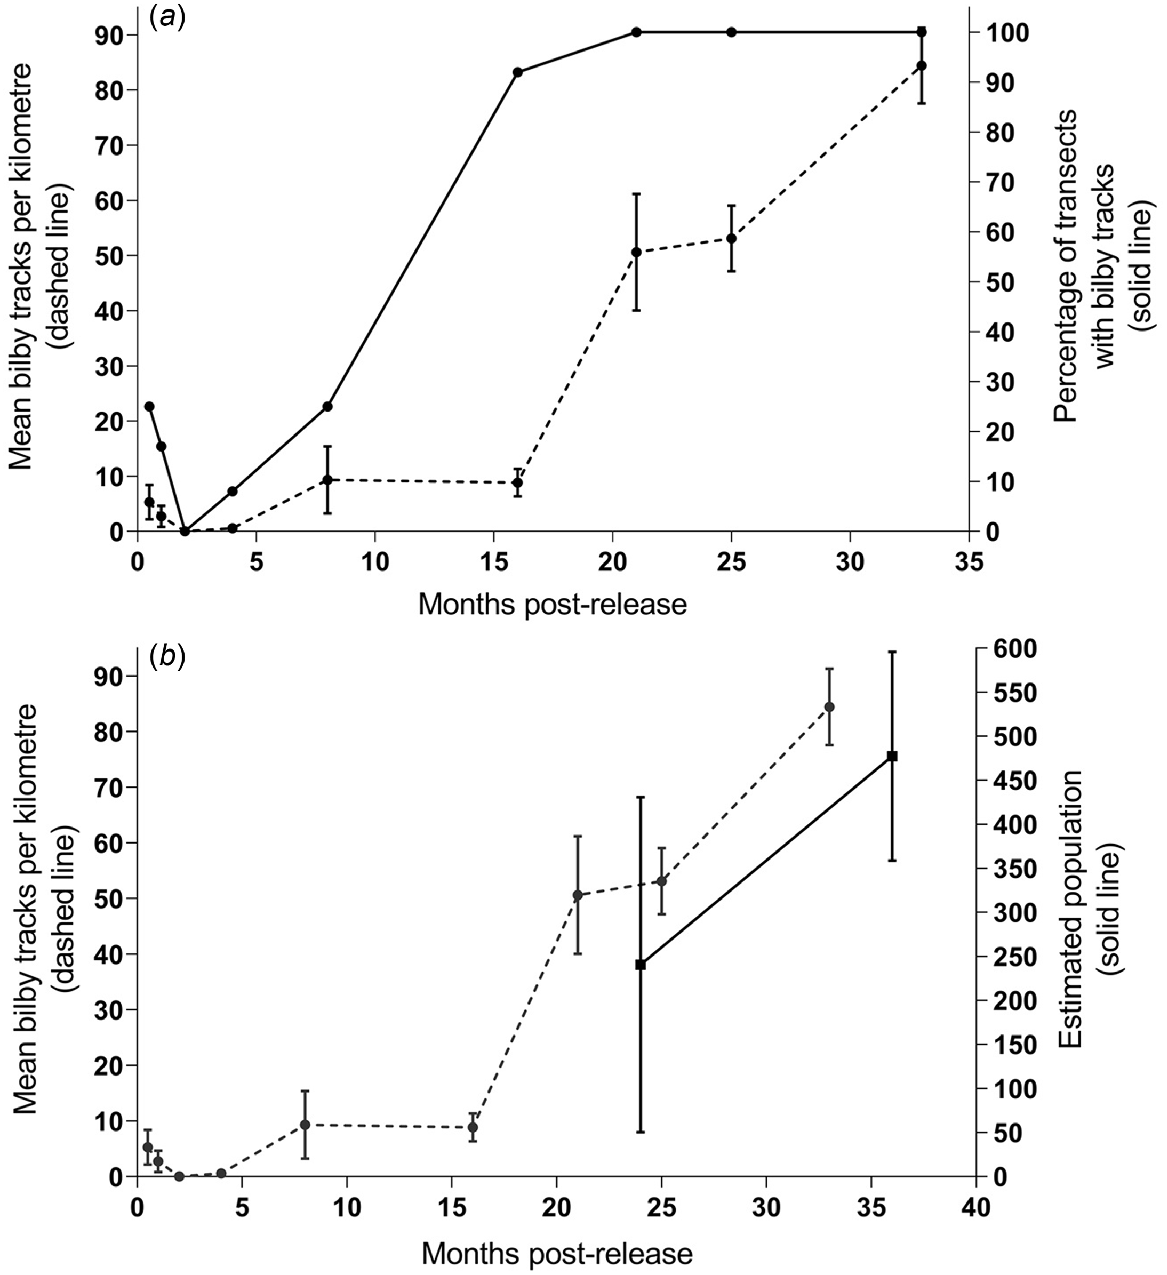
Bilby tracks were recorded on up to 25% of the track transects in the first 8 months post-release, which increased to 92% at 16 months post-release (Fig. 7). From 21 months post-release, tracks were consistently recorded on all 12 transects.
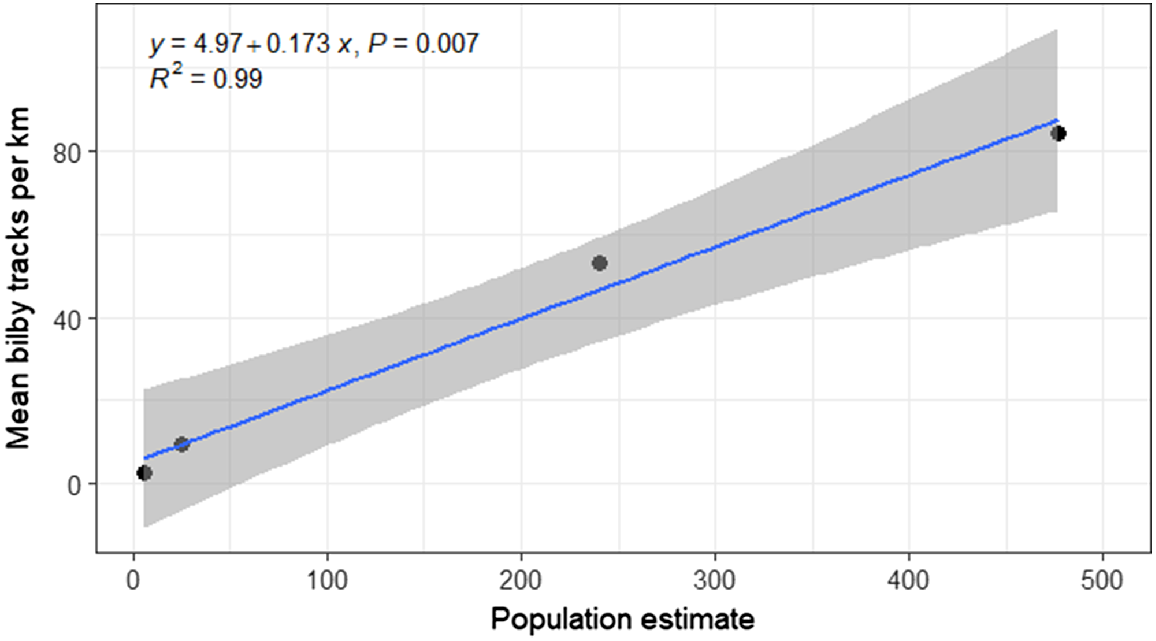
Regression analysis showed a significant linear relationship between mean track counts and the estimated population size (R2 = 0.99, F = 137.9, d.f. = 2, P = 0.007) (Fig. 8). Based on this relationship, the equation for calculating estimated population size (x) for a known mean number of tracks km−1 (y) is:
Linear regression plot showing the relationship between mean bilby track counts per km and the estimated population size, with 95% confidence intervals (grey shading). The four population estimates include two from tracking data (i.e. KTBA method) in May 2019 and December 2019, and two estimates derived from spatially explicit capture–recapture models (SECR) using trap data from April 2021 and April–May 2022. In 2019 and 2021, track counts were collected immediately after the population estimate, whereas in 2022 track counts were collected approximately 2 months prior to the population estimate.
Population estimates
After the initial release of bilbies in April 2019, two male founders died, and seven young were recruited to the population. The direct population estimate in November 2019 (7 months post-release) was 25 individuals, comprising 18 released founders and seven wild-born recruits. After November 2019, the first generation of wild-born bilbies were observed with pouch young, and direct counts of the population were no longer possible.
In 2021 and 2022, population size was estimated using SECR with capture data from trapping surveys. In 2021, there were 49 captures of 28 individuals over a four-night trapping survey. In 2022, after the first four nights of trapping, we had not recaptured a sufficient number of bilbies required for SECR modelling, so we extended the trapping period to 12 nights, with 132 captures of 106 individuals in 2022 (Table 4).
| Year | Number of individuals captured (total captures) | Number of nights of trapping | Capture rate (individuals/100 trap nights) | SECR density estimates | Population estimate (±s.e.) | ||
|---|---|---|---|---|---|---|---|
| (bilbies per ha) (±s.e.) | (bilbies km-2) (±s.e.) | ||||||
| 2021 | 28 (49) | 4 | 20.74 | 0.0861 (±0.0682) | 8.61 (±6.82) | 240 (±190) | |
| 2022 | 106 (132) | 12 | 31.09 | 0.1709 (±0.0424) | 17.09 (±4.24) | 477 (±119) | |
Based on SECR analyses, there was a ~2-fold increase in the population size between 2021 and 2022. This is consistent with both the increase in capture rates and the increase in mean track counts per kilometre we observed for the same period (Fig. 7). In April 2021 (24 months post-release), the estimated population density was 0.0861 bilbies per ha (s.e. ±0.0682), and the estimated population size was 240 bilbies (s.e. ±190). In April–May 2022 (36 months post-release), the density estimate increased to 0.1709 bilbies per ha (s.e. ±0.0424), with an estimated population size of 477 bilbies (s.e. ±119) (Table 4).
Discussion
This study highlights the capacity of captive-born bilbies to successfully transition to life in a semi-wild environment and breed rapidly. Of the 20 founders released in 2019, 90% survived after 3 months and 70% after the first year. All 12 female founders produced a litter within 2 months of release. Favourable rainfall and environmental conditions during the study undoubtedly aided growth of the population, which was estimated at 477 individuals after 3 years. Based on these results, the bilby reintroduction at CNP has been highly successful to date.
Home ranges
GPS data provided strong support for our hypothesis that founders would adapt to the reintroduction environment and establish stable, short-term home ranges similar to that of wild-born bilbies at CNP. All GPS-tracked founders (5M, 7F) established stable home ranges post-release (i.e. incremental area plots reached asymptote), though some individuals undertook large-scale exploratory movements in the first month, including a male who travelled 14 km in one night. Founders frequently included the soft-release enclosures in their home ranges, and several accessed supplementary food provided at the enclosures. Both male and female founders revisited these enclosures, with an average of 13% (s.e. ±2%) of GPS fixes within 50 m of the enclosures. This indicates that although revisitation to the soft-release enclosures was not uncommon, founders were not reliant upon supplementary food as their only source of food.
We found no significant difference between the mean home range sizes of male founders and wild-born bilbies (founders 248.46 ha ± 97.22; wild-born 216.74 ha ± 54.19) (P = 0.77). However, the mean home range size for female founders was significantly larger (~2.5 times larger) than that of wild-born females (founders 51.23 ha ± 12.22; wild-born 20.80 ha ± 2.94) (P = 0.04). The increase in bilby density 2 years post-release is likely to have resulted in the contraction of wild-born female home ranges. Female bilbies generally establish home ranges that do not overlap with other females (Moseby and O’Donnell 2003), but we observed overlap in female founder home ranges around the soft-release enclosures where supplementary food was provided. This indicates that female–female overlap may be tolerated where high-quality, abundant food sources are available. During the tracking period for wild-born females, supplementary food was no longer being provided and we observed limited wild-born female–female home range overlap (i.e. typically only overlap at home range edges). This suggests that wild-born females were avoiding neighbouring females to reduce potential intraspecific resource competition. Similar responses have been observed in populations of striped mice (Rhabdomys pumilio), where females compressed their home ranges in the presence of multiple female neighbours, to reduce competition for food/nesting resources and to lower the risk of infanticide (Schradin 2005; Schradin et al. 2010; Schoepf and Schradin 2012).
Habitat selection and use
Founders successfully adapted to habitats within the exclosure and had similar habitat preferences to wild-born bilbies. Both founders and wild-born bilbies established home ranges in areas containing both shrublands and claypans with fringing trees (E. largiflorens). Within their home ranges, founders and wild-born bilbies preferentially utilised shrubland habitats. We observed founders utilising claypans with fringing trees to a greater extent than wild-born bilbies, though this could have been due to the location of the soft-release enclosures, with two of the three enclosures situated in this habitat and supplementary food available to founders at these enclosures during the study period.
Survival and condition of founders
As hypothesised, the survival rate of founders exceeded 50% in the first year after release. Of the 20 founders released in 2019, 70% were known to be alive at 12-months post-release. Similar rates of survival were reported for a reintroduction to a feral predator exclosure in arid South Australia (Arid Recovery), where 78% of founder bilbies were known to be alive after 1 year, and a further 11% were presumed alive based on track evidence (Moseby and O’Donnell 2003). During this study we observed weight loss in male founders during the initial 3 months post-release, after which time their weights stabilised. This was likely due to a transition to a more natural, wild diet, and to increased levels of activity and movement compared with a captive environment. The situation was less clear with female founders, because their weight fluctuations were confounded by the rearing of young.
The survival rate of founders in this study is relatively high compared with rates of survival reported for reintroduced bilbies to sites where feral predators persist. Bilbies released at Watarrka National Park in the Northern Territory had a survival rate of approximately 26% at 12-months post-release, with predation by feral predators identified as the primary cause of mortalities (Southgate and Possingham 1995). Annual survival rates of bilbies at two reintroduction sites in temperate South Australia (Thistle Island and Venus Bay Conservation Park) were reported at between 16 and 48%, with feral cats implicated in the presumed high mortality rate of subadults at one site (Berris et al. 2020a). However, there is evidence that bilbies can survive and increase their population size where feral cats are at low densities (i.e. <0.5 cats per km2) and in the absence of other mammalian predators such as foxes (Moseby et al. 2019). This is further evidenced by the significant increase in the area of occupancy (~88%) by bilbies reintroduced to an unfenced site in Western Australia, where the feral cat population was supressed to densities consistent with that described by Moseby et al. (2019) (Lohr et al. 2021). Therefore, in the absence of feral predators, high rates of survival should be expected in the establishment phase of bilby reintroductions, enabling rapid population growth, as was confirmed during this study.
Population growth and reproduction
We hypothesised that the population at CNP would rapidly increase due to the high reproductive potential of bilbies and high survivorship in the absence of feral predators. Post-release monitoring confirmed this hypothesis, with the estimated population reaching 477 bilbies just 3 years after founders were released in 2019 (n = 20). Between 2021 and 2022, the results of SECR analyses showed an approximate doubling of the population size from 240 to 477 bilbies inside the exclosure. This population increase was consistent with the increase in mean track counts per kilometre that we observed for the same period, and we found a significant relationship between mean track counts and estimated population size (R2 = 0.99, P = 0.007). We attribute this rapid population increase to the high reproductive output and survivorship of bilbies and to the favourable environmental conditions from 2020 to 2022 (i.e. annual rainfall at, or above, average). The apparent abundance of food resources inside the exclosure undoubtedly supported the early and continued reproductive success of females, as well as the high survival of pouch young to emergence.
We recorded high levels of reproduction in the early stages of the reintroduction, and importantly, 92% of the female founders conceived in the first 2 weeks post-release. However, in 2022 there was a significant decrease in the proportion of captured adult females with active pouches (20% active, n = 40) compared with 2021 (100% active, n = 15). The main observed change during this period was the increase in population density, which doubled from 8.61 bilbies per km2 in 2021 to 17.09 bilbies per km2 in 2022. It is possible that in 2022, the population at CNP was nearing its maximum size/density, and that we observed a suppressive effect on reproduction at the higher population density estimate. Density-dependent reproduction has been recorded in another arid-dwelling mammal, the spinifex hopping mouse (Notomys alexis) (Breed and Leigh 2011; Breed et al. 2017; Berris et al. 2020b). At high population densities, adult female hopping mice were reproductively suppressed, despite having higher mean body mass than mice from lower density sites, which were reproductively active (Berris et al. 2020b). Further, Berris et al. (2020a) also observed reductions in reproductive output in a reintroduced population of bilbies on Thistle Island, where the population was assumed to be close to its maximum size.
The potential for high densities to supress reproduction in bilbies could have important implications for future management of fenced bilby populations and warrants further research (e.g. Berris et al. 2020b). We suggest that the population at CNP is now in a ‘regulation phase’, where recruitment and/or survival rates decrease due to increased population density (IUCN/SSC 2013). This signals the transition to population regulation just 3 years post-release, with other reintroduced marsupials entering the regulation phase after 4–6 years, in exclosures/islands less than half the area of the exclosure at CNP (Griffiths et al. 2017; Short 2022; Wilson et al. 2023).
Conclusions
This study demonstrates that bilbies are capable of rapid population growth during the establishment phase of a reintroduction project where conditions are suitable (e.g. absence of feral predators, suitable and unoccupied habitat, adequate food resources). We suggest bilbies are a model species for reintroductions to feral predator exclosures due to the high survival rate of founders, high reproductive output, ability to adapt to a diverse range of habitats and establish stable home ranges, and their dietary flexibility. Our study also demonstrates the importance of collecting detailed post-release monitoring data to assess the growth and establishment of a reintroduced population.
Data availability
The data that support this study will be shared upon reasonable request to the corresponding author.
Declaration of funding
Funding for this project was received from Save the Bilby Fund and APA Group, and the lead author was supported by a University of Queensland Research Training Program (RTP) scholarship. K.J. Bradley of Save the Bilby Fund was involved in field data collection and revision of the manuscript (prepared by C.M. Arkinstall and S.I. FitzGibbon). APA Group was not involved in data collection, manuscript preparation or the decision to submit for publication.
Acknowledgements
Many thanks to Save the Bilby Fund, APA Group and Queensland Parks and Wildlife Rangers at Currawinya National Park for their support. Thanks to the volunteers and interns who assisted with data collection in the field, particularly David Sargent, Saskia Gerhardy, Andrew Gray, Gabi Levay, Hali Stemmler, Neil Bloem, Amber Gillett, Ben Barth, Leah Barth, Michelle Neil, Richie Jackson, Mary Lester and Jared Burnett.
References
Aebischer NJ, Robertson PA, Kenward RE (1993) Compositional analysis of habitat use from animal radio-tracking data. Ecology 74, 1313-1325.
| Crossref | Google Scholar |
Armstrong DP, Seddon PJ (2008) Directions in reintroduction biology. Trends in Ecology & Evolution 23, 20-25.
| Crossref | Google Scholar | PubMed |
Armstrong DP, Moro D, Hayward MW, Seddon PJ (2015) Introduction: the development of reintroduction biology in New Zealand and Australia. In ‘Advances in reintroduction biology of Australian and New Zealand fauna’. (Eds DP Armstrong, MW Hayward, D Moro, PJ Seddon) pp. 1–6. (CSIRO Publishing: Victoria)
Berger-Tal O, Saltz D (2014) Using the movement patterns of reintroduced animals to improve reintroduction success. Current Zoology 60, 515-526.
| Crossref | Google Scholar |
Berger-Tal O, Blumstein DT, Swaisgood RR (2020) Conservation translocations: a review of common difficulties and promising directions. Animal Conservation 23, 121-131.
| Crossref | Google Scholar |
Berris KK, Cooper SJB, Breed WG, Berris JR, Carthew SM (2020a) A comparative study of survival, recruitment and population growth in two translocated populations of the threatened greater bilby (Macrotis lagotis). Wildlife Research 47, 415-425.
| Crossref | Google Scholar |
Berris KK, Breed WG, Moseby KE, Carthew SM, Bennett N (2020b) Female reproductive suppression in an Australian arid zone rodent, the spinifex hopping mouse. Journal of Zoology 312, 163-173.
| Crossref | Google Scholar |
Bice J, Moseby K (2008) Diets of the re-introduced greater bilby (Macrotis lagotis) and burrowing bettong (Bettongia lesueur) in the Arid Recovery Reserve, Northern South Australia. Australian Mammalogy 30, 1-12.
| Crossref | Google Scholar |
Breed WG, Leigh CM (2011) Reproductive biology of an old endemic murid rodent of Australia, the Spinifex hopping mouse, Notomys alexis: adaptations for life in the arid zone. Integrative Zoology 6, 321-333.
| Crossref | Google Scholar | PubMed |
Breed WG, Leigh CM, Breed MF (2017) Changes in abundance and reproductive activity of small arid-zone murid rodents on an active cattle station in central Australia. Wildlife Research 44, 22-27.
| Crossref | Google Scholar |
Brewer MJ, Butler A, Cooksley SL (2016) The relative performance of AIC, AICC and BIC in the presence of unobserved heterogeneity. Methods in Ecology and Evolution 7, 679-692.
| Crossref | Google Scholar |
Bureau of Meteorology (2022) Monthly rainfall (millimetres) Hungerford (Paroo River): station number 044181. Bureau of Meteorology. Available at http://www.bom.gov.au/climate/data/index.shtml
Calabrese JM, Fleming CH, Gurarie E, Freckleton R (2016) ctmm: an r package for analyzing animal relocation data as a continuous-time stochastic process. Methods in Ecology and Evolution 7, 1124-1132.
| Crossref | Google Scholar |
Calenge C, Basille M (2022) adehabitatHS: analysis of habitat selection by animals, Version 0.3.16. Available at https://cran.r-project.org/package=adehabitatHS
Cornelsen KA, Arkinstall CM, van Weenen J, Ross AK, Lawes JC, Moseby KE, Elphinstone A, Jordan NR (2022) Telemetry tails: a practical method for attaching animal-borne devices to small vertebrates in the field. Wildlife Research 49, 399-414.
| Crossref | Google Scholar |
Dennis TE, Shah SF (2012) Assessing acute effects of trapping, handling, and tagging on the behavior of wildlife using GPS telemetry: a case study of the common brushtail possum. Journal of Applied Animal Welfare Science 15, 189-207.
| Crossref | Google Scholar | PubMed |
Efford M (2022a) secr: spatially explicit capture-recapture models, Version 4.5.8. Available at https://cran.r-project.org/web/packages/secr/index.html
Efford MG (2022b) What could possibly go wrong? Troubleshooting spatially explicit capture–recapture models in secr 4.5. Available at https://www.otago.ac.nz/density/pdfs/secr-troubleshooting.pdf
Efford MG, Fewster RM (2013) Estimating population size by spatially explicit capture–recapture. Oikos 122, 918-928.
| Crossref | Google Scholar |
Fischer J, Lindenmayer DB (2000) An assessment of the published results of animal relocations. Biological Conservation 96, 1-11.
| Crossref | Google Scholar |
Fleming CH, Drescher-Lehman J, Noonan MJ, Akre TSB, Brown DJ, Cochrane MM, Dejid N, DeNicola V, DePerno CS, Dunlop JN, Gould NP, Harrison A-L, Hollins J, Ishii H, Kaneko Y, Kays R, Killen SS, Koeck B, Lambertucci SA, LaPoint SD, Medici EP, Meyburg B-U, Miller TA, Moen RA, Mueller T, Pfeiffer T, Pike KN, Roulin A, Safi K, Séchaud R, Scharf AK, Shephard JM, Stabach JA, Stein K, Tonra CM, Yamazaki K, Fagan WF, Calabrese JM (2020) A comprehensive framework for handling location error in animal tracking data. bioRxiv, 2020.06.12.130195.
| Crossref | Google Scholar |
Fleming CH, Calabrese JM, Dong X, Winner K, Reineking B, Péron G, Noonan MJ, Kranstauber B, Wilhite CJ, Gurarie E, Safi K, Cross PC, Mueller T, Paula RCd, Akre T, Drescher-Lehman J, Harrison A-L, Morato RG (2022) ctmm: continuous-time movement modeling, Version 1.1.0. Available at https://cran.r-project.org/package=ctmm
Gibson LA (2001) Seasonal changes in the diet, food availability and food preference of the greater bilby (Macrotis lagotis) in south-western Queensland. Wildlife Research 28, 121-134.
| Crossref | Google Scholar |
Gibson LA, Hume ID (2004) Aspects of the ecophysiology and the dietary strategy of the greater bilby Macrotis lagotis: a review. Australian Mammalogy 26, 179-183.
| Crossref | Google Scholar |
Griffiths AD, Rankmore B, Brennan K, Woinarski JCZ (2017) Demographic evaluation of translocating the threatened northern quoll to two Australian islands. Wildlife Research 44, 238-247.
| Crossref | Google Scholar |
Hayward MW, Poh ASL, Cathcart J, Churcher C, Bentley J, Herman K, Kemp L, Riessen N, Scully P, Diong CH, Legge S, Carter A, Gibb H, Friend JA (2015) Numbat nirvana: conservation ecology of the endangered numbat (Myrmecobius fasciatus) (Marsupialia: Myrmecobiidae) reintroduced to Scotia and Yookamurra Sanctuaries, Australia. Australian Journal of Zoology 63, 258-269.
| Crossref | Google Scholar |
Kanowski J, Roshier D, Smith M, Fleming A (2018) Effective conservation of critical weight range mammals: reintroduction projects of the Australian Wildlife Conservancy. In ‘Recovering Australian threatened species: a book of hope’. (Eds S Garnett, P Latch, D Lindenmayer, JCZ Woinarski) pp. 269–279. (CSIRO Publishing: Clayton, Vic.)
Kleiman DG (1989) Reintroduction of captive mammals for conservation. BioScience 39, 152-161.
| Crossref | Google Scholar |
Krebs CJ (1966) Demographic changes in fluctuating populations of Microtus californicus. Ecological Monographs 36, 239-273.
| Crossref | Google Scholar |
Legge S, Woinarski JCZ, Burbidge AA, Palmer R, Ringma J, Radford JQ, Mitchell N, Bode M, Wintle B, Baseler M, Bentley J, Copley P, Dexter N, Dickman CR, Gillespie GR, Hill B, Johnson CN, Latch P, Letnic M, Manning A, McCreless EE, Menkhorst P, Morris K, Moseby K, Page M, Pannell D, Tuft K (2018) Havens for threatened Australian mammals: the contributions of fenced areas and offshore islands to the protection of mammal species susceptible to introduced predators. Wildlife Research 45, 627-644.
| Crossref | Google Scholar |
Le Gouar P, Mihoub J-B, Sarrazin F (2012) Dispersal and habitat selection: behavioural and spatial constraints for animal translocations. In ‘Reintroduction biology: integrating science and management’. (Eds JG Ewen, DP Armstrong, KA Parker, PJ Seddon) pp. 138–164. (Wiley-Blackwell: Hoboken, New Jersey)
Lohr CA, Dziminski M, Dunlop J, Miller E, Morris K (2021) Reintroduction of Bilbies (Macrotis lagotis) to Matuwa, an indigenous protected area in Western Australia. Rangeland Ecology & Management 78, 67-78.
| Crossref | Google Scholar |
McCracken HE (1986) Observations on the oestrous cycle and gestation period of the Greater Bilby, Macrotis lagotis (Reid) (Marsupialia: Thylacomyidae). Australian Mammalogy 9, 5-16.
| Crossref | Google Scholar |
McGregor HM, Moseby KE (2014) Improved technique for capturing the greater bilby (Macrotis lagotis) using burrow cage traps. Australian Mammalogy 36, 259-260.
| Crossref | Google Scholar |
Mihoub J-B, Robert A, Le Gouar P, Sarrazin F (2011) Post-release dispersal in animal translocations: social attraction and the “vacuum effect”. PLoS ONE 6, e27453.
| Crossref | Google Scholar | PubMed |
Morris K, Page M, Kay R, Renwick J, Desmond A, Comer S, Burbidge A, Kuchling G, Sims C (2015) Forty years of fauna translocations in Western Australia: lessons learned. In ‘Advances in reintroduction biology of Australian and New Zealand Fauna’. (Eds DP Armstrong, MW Hayward, D Moro, PJ Seddon) pp. 217–235. (CSIRO Publishing: Collingwood, Victoria)
Moseby KE, O’Donnell E (2003) Reintroduction of the greater bilby, Macrotis lagotis (Reid) (Marsupialia: Thylacomyidae), to northern South Australia: survival, ecology and notes on reintroduction protocols. Wildlife Research 30, 15-27.
| Crossref | Google Scholar |
Moseby KE, Read JL, Paton DC, Copley P, Hill BM, Crisp HA (2011) Predation determines the outcome of 10 reintroduction attempts in arid South Australia. Biological Conservation 144, 2863-2872.
| Crossref | Google Scholar |
Moseby KE, Blumstein DT, Letnic M (2016) Harnessing natural selection to tackle the problem of prey naivete. Evolutionary Applications 9, 334-343.
| Crossref | Google Scholar | PubMed |
Moseby KE, Lollback GW, Lynch CE (2018) Too much of a good thing; successful reintroduction leads to overpopulation in a threatened mammal. Biological Conservation 219, 78-88.
| Crossref | Google Scholar |
Moseby KE, Letnic M, Blumstein DT, West R (2019) Understanding predator densities for successful co-existence of alien predators and threatened prey. Austral Ecology 44, 409-419.
| Crossref | Google Scholar |
Moseby KE, Read JL, Tuft K, Van der Weyde LK (2023) Influence of interactive effects on long-term population trajectories in multispecies reintroductions. Conservation Biology
| Crossref | Google Scholar |
Noonan MJ, Fleming CH, Akre TS, Drescher-Lehman J, Gurarie E, Harrison A-L, Kays R, Calabrese JM (2019) Scale-insensitive estimation of speed and distance traveled from animal tracking data. Movement Ecology 7, 35.
| Crossref | Google Scholar | PubMed |
Palmer BJ, Valentine LE, Page M, Hobbs RJ (2020) Translocations of digging mammals and their potential for ecosystem restoration: a review of goals and monitoring programmes. Mammal Review 50, 382-398.
| Crossref | Google Scholar |
Paltridge R (2002) The diets of cats, foxes and dingoes in relation to prey availability in the Tanami Desert, Northern Territory. Wildlife Research 29, 389-403.
| Crossref | Google Scholar |
Pero EM, Chitwood MC, Hildreth AM, Berkman LK, Keller BJ, Sumners JA, Hansen LP, Isabelle JL, Eggert LS, Titus CL, Millspaugh JJ (2022) Acclimation of elk mating system following restoration to the Missouri Ozarks, U.S.A. Restoration Ecology 30, e13623.
| Crossref | Google Scholar |
R Core Team (2023) ‘R: a language and environment for statistical computing.’ (R Foundation for Statistical Computing: Vienna, Austria) Available at https://www.R-project.org/
Ross AK, Letnic M, Blumstein DT, Moseby KE (2019) Reversing the effects of evolutionary prey naivete through controlled predator exposure. Journal of Applied Ecology 56, 1761-1769.
| Crossref | Google Scholar |
Schoepf I, Schradin C (2012) Better off alone! Reproductive competition and ecological constraints determine sociality in the African striped mouse (Rhabdomys pumilio). Journal of Animal Ecology 81, 649-656.
| Crossref | Google Scholar | PubMed |
Schradin C (2005) Nest-site competition in two diurnal rodents from the succulent karoo of South Africa. Journal of Mammalogy 86, 757-762.
| Crossref | Google Scholar |
Schradin C, Schmohl G, Rödel HG, Schoepf I, Treffler SM, Brenner J, Bleeker M, Schubert M, König B, Pillay N (2010) Female home range size is regulated by resource distribution and intraspecific competition: a long-term field study. Animal Behaviour 79, 195-203.
| Crossref | Google Scholar |
Short J (2022) Irruptive dynamics of the brush-tailed bettong (Bettongia penicillata) when reintroduced to a fenced sanctuary with feral cats present. Wildlife Research 50, 85-95.
| Crossref | Google Scholar |
Silcock JL, McRae PD, Laidlaw MJ, Southgate RI (2023) Historical record shows broad habitat use and rapid decline of the greater bilby Macrotis lagotis in eastern Australia. Wildlife Research
| Crossref | Google Scholar |
Southgate R, Carthew SM (2006) Diet of the bilby (Macrotis lagotis) in relation to substrate, fire and rainfall characteristics in the Tanami Desert. Wildlife Research 33, 507-519.
| Crossref | Google Scholar |
Southgate R, Possingham H (1995) Modelling the reintroduction of the greater bilby Macrotis lagotis using the metapopulation model Analysis of the Likelihood of Extinction (ALEX). Biological Conservation 73, 151-160.
| Crossref | Google Scholar |
Southgate R, McRae P, Atherton R (1995) Trapping techniques and a pen design for the greater bilby Macrotis lagotis. Australian Mammalogy 18, 101-104.
| Crossref | Google Scholar |
Southgate RI, Christie P, Bellchambers K (2000) Breeding biology of captive, reintroduced and wild greater bilbies, Macrotis lagotis (Marsupialia: Peramelidae). Wildlife Research 27, 621-628.
| Crossref | Google Scholar |
Southgate R, Paltridge R, Masters P, Nano T (2005) An evaluation of transect, plot and aerial survey techniques to monitor the spatial pattern and status of the bilby (Macrotis lagotis) in the Tanami Desert. Wildlife Research 32, 43-52.
| Crossref | Google Scholar |
Stamps JA, Swaisgood RR (2007) Someplace like home: experience, habitat selection and conservation biology. Applied Animal Behaviour Science 102, 392-409.
| Crossref | Google Scholar |
Watkins GE, Willers N, Raudino H, Kinloch J, van Dongen R (2018) Success criteria not met, but valuable information gained: monitoring a reintroduction of the tammar wallaby. Wildlife Research 45, 421-435.
| Crossref | Google Scholar |
West R, Letnic M, Blumstein DT, Moseby KE (2018) Predator exposure improves anti-predator responses in a threatened mammal. Journal of Applied Ecology 55, 147-156.
| Crossref | Google Scholar |
West RS, Tilley L, Moseby KE (2020) A trial reintroduction of the western quoll to a fenced conservation reserve: implications of returning native predators. Australian Mammalogy 42, 257-265.
| Crossref | Google Scholar |
Wilson BA, Evans MJ, Gordon IJ, Pierson JC, Brockett BM, Wimpenny C, Batson WG, Newport J, Manning AD (2023) Roadmap to recovery revealed through the reintroduction of an IUCN Red List species. Biodiversity and Conservation 32, 227-248.
| Crossref | Google Scholar |