

To sea in the dark: assessing effects of LED streetlights on sea-finding in marine turtle hatchlings
Ebony J. King A B , Kate M. Hofmeister B , Simone C. Bosshard B , Colin J. Limpus C and Kylie L. Scales D *
D *
A
B
C
D
Abstract
Artificial light at night (ALAN) significantly affects the sea-finding ability of marine turtle hatchlings, which can entail detrimental effects on survival rates and population dynamics.
This behavioural study assesses the disruptive effects of light-emitting diode (LED) streetlights on the sea-finding behaviour of loggerhead and flatback turtle hatchlings. Specifically, we test LEDs that are readily available for purchase to guide wildlife-friendly lighting decisions. We examine the influence of a range of spectral wavelengths and light intensities on orientation of hatchlings post-release.
Behavioural experiments were conducted using a circular pitfall arena situated on a beach during the new moon to simulate natural night-time conditions. LED streetlights with narrow or broad spectral power distributions were tested at varying light intensities, which were adjusted by modifying wattage, number of LEDs, or the distance of the LED from the hatchling release point. Circular statistics were used to analyse the hatchlings’ orientation and LEDs were considered suitable for use if they did not disrupt sea-finding behaviour.
A narrow-spectrum LED streetlight (peak intensity at 625 nm) did not significantly disrupt hatchlings’ sea-finding behaviour, even at higher light intensities. A phosphor converted amber LED had minimal impact on flatback hatchlings but somewhat affected loggerhead hatchlings’ orientation at higher light intensities. Our findings confirm that broad-spectrum LEDs with blue wavelengths of light are not appropriate to use near marine turtle nesting beaches.
The study demonstrated the importance of understanding the spectral characteristics and intensities of artificial lighting near marine turtle nesting beaches. Narrow-spectrum LEDs without blue wavelengths of light appear to be less disruptive to sea-finding behaviour than are broad-spectrum LEDs. These findings suggest that careful selection and management of lighting infrastructure are crucial for minimising negative impacts on marine turtle populations.
The results have provided valuable insights for policymakers and land managers involved in coastal lighting management. Species-specific parameters should be considered when implementing lighting solutions near marine turtle nesting beaches to mitigate the adverse effects of ALAN on hatchling orientation and survival.
Keywords: artificial light at night, disorientation, light pollution, loggerhead turtle, sea turtle hatchling, sea-finding behaviour.
Introduction
Artificial light at night (ALAN) is expected to increase 6% per year in response to human population growth and the associated proliferation of streetlights, transport systems and buildings (Hölker et al. 2010; Kyba et al. 2017). Currently, 80% of the global population live under light-polluted skies (Falchi et al. 2016), with illuminance levels at the earth’s surface capable of reaching or exceeding the brightness of full moon conditions (Shimada et al. 2023). In Australia, ALAN is recognised as a key threatening process to the recovery of endangered marine turtle populations because of its disruption to hatchling sea-finding behaviour and offshore recruitment (Commonwealth of Australia 2023). Marine turtle hatchlings use a range of visual and topographic cues to navigate to the ocean (Limpus and Kamrowski 2013). On emergence from the nest, hatchlings crawl across the beach, enter the ocean and begin a ‘swimming frenzy’ across several days to disperse from predator-rich coastal waters (Salmon et al. 1992). Under natural night-time conditions, the distant ocean horizon is distinct, with the sky being brighter than the ocean and lower than the landward horizon above the dunes and vegetation. Hatchlings use visual cues in choosing the direction in which they crawl while on the nesting beach, with hatchlings moving towards the lowest horizon and away from elevated horizons (Limpus and Kamrowski 2013). When the brightness of skyglow or immediately adjacent artificial light sources compete with hatchling sea-finding cues, hatchlings can become disorientated (crawling in circles, crawl in no specific direction) or misoriented (crawl towards light) (Salmon and Witherington 1995; Limpus and Kamrowski 2013). Any disruptions to sea-finding behaviour and commencement of the ‘swimming frenzy’ can affect the off-shore dispersal of hatchlings and negatively affect survival rates, ultimately reducing recruitment into recovering turtle stocks (Truscott et al. 2017).
Given the significance of visual cues in marine turtle sea-finding behaviour and an increase in ALAN, it is necessary to determine which wavelengths of light they can detect, and which have the greatest impact on behaviour (Witherington and Bjorndal 1991; Horch et al. 2008; Robertson et al. 2016). Wavelength sensitivity is known to vary among genetic stocks within a single species (Witherington and Bjorndal 1991; Fritsches 2012). For example, electroretinogram tests have determined the spectral range of loggerhead (Caretta caretta) and green (Chelonia mydas) turtles to be between 440 and 700 nm (violet to red range of the visible spectrum), with peak sensitivity at 580 nm (yellow) (Levenson et al. 2004), whereas loggerheads and leatherback (Dermochelys coriacea) turtles in Florida were found to have peak sensitivity between 520 and 540 nm (green), with a secondary peak at 380 nm (violet) (Horch et al. 2008). Behavioural testing using a y-maze choice experiment found that loggerhead hatchlings in Florida display negative phototaxis (crawl away from light) to high intensity wavelengths of light at 550–600 nm (yellow) (Witherington and Bjorndal 1991). Fritsches (2012) replicated this study and found that loggerhead hatchlings in eastern Australia displayed positive phototaxis (crawl towards light) to wavelengths of light from 365 nm (ultraviolet) to 600 nm (yellow). Understanding wavelength sensitivities informs strategies to mitigate the ecological impact of light pollution in areas adjacent to biologically sensitive turtle nesting habitat (Commonwealth of Australia 2023).
In Australia, streetlights are a primary source of light pollution, and their installation is regulated by local, state and federal government (Commonwealth of Australia 2017). There has been a widespread transition from low-pressure sodium (LPS) and high-pressure sodium (HPS) streetlights to energy-efficient light-emitting diode (LED) technology (Dudley et al. 2015; Franz and Wenzl 2017). Unlike LPS and HPS streetlights, which emit narrow-spectrum light, most LEDs produce broad-spectrum light that contains a high proportion of short-wavelength blue light (Aubé et al. 2013). Advances in LED engineering now enable the design of wildlife-friendly lights that emit narrow-spectrum rather than broad-spectrum light, helping reduce ecological impacts (Longcore et al. 2015; Robertson et al. 2016). To mitigate light pollution near marine turtle nesting beaches, management strategies should prioritise the use of LEDs that emit little or no blue light and operate at the lowest effective light intensity (Witherington and Martin 2003; Commonwealth of Australia 2023).
This study investigates the impacts of six commercially available LED streetlights on the sea-finding behaviour in the South-west Pacific (swPac) genetic stock of loggerhead turtle hatchlings (Caretta caretta). Four of the streetlights are conventional broad-spectrum LEDs, whereas the remaining two emit narrow-spectrum light. Establishing their effects on sea-finding behaviour will enable us to provide evidence-based recommendations to inform governmental policy and guide decision-makers in the installation of lighting near marine turtle nesting habitat. During the study period, one clutch of eastern Australian flatback (Natator depressus) hatchlings emerged, allowing us to assess the influence of one LED streetlight on their sea-finding behaviour.
Materials and methods
Ethical approval
This study was approved by a Queensland Department of Environment and Science Ethic Committee, Approval Number SA 2020/02/733.
Study site
Trials were conducted between 8 and 20 February 2021 at Mon Repos Conservation Park (−24.796111°S, 152.440556°E) on the Woongarra coast in Queensland, Australia (Fig. 1), during the 2020–2021 turtle nesting season. Mon Repos is an east-facing brown sand beach that supports the largest number of nesting loggerhead turtles from the swPac genetic stock (Limpus and Limpus 2003; Limpus 2009; Limpus et al. 2013; FitzSimmons and Limpus 2014).

The beach is 1.6 km long and is backed by casuarina forests that were established in the 1980s to create a dark and elevated inland horizon. This study site was selected because of its naturally dark conditions, providing the nest environment to demonstrate differences between light trials, while also being located in an area with hatchlings available to study. Skyglow is visible to the naked eye in the direction of the township of Bargara 3 km south and to a lesser extent from Bundaberg located 15 km to the west. Mon Repos Conservation Park is managed by the Queensland Parks and Wildlife Service (QPWS). Annual research of the nesting turtles at Mon Repos has been operational since 1968. During the nesting and hatchling season the beach is closed to the public between 1800 hours and 0600 hours. Park rangers lead up to 5 groups of 50 tourists per night for interpretive tours in parallel to a total nesting population capture–mark–recapture tagging census study led by QPWS research staff. Small hand-held white and yellow lights were used intermittently by rangers but are shown to be minimally disruptive (Berry et al. 2013). Rangers remained at distances greater than 100 m from the outer boundary of the experimental setup, which is defined by the furthest streetlight located 100 m from the centre of the arena. Data collection was conducted at night during the new moon lunar period to ensure naturally dark celestial conditions.
Arena trials
Experiments were performed in a circular pitfall arena, similar to previous hatchling directional studies (Mrosovsky and Carr 1967; Berry et al. 2013; Robertson et al. 2016). A 10 m diameter arena with a 31.4 m circumference trench around the perimeter was constructed on the sand between the first dune and the high tide line (Fig. 2). The 20 cm wide and 30 cm deep perimeter trench (31.4 m circumference) was subdivided into 24 sectors using thin ply timber boards. The trench measured 20 cm in width and 30 cm in depth and was divided into 24 sectors. The divisions were created using 5 mm thick ply timber boards, matching the trench dimensions to ensure the boards remained securely in place and were positioned flush with the beach surface, thereby not hindering hatchling sea-finding behaviour while in the arena. Each sector represented a 15° spread. The sand was raked over and cleared of debris before each trial to ensure a smooth surface. A plastic peg was placed in the middle of the arena to mark the hatchling release point.
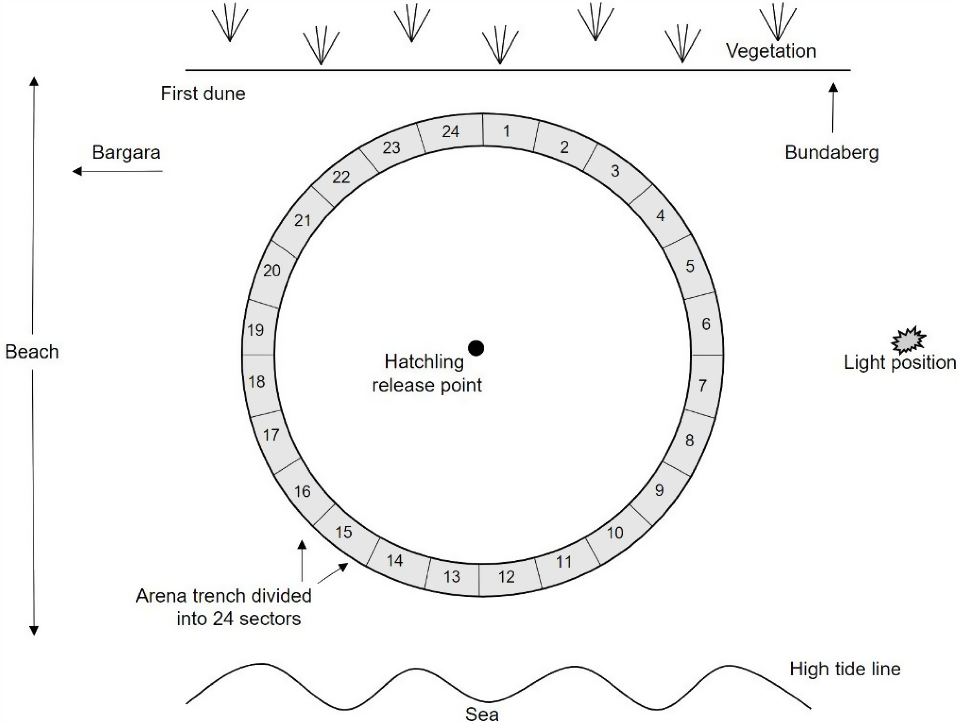
Sampling distances of 25, 50, 75 and 100 m were measured from the hatchling release point and marked on the beach on the north side of the arena. A streetlight pole, mounted on a trailer, was positioned at the required sampling position for each trial. With the pole on the trailer, the luminaire fixture was 4.7 m above the beach surface and angled horizontally at 90°. The fixture was designed to accommodate up to four LEDs arranged horizontally, allowing the number of LEDs activated at a given time to be adjusted.
Each experiment was conducted at night and tested one LED streetlight and included a control trial in which no light was turned on. The control trials ensured that hatchling sea-finding behaviour was assessed in the absence of artificial light. If cloud cover changed noticeably during the experiment, a second control trial was performed to account for potential variations in ambient light. In subsequent trials, the LED was tested at different light intensities. Light intensity was changed by either varying the wattage, changing the distance of the streetlight from the hatchling release point, or by changing the number of LEDS turned on. The trials were conducted in a predetermined sequence, progressing systematically by increasing wattage, number of LEDs, or distance from the arena (Table 1).
| Experiment | LED | Species | Trial | Light intensity | |||
|---|---|---|---|---|---|---|---|
| Wattage | Number of lights | Distance (m) | |||||
| 1 | Red 625 nm LED | C. caretta | Control 1 | ||||
| Trial 1 | 28 | 1 | 25 | ||||
| Trial 2 | 35 | 1 | 25 | ||||
| Trial 3 | 46 | 1 | 25 | ||||
| Trial 4 | 54 | 1 | 25 | ||||
| Control 2 | |||||||
| 2 | Red 625 nm LED | C. caretta | Control 1 | ||||
| Trial 1 | 54 | 1 | 25 | ||||
| Trial 2 | 54 | 2 | 25 | ||||
| Trial 3 | 54 | 3 | 25 | ||||
| Trial 4 | 54 | 4 | 25 | ||||
| 3 | Red 625 nm LED | C. caretta | Control 1 | ||||
| Trial 1 | 54 | 4 | 50 | ||||
| Trial 2 | 54 | 4 | 75 | ||||
| 4 | Phosphor converted amber (PC amber) LED | N. depressus | Control 1 | ||||
| Trial 1 | 1 | 25 | |||||
| Trial 2 | 1 | 50 | |||||
| Trial 3 | 1 | 75 | |||||
| Trial 4 | 1 | 100 | |||||
| 5 | Phosphor converted amber (PC amber) LED | C. caretta | Control 1 | ||||
| Trial 1 | 1 | 25 | |||||
| Trial 2 | 1 | 50 | |||||
| Trial 3 | 1 | 75 | |||||
| Trial 4 | 1 | 100 | |||||
| 6 | 2500 K 40 W LED | C. caretta | Control 1 | ||||
| Trial 1 | 1 | 25 | |||||
| Trial 2 | 1 | 50 | |||||
| Trial 3 | 1 | 75 | |||||
| Trial 4 | 1 | 100 | |||||
| 7 | 2700 K 24 W LED | C. caretta | Control 1 | ||||
| Trial 1 | 1 | 25 | |||||
| Trial 2 | 1 | 50 | |||||
| Trial 3 | 1 | 75 | |||||
| Trial 4 | 1 | 100 | |||||
| 8 | 3000 K 24 W LED | C. caretta | Control 1 | ||||
| Trial 1 | 1 | 25 | |||||
| Trial 2 | 1 | 50 | |||||
| Trial 3 | 1 | 75 | |||||
| Trial 4 | 1 | 100 | |||||
| 9 | 3000 K 70 W LED | C. caretta | Control 1 | ||||
| Trial 1 | 1 | 25 | |||||
| Trial 2 | 1 | 50 | |||||
| Trial 3 | 1 | 75 | |||||
| Trial 4 | 1 | 100 | |||||
Refer to Table S1 for LED streetlight descriptions.
To ensure complete darkness before a trial begun, hatchlings were placed under an upside-down opaque bucket at the hatchling release point in the centre of the area. A single trial began when a bucket was lifted swiftly from its position by an attached rope, pulled from the landward side of the arena. This technique did not interfere with the direction of hatchling sea-finding orientation. Loggerhead hatchlings were given 3 min and flatback hatchlings 2 min to crawl to the perimeter trench, being reflective of crawling speeds for each species. Hatchlings were then collected from the trench and the number of hatchlings in each sector was recorded. Any hatchlings that did not reach the trench were collected, recorded and exchanged with others for following trials and excluded from data analysis.
LED streetlights
Hatchling sea-finding behaviour was assessed in the dark (control trials) and in the presence of six industrial LED streetlights with different spectral characteristics (Table 1, Supplementary Table S1). Four of the streetlights were broad-spectrum LEDs with varying correlated colour temperatures (CCT) (Supplementary Figs S3–S5). One light was a narrow-spectrum red LED with a peak intensity at 625 nm (Fig. S1). Another was a phosphor converted (PC) amber LED designed to minimise blue wavelength emissions. This LED emitted a narrow-spectrum light (Fig. S2). The intensity of the light was altered by increasing the wattage, the number of LEDs turned on at the same time, or by changing the distance of the streetlight from the hatchling release point.
Animal handling
Loggerhead turtle hatchlings (Caretta caretta) and flatback turtle hatchlings (Natator depressus) were collected from naturally emerging clutches as they crawled to the surface of the beach within the Mon Repos Conservation Park or the adjacent beach area of the Great Sandy Marine Park. Hatchlings were collected during the evening to coincide with the night-time ambient light conditions and were held for no more than 2 h. Each night up to 60 hatchlings were collected from one to three nests, placed in a plastic bucket containing a layer of damp sand, and immediately transported by foot to the nearby arena. A subsample of 50 hatchlings were then randomly selected and used for all experiments. Once the experiments were completed, the hatchlings were released from a bucket at a nearby dark section of the beach and they crawled to the sea.
Statistical analysis
Circular statistical analysis was used to analyse the effects of artificial light on hatchling orientation by using Oriana (ver. 4 for Windows; Kovach 2011). We first determined whether hatchling orientation within each trial was significantly orientated by using a Rayleigh test. When P < 0.05, the null hypothesis of a uniform distribution around the arena was rejected, meaning that the data showed significant clustering around a preferred direction. (Zar 2010). Then, a pairwise chi-squared test for grouped angular data was used to determine whether the mean direction of orientation between the control and light trials differed from each other (at P = 0.05) (Batschelet 1981). If an experiment had more than one control trial the data were pooled if the direction of orientation did not differ. Circular histograms were used to present directionality data and basic statistics were used to describe the properties of the mean vector, the angle of orientation (μ) and the length (r) to indicate the strength of orientation. Data were pooled into 12 segments in the circular histograms for illustrative purposes.
To describe the direction of movement, Sectors 10–15 were classified as ‘seaward’, Sectors 4–9 as ‘lightward’, Sectors 16–21 as ‘opposite of light’, and Sectors 0–3 and 22–24 as ‘landward.’ The intersect between Sectors 12 and 13 was the direct line to the ocean. Sea-finding behaviour was determined to be successful if 90% or more hatchlings orientated seawards. Streetlights that enabled successful sea-finding were deemed suitable for use near marine turtle nesting beaches. As a result, decision-makers can select a LED that best suits the needs of a given area, balancing both human and ecological considerations.
Results
In total, nine experiments with a total of 44 trials were run to determine the effect of LED streetlights on turtle hatchling sea-finding behaviour. In control trials with LEDs turned off, all groups of hatchlings displayed highly directional paths towards the ocean (Figs 3–6; all Z > 32, P < 0.001). In all trials with LEDs tuned on, all groups of hatchlings displayed highly directional paths, but the direction of orientation varied depending on their responses to the light source (Figs 3–6; all Z > 32, P < 0.001). Seven hatchlings did not reach the trench and no patterns were observed among them.
Red 625 nm LED
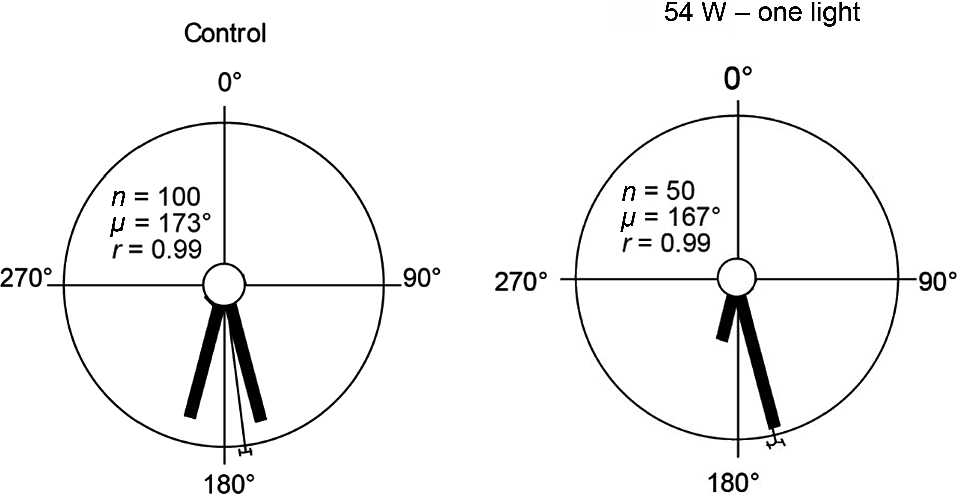
In experiment one, loggerhead hatchlings were exposed to a narrow-spectrum red 625 nm LED positioned 25 m from the hatchling release point. Sea-finding behaviour was not affected by light intensities of 28 W, 35 W or 46 W. At the highest intensity tested (54 W), sea-finding behaviour was significantly affected, although the majority of hatchlings still crawled in a seaward direction (Figs 3, S6, Table 2). Date was pooled for two control trials that did not have a significantly different direction of orientation (χ2 = 5, P = 0.03, d.f. = 4).
Loggerhead hatchling sea-finding orientation in response to a red 625 nm 54 W LED at 25 m distance, showing a significant change in direction between the control trial and the 54 W trial (χ2 = 11, P = 0.023, d.f. = 4). 90° indicates direction of LED; 180° indicates direction of ocean The length of the bars indicates the relative proportion of hatchlings dispersing in a particular direction. The thin bar indicates the mean direction of all hatchlings with a 95% confidence limit. n, number of hatchlings; μ, mean vector angle; r, length of the mean vector (on a scale of 0–1, 0 = uniform distribution of tracks around circle, 1 = all individual tracks were clustered in same direction).
| Experiment | LED | Spectral distribution | Species | Variables and observations (n) | χ2 (d.f.) | P | Intensity | Suitable for use | |||
|---|---|---|---|---|---|---|---|---|---|---|---|
| Wattage (W) | Number of LEDs | Distance (m) | |||||||||
| 1 | Red 625 nm | Narrow | C. caretta | Control 1 (50) and Control 2 (50) | 4.9 (4) | >0.05 | – | – | – | – | |
| Control Pooled (100) and Trial 1 (50) | 2.3 (4) | >0.05 | 28 | 1 | 25 | ✓ | |||||
| Control Pooled (100) and Trial 2 (50) | 4.7 (5) | >0.05 | 35 | 1 | 25 | ✓ | |||||
| Control Pooled (100) and Trial 3 (50) | 7.3 (4) | >0.05 | 46 | 1 | 25 | ✓ | |||||
| Control Pooled (100) and Trial 4 (50) | 11.3 (4) | <0.05 | 54 | 1 | 25 | * | |||||
| 2 | Red 625 nm | Narrow | C. caretta | Control (50) and Trial 1 (50) | 7.1 (6) | >0.05 | 54 | 1 | 25 | ✓ | |
| Control (50) and Trial 2 (49) | 13.3 (7) | >0.05 | 54 | 2 | 25 | ✓ | |||||
| Control (50) and Trial 3 (50) | 28.6 (9) | <0.05 | 54 | 3 | 25 | * | |||||
| Control (50) and Trial 4 (50) | 36.0 (7) | <0.05 | 54 | 4 | 25 | * | |||||
| 3 | Red 625 nm | Narrow | C. caretta | Control (50) and Trial 1 (50) | 20.0 (7) | <0.05 | 54 | 4 | 50 | * | |
| Control (50) and Trial 2 (50) | 29.2 (7) | <0.05 | 54 | 4 | 75 | * | |||||
| 4 | Phosphor converted amber | Narrow | N. depressus | Control (49) and Trial 1 (50) | 17.5 (6) | <0.05 | 24 | 1 | 25 | * | |
| Control (49) and Trial 2 (50) | 2.7 (2) | >0.05 | 24 | 1 | 50 | ✓ | |||||
| Control (49) and Trial 3 (49) | 1.7 (2) | >0.05 | 24 | 1 | 75 | ✓ | |||||
| Control (49) and Trial 4 (50) | 0.7 (2) | >0.05 | 24 | 1 | 100 | ✓ | |||||
| 5 | Phosphor converted amber | Narrow | C. caretta | Control (50) and Trial 1 (49) | 64.6 (8) | <0.05 | 24 | 1 | 25 | ✗ | |
| Control (50) and Trial 2 (50) | 47.7 (4) | <0.05 | 24 | 1 | 50 | * | |||||
| Control (50) and Trial 3 (50) | 42.0 (3) | <0.05 | 24 | 1 | 75 | * | |||||
| Control (50) and Trial 4 (50) | 35.2 (3) | <0.05 | 24 | 1 | 100 | * | |||||
| 6 | 2500 K 40 W | Broad | C. caretta | Control (50) and Trial 1 (50) | 67.2 (12) | <0.05 | 40 | 1 | 25 | ✗ | |
| Control (50) and Trial 2 (50) | 34.1 (7) | <0.05 | 40 | 1 | 50 | * | |||||
| Control (50) and Trial 3 (50) | 29.8 (7) | <0.05 | 40 | 1 | 75 | * | |||||
| Control (50) and Trial 4 (50) | 20.1 (8) | <0.05 | 40 | 1 | 100 | * | |||||
| 7 | 2700 K 24 W | Broad | C. caretta | Control (50) and Trial 1 (50) | 75.7 (11) | <0.05 | 24 | 1 | 25 | ✗ | |
| Control (50) and Trial 2 (50) | 46.7 (9) | <0.05 | 24 | 1 | 50 | ✗ | |||||
| Control (50) and Trial 3 (50) | 22.7 (7) | <0.05 | 24 | 1 | 75 | * | |||||
| Control (50) and Trial 4 (50) | 32.0 (6) | <0.05 | 24 | 1 | 100 | * | |||||
| 8 | 3000 K 24 W | Broad | C. caretta | Control (50) and Trial 1 (47) | 90.0 (10) | <0.05 | 24 | 1 | 25 | ✗ | |
| Control (50) and Trial 2 (50) | 41.0 (8) | <0.05 | 24 | 1 | 50 | ✗ | |||||
| Control (50) and Trial 3 (50) | 32.9 (7) | <0.05 | 24 | 1 | 75 | * | |||||
| Control (50) and Trial 4 (50) | 21.4 (5) | <0.05 | 24 | 1 | 100 | * | |||||
| 9 | 3000 K 70 W | Broad | C. caretta | Control (48) and Trial 1 (49) | 97.0 (8) | <0.05 | 70 | 1 | 25 | ✗ | |
| Control (48) and Trial 2 (51) | 92.6 (9) | <0.05 | 70 | 1 | 50 | ✗ | |||||
| Control (48) and Trial 3 (50) | 72.6 (8) | <0.05 | 70 | 1 | 75 | ✗ | |||||
| Control (48) and Trial 4 (50) | 68.3 (6) | <0.05 | 70 | 1 | 100 | * | |||||
It includes the suitability of LEDs for installation at marine turtle nesting beaches within the geographical distribution of the swPac loggerhead (Caretta caretta) and EA flatback turtle (Natdor depressus), on the basis of ion light intensity thresholds. Ticks (✓) indicate trials that did not disrupt hatchling sea-finding behaviour. Asterisks (*) indicate trials where the direction or orientation was statistically significantly altered but over 90% of hatchlings still orientated in a seaward direction. Crosses (✗) indicate trials where sea-finding behaviour failed. Dashes (–) indicate experiments where further trials were not run if luminaire had no impact at a higher intensity.
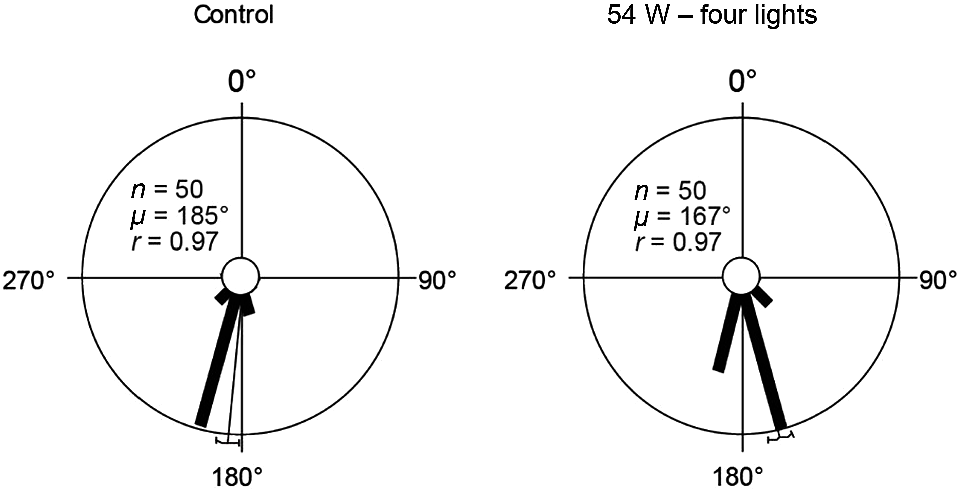
In the second experiment, loggerhead hatchlings were exposed to a red 625 nm LED positioned 25 m from the hatchling release point. Light intensity was increased in each trial by increasing the number of LEDs turned on in each trial (1–4). Sea-finding behaviour was not affected in trials when exposed to one and two LEDs. At increasing light intensities of three and four LEDs, sea-finding behaviour was significantly affected, although the majority of hatchlings still crawled in a seaward direction (Fig. 4; Table 2; Fig. S7).
Loggerhead hatchling sea-finding orientation in response to an increasing number of red 625 nm 54 W LEDs at 25 m distance. 90° indicates direction of LED; 180° indicates direction of ocean. There was a significant change in direction between the control trial and four-lights (χ2 = 36, P < 0.001, d.f. = 7) trial. The length of the bars indicates the relative proportion of hatchlings dispersing in a particular direction. The thin bar indicates the mean direction of all hatchlings with a 95% confidence limit. n, number of hatchlings; μ, mean vector angle; r, length of the mean vector (on a scale of 0–1, 0 = uniform distribution of tracks around circle, 1 = all individual tracks were clustered in same direction).
In experiment three, loggerhead hatchlings were exposed to a red 625 nm LED with four lights operating at 54 W. Light intensity was decreased as the streetlight was moved 50 m and 75 m away from the hatchling release point. Sea-finding behaviour was significantly affected, although the majority of the hatchlings crawled in a seaward direction (Table 2, Fig. S8).
Phosphor converted (PC) amber LED
In Experiment 4, flatback hatchlings were exposed to a PC amber LED and light intensity was decreased by moving the streetlight in 25 m increments away from the hatchling release point. At the highest light intensity (25 m), sea-finding behaviour was significantly affected, although the majority of hatchlings crawled in a seaward direction. At decreasing light intensities of 50 m, 75 m and 100 m, sea-finding behaviour was not affected (Figs 5a, S9, Table 2).
Hatchling sea-finding orientation in response to PC amber LED at increasing distances away from the arena. There was a significant change in direction between the control trial and the subtrials for flatback hatchlings (a) at (b) 25 m (χ2 = 18, P = 0 0.008, d.f. = 6) and (c) 50 m (χ2 = 3, P = 0.261, d.f. = 2), and for loggerhead hatchlings (d) at (e) 25 m (χ2 = 65, P < 0.001, d.f. = 8) and (f) 50 m (χ2 = 48, P < 0.001, d.f. = 4). 90° indicates direction of LED; 180° indicates direction of ocean. The length of the bars indicates the relative proportion of hatchlings dispersing in a particular direction. The thin bar indicates the mean direction of all hatchlings with a 95% confidence limit. n, number of hatchlings; μ, mean vector angle; r, length of the mean vector (on a scale of 0–1, 0 = uniform distribution of tracks around circle, 1 = all individual tracks were clustered in same direction).
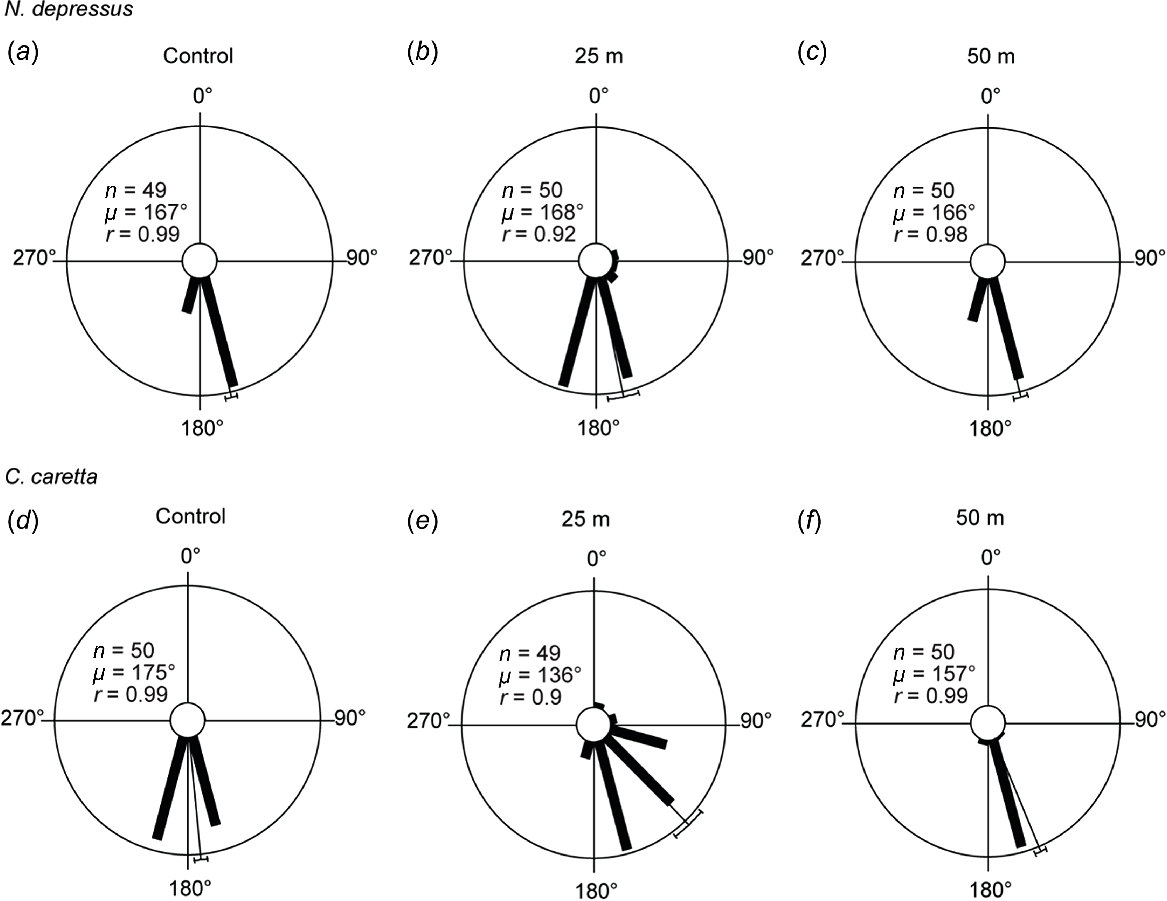
In Experiment 5, loggerhead hatchlings were exposed to a PC amber LED and light intensity was decreased by moving the streetlight in 25 m increments away from the hatchling release point. At the highest intensity (25 m), sea-finding behaviour was significantly affected, with 37% of hatchlings crawling towards the streetlight and 63% crawling seawards. Sea-finding behaviour was significantly affected at decreasing light intensities of 50 m 75 m and 100 m, although the majority of the hatchlings crawled in a seaward direction (Figs 5b, S0, Table 2).
Broad-spectrum LEDs
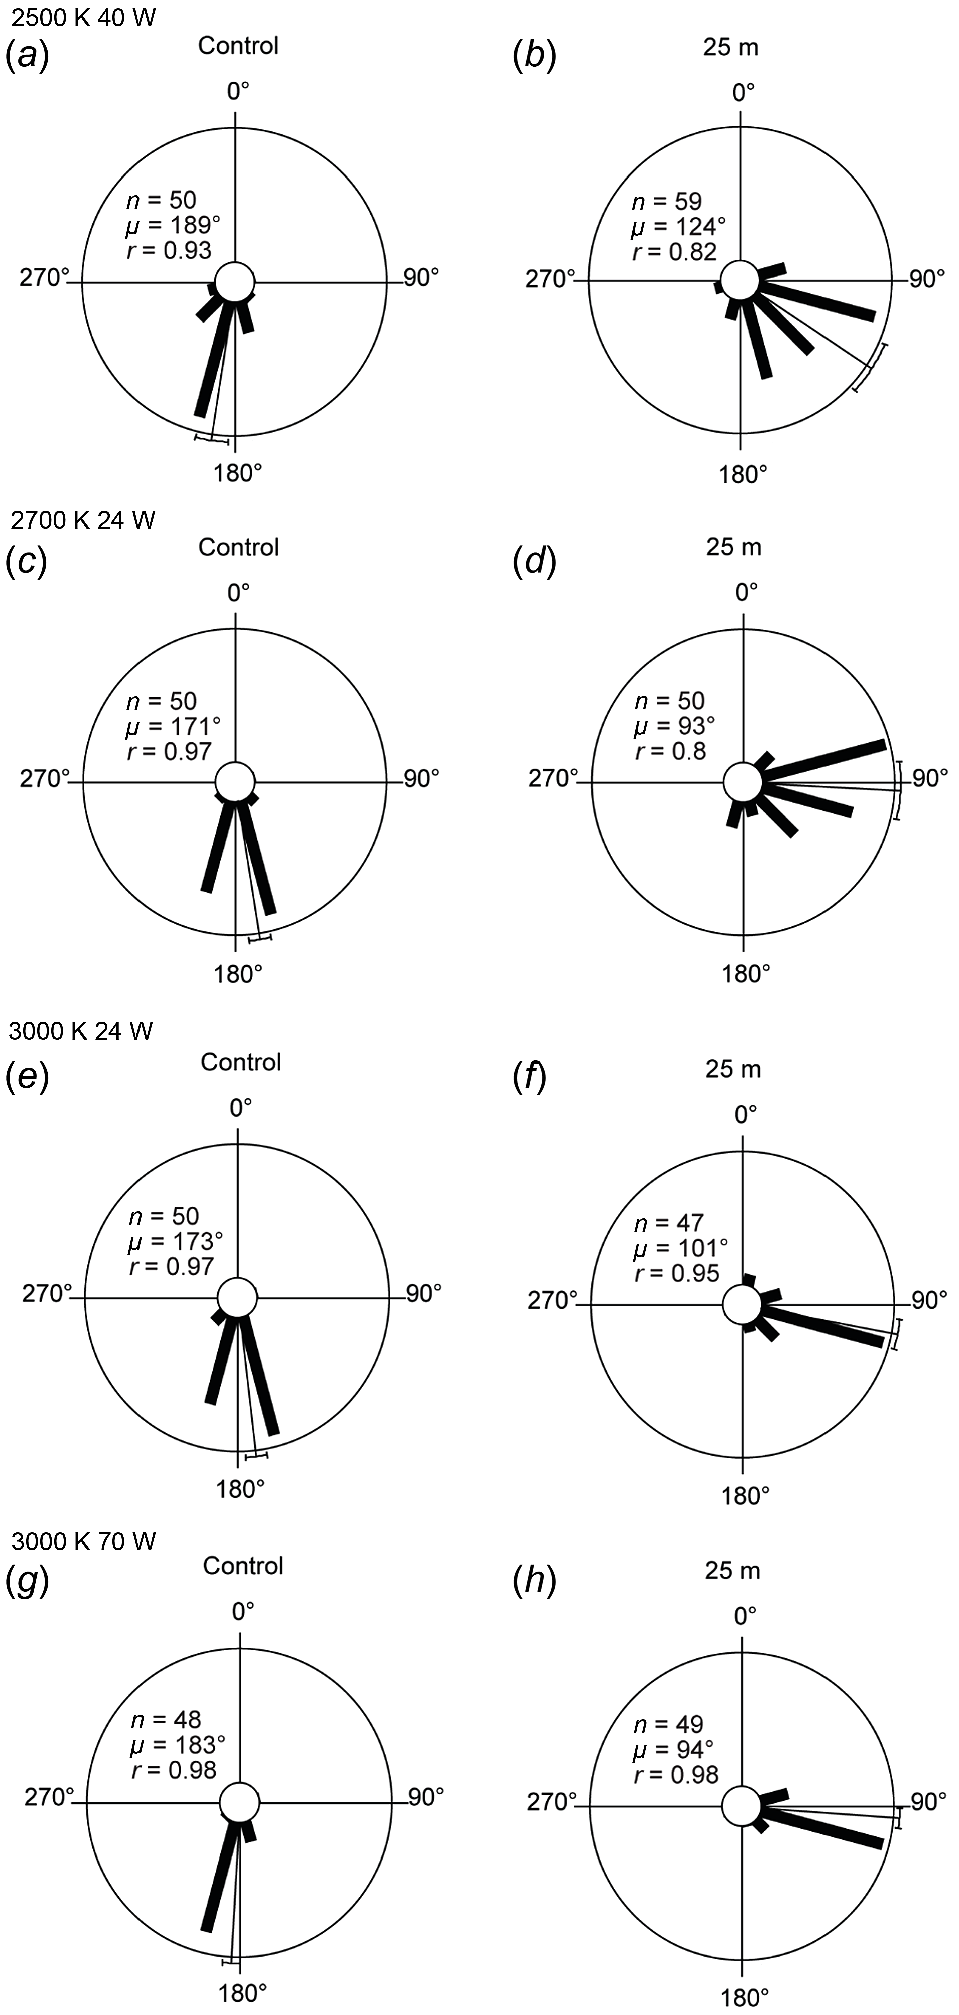
In Experiments 6–9, loggerhead hatchlings were exposed to broad-spectrum LEDs with different CCT. Light intensity was decreased by moving the streetlight in 25 m increments away from the hatchling release point. Sea-finding behaviour was significantly affected across all trials with LEDs turned on (all chi-squared, P < 0.05; Fig. 6). However, at some distances, hatchlings crawled in a seaward direction (Table 2, Figs S11c–e, S1d–e, S13d–e, S14e).
Loggerhead hatchling sea-finding orientation in response to broad-spectrum LEDs positioned at 25 m distance. There was a significant change in direction between the control trial and the 25 m trial for all broad-spectrum LEDs: (a–b) 2500 K 40 W trial (χ2 = 67, P < 0.001, d.f. = 12); (c–d) 2700 K 24 W (χ2 = 76, P < 0.001, d.f. = 11); (e–f) 3000 K 24 W (χ2 = 91, P < 0.001, d.f. = 11); and (g–h) 3000 K 70 W (χ2 = 97, P < 0.001, d.f. = 8). 90° indicates direction of LED; 180° indicates direction of ocean. The length of the bars indicates the relative proportion of hatchlings dispersing in a particular direction. The thin bar indicates the mean direction of all hatchlings with a 95% confidence limit. n, number of hatchlings; μ, mean vector angle; r, length of the mean vector (on a scale of 0–1, 0 = uniform distribution of tracks around circle, 1 = all individual tracks were clustered in same direction).
Suitability of tested LED streetlights for use near marine turtle nesting beaches
Tested LED streetlights were determined to be suitable for use near marine turtle nesting beaches in East Australia if 90% or more of hatchlings oriented towards the seaward sectors of the arena (Tables 2, S2).
Discussion
We have demonstrated that a narrow-spectrum LED streetlight with peak intensity 625 nm (red) does not disrupt the sea-finding behaviour of loggerhead turtle hatchlings from the swPac genetic stock, because all hatchlings crawled toward the ocean (Figs 3, 4). Similarly, a narrow-spectrum PC amber LED did not affect flatback and loggerhead hatchling orientation at low light intensities and only minimally affected sea-finding behaviour at higher light intensities (Fig. 5). In contrast, broad-spectrum LEDs at varying CCT and containing blue wavelengths of light significantly affected sea-finding behaviour (Fig. 6).
Red 625 nm LED
‘Turtle-safe’ red LED streetlights that emit a narrow portion of the visible spectrum have been heavily marketed for use in coastal areas bordering nesting beaches, to minimise disruption to nesting turtles and emerging hatchlings (Witherington and Martin 2003). Previous studies have found a range of turtle species to be minimally affected (not disoriented) by low-intensity wavelengths of red light (Witherington and Bjorndal 1991; Levenson et al. 2004). In Florida, a shielded 624 nm peak intensity protype lamp was found to have no significant impact on the sea-finding ability of loggerhead hatchlings (Long et al. 2022), whereas on the Woongarra coast in Australia, LED streetlight with peak intensity of 694 nm light caused mild disorientation (Fritsches 2012). Similar trials on the Woongarra Coast using hand-held torches have found that peak-intensity 640 nm red light causes disrupted sea-finding behaviour, but to a lesser extent at lower intensities (Robertson et al. 2016). We observed normal sea-finding behaviour across all levels of light intensities for a narrow spectrum LED with a peak intensity of 625 nm (Figs 3, 4).
Phosphor-converted amber LED
Phosphor converted (PC) amber LEDs achieves a high level of light output by transforming blue wavelengths into amber wavelengths. Even though phosphor conversion does not produce wildlife-friendly recommended narrow spectral distributions, it does produce relatively longer, less disruptive wavelengths of light. PC amber LEDs have been recommended to use instead of 3000 K or 4000 K LEDs, because they have been found to contribute significantly less to skyglow (Aubé et al. 2018). However, to the best of our knowledge, no previous studies in the literature have examined the effects of PC amber LEDs on the sea-finding behaviour of marine turtles. Our study found a difference in response between flatback and loggerhead species of hatchlings to a PC amber streetlight (Fig. 4). Flatback hatchlings crawled seawards at all intensities (LED placed 25–100 m away). Loggerhead hatchlings were misoriented towards the light at the highest intensity (LED placed 25 m away), but showed successful sea-finding behaviour at lower intensities (LED placed 50, 75 and 100 m away) (Tables 2, S2).
Broad-spectrum LEDs
Broad-spectrum LEDs are swiftly becoming the predominant type of lighting used globally and are characterised by their broad-spectrum emissions with peaks in the blue wavelength range (Commonwealth of Australia 2023). Loggerhead turtle hatchlings in eastern Australia have the visual capacity to detect and react to wavelengths of light ranging from ultraviolet (365 nm) to red (694 nm) (Fritsches 2012). Similar sensitivities to broad-spectrum light have been demonstrated across species (Horch et al. 2008), genetic stocks (Witherington and Bjorndal 1991; Fritsches 2012), in situ (Robertson et al. 2016; Cruz et al. 2018) and in controlled laboratory experiments (Witherington and Bjorndal 1991; Levenson et al. 2004). Our findings demonstrated that broad-spectrum LEDs are not appropriate for use near turtle nesting beaches (Fig. 6).
Spectral characteristics of light
Broad-spectrum LEDs are typically described by their correlated colour temperature (CCT). Research has shown that CCT is an unreliable measure of ecological impact (Pawson and Bader 2014), which is consistent with our findings (Table 2). This is because broad-spectrum LEDs, regardless of CCT, emit problematic blue wavelengths of light (Figs S3–S6). This highlights that a thorough understanding of a light sources’ spectral characteristics is essential for making informed lighting decisions. To address this challenge, our study concentrated on wavelength distribution and light intensity as the primary parameters for evaluating the suitability of various lighting options and for informing our recommendations (Table 2; Figs S1–S5).
Implications for on ground management
The impacts of artificial light at night on turtle sea-finding behaviour are well understood and have resulted in a commercial market for streetlights suited to genetic stocks outside of Australia (Long et al. 2022). In response, wildlife-friendly luminaire accreditation programs have been developed to broadly address impacts and encourage suitable procurement. In this study, we have aimed to provide clear guidance for policymakers and developers to ensure that appropriate light solutions are met. As coastal development and light pollution continue to rise globally, integrating evidence-based lighting solutions will be crucial for balancing human activities with the preservation of critical wildlife habitats.
Data availability
The data that support this study will be shared upon reasonable request to the corresponding author.
Acknowledgements
We thank Nev and Bev McLachlan, Lesley Dimmock, Michael Molloy, Lisa Holmblad, Regan Matthews and Queensland Turtle Conservation Project volunteers for assistance with field experiments. We thank WE-EF for providing streetlights for this experiment. Thanks go to Owen McCormack for advice and procurement. We also thank Dr Ken Wishaw and Dr Kerstin Fritsches for advice and guidance. This assistance is gratefully acknowledged.
References
Aubé M, Roby J, Kocifaj M (2013) Evaluating potential spectral impacts of various artificial lights on melatonin suppression, photosynthesis, and star visibility. PLoS ONE 8(7), e67798.
| Crossref | Google Scholar | PubMed |
Aubé M, Simoneau A, Wainscoat R, Nelson L (2018) Modelling the effects of phosphor converted LED lighting to the night sky of the Haleakala Observatory, Hawaii. Monthly Notices of the Royal Astronomical Society 478(2), 1776-1783.
| Crossref | Google Scholar |
Berry M, Booth DT, Limpus CJ (2013) Artificial lighting and disrupted sea-finding behaviour in hatchling loggerhead turtles (Caretta caretta) on the Woongarra coast, south-east Queensland, Australia. Australian Journal of Zoology 61(2), 137-145.
| Crossref | Google Scholar |
Cruz LM, Shillinger GL, Robinson NJ, Tomillo PS, Paladino FV (2018) Effect of light intensity and wavelength on the in-water orientation of olive ridley turtle hatchlings. Journal of Experimental Marine Biology and Ecology 505, 52-56.
| Crossref | Google Scholar |
Dudley JM, Erkintalo M, Genty G (2015) Environment, wildlife and LED illumination. Optics and Photonics News 26(11), 42-47.
| Crossref | Google Scholar |
Falchi F, Cinzano P, Duriscoe D, Kyba CCM, Elvidge CD, Baugh K, Portnov BA, Rybnikova NA, Furgoni R (2016) The new world atlas of artificial night sky brightness. Science Advances 2(6), e1600377.
| Crossref | Google Scholar | PubMed |
FitzSimmons NN, Limpus CJ (2014) Marine turtle genetic stocks of the indo-pacific: identifying boundaries and knowledge gaps. Indian Ocean Turtle Newsletter 20, 1-18.
| Google Scholar |
Franz M, Wenzl FP (2017) Critical review on life cycle inventories and environmental assessments of LED-lamps. Critical Reviews in Environmental Science and Technology 47(21), 2017-2078.
| Crossref | Google Scholar |
Fritsches KA (2012) Australian loggerhead sea turtle hatchlings do not avoid yellow. Marine and Freshwater Behaviour and Physiology 45(2), 79-89.
| Crossref | Google Scholar |
Hölker F, Wolter C, Perkin EK, Tockner K (2010) Light pollution as a biodiversity threat. Trends in Ecology & Evolution 25(12), 681-682.
| Crossref | Google Scholar | PubMed |
Horch KW, Gocke JP, Salmon M, Forward RB (2008) Visual spectral sensitivity of hatchling loggerhead (Caretta caretta L.) and leatherback (Dermochelys coriacea L.) sea turtles, as determined by single-flash electroretinography. Marine and Freshwater Behaviour and Physiology 41(2), 107-119.
| Crossref | Google Scholar |
Kyba CCM, Kuester T, Sánchez de Miguel A, Baugh K, Jechow A, Hölker F, Bennie J, Elvidge CD, Gaston KJ, Gaunter L (2017) Artificially lit surface of Earth at night increasing in radiance and extent. Science Advances 3(11), e1701528.
| Crossref | Google Scholar | PubMed |
Levenson DH, Eckert SA, Crognale MA, Deegan JF, Jacobs GH (2004) Photopic spectral sensitivity of green and loggerhead sea turtles. Copeia 2004(4), 908-914.
| Crossref | Google Scholar |
Limpus C, Kamrowski RL (2013) Ocean-finding in marine turtles: the importance of low horizon elevation as an orientation cue. Behaviour 150, 863-893.
| Crossref | Google Scholar |
Limpus CJ, Parmenter CJ, Chaloupka M (2013) Monitoring of coastal sea turtles: gap analysis 1. Loggerhead turtles, caretta caretta, in the port curtis and port alma region. Report produced for the Ecosystem Research and Monitoring Program Advisory Panel as part of Gladstone Ports Corporation’s Ecosystem Research and Monitoring Program.
Long TM, Eldridge J, Hancock J, Hirama S, Kiltie R, Koperski M, Trindell RN (2022) Balancing human and sea turtle safety: evaluating long-wavelength streetlights as a coastal roadway management tool. Coastal Management 50(2), 184-196.
| Crossref | Google Scholar |
Longcore T, Aldern HL, Eggers JF, Flores S, Franco L, Hirshfield-Yamanishi E, Petrinec LN, Yan WA, Barroso AM (2015) Tuning the white light spectrum of light emitting diode lamps to reduce attraction of nocturnal arthropods. Philosophical Transactions of the Royal Society B: Biological Sciences 370, 20140125.
| Crossref | Google Scholar |
Mrosovsky N, Carr A (1967) Preference for light of short wavelengths in hatchling green sea turtles, Chelonia mydas, tested on their natural nesting beaches. Behaviour 28(3), 217-231.
| Crossref | Google Scholar |
Pawson SM, Bader MK-F (2014) LED lighting increases the ecological impact of light pollution irrespective of color temperature. Ecological Applications 24(7), 1561-1568.
| Crossref | Google Scholar | PubMed |
Robertson K, Booth DT, Limpus CJ (2016) An assessment of ‘turtle-friendly’ lights on the sea-finding behaviour of loggerhead turtle hatchlings (Caretta caretta). Wildlife Research 43(1), 27-37.
| Crossref | Google Scholar |
Salmon M, Witherington BE (1995) Artificial lighting and seafinding by loggerhead hatchlings: evidence for lunar modulation. Copeia 1995(4), 931-938.
| Crossref | Google Scholar |
Salmon M, Wyneken J, Fritz E, Lucas M (1992) Seafinding by hatchling sea turtles: role of brightness, silhouette and beach slope as orientation cues. Behaviour 122(1–2), 56-77.
| Crossref | Google Scholar |
Shimada T, Limpus CJ, FitzSimmons NN, Ferguson J, Limpus D, Spinks RK (2023) Sky glow disrupts the orientation of Australian flatback turtles Natator depressus on nesting beaches. Regional Environmental Change 23, 20.
| Crossref | Google Scholar |
Truscott Z, Booth DT, Limpus CJ (2017) The effect of on-shore light pollution on sea-turtle hatchlings commencing their off-shore swim. Wildlife Research 44(2), 127-134.
| Crossref | Google Scholar |
Witherington BE, Bjorndal KA (1991) Influences of wavelength and intensity on hatchling sea turtle phototaxis: implications for sea-finding behavior. Copeia 1991(4), 1060-1069.
| Crossref | Google Scholar |