

Size does matter: detectability of arboreal mammals using thermal cameras and spotlighting
George Madani A * and Leroy Gonsalves B
A
B
Abstract
Effective detection of arboreal mammals is crucial for accurate population assessments and ecological monitoring. Traditional spotlighting may not be optimal for detecting smaller species or in dense vegetation. Thermal imaging technology offers a potential alternative.
The aim of this study was to compare the effectiveness of thermal imaging cameras to spotlighting for detecting two arboreal mammals of contrasting size, Cercartetus nanus and Pseudocheirus peregrinus, in a coastal sandstone heath-mallee habitat. It also explored the influence of seasonal and environmental factors on detectability.
We conducted monthly surveys using both thermal imaging and spotlighting, recording a total of 353 mammal detections. We analysed the impact of survey method, season, and environmental conditions on detection probabilities in an occupancy modelling framework. Distance sampling was also used to estimate population densities.
Thermal imaging cameras were more effective than spotlighting for detecting C. nanus, with detection probabilities 3–5 times higher, especially in dense vegetation. Seasonal variations affected detection rates for C. nanus, with highest probabilities in winter (0.26 or 0.14 per visit with thermal imaging and spotlighting, respectively) and summer (0.25 or 0.11 per visit), correlating with the availability of key food resources. For P. peregrinus, detectability was similar using both methods and did not vary significantly with environmental conditions.
Thermal imaging significantly improved detection probabilities for C. nanus and has the potential to enhance detection for other small arboreal mammals, providing greater accuracy and efficiency compared to spotlighting.
Incorporating thermal imaging into standard survey protocols is recommended, especially for detecting small arboreal mammals. For C. nanus, surveys should be aligned with peak food resource availability to improve detectability. For all species and both survey methods examined, repeat visits should be undertaken at each site to calculate and account for imperfect detection that is associated with and differs between both methods. This approach improves the reliability of population estimates and supports more effective ecological monitoring.
Keywords: arboreal mammals, Cercartetus nanus, density estimates, detection probability, ecological monitoring, Pseudocheirus peregrinus, spotlighting, thermal imaging, wildlife monitoring.
Introduction
The implementation of effective survey techniques is crucial for enhancing detectability of study species to both accurately monitor population trends over time, as well as to identify and determine the occupancy and distribution of cryptic or elusive species (Marsh and Trenham 2008; Legge et al. 2018; Madani et al. 2023). Where necessary and applicable, methods may be invasive i.e. trapping for small terrestrial mammals, which is essential for determining accurate population estimates, fitting of biologgers and the collection of biological samples, morphometric measurements, and demography data (Sikes and Animal Care and Use Committee of the American Society of Mammalogists 2016).
Animal populations can also be monitored through less invasive methods, particularly if it removes the need to capture species that pose significant challenges, risk, and cost, as can be the case with large, aggressive, highly social, or arboreal mammals (Kauffman et al. 2007; Madani et al. 2020; Gracanin et al. 2022). Despite the merit and justification of trapping in ecological research, there is a shift away from this practice due to animal welfare concerns and its expense (Powell and Proulx 2003; Zemanova 2020; Hanson et al. 2023). Instead, advances in new and emerging non-invasive survey methodologies, such as eDNA sampling, pelage pattern recognition on camera traps, and bioacoustics arrays (Jackson et al. 2006; Fediajevaite et al. 2021; Law et al. 2022; Allen et al. 2023; Gonsalves et al. 2024), can still reliably inform occupancy and density. However, these approaches are not applicable for all species.
One of the most widely used survey methods for nocturnal arboreal mammals is spotlighting (Duckworth 1998; Lindenmayer et al. 2001; Wilmott et al. 2018). Spotlighting involves traversing a transect and shining a powerful light beam to detect the reflected eyeshine or body shape from an animal (Lindenmayer et al. 2001). Whilst a highly utilised, useful and less resource intensive technique than trapping, this method (like all methods) does have inherent limitations. Effective spotlighting is limited to roads and tracks, yields low statistical inferences from low density populations, is limited by observer skill and experience, is subject to overlooking target species where vegetation density is thick or enables concealment, and can result in animals hiding or fleeing from the light source upon approach (Duckworth 1998; Focardi et al. 2001; Lindenmayer et al. 2001; Goodenough et al. 2018). Spotlighting transects incorporating distance sampling can be used to infer density, but accurate results can be constrained by key assumptions, that if not met, can lead to biased estimates (Duckworth 1998; Focardi et al. 2001; Lindenmayer et al. 2001; Thomas et al. 2010; Crowther et al. 2021).
New advances in technology such as thermal imaging equipped drones and handheld infrared thermal imaging cameras can be more effective at detecting fauna than traditional spotlighting methods (Augusteyn et al. 2020; Vinson et al. 2020; Witt et al. 2020; Pocknee et al. 2021; Underwood et al. 2022). Thermal imaging cameras incorporate a sensor that is sensitive to the infrared radiation emitted by warm objects and endotherms to produce a visible heat signature on screen (Goodenough et al. 2018). Thermal cameras are not reliant on eyeshine, the animal facing the observer or movement to facilitate detections. Only a small portion of the subject needs to be visible to the sensor to detect a heat signature (Underwood et al. 2022). Thermal cameras can be used without any additional light source to detect their target. The benefit of moving more slowly, quietly and in the dark means disturbance of animals ahead of one’s advance can be significantly reduced, resulting in higher detection rates (Augusteyn et al. 2020). However, thermal detections in general can attenuate over distance, particularly when obscured by vegetation or when heat signatures are less apparent due to significant thermal inertia in the landscape reducing the contrast between endotherms and the background (Augusteyn et al. 2020; Vinson et al. 2020; Underwood et al. 2022).
The use of handheld thermal cameras to survey fauna is becoming increasingly common (Goodenough et al. 2018; Augusteyn et al. 2020; Vinson et al. 2020; McGregor et al. 2022; Underwood et al. 2022). Many of these studies have focused on large, obvious species which are easy to detect and identify in much more open environments of the arid zone where line of sight is far less constrained (Goodenough et al. 2018; Augusteyn et al. 2020; Vinson et al. 2020; McGregor et al. 2022; Underwood et al. 2022). The use of thermal technology for detecting small arboreal mammals (below 30 g) has been limited (but see Underwood et al. 2022).
Coastal sandstone heath-mallee and exposed sandstone woodland are two plant community types that contain greater structural complexity than vegetation in the arid zone. These community types can be dominated by dense heath that occurs below a eucalypt canopy. A range of mammals are known to occur in these community types, including the eastern pygmy possum, Cercartetus nanus, and common ringtail possum, Pseudocheirus peregrinus: two species that contrast in size, which can influence detectability.
Cercartetus nanus is a small semi-arboreal marsupial that occupies heathy woodlands, sclerophyll forest and temperate rainforest across south-eastern Australia (Bowen and Goldingay 1999; Ward and Goldingay 2023). Whilst not uncommon, estimating population size is very difficult for the species, and densities can vary between 0.1 and 6.3 animals per hectare (ha) depending on habitat type (Goldingay and Keohan 2017). Cercartetus nanus can be infrequently detected from trapping and other survey methods, including spotlighting, predator scat analysis, Elliott (box) trapping, pitfall trapping, hair tube sampling, nest boxes and camera traps (Bowen and Goldingay 1999; Harris and Goldingay 2005; Harris et al. 2007; Rueegger et al. 2012).
Pseudocheirus peregrinus is a moderately sized arboreal possum with a predominantly folivorous diet composed mostly of myrtaceous species (Moore et al. 2004). Their distribution encompasses most Eucalyptus dominated woodland and forest throughout the east coast of Australia (Jackson 2023). Considered common, they have relatively small home range sizes (0.2–1.0 ha) and occur at varying densities (1–14 per ha but more commonly 3 per ha) depending upon food availability, nesting sites, predation and connectivity (Thomson and Owen 1964; How et al. 1984; Augee et al. 1996; Smith et al. 2003; Lindenmayer et al. 2008; Kerle et al. 2013). They have highly visible eyeshine which enhances detectability although vegetation density can impact detection rates as the species commonly sits in dense foliage to digest following an initial foraging period (Wintle et al. 2005). Most survey effort is focused on detection through spotlighting rather than through trapping programs (Wintle et al. 2005).
Thermal cameras may offer a novel opportunity to enhance detectability for both species, while also minimising disturbance that can occur using other survey methods, such as spotlighting, and can impact some downstream analyses (e.g. distance sampling). Here, we test the efficacy of handheld infrared thermal imaging cameras to detect both species and compare the technique to spotlighting. We opted to compare spotlighting to infrared thermal surveys for several reasons. Despite spotlighting for C. nanus proving to be an unsuccessful method in previous studies (Davey 1990; Harris and Goldingay 2005), this was prior to the advent of new and improved lighting technology (head mounted LED as opposed to handheld halogen torches) and detectability by spotlighting for many nocturnal species has increased substantially since then (Lardner et al. 2007, 2015). Furthermore, spotlighting and thermal searching are directly comparable as these involve the same methodology (active scanning along a transect).
We also assess factors that influence detectability such as weather conditions, flowering phenology, and moon luminosity. We predict that thermal cameras are likely to be a more effective technique relative to spotlighting for detecting the presence of the smaller C. nanus, whereas we predict differences in detectability between methods for the larger P. peregrinus will be less apparent given eyeshine from a larger species is likely to be more obvious for detection. We also utilise detections from the method with greatest detection probability to estimate population density for both species using distance sampling.
Methods
Study site
The study was conducted in Dharawal National Park, 50 km south of Sydney in the south-eastern region of New South Wales, Australia. Survey transects were conducted on foot upon three established walking and vehicle tracks. The two dominant plant community types (PCT) were Coastal sandstone heath-mallee (PCT 1824) and Sydney south exposed sandstone woodland (PCT 1777) both of which have a predominance of tall and dense heath-leaved banksia (Banksia ericifolia) and old-man banksia (Banksia serrata) understories and include a highly diverse understory and shrub layer combination of other banksias, tea-trees (Leptospermum), Hakeas, wattles (Acacia), Grevilleas, peas (Fabaceae) and geebungs (Persoonia) (DCCEEW 2023). Both PCTs at the site were below a Eucalypt canopy dominated by Silvertop Ash (Eucalyptus sieberi), Sydney Peppermint (E. piperita), Scribbly Gum (E. haemastoma/racemosa) and Red Bloodwood (Corymbia gummifera).
Survey design
A suitable transect length (to ensure spatial independence) was determined based on the radius of a circular home range as per the justification of Goldingay and Keohan (2017). Law et al. (2013) provided comprehensive home range estimates for C. nanus of 3–4 hectares. A 3.1 ha circular home range corresponds to a 100 m radius. Accordingly, we utilised 100 m long transects in our study. Number of consecutive transects per track varied from 4 to 10.
Surveys were conducted monthly throughout 2022 for a minimum of two consecutive nights per month. Timing of the surveys was stratified to account for variation in moon phase and weather conditions. All transects per individual track were surveyed with either a spotlight or a thermal camera but not both methods within a single night. The methodology was alternated on the subsequent evening, with each method applied to all transects within a two-night window to minimise any significant variation caused by weather conditions and moon luminosity. Surveys were not conducted in very high wind (>20 km/h) or during heavy rain.
Surveys commenced no earlier than half an hour after civil twilight, ensuring that all surveys occurred within the first half of the night. A consistent walking pace of 2 kilometres per hour, approximating 3 min per 100 metres of the transect, was maintained for both survey methods. The search area extended to a maximum of 50 metres on either side of the transect line where vegetation density allowed, and any observations exceeding this distance were not included in the analysis. The distance of all observations from the centre line of the transect was measured using a Kogan 800 m Laser Rangefinder.
For spotlighting, a LedLenser H14.R.2 head torch was used, and thermal surveys were conducted using a handheld InfRec Thermo Gear G100EX thermal camera which has a built-in screen. Minimum temperature settings on the thermal camera were adjusted between surveys to exceed the vegetation background temperature to enhance increased distinguishability of endotherms from the surrounding environment (Vinson et al. 2020). All thermal detections were verified by briefly illuminating the detected animal with the head torch. Co-occurring arboreal mammals included the brown antechinus, Antechinus stuartii, Krefft’s glider, Petaurus notatus and common brushtail possum, Trichosurus vulpecula.
Probability of detection modelling
A single season occupancy modelling framework (MacKenzie et al. 2002) was used to assess the influence of a range of covariates on nightly detection probability for C. nanus and P. peregrinus. Covariates included the sampling method used (spotlighting vs thermal camera surveys), survey-specific covariates (minimum temperature, rainfall, wind speed, cloud cover and moon phase) and the season in which surveys were carried out. A null model which held detection constant was also assessed.
Modelling was undertaken in a staged approach, whereby single covariates were first assessed. The top single covariate model (n) was then built upon by including an additional covariate in a 2-covariate additive or interactive model. If a 2-covariate model (n + 1) improved on the AIC score of model n by >2 AIC points, it was retained and carried forward in further modelling that included additional covariates (i.e. a 3-covariate model and so on). This process was continued until the addition of an extra covariate did not improve the AIC score by >2 AIC points.
Prior to analysis, covariates were standardised and examined for collinearity. All covariates were initially included in the models, but if any highly correlated (r > 0.7) variables appeared in the same model only one covariate was retained, and the model was re-run. Modelling and model selection were carried out in program R using the RPresence package (MacKenzie and Hines 2021).
Supported candidate models for detection probability were model-averaged to provide estimates of detection probability. Supported models were those that were within 2 AIC points of the top model for detection.
An assessment of model fit was undertaken for the top model using a goodness of fit test (MacKenzie and Bailey 2004) with 10,000 bootstraps using the ‘modfitboot’ argument in the occMod function in RPresence.
Distance sampling
To estimate the density of C. nanus and P. peregrinus in the study area, perpendicular distances recorded for each detected animal was used in a distance sampling framework (Buckland et al. 1993, 2004). These distances were used to fit a model for the detection function and to correct for imperfect detection. Half-normal key with no adjustment term and hazard rate key with cosine and Hermite polynomial adjustment terms were used in modelling. The best performing detection function was identified using model selection and the AIC score of each model. Since abundance of C. nanus is known to vary among seasons (Harris and Goldingay 2005; Goldingay 2023), density was estimated separately for each season and the same approach was carried out for P. peregrinus. Distance sampling was undertaken in R using the ‘Distance’ package. Models fitted for the detection function included the same covariates that were used to assess detection probability in the occupancy framework.
Results
In all, 353 mammal detections were recorded during 26 surveys (Table 1). Thermal camera surveys resulted in 228 detections, whereas spotlight surveys yielded 125 detections. Pseudocheirus peregrinus was most commonly detected (153 detections), followed by C. nanus (86). Other detections included P. notatus (13), A. stuartii (6), T. vulpecula (6), grey-headed flying-fox, Pteropus poliocephalus (3) and a single detection of a long-nosed bandicoot, Perameles nasuta and a Rattus sp. All other detections represented sleeping roosting birds (84). The mean perpendicular distance for detections of all species using thermal surveys (mean = 10.1 m, range = 6–17 m) was greater than or comparable to spotlight surveys (mean = 7.3 m, range = 0–17 m) (Table 1). Smaller species (i.e. A. stuartii, C. nanus and P. notatus), could be detected further away using thermal surveys (mean = 7.7 m, range = 6–10 m) compared to spotlighting (mean = 4.3 m, range = 2–6 m), whereas this difference was reduced or not evident for other, larger species (thermal survey: mean = 11.6 m, range = 7–17 m; spotlighting: mean = 9 m, range = 0–17 m) (Table 1). This corresponded to 3.5 times more detections for smaller species using thermal surveys (mean = 27.3 detections, range = 5–66 detections) compared to spotlighting (mean = 7.7 detections, range = 1–20 detections) (Table 1).
| Species | No. of detections | Distance (m) (mean ± s.e.) | |||
|---|---|---|---|---|---|
| Spotlight | Thermal | Spotlight | Thermal | ||
| Antechinus stuartii | 1 | 5 | 2 ± 0 | 7 ± 1 | |
| Cercartetus nanus | 20 | 66 | 6 ± 1 | 6 ± 1 | |
| Perameles nasuta | 1 | 0 | 0 ± 0 | NA | |
| Petaurus notatus | 2 | 11 | 5 ± 0 | 10 ± 3 | |
| Pseudocheirus peregrinus | 80 | 73 | 11 ± 1 | 10 ± 1 | |
| Pteropus poliocephalus | 1 | 2 | 17 ± 3 | 14 ± 2 | |
| Rattus spp. | 0 | 1 | NA | 17 ± 0 | |
| Trichosurus vulpecula | 3 | 3 | 8 ± 2 | 10 ± 2 | |
| Unknown/other | 16 | 68 | 9 ± 2 | 7 ± 1 | |
Detections for the two focal species of this study were most common on Banksia ericifolia, with 50–53% occurring on this species. Cercartetus nanus was also commonly detected on B. serrata, Hakea sp., Lambertia formosa and Leptospermum sp., whereas P. peregrinus was also commonly detected on B. serrata, Eucalyptus haemastoma/racemosa, E. sieberi and Leptospermum sp. (Table 2).
| Species | No. of detection by tree species or on ground | ||||||||||||||
|---|---|---|---|---|---|---|---|---|---|---|---|---|---|---|---|
| Allocasuarina sp. | Banksia oblongifolia | Banksia ericifolia | Banksia serrata | Corymbia gummifera | Doryanthes excelsa | Eucalyptus haemastoma | Eucalyptus sieberi | Hakea sp. | Lambertia formosa | Leptospermum sp. | Petrophile sp. | On ground | Unknown/ other | ||
| Antechinus stuartii | 0 | 0 | 3 | 0 | 1 | 0 | 0 | 1 | 0 | 0 | 0 | 0 | 0 | 0 | |
| Cercartetus nanus | 0 | 1 | 46 | 8 | 1 | 0 | 0 | 1 | 5 | 7 | 4 | 1 | 2 | 10 | |
| Perameles nasuta | 0 | 0 | 0 | 0 | 0 | 0 | 0 | 0 | 0 | 0 | 0 | 0 | 1 | 0 | |
| Petaurus notatus | 1 | 0 | 3 | 1 | 3 | 0 | 1 | 1 | 0 | 0 | 0 | 0 | 0 | 2 | |
| Pseudocheirus peregrinus | 1 | 0 | 59 | 8 | 1 | 0 | 13 | 15 | 2 | 0 | 13 | 0 | 0 | 7 | |
| Pteropus poliocephalus | 0 | 0 | 0 | 1 | 0 | 0 | 0 | 0 | 0 | 0 | 0 | 0 | 0 | 0 | |
| Rattus spp. | 0 | 0 | 1 | 0 | 0 | 0 | 0 | 0 | 0 | 0 | 0 | 0 | 0 | 0 | |
| Trichosurus vulpecula | 0 | 0 | 0 | 1 | 0 | 0 | 1 | 2 | 0 | 0 | 0 | 0 | 0 | 1 | |
| Unknown/other | 0 | 1 | 6 | 3 | 1 | 1 | 2 | 1 | 3 | 2 | 6 | 0 | 9 | 11 | |
Detection probability modelling
In all, 30 models assessed detection probability for C. nanus (Table 3). Two models had support, both of which allowed detection probability to vary with season of survey and either an additive or interactive effect of sampling method. The former had >2-times the weight of the latter. Other variables, including moon phase, rainfall, wind speed, minimum nightly temperature and cloud cover were not associated with detection probability for C. nanus.
| No. of variables | Model | dAIC | Weight | npar | neg2ll | |
|---|---|---|---|---|---|---|
| Single covariate | psi(.),p(Season) | 0 | 0.9021 | 5 | 202.92 | |
| psi(.),p(Method) | 5.49 | 0.058 | 3 | 212.41 | ||
| psi(.),p(Rain) | 7.66 | 0.0196 | 3 | 214.59 | ||
| psi(.),p(.) | 9.72 | 0.007 | 2 | 218.65 | ||
| psi(.),p(Moon) | 10.85 | 0.004 | 3 | 217.78 | ||
| psi(.),p(Wind) | 11.35 | 0.0031 | 3 | 218.27 | ||
| psi(.),p(Cloud) | 11.54 | 0.0028 | 3 | 218.47 | ||
| psi(.),p(MinTemp) | 11.55 | 0.0028 | 3 | 218.47 | ||
| psi(.),p(Moon*Cloud) | 14.51 | 0.0006 | 5 | 217.43 | ||
| Two-covariate | psi(.),p(Season+Method) | 0 | 0.439 | 6 | 196.64 | |
| psi(.),p(Season*Method) | 1.51 | 0.207 | 7 | 196.14 | ||
| psi(.),p(Season+Rain) | 4.03 | 0.059 | 6 | 200.66 | ||
| psi(.),p(Season) | 4.29 | 0.051 | 5 | 202.92 | ||
| psi(.),p(Season+Moon) | 4.76 | 0.041 | 6 | 201.4 | ||
| psi(.),p(Season+MinTemp) | 4.93 | 0.037 | 6 | 201.57 | ||
| psi(.),p(Season*Wind) | 5.32 | 0.031 | 7 | 199.96 | ||
| psi(.),p(Season*Cloud) | 5.45 | 0.029 | 7 | 200.09 | ||
| psi(.),p(Season*MinTemp) | 5.64 | 0.026 | 7 | 200.28 | ||
| psi(.),p(Season+Wind) | 5.74 | 0.025 | 6 | 202.38 | ||
| psi(.),p(Season*Rain) | 6.02 | 0.022 | 7 | 200.66 | ||
| psi(.),p(Season+Cloud) | 6.28 | 0.019 | 6 | 202.91 | ||
| psi(.),p(Season*Moon) | 6.7 | 0.015 | 7 | 201.34 |
Shaded models had support.
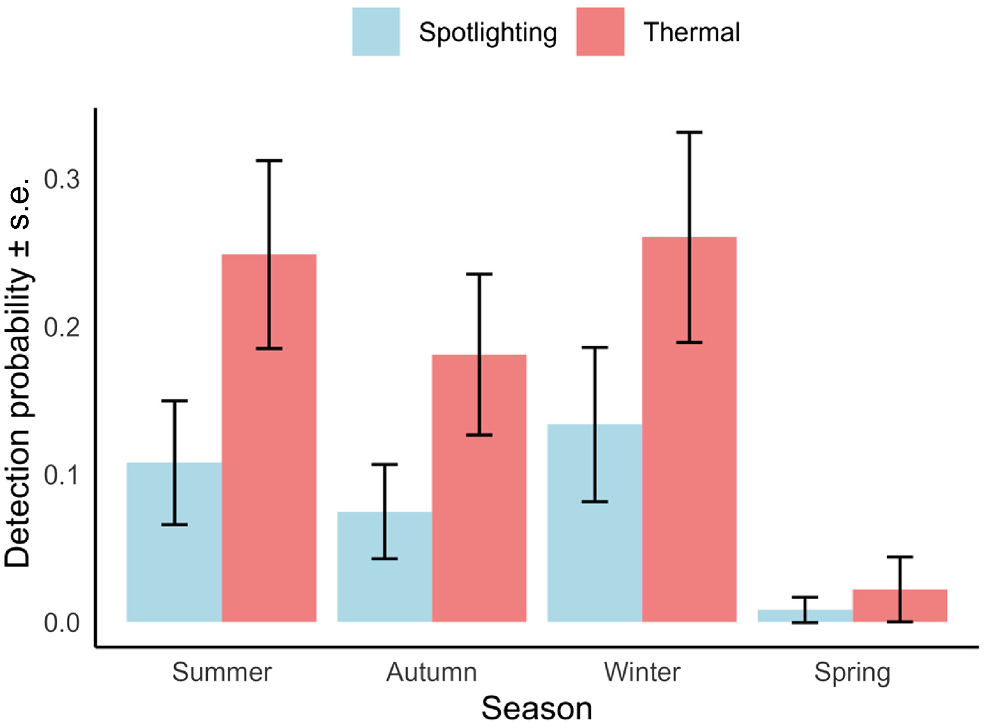
Detection probability was lowest in spring (spotlight: 0.01 ± 0.01; thermal: 0.02 ± 0.02) and autumn (spotlight: 0.07 ± 0.03; thermal: 0.18 ± 0.05) and highest in winter (spotlight: 0.14 ± 0.05; thermal: 0.26 ± 0.07) and summer (spotlight: 0.11 ± 0.04; thermal: 0.25 ± 0.06) and at least 2-times greater using thermal camera surveys compared to spotlighting (Fig. 1).
Detection probability of Cercartetus nanus among seasons and sampling methods. Detection probability was lowest in spring followed by autumn, summer and winter and at least two-times greater using thermal camera surveys compared to spotlighting.
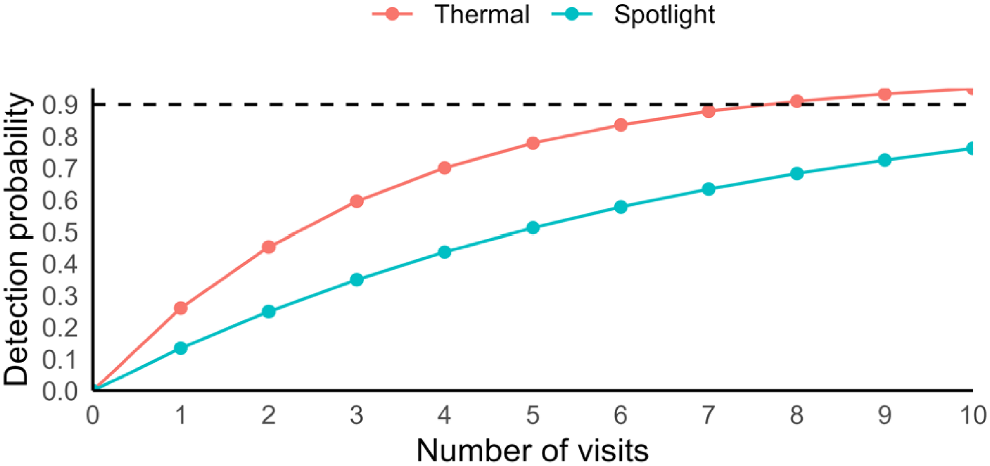
Sampling effort required to be 90% confident of detecting C. nanus at an occupied site was substantial irrespective of sampling method (8 visits and 17 visits for thermal camera surveys and spotlighting, respectively; Fig. 2).
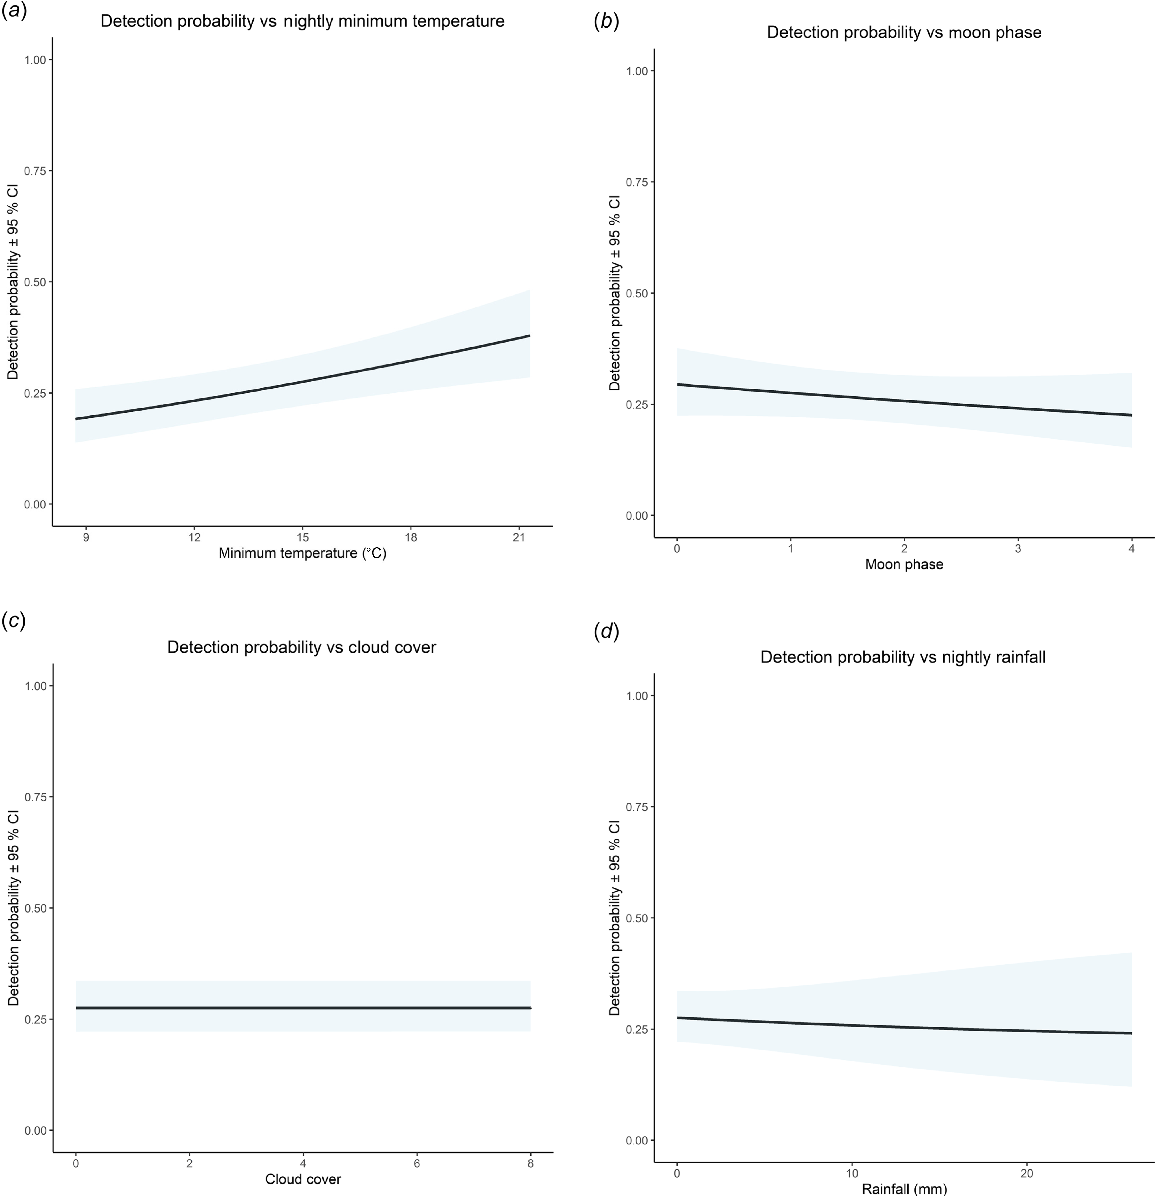
In all, 30 models assessed detection probability for P. peregrinus (Table 4). Four models had support all of which allowed detection probability to vary with minimum nightly temperature (+ve) and weak additive or interactive associations with moon phase (−ve), cloud cover (+ve) and nightly rainfall (−ve) (Fig. 3). Wind, season of sampling and method of survey did not influence detection probability. Under median conditions, detection probability was 0.27 ± 0.03.
| No. of variables | Model | dAIC | Weight | npar | neg2ll | |
|---|---|---|---|---|---|---|
| Single covariate | psi(.),p(MinTemp) | 0 | 0.267 | 3 | 313.55 | |
| psi(.),p(Cloud) | 0.11 | 0.253 | 3 | 313.66 | ||
| psi(.),p(Moon*Cloud) | 0.61 | 0.197 | 5 | 310.16 | ||
| psi(.),p(.) | 2.12 | 0.093 | 2 | 317.67 | ||
| psi(.),p(Wind) | 3.54 | 0.045 | 3 | 317.1 | ||
| psi(.),p(Moon) | 3.55 | 0.045 | 3 | 317.1 | ||
| psi(.),p(Rain) | 3.55 | 0.045 | 3 | 317.1 | ||
| psi(.),p(Thermal) | 3.69 | 0.042 | 3 | 317.25 | ||
| psi(.),p(Season) | 6.06 | 0.013 | 5 | 315.61 | ||
| Two-covariate | psi(.),p(MinTemp+Moon) | 0 | 0.28 | 4 | 309.23 | |
| psi(.),p(MinTemp+Cloud) | 1.4 | 0.139 | 4 | 310.63 | ||
| psi(.),p(MinTemp+Rain) | 1.55 | 0.129 | 4 | 310.79 | ||
| psi(.),p(MinTemp*Moon) | 1.87 | 0.11 | 5 | 309.1 | ||
| psi(.),p(MinTemp) | 2.32 | 0.088 | 3 | 313.55 | ||
| psi(.),p(MinTemp*Cloud) | 2.72 | 0.072 | 5 | 309.95 | ||
| psi(.),p(MinTemp*Rain) | 3.54 | 0.048 | 5 | 310.77 | ||
| psi(.),p(MinTemp+Method) | 3.78 | 0.042 | 4 | 313.01 | ||
| psi(.),p(MinTemp+Wind) | 4.23 | 0.034 | 4 | 313.46 | ||
| psi(.),p(MinTemp*Method) | 4.69 | 0.027 | 5 | 311.92 | ||
| psi(.),p(MinTemp*Wind) | 6.15 | 0.013 | 5 | 313.38 | ||
| psi(.),p(MinTemp+Season) | 6.19 | 0.013 | 6 | 311.43 | ||
| psi(.),p(MinTemp*Season) | 8.04 | 0.005 | 7 | 311.27 |
Shaded models had support.
Detection probability against (a) minimum nightly temperature; (b) moon phase; (c) cloud cover; and (d) nightly rainfall.
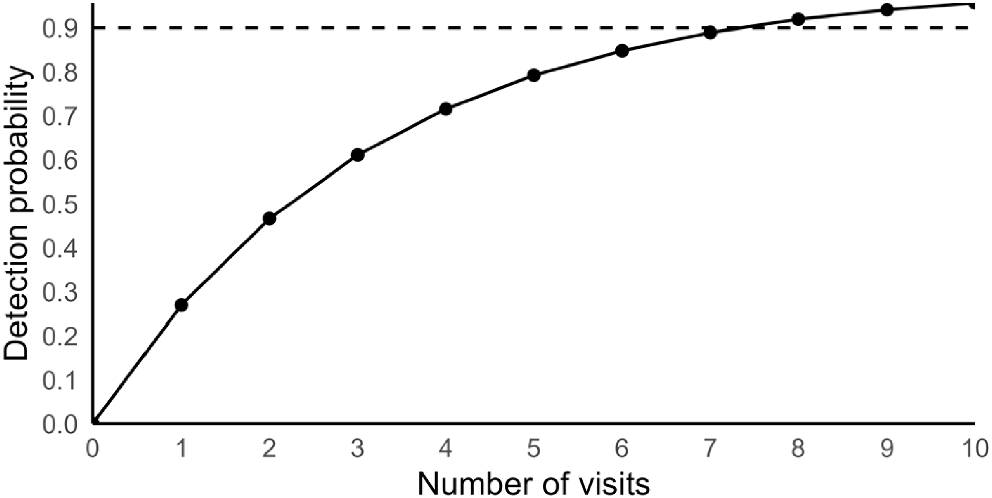
Sampling effort required to be 90% confident of detecting P. peregrinus at an occupied site was eight visits irrespective of survey method used (Fig. 4).
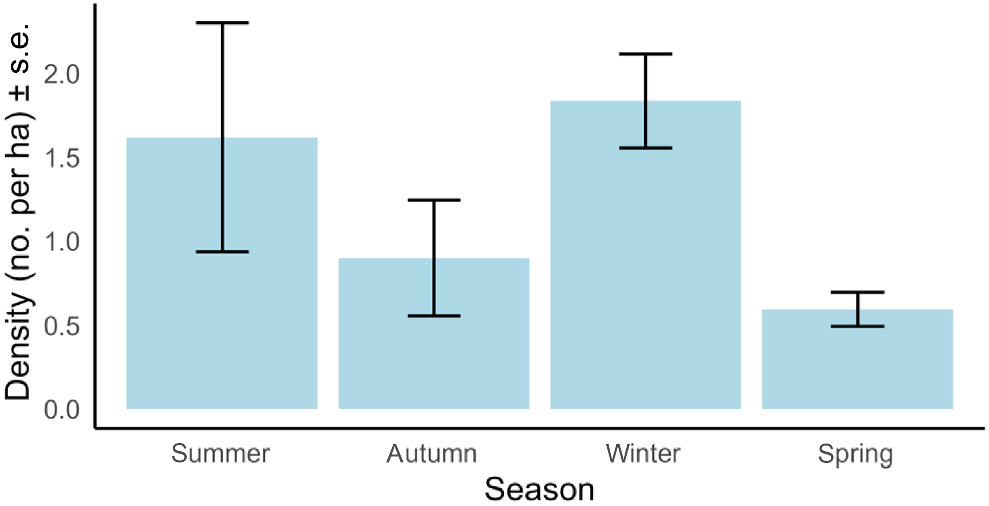
On average among seasons, density of C. nanus was 1.2 individuals per ha. However, density of C. nanus varied among seasons, with density in winter three times higher than spring, but similar to summer, which was highly variable (Fig. 5). Density of C. nanus in autumn was intermediate relative to spring and summer (Fig. 5).
Density of Cercartetus nanus in the Darkes Forest study area using thermal camera detections and distance sampling, against the season of sampling. Density was greatest in winter and summer.
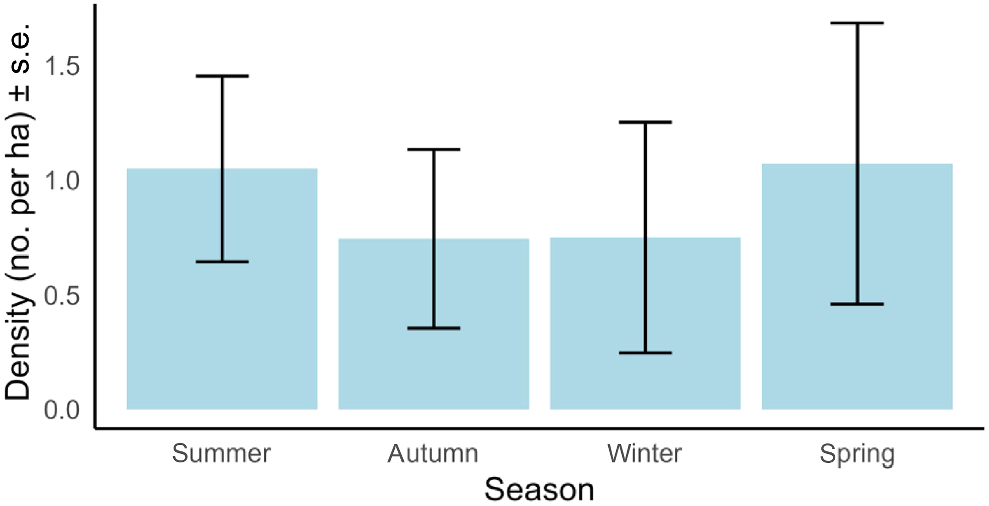
Pseudocheirus peregrinus density on average was 0.9 individuals per ha. Density was highest in spring and summer and showed a trend of being lower in autumn and winter but estimates for the latter two seasons were within the bounds of uncertainty of estimates for spring and summer, suggesting density did not differ among seasons in our study area (Fig. 6).
Discussion
Our results confirmed the hypotheses that thermal cameras would be more effective than spotlighting at detecting the smaller target C. nanus, yet yield no difference in detectability for the larger P. peregrinus. Furthermore, the raw number of detections for smaller species was 3–5-times greater than for larger species observed in this study. The results for C. nanus complemented other studies that demonstrated the greater effectiveness of thermal cameras compared to spotlighting for increasing detectability (Augusteyn et al. 2020; Vinson et al. 2020; Witt et al. 2020; Pocknee et al. 2021; Underwood et al. 2022). Cercartetus nanus detection probability with thermal imaging was at least twice as high as spotlighting in all seasons and regardless of moon phase or weather conditions. Suggested explanations for the differing detectability patterns observed in both species, including why the results for P. peregrinus contrasted with findings from other studies on morphologically and ecologically similar species are discussed below (Vinson et al. 2020; Underwood et al. 2022).
The influence of environmental conditions, season and survey method on detectability
Moon brightness and increased luminosity is known to negatively influence the behaviour and activity of many nocturnal mammal species, largely due to perceived increase in predation risk (Penteriani et al. 2013; Linley et al. 2020). This was highlighted as a weak but significant relationship between moon phase and detectability for P. peregrinus. Known predators of P. peregrinus present at the study site included a resident powerful owl (Ninox strenua) and foxes (Vulpes vulpes) both of which were observed opportunistically on several occasions. Whilst C. nanus is vulnerable to predation (Law et al. 2013), brighter moon phase or increased luminosity due to decreased or absent cloud cover did not reduce detectability of C. nanus. Pygmy possums may be less susceptible to predation where denser vegetation provides increased protection and shelter (Senior et al. 2021). In ecosystems with reduced predation risk, mammals may alter their behaviour to maximise foraging, particularly for high yield nectar rich food such as Banksia inflorescences (Verdolin 2006; Linley et al. 2020).
The greatest determinant of detectability for C. nanus was season. Winter and summer exhibited the highest detection probabilities (0.11–0.14 or 0.25–0.26 depending on the survey method used). The strong seasonality in detection probability can be attributed to the seasonal availability of key food resources, specifically, the inflorescences of B. ericifolia during winter and B. serrata during summer, as has been found in other similar habitat-based studies (Harris and Goldingay 2005; Goldingay 2023). In our study, ~65% of detections for C. nanus occurred on B. ericifolia or B. serrata.
The autumn/winter breeding season of C. nanus also coincides with the mass flowering of its primary food resource B. ericifolia (Goldingay and Rueegger 2018). The increased availability of nectar meets the higher energy demands of lactation and replenishes energy reserves depleted by winter torpor and hibernation bouts in preparation for the lean spring (Turner 1985). Our findings align with other studies that found spring to be a period of low activity, linked to reduced food availability, low survival or possible migration away from depleted food reserves (Bladon et al. 2002; Harris et al. 2014; Goldingay 2023).
Some studies report challenges in detecting C. nanus during winter because of their tendency to undergo torpor (Turner 1985; Harris et al. 2007). We did not detect an association between detectability and minimum nightly temperature, even during winter. The main influence of temperature on detectability is that high ambient temperatures can constrain the efficacy of thermal cameras (Vinson et al. 2020). In order to better distinguish an animal’s heat signature from its surrounding environment, a large temperature difference is required (McGregor et al. 2022; Pocknee et al. 2021; Underwood et al. 2022). Consequently, many studies recommend surveying later in the night, during cooler seasons or before sunrise to maximise potential detections (Dymond et al. 2000; Augusteyn et al. 2020; Vinson et al. 2020; Pocknee et al. 2021; Underwood et al. 2022).
No influence of seasonality on detectability was observed for P. peregrinus. In contrast to C. nanus, their folivorous diet means that their foraging period is not constrained to the phenology of flowering resources (Banksia spp. at our study site), with their food source remaining available year-round. A weak positive association between detectability and minimum nightly temperature was found for P. peregrinus. As a species unable to express torpor it may be energetically inefficient to emerge on colder nights as increased convective heat loss can increase the energy costs required to maintain homeothermy (Dawson 1989; Geiser and Körtner 2010). Other possum species will defer emergence from their dreys or hollows on cold nights to forage before dawn; tropical possum species remain largely inactive for much of the night when temperatures fall to around 15°C (Russell 1980; Dickman and Calver 2023). The breeding cycle of C. nanus is supported by energy rich nectar to satisfy the energetic demands of pregnancy and lactation. Consequently, there is more nutritional incentive to forage in colder temperatures as opposed to P. peregrinus whose reproductive season is not constrained by any cycle of their folivorous diet.
In contrast to other studies, P. peregrinus was equally detectable with thermal cameras and spotlighting. There may be several contributing factors to this including the habitat structure of the study site. Coastal sandstone heath-mallee and exposed sandstone woodland grow on infertile, shallow, and moderately damp soils, resulting in more open habitat structures with lower and less extensive forest canopies. This openness within these plant communities makes it easier to detect arboreal mammals. Furthermore, P. peregrinus has a low activity rate, bright eyeshine and propensity to face observers whilst remaining motionless (Roberts et al. 1990; Wintle et al. 2005).
Previous thermal studies on Australian arboreal mammals have primarily focused on medium to larger species (Vinson et al. 2020; Witt et al. 2020; Pocknee et al. 2021; Underwood et al. 2022). Whilst there is no need to detect eyeshine with a thermal camera and only a small portion of any part of the body needs to be detected by the sensor, smaller body size has been suggested as having a negative influence on detection rates as smaller species may be more readily concealed by vegetation (Vinson et al. 2020; Underwood et al. 2022). Underwood et al. (2022) detected a small number (5) of Long-tailed pygmy possum (Cercartetus caudatus) in dense rainforest, with all sightings below 10 m in height and in a relatively open understorey, suggesting individuals higher in the canopy may have been missed. Similarly, all our observations of C. nanus were below the maximum height of the understorey (7 m) and ground layer with none detected in the canopy. Height may be a limitation for detectability with thermal cameras, as heat signature strength attenuates with distance and image resolution declines against the backdrop of the sky.
All thermal detections did require validation by shining a spotlight on the identified target. The small size of C. nanus meant that their thermal signature was not always readily discernible from small sleeping birds or other small mammals such as antechinus. The dense heath vegetation did make validation difficult even with a spotlight but a built-in laser pointer on the thermal camera helped pinpoint exactly where to look.
Thermal cameras enhance detectability as only a small part of the animal’s heat signature needs to be seen, and detection is not reliant on eyeshine (Underwood et al. 2022). Spotlighting can disturb animals and cause them to freeze or retreat into shelter ahead of the observer, whilst in comparison, thermal cameras cause less disturbance allowing animals to behave normally for longer (Goodenough et al. 2018; Augusteyn et al. 2020). A thermal signature is significantly easier to see compared to dull or obscure eyeshine and thus requires less training with detection and is less constrained by observer skill and experience. Pocknee et al. (2021) found no effect of observer experience on detectability when using thermal technology whilst others have shown inter-observer reliability and skill level to be a limitation with spotlighting surveys (Goldingay and Sharpe 2004; Wayne et al. 2005; Schmidt et al. 2023). Thermal technology may mitigate any potential influence of observer bias on detectability compared to spotlight surveys (Pocknee et al. 2021).
This study demonstrates that while the open habitat structure provides similar levels of detectability for the larger P. peregrinus with both thermal cameras and spotlighting, thermal cameras show greater utility for detecting smaller animals like C. nanus, even in dense vegetation. Despite the advantages of thermal cameras, a substantial survey effort is still required to achieve a high (>90%) confidence of detection. Alternative approaches used to survey both species (e.g. nestbox surveys, baited camera trapping, etc.) should be examined in future work to assess whether these can reduce the survey effort required. This has been demonstrated for a range of vocalising arboreal mammals, birds and bats using acoustic surveys compared to traditional methods (Gonsalves et al. 2024).
Density estimates
Population density is a commonly used metric in monitoring programs for fauna, particularly at local scales given it can be challenging to estimate accurately across broader areas (Krebs et al. 2011). In our study, the density of C. nanus ranged from 0.6–1.8 animals per ha depending on the season, with lowest density estimated in spring when density is known to decline following the cessation of Banksia flowering and potential local migration (Harris et al. 2014). These estimates are substantially lower than other estimates reported for the species – e.g. 14–20 animals per ha (Turner 1985), 2.5–7 animals per ha (Laidlaw and Wilson 1996; Bladon et al. 2002; Harris et al. 2014). However, when effective sampling area was considered (i.e. beyond the boundary of sampling locations given animals can move beyond these areas), Goldingay and Keohan (2017) reported densities in the range of 1.5–4.2 animals per ha in nearby coastal sandstone plateau heath with small areas of coastal sandstone ridgetop woodland. For the larger P. peregrinus, we estimated a density of 0.74–1.1 animals per ha. This level of density was again lower than estimates reported elsewhere e.g. 3–4 animals per ha (Thomson and Owen 1964; Augee et al. 1996), albeit in different vegetation types. It is unclear whether estimates from these studies consider effective sampling area and the influence of this on the reported density estimates. Nevertheless, density of P. peregrinus did not appear to vary among seasons like C. nanus.
Recommendations for survey of C. nanus and P. peregrinus
To maximise probability of detection, we recommend future survey efforts for C. nanus to coincide with peak flowering times for food plants of the local setting. Our results indicate that weather variables and moon phase do not negatively influence the activity of C. nanus and consequently surveys can be conducted in most conditions outside of heavy rain or strong wind that were not sampled in our study. Given the higher detection probability using thermal camera surveys relative to spotlighting for smaller fauna, such as C. nanus, and the fact that detection probability for larger fauna, such as P. peregrinus was not influenced by survey method, we recommend the use of thermal camera surveys instead of spotlighting for surveys targeting fauna that comprises a broad range of sizes. At least eight visits were needed to achieve >90% probability of detection at occupied sites for both species examined in this study. Detection probability for other survey methods (e.g. nestbox surveys, camera trapping using natural or artificial baits) should also be assessed to identify whether more effective survey methods can be employed. Irrespective of the survey method that is used, we acknowledge that imperfect detection is an important consideration when making inferences about detections/non-detections. As such, surveys should comprise temporal repeats (≥3) that allow detection probability to be accounted for using occupancy or abundance modelling approaches with a detection component. When such approaches are not possible, the achieved level of detection probability from surveys should be calculated and reported along with detection/non-detection results.
Conclusion
This study has demonstrated the utility of thermal imaging cameras as a more effective method for detecting C. nanus when compared to traditional spotlighting. Thermal imaging consistently yielded higher detection probabilities, especially in dense vegetation and across varying environmental conditions, providing a substantial increase in detection rates and thus supporting its use as a survey method. These results suggest that thermal imaging may also be applicable in improving detectability for other small arboreal mammals such as feathertail gliders (Acrobates spp). Incorporating thermal technology into standard survey protocols while considering seasonal and environmental factors, and incorporating repeated surveys to measure and account for detection probabilities, can help to improve the accuracy of population estimates and provide greater reliability for the outcomes of ecological monitoring.
Acknowledgements
We would like to thank Dr Chad Beranek for insightful discussions regarding survey design and Dr Brad Law for helpful comments on earlier drafts of the manuscript.
References
Allen MC, Kwait R, Vastano A, Kisurin A, Zoccolo I, Jaffe BD, Angle JC, Maslo B, Lockwood JL (2023) Sampling environmental DNA from trees and soil to detect cryptic arboreal mammals. Scientific Reports 13(1), 180.
| Crossref | Google Scholar | PubMed |
Augee ML, Smith B, Rose S (1996) Survival of wild and hand-reared ringtail possums (Pseudocheirus peregrinus) in bushland near Sydney. Wildlife Research 23(1), 99-108.
| Crossref | Google Scholar |
Augusteyn J, Pople A, Rich M (2020) Evaluating the use of thermal imaging cameras to monitor the endangered greater bilby at Astrebla Downs National Park. Australian Mammalogy 42(3), 329-340.
| Crossref | Google Scholar |
Bladon RV, Dickman CR, Hume ID (2002) Effects of habitat fragmentation on the demography, movements and social organisation of the eastern pygmy-possum (Cercartetus nanus) in northern New South Wales. Wildlife Research 29, 105-116.
| Crossref | Google Scholar |
Bowen M, Goldingay R (1999) Distribution and status of the eastern pygmy possum (Cercartetus nanus) in New South Wales. Australian Mammalogy 21(2), 153-164.
| Crossref | Google Scholar |
Crowther MS, Dargan JR, Madani G, Rus AI, Krockenberger MB, McArthur C, Moore BD, Lunney D, Mella VSA (2021) Comparison of three methods of estimating the population size of an arboreal mammal in a fragmented rural landscape. Wildlife Research 48(2), 105-114.
| Crossref | Google Scholar |
Davey SM (1990) Methods for surveying the abundance and distribution of arboreal marsupials in a south coast forest of New South Wales. Wildlife Research 17(4), 427-445.
| Crossref | Google Scholar |
DCCEEW (2023) National Vegetation Information System (NVIS) version 6.0. Department of Climate Change, Energy, the Environment and Water. Available at https://www.dcceew.gov.au/environment/land/native-vegetation/national-vegetation-information-system/data-products [accessed August 2024]
Duckworth JW (1998) The difficulty of estimating population densities of nocturnal forest mammals from transect counts of animals. Journal of Zoology 246(4), 466-468.
| Crossref | Google Scholar |
Dymond JR, Trotter CM, Shepherd JD, Wilde H (2000) Optimizing the airborne thermal detection of possums. International Journal of Remote Sensing 21, 3315-3326.
| Crossref | Google Scholar |
Fediajevaite J, Priestley V, Arnold R, Savolainen V (2021) Meta-analysis shows that environmental DNA outperforms traditional surveys, but warrants better reporting standards. Ecology and Evolution 11(9), 4803-4815.
| Crossref | Google Scholar | PubMed |
Focardi S, De Marinis AM, Rizzotto M, Pucci A (2001) Comparative evaluation of thermal infrared imaging and spotlighting to survey wildlife. Wildlife Society Bulletin 29, 133-139.
| Google Scholar |
Geiser F, Körtner G (2010) Hibernation and daily torpor in Australian mammals. Australian Zoologist 35(2), 204-215.
| Crossref | Google Scholar |
Goldingay RL (2023) Habitat use by the eastern pygmy-possum in a coastal woodland–heathland mosaic. Australian Mammalogy 45(3), 275-284.
| Crossref | Google Scholar |
Goldingay RL, Keohan J (2017) Population density of the eastern pygmy-possum in a heath–woodland habitat. Australian Journal of Zoology 65(6), 391-397.
| Crossref | Google Scholar |
Goldingay RL, Rueegger N (2018) Elevation induced variation in the breeding traits of a nectar-feeding non-flying mammal. Ecological Research 33, 979-988.
| Crossref | Google Scholar |
Goldingay RL, Sharpe DJ (2004) How effective is spotlighting for detecting the squirrel glider? Wildlife Research 31(4), 443-449.
| Crossref | Google Scholar |
Gonsalves L, Law B, Slade C (2024) Landscape-scale monitoring for forest fauna is achievable: a case study using remote sensors, artificial intelligence and robust analytics. Australian Zoologist 43(4), 526-544.
| Crossref | Google Scholar |
Goodenough AE, Carpenter WS, MacTavish L, MacTavish D, Theron C, Hart AG (2018) Empirically testing the effectiveness of thermal imaging as a tool for identification of large mammals in the African bushveldt. African Journal of Ecology 56(1), 51-62.
| Crossref | Google Scholar |
Gracanin A, Pearce A, Hofman M, Knipler M, Mikac KM (2022) Greater glider (Petauroides volans) live capture methods. Australian Mammalogy 44(2), 280-286.
| Crossref | Google Scholar |
Hanson JO, McCune JL, Chadès I, Proctor CA, Hudgins EJ, Bennett JR (2023) Optimizing ecological surveys for conservation. Journal of Applied Ecology 60(1), 41-51.
| Crossref | Google Scholar |
Harris JM, Goldingay RL (2005) Detection of the eastern pygmy-possum Cercartetus nanus (Marsupialia: Burramyidae) at Barren Grounds Nature Reserve, New South Wales. Australian Mammalogy 27(1), 85-88.
| Crossref | Google Scholar |
Harris JM, Goldingay RL, Broome L, Craven P, Maloney KS (2007) Aspects of the ecology of the eastern pygmy-possum Cercartetus nanus at Jervis Bay, New South Wales. Australian Mammalogy 29(1), 39-46.
| Crossref | Google Scholar |
Harris JM, Goldingay RL, Brooks LO (2014) Population ecology of the eastern pygmy-possum (Cercartetus nanus) in a montane woodland in southern New South Wales. Australian Mammalogy 36(2), 212-218.
| Crossref | Google Scholar |
Jackson RM, Roe JD, Wangchuk R, Hunter DO (2006) Estimating snow leopard population abundance using photography and capture-recapture techniques. Wildlife Society Bulletin 34(3), 772-781.
| Crossref | Google Scholar |
Kauffman MJ, Sanjayan M, Lowenstein J, Nelson A, Jeo RM, Crooks KR (2007) Remote camera-trap methods and analyses reveal impacts of rangeland management on Namibian carnivore communities. Oryx 41(1), 70-78.
| Crossref | Google Scholar |
Kerle JA, Kimmorley C, Old JM (2013) An inland population of the common ringtail possum (Pseudocheirus peregrinus) at Black Rock Ridge, New South Wales: a preliminary ecological assessment. Australian Mammalogy 35(2), 236-240.
| Crossref | Google Scholar |
Krebs CJ, Boonstra R, Gilbert S, Reid D, Kenney AJ, Hofer EJ (2011) Density estimation for small mammals from livetrapping grids: rodents in northern Canada. Journal of Mammalogy 92(5), 974-981.
| Crossref | Google Scholar |
Laidlaw WS, Wilson BA (1996) The home range and habitat utilisation of Cercartetus nanus (Marsupialia: Burramyidae) in coastal heathland, Anglesea, Victoria. Australian Mammalogy 19(1), 63-68.
| Crossref | Google Scholar |
Lardner B, Savidge JA, Rodda GH (2007) Spotting cryptic animals in the dark: what light properties should a good headlamp have? In ‘Managing vertebrate invasive species: proceedings of an international symposium’. (Eds GW Witmer, WC Pitt, KA Fagerstone). (USDA/APHIS Wildlife Services, National Wildlife Research Centre: Fort Collins, CO, USA)
Lardner B, Rodda GH, Adams AAY, Savidge JA, Reed RN (2015) Detection rates of geckos in visual surveys: turning confounding variables into useful knowledge. Journal of Herpetology 49(4), 522-532.
| Crossref | Google Scholar |
Law B, Chidel M, Britton A (2013) High predation risk for a small mammal: the eastern pygmy-possum (Cercartetus nanus). Australian Mammalogy 35(2), 149-152.
| Crossref | Google Scholar |
Law B, Gonsalves L, Burgar J, Brassil T, Kerr I, Wilmott L, Madden K, Smith M, Mella V, Crowther M, Krockenberger M, Rus A, Pietsch R, Truskinger A, Eichinski P, Roe P (2022) Estimating and validating koala Phascolarctos cinereus density estimates from acoustic arrays using spatial count modelling. Wildlife Research 49(5), 438-448.
| Crossref | Google Scholar |
Lindenmayer DB, Cunningham RB, Donnelly CF, Incoll RD, Pope ML, Tribolet CR, Viggers KL, Welsh AH (2001) How effective is spotlighting for detecting the greater glider (Petauroides volans)? Wildlife Research 28(1), 105-109.
| Crossref | Google Scholar |
Lindenmayer DB, MacGregor C, Welsh A, Donnelly CF, Brown D (2008) The use of hollows and dreys by the common ringtail possum (Pseudocheirus peregrinus) in different vegetation types. Australian Journal of Zoology 56(1), 1-11.
| Crossref | Google Scholar |
Linley GD, Pauligk Y, Marneweck C, Ritchie EG (2020) Moon phase and nocturnal activity of native Australian mammals. Australian Mammalogy 43(2), 190-195.
| Crossref | Google Scholar |
MacKenzie DI, Bailey LL (2004) Assessing the fit of site-occupancy models. Journal of Agricultural, Biological, and Environmental Statistics 9, 300-318.
| Crossref | Google Scholar |
MacKenzie DI, Nichols JD, Lachman GB, Droege S, Andrew Royle J, Langtimm CA (2002) Estimating site occupancy rates when detection probabilities are less than one. Ecology 83(8), 2248-2255.
| Crossref | Google Scholar |
Madani GF, Ashman KR, Mella VSA, Whisson DA (2020) A review of the ‘noose and flag’ method to capture free-ranging koalas. Australian Mammalogy 42(3), 341-348.
| Crossref | Google Scholar |
Madani G, Pietsch R, Beranek CT (2023) Where are my dragons? Replicating refugia to enhance the detection probability of an endangered cryptic reptile. Acta Oecologica 119, 103910.
| Crossref | Google Scholar |
Marsh DM, Trenham PC (2008) Current trends in plant and animal population monitoring. Conservation Biology 22, 647-655.
| Crossref | Google Scholar | PubMed |
McGregor H, Moseby K, Johnson CN, Legge S (2022) Effectiveness of thermal cameras compared to spotlights for counts of arid zone mammals across a range of ambient temperatures. Australian Mammalogy 44(1), 59-66.
| Crossref | Google Scholar |
Penteriani V, Kuparinen A, del Mar Delgado M, Palomares F, López-Bao JV, Fedriani JM, Calzada J, Moreno S, Villafuerte R, Campioni L, Lourenço R (2013) Responses of a top and a meso predator and their prey to moon phases. Oecologia 173, 753-766.
| Crossref | Google Scholar | PubMed |
Pocknee CA, Lahoz-Monfort JJ, Martin RW, Wintle BA (2021) Cost-effectiveness of thermal imaging for monitoring a cryptic arboreal mammal. Wildlife Research 48(7), 625-634.
| Crossref | Google Scholar |
Powell RA, Proulx G (2003) Trapping and marking terrestrial mammals for research: integrating ethics, performance criteria, techniques, and common sense. ILAR Journal 44(4), 259-276.
| Crossref | Google Scholar | PubMed |
Roberts M, Phillips L, Kohn F (1990) Common ringtail possum (Pseudocheirus peregrinus) as a management model for the Pseudocheiridae: Reproductive scope, behavior, and biomedical values on a browse-free diet. Zoo Biology 9(1), 25-41.
| Crossref | Google Scholar |
Rueegger NN, Goldingay RL, Brookes LO (2012) Does nest box design influence use by the eastern pygmy-possum? Australian Journal of Zoology 60(6), 372-380.
| Crossref | Google Scholar |
Schmidt BR, Cruickshank SS, Bühler C, Bergamini A (2023) Observers are a key source of detection heterogeneity and biased occupancy estimates in species monitoring. Biological Conservation 283, 110102.
| Crossref | Google Scholar |
Senior KL, Ramsauer J, McCarthy MA, Kelly LT (2021) The influence of weather and moon phase on small mammal activity. Australian Mammalogy 43(2), 160-167.
| Crossref | Google Scholar |
Sikes RS, Animal Care and Use Committee of the American Society of Mammalogists (2016) 2016 Guidelines of the American Society of Mammalogists for the use of wild mammals in research and education. Journal of Mammalogy 97(3), 663-688.
| Crossref | Google Scholar | PubMed |
Smith B, Augee ML, Rose S (2003) Radio-tracking studies of common ringtail possums, Pseudocheirus peregrinus in Manly Dam Reserve, Sydney. Proceedings of the Linnean Society of New South Wales 124, 183-194.
| Google Scholar |
Thomas L, Buckland ST, Rexstad EA, Laake JL, Strindberg S, Hedley SL, Bishop JRB, arques TA, Burnham KP (2010) Distance software: design and analysis of distance sampling surveys for estimating population size. Journal of Applied Ecology 47(1), 5-14.
| Crossref | Google Scholar | PubMed |
Thomson JA, Owen WH (1964) A field study of the Australian ringtail possum Pseudocheirus peregrinus (Marsupialia: Phalangeridae). Ecological Monographs 34(1), 27-52.
| Crossref | Google Scholar |
Underwood AH, Derhè MA, Jacups S (2022) Thermal imaging outshines spotlighting for detecting cryptic, nocturnal mammals in tropical rainforests. Wildlife Research 49(6), 491-499.
| Crossref | Google Scholar |
Verdolin JL (2006) Meta-analysis of foraging and predation risk trade-offs in terrestrial systems. Behavioral Ecology and Sociobiology 60, 457-464.
| Crossref | Google Scholar |
Vinson SG, Johnson AP, Mikac KM (2020) Thermal cameras as a survey method for Australian arboreal mammals: a focus on the greater glider. Australian Mammalogy 42(3), 367-374.
| Crossref | Google Scholar |
Wayne AF, Cowling A, Rooney JF, Ward CG, Wheeler IB, Lindenmayer DB, Donnelly CF (2005) Factors affecting the detection of possums by spotlighting in Western Australia. Wildlife Research 32(8), 689-700.
| Crossref | Google Scholar |
Wilmott L, Cullen D, Madani G, Krogh M, Madden K (2019) Are koalas detected more effectively by systematic spotlighting or diurnal searches? Australian Mammalogy 41(1), 157-160.
| Crossref | Google Scholar |
Wintle BA, Kavanagh RP, McCarthy MA, Burgman MA (2005) Estimating and dealing with detectability in occupancy surveys for forest owls and arboreal marsupials. The Journal of Wildlife Management 69(3), 905-917.
| Crossref | Google Scholar |
Witt RR, Beranek CT, Howell LG, Ryan SA, Clulow J, Jordan NR, Denholm B, Roff A (2020) Real-time drone derived thermal imagery outperforms traditional survey methods for an arboreal forest mammal. PLoS ONE 15(11), e0242204.
| Crossref | Google Scholar | PubMed |
Zemanova MA (2020) Towards more compassionate wildlife research through the 3Rs principles: moving from invasive to non-invasive methods. Wildlife Biology 2020(1), 1-17.
| Crossref | Google Scholar |