

Power and the passion: assessing statistical power with simulations to optimise monitoring of a threatened lizard
Jack Bilby A B * , Joshua S. Martin C , Kelly Arbon B , Ryan Baring D , Jessica Clayton D and Lucy F. R. Clive B
A
B
C
D
Abstract
Effective ecological surveying is a crucial component of the conservation management of cryptic and threatened species. Ensuring that a survey design has adequate statistical power to confidently detect changes is often overlooked. The pygmy bluetongue (Tiliqua adelaidensis) is an endangered species likely to benefit from increased survey optimisation and structured monitoring efforts across its fragmented and limited distribution.
We compared multiple quadrat sizes on simulated populations of T. adelaidensis at varying densities to evaluate sample sizes and detection rates required to achieve optimal statistical power and assess the ideal quadrat size and number for detecting population changes at Tiliqua Nature Reserve, South Australia.
We employed power analyses to assess the number of 30 × 30-m, 50 × 50-m, and 100 × 100-m quadrats required to detect 10%, 25%, and 50% declines in a simulated population of T. adelaidensis. On the basis of these analyses, we conducted the first site-wide monitoring survey for this species at Tiliqua Nature Reserve and, with the assistance of volunteer citizen scientists, surveyed 25 50 × 50-m quadrats over 5 days, achieving the expected sample size required to detect changes in the population size and estimate population densities for the site.
Our results suggested that 50 × 50-m quadrats were comparable or had significantly higher statistical power than did other quadrat sizes within the survey area and during the sampling period.
This study demonstrated that 50 × 50-m quadrats were the most effective survey strategy for detecting significant population declines of the endangered T. adelaidensis at Tiliqua Nature Reserve. This quadrat size balances survey effort and statistical power, providing a reliable method for long-term monitoring.
The optimised survey design using 50 × 50-m quadrats provides a robust framework for annual monitoring at Tiliqua Nature Reserve and is likely to be a viable method for other properties. This approach to determining survey effort can be applied to similar conservation efforts for other cryptic and threatened species, ensuring more effective use of resources and timely detection of population changes to inform conservation actions.
Keywords: conservation management, population monitoring, power analysis, pygmy bluetongue lizard, survey design, threatened species, Tiliqua adelaidensis, volunteer engagement.
Introduction
Ecological monitoring is a vital component of biodiversity conservation because an understanding of threatened species population trends allows for the rapid implementation of effective management protocols (Field et al. 2005; Moore et al. 2023). In particular, a key aspect of monitoring is the ability for a survey method to confidently detect changes in relative or absolute abundance in threatened populations (Reynolds et al. 2011; Geyle et al. 2019; Moore et al. 2023). If a critical decline is confidently detected, it facilitates proactive management, including the establishment of captive insurance populations (Andrew et al. 2018) or employment of translocation efforts where individuals are moved to sites where threats are absent or better managed (Legge et al. 2018; Magoulick et al. 2024). Without effective strategies for detecting population declines and rapid commencement of management strategies, populations of threatened taxa can quickly decline below their minimal viable population size, resulting in an increased likelihood of population-level extirpation.
Cryptic and rare species are difficult to survey, owing to their often inconspicuous behavioural habits (e.g. small size, fossorial or nocturnal lifestyle, etc.), which leads to low detectability without significant survey effort (Mazerolle et al. 2007; Owens et al. 2024). Many reptile taxa are under-represented in the scientific literature and are classified as Data Deficient by the International Union for Conservation of Nature (IUCN) because of their life-histories, morphology, and behaviour (Meiri and Chapple 2016; Chapple et al. 2019; Wotherspoon et al. 2024). Although comprehensive extinction-risk assessments have been available for frogs, birds, and mammals for well over a decade, the same level of assessment for reptiles was achieved only recently, finding 21% of species are threatened (Chapple et al. 2019; Cox et al. 2022).
Difficulties associated with detecting cryptic reptile taxa create a major problem for ecological management where an inability to measure population trends limits the ability for effective and timely action. Inadequate survey designs lead to reduced statistical power to detect important population variation. Ignoring statistical power as a measure of appropriateness and reliability of monitoring methods may result in ineffective management strategies, poor data collection, and failure to record true population trends (Legg and Nagy 2006). Ensuring that monitoring programs are able to achieve their objectives effectively and confidently with limited resources remains one of the largest challenges for conservation managers globally (Reynolds et al. 2011).
The pygmy bluetongue (Tiliqua adelaidensis) is a highly specialised species that primarily occupies lycosid or mygalomorph spider burrows in fragmented grassland of south-central South Australia (Milne and Bull 2000; Fellows et al. 2009). These mesic grasslands have experienced significant anthropogenic degradation through landscape modification for agriculture and development (Fordham et al. 2012; Delean et al. 2013). Consequently, owing to significant range and habitat contractions and inadequate ecological knowledge, T. adelaidensis was for decades considered extinct (Milne 1999; Fordham et al. 2012). Their rediscovery in 1992 led to increased survey and research efforts to improve our understanding of their conservation status, geographic distribution, ecological requirements, threats, and best management practices (Milne 1999; Souter et al. 2004; Fellows et al. 2009; Clayton and Bull 2016). Currently, they are federally listed as Endangered under the Environment Protection and Biodiversity Conservation Act 1999 (EPBC Act) and are threatened by continued habitat degradation and loss owing to anthropogenic development and climate change (Fordham et al. 2012).
Adult T. adelaidensis spend significant periods of time concealed within their burrow, typically departing only to find mates or capture passing prey (Milne et al. 2003; Bull et al. 2015). They aggressively defend their burrows against conspecifics and, once established within a burrow, typically have a home range extending less than a metre from the burrow entrance (Fenner and Bull 2011; Bull et al. 2015). Survey practices have traditionally exploited their reliance on burrows and largely sedentary habits and population densities are calculated through individual and repeat counts of occupied burrows. Previous surveys have estimated population densities using 20 × 20-m or 30 × 30-m monitoring quadrats. However, quadrats were often specifically located in areas of high lizard density because higher sample sizes were beneficial for research objectives (Milne and Bull 2000; Souter et al. 2004; Clayton and Bull 2016). Alternatively, government-led surveys were undertaken using single 100 × 100-m quadrats (Milne 1999; Nielsen 2017). However, relying on a single large quadrat can lead to biased results, because it may not accurately represent the variability in habitat and population distribution across the entire occupied area.
In this paper, we test and compare 30 × 30, 50 × 50, and 100 × 100-m quadrats in their capacity to detect T. adelaidensis population trends. We hypothesised that 100 × 100-m quadrats would require excessive survey effort, 30 × 30-m quadrats would under-represent site-level variability in occupancy, and 50 × 50-m quadrats would provide a suitable compromise with consideration for survey effort and statistical power. We used field data to generate simulations and assessed statistical power of different quadrat sizes and their practicality within a sampling timeframe. Whereas small-scale monitoring and research have occurred at this site for multiple decades, site-wide monitoring of T. adelaidensis has yet to occur. We developed this method to support long-term, site-wide monitoring strategies and future research on T. adelaidensis at Tiliqua Nature Reserve.
Materials and methods
Study site
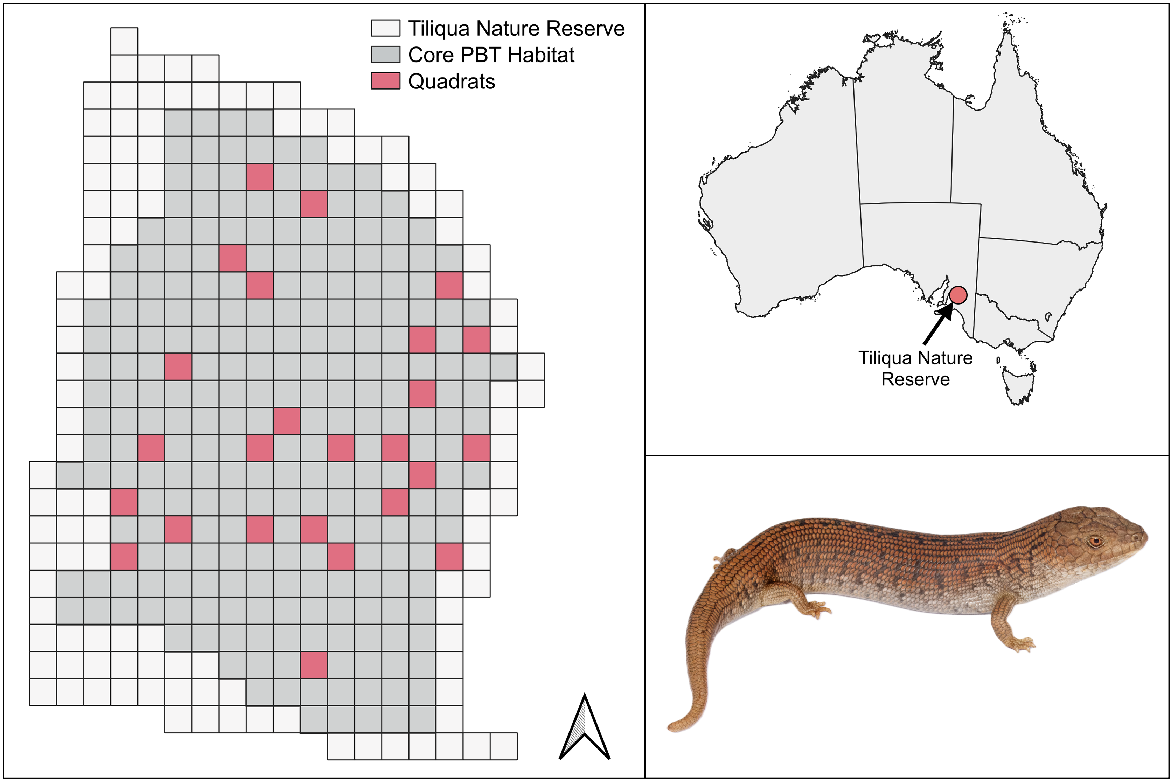
Tiliqua Nature Reserve (henceforth, TNR) is situated in the Mid-North region of South Australia, near Burra, and was acquired by Nature Foundation in 2012. The 81-ha reserve consists of gently undulating open tussock grassland, dominated by speargrass (Austrostipa spp.), irongrass (Lomandra spp.), and wallaby grass (Rytidosperma spp.). Invasive weeds, including wild oats (Avena barbata), wild sage (Salvia verbenaca), and horehound (Marrubium vulgare) are also present. The property receives intermittent grazing pressure by sheep at intervals suitable for maintaining appropriate vegetation cover for T. adelaidensis (Clayton and Bull 2015; Nielsen and Bull 2020). The regional climate is dry-temperate, experiencing hot, dry summers, and cool, moist winters, and a mean annual rainfall of 424 mm (BOM 2023).
Preliminary surveys and population simulations
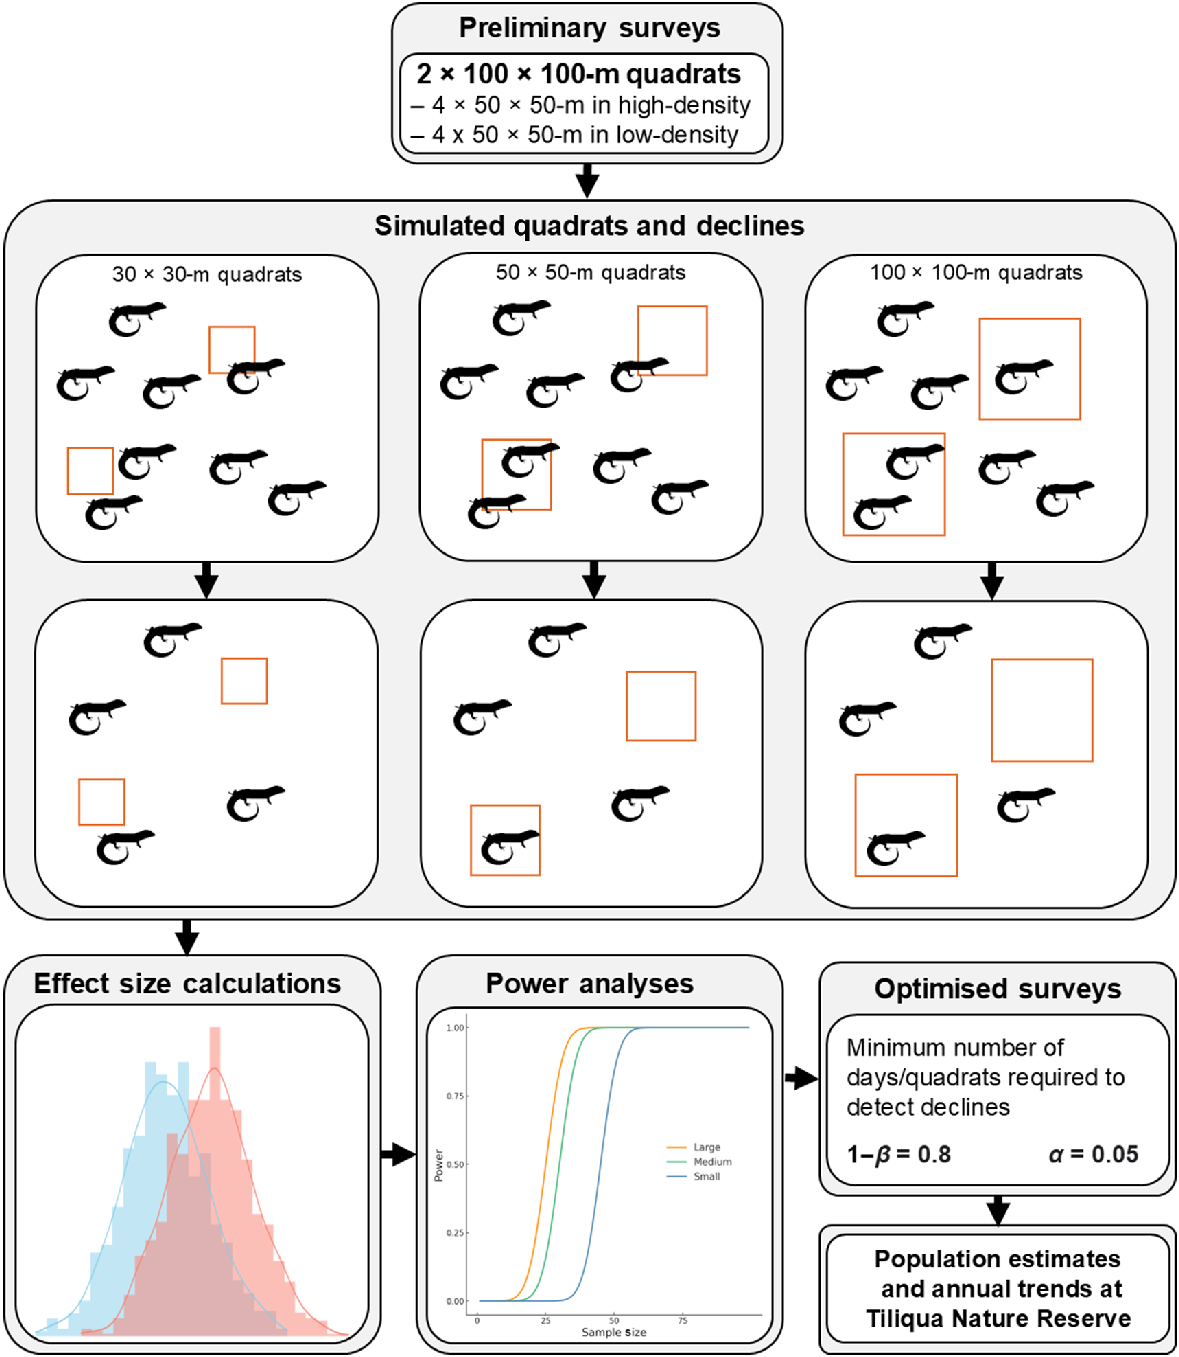
To select a population density for simulation, we conducted preliminary on-ground surveys for T. adelaidensis at TNR. We surveyed two 100 × 100-m quadrats (each divided into four smaller 50 × 50-m quadrats), one of which was thought to be of higher-quality habitat on the basis of prior research projects, and thus to have a higher density, and one was presumed to be in lower-quality habitat. After quadrats were delineated, field personnel thoroughly searched them by walking sequential 1-m belts between pinned markers to ensure systematic and complete coverage. All spider burrows that were located and deemed suitable for T. adelaidensis occupancy (>13-mm diameter and >100-mm depth; Milne and Bull 2000) were marked with a temporary pin. After searching the entire quadrat, marked burrows were inspected using an optic fibrescope (Yateks M Series Videoscope) to confirm lizard occupancy.
To assess the utility of power analysis to optimise quadrat and sample sizes for assessment of T. adelaidensis population change, we simulated a 1-km2 area with either a high-density population (100 individuals per hectare) and a low-density population (five individuals per hectare) in the R environment (R Core Team 2021) via the RStudio interface (ver. 2024.09.0+375; see https://posit.co/download/rstudiodesktop/; RStudio Team 2024) where points represent a simulated lizard individual. Points were placed randomly and represented the irregular distribution of the individuals we observed during preliminary surveys. We also created a mixed density simulation (where a random 25% of the 1-km2 area was of high density (100/ha) and 75% was of low density (5/ha)), alongside the low- and high-density levels to represent the more realistic patchy distribution of lizards. We randomly placed non-overlapping quadrats of differing sizes (small; 30 × 30-m, medium; 50 × 50-m, and large; 100 × 100-m) within the 1-km2 plot to count the number of T. adelaidensis individuals per quadrat.
The number of quadrats per treatment type was determined as the maximum number that could be feasibly and thoroughly searched by a team of two researchers within a 2-week period as previously described. As setting up multiple small quadrats inherently leads to disproportionately more setup time than does setting up a single larger quadrat, despite potentially surveying an approximately equivalent area, the time taken to complete the survey is not linear. Additionally, in the case of the survey methods used for T. adelaidensis, higher-density quadrats also take more time at the same quadrat size. Whereas the amount of time spent performing transects to locate burrows remains approximately the same to avoid adding biases, the time spent checking all of the burrows with the optiscope is often much longer in high-density quadrats because they typically contain a higher number of total burrows. These on-ground differences are important to take into consideration when designing a realistic in situ survey by using these a priori methods. Approximate time values were developed following the preliminary surveys and then were refined further following consultation with three independent advisors knowledgeable on the species (Supplementary Table S1). It is currently unknown how temporal trends in vegetation cover and survey effort affect detectability of T. adelaidensis; thus, we assumed that lizard detectability remained consistent between surveys.
We reduced the simulated population size by 10%, 25% and 50% to simulate declines and repeated the power analysis on the three quadrat sizes (Fig. 1). Because population dynamics of T. adelaidensis are poorly understood, these decline levels were chosen as proxies for slight, moderate, and extreme declines respectively, which may be observed in populations and might trigger different management interventions. This process was repeated 10 times per treatment, totalling 36 monitoring designs (i.e. three density levels, three decline levels and one baseline level, and three quadrat sizes), with 10 replicates each, equating to 360 total simulations.
A conceptual outline of the project design. Preliminary surveys informed the densities to simulate for the low-, mixed-, and high-density populations, where 10%, 25%, and 50% declines were applied. Quadrats of 30 × 30, 50 × 50, and 100 × 100-m were randomly placed to calculate power curves and number of days/quadrats required to reach a power of 0.8 (1−β) and a significance threshold (α) of 0.05.
Effect sizes and power analyses
We calculated a standardised mean difference between groups (henceforth, effect size) for each of the 10 replicates within each of the 36 monitoring designs. Effect sizes between decline simulations for each quadrat size were quantified using the Cohen’s D equation for paired Student’s t-tests (Cohen 1988). The differences in effect sizes between quadrat sizes were compared using Kruskall–Wallis tests, with Dunn’s post hoc test being used for pairwise comparisons. Significance values were adjusted with the Bonferroni correction for multiple tests (Midway et al. 2020).
Power analysis was performed on each of the 10 effect sizes in the R package pwr (ver. 1.3-0; see https://cran.r-project.org/web/packages/pwr/; Champely et al. 2018), with the target power value (1−β) set to 0.8 (Geyle et al. 2019), and the significance threshold (α) being set at 0.05 (Fisher 1970; Murtaugh 2014). This allowed us to use the effect size, required power, and significance to calculate the required sample size to achieve these targets. We removed the 10% declines from the power analyses because the number of quadrats required was unrealistic to achieve during a field survey period. We report the required number of quadrats, of each size, under each scenario and we directly tested the difference in survey effort (i.e. number of days required to reach a power of 0.8) between quadrat sizes by using Kruskal–Wallis tests, with Dunn’s post hoc test being used for pairwise comparisons. Significance values were adjusted with the Bonferroni correction for multiple tests (Midway et al. 2020).
Population monitoring
Following the completion of the power analyses, we used QGIS (ver. 3.26.2; see http://qgis.osgeo.org; QGIS Development Team 2024) to randomly plot quadrats across TNR. We excluded an area of 28 ha that was considered to be unsuitable for T. adelaidensis (e.g. rocky hilltops, driving tracks, roadside verges). On the basis of the results of the power analyses, we surveyed 25 50 × 50-m quadrats in the remaining 53 ha of suitable habitat, which were marked with permanent iron posts to ensure consistency of area searched in subsequent years (Fig. 2). We thoroughly searched quadrats for suitably-sized spider burrows as described above. When detected, we classified each burrow by size (>16-mm diameter for adults; 10–16-mm diameter for juveniles and subadults), type (lycosid or mygalomorph), and inhabitant (lizard, spider, other invertebrate, or unoccupied) (Milne and Bull 2000).
Results
Effect size
Larger quadrats consistently detected a significantly greater effect size than did smaller quadrats in the low-density simulations for the 10%, 25%, and 50% declines (Tables 1, 2). In the mixed-density quadrats, there was only a significant difference in the extreme decline simulation (Table 2). In the high-density simulations, significant differences among quadrat sizes were detected only in the moderate decline and extreme decline treatments (see Table S2 for details).
| Quadrat size (m) | Quadrat type | Effect size (d) | |||
|---|---|---|---|---|---|
| 10% decline | 25% decline | 50% decline | |||
| 30 × 30 | Low density | 0.038 ± 0.040 (CI −0.053–0.129) | 0.081 ± 0.039 (CI −0.007–0.168) | 0.397 ± 0.038 (CI 0.311–0.484) | |
| Mixed density | 0.121 ± 0.021 (CI 0.072–0.169) | 0.257 ± 0.029 (CI 0.191–0.322) | 0.522 ± 0.022 (CI 0.472–0.572) | ||
| High density | 0.447 ± 0.172 (CI 0.058–0.856) | 0.784 ± 0.111 (CI 0.532–1.035) | 1.585 ± 0.055 (CI 1.281–1.889) | ||
| 50 × 50 | Low density | 0.170 ± 0.055 (CI 0.045–0.296) | 0.261 ± 0.024 (CI 0.142–0.381) | 0.597 ± 0.066 (CI 0.446–0.747) | |
| Mixed density | 0.110 ± 0.018 (CI 0.069–0.151) | 0.261 ± 0.057 (CI 0.183–0.340) | 0.531 ± 0.026 (CI 0.482–0.580) | ||
| High density | 0.764 ± 0.336 (CI 0.004–1.525) | 1.492 ± 0.072 (CI 1.329–1.655) | 3.102 ± 0.159 (CI 2.742–3.461) | ||
| 100 × 100 | Low density | 0.358 ± 0.143 (CI 0.033–0.682) | 0.670 ± 0.130 (CI 0.375–0.964) | 1.186 ± 0.178 (CI 0.784–1.588) | |
| Mixed density | 0.140 ± 0.020 (CI 0.095–0.184) | 0.318 ± 0.029 (CI 0.252–0.385) | 0.737 ± 0.054 (0.614–0.859) | ||
| High density | 1.127 ± 0.228 (CI 0.612–1.642) | 3.035 ± 0.242 (CI 2.487–3.582) | 5.966 ± 0.407 (CI 5.046–6.887) | ||
Light grey shading represents a medium effect size (d > 0.5) and dark grey shading represents a large effect size (d > 0.8). 95% confidence intervals are shown in parentheses.
| Density | 10% decline | 25% decline | 50% decline | |
|---|---|---|---|---|
| Low density | H 2,29 = 6.480, P = 0.039 | H 2,29 = 19.365, P < 0.001 | H 2,29 = 17.631, P < 0.001 | |
| Mixed density | H2,29 = 1.814, P = 0.404 | H2,29 = 3.564, P = 0.168 | H 2,29 = 11.430, P = 0.003 | |
| High density | H2,29 = 5.350, P = 0.069 | H 2,29 = 25.551, P < 0.001 | H 2,29 = 25.806, P < 0.001 |
Significant differences are shown in bold.
Power analyses
It was possible only to detect the 25% declines in the high-density simulations within the 2-week survey period (Table 3). In this treatment, there was a significant difference among the quadrat sizes, with medium quadrats being significantly more effective at detecting 25% declines than were the large quadrats (Z = 2.769, P = 0.017). There were significant differences found in the mixed-density simulations, where both small and medium quadrats required fewer days to reach the β and significance thresholds.
| Quadrat size (m) | Quadrat type | 25% decline | 50% decline | |||
|---|---|---|---|---|---|---|
| Quadrats | Days | Quadrats | Days | |||
| 30 × 30 | Low density | 3857 (CI 932–8645) | 643 (CI 156–1441) | 67 (CI 40–95) | 12 (CI 7–16) | |
| Mixed density | 203 (CI 51–355) | 41 (CI 11–71) | 33 (CI 28–37) | 7 (CI 6–8) | ||
| High density | 31 (CI 11–51) | 16 (CI 6–26) | 5 (CI 5–6) | 3 (CI 3–3) | ||
| 50 × 50 | Low density | 97 (CI 67–127) | 33 (CI 23–43) | 38 (CI 13–62) | 13 (CI 5–21) | |
| Mixed density | 81 (CI 44–118) | 33 (CI 18–48) | 25 (CI 21–29) | 11 (9– 12) | ||
| High density | 6 (CI 6–6) | 6 (CI 6–7) | 4 (CI 3–4) | 4 (CI 4–4) | ||
| 100 × 100 | Low density | 57 (CI 5–109) | 58 (CI 5–110) | 12 (CI 7–17) | 12 (CI 7–17) | |
| Mixed density | 103 (CI 63–142) | 131 (CI 80–181) | 19 (CI 14–24) | 25 (CI 19–32) | ||
| High density | 4 (CI 3–4) | 11 (CI 10–12) | 3 (CI 3–3) | 9 (CI 9–9) | ||
95% confidence intervals are shown in parentheses.
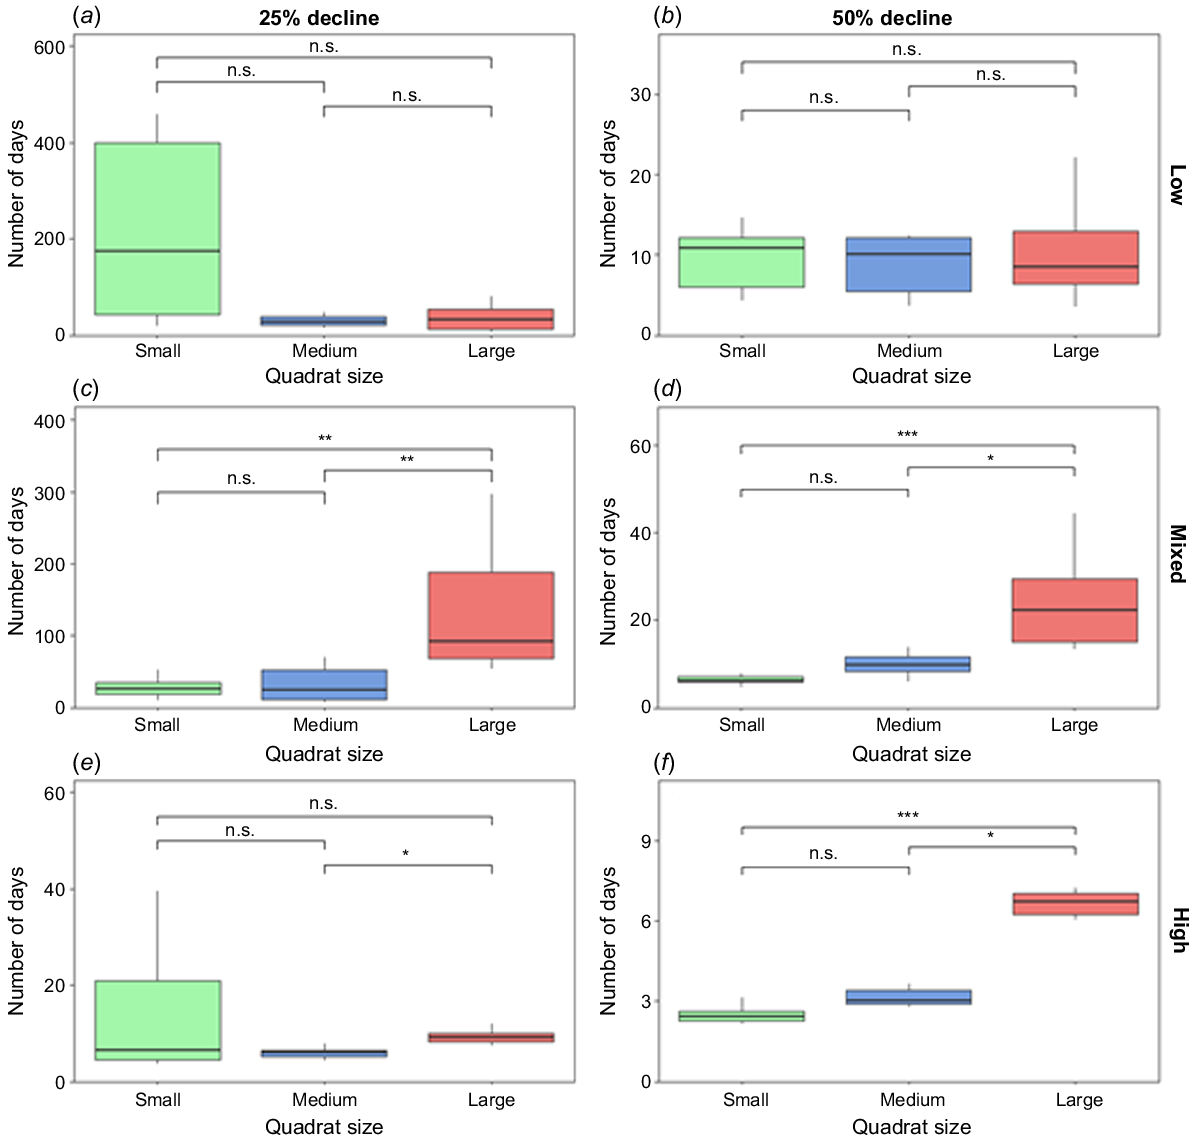
Although the Kruskal–Wallis test found significant differences in the low-density simulation, no quadrat size was capable of detecting 25% declines within the 2-week survey period and no significant differences were found in the adjusted pairwise comparisons (Table 4, Fig. 3). All three quadrat sizes were able to detect 50% declines in every simulation within the 2-week survey period. However, there were significant differences between the number of days required to detect 50% declines for the mixed-density and high-density simulations, with large quadrats taking significantly more days than both small and medium plots (see Table S3 for details).
| Density | 25% decline | 50% decline | |
|---|---|---|---|
| Low density | H 2,29 = 7.443, P = 0.024 | H2,29 = 0.111, P = 0.946 | |
| Mixed density | H 2,29 = 14.666, P = 0.001 | H 2,29 = 22.408, P < 0.001 | |
| High density | H 2,29 = 7.760, P = 0.021 | H 2,29 = 24.351, P < 0.001 |
Significant differences (P < 0.05) are shown in bold.
The number of survey days required to detect decline for all simulated scenarios: (a) low density – 25% decline, (b) low density – 50% decline, (c) mixed density – 25% decline, (d) mixed density – 50% decline, (e) high density – 25% decline, and (f) high density – 50% decline. Pairwise relationships are indicated by labels; n.s., P > 0.05; *P < 0.05; **P < 0.01; and ***P < 0.001.
Survey outcomes
With the assistance of volunteers, we completed the surveys of 25 50 × 50-m quadrats within 5 days and located a total of 1604 spider burrows suitable for lizard occupancy. Average lizard numbers were 9.44 (±1.89 s.e.) per plot, or 37.76 (±7.56 s.e.) per hectare, with a range of 0–41 individuals, occupying 15.01% (±2.51%) of lizard suitable spider burrows and 84% of all quadrats (21/25). We were able to effectively survey 7.72% of the total area of the reserve and 11.79% of the suitable T. adelaidensis habitat. Extrapolating the average density per quadrat to the entirety of the suitable habitat, the simple population estimate of T. adelaidensis at TNR in 2023 was 2001 (±400) individuals. With the quadrat containing 41 individuals considered an outlier and removed, the population estimate based on the remaining 24 quadrats produced a more conservative estimate of 1723 (±298) individuals across the reserve.
Discussion
Optimising survey designs offers substantial benefits to conservation management and monitoring of threatened species. In this study, we found that 50 × 50 and 100 × 100-m quadrats consistently detected 25% and 50% declines in simulated populations of the endangered T. adelaidensis. On the basis of the fewest survey days, we determined that 25 replicate 50 × 50-m quadrats allowed for the minimum effort required to achieve our designated levels of power and significance when surveying a 1-km2 site, with the objective of detecting significant population declines of T. adelaidensis. We then set this number of quadrats as the goal for surveying the 53-ha TNR, so as to confidently sample beyond the minimum requirement. This experimental a priori analysis allowed us to confidently initiate an on-ground, site-wide monitoring project to estimate population size and subsequent temporal trends.
This project represents the first site-wide survey of T. adelaidensis, and the first informed population estimate for TNR. With TNR representing the only dedicated conservation reserve for this species, this study is valuable for practitioners and land managers working to conserve the species here and on other properties. Without ongoing and standardised surveys, understanding population dynamics of threatened species is substantially limited and conservation intervention may be delayed or ineffective (Lindenmayer et al. 2013; Robinson et al. 2018; Scheele et al. 2019). It is paramount to ensure that surveys are optimised so that resources are used efficiently, and that survey effort can obtain an accurate representation of a population and its characteristics (Marsh and Trenham 2008; Moore et al. 2023). The results of future annual surveys and corresponding vegetation assessments can be used to investigate temporal changes in detectability and develop a more optimised study design for population modelling. Whereas no population thresholds for conservation intervention currently exist for the pygmy bluetongue at TNR or other properties, the results of this project are the first step to allow for these to be developed. These a priori methods and baseline surveys will also set the framework for future annual monitoring at other properties and for other cryptic and threatened species, and for further work into environmental predictors of T. adelaidensis occupancy, more robust population estimations, and to identify critical population thresholds and declines that are detrimental to persistence of the population.
Although moderate and extreme declines were detectable with select methods, we were unable to confidently detect slight declines with any survey design or at any population density. We were also unable to confidently identify moderate declines in low-density populations. This has ramifications for the implementation of management, as expeditious and adaptive conservation action has greater chance of being successful (Martin et al. 2012; Walls 2018). Additionally, low-density populations are at greater risk of extirpation than are high-density populations because of reduced genetic and phenotypic diversity and increased vulnerability to stochastic events (Pimm et al. 1988; Griffen and Drake 2008). To gain a more holistic view of population trends, we suggest that conservation practitioners working on cryptic and threatened species use multiple complementary methods to identify declines, such as assessing changes in occupancy as well as quadrat density and broader population estimates (Bried and Pellet 2012; Einoder et al. 2018; Dennis et al. 2019).
In this study, volunteers were instrumental to achieving the survey goals in the restricted timeframe allocated to the survey and thus statistical power was considerably increased. With the help of volunteers, we were able to survey 25 quadrats in five days, rather than the eleven days that was predicted with just two observers. However, there is an inherent trade-off with inexperienced volunteers, as greater observer experience typically improves detection ability, and this is likely to be exacerbated in cryptic species (Garel et al. 2005; Fitzpatrick et al. 2009; Moyer-Horner et al. 2012; Albergoni et al. 2016). This was apparent during TNR surveys where false positives (e.g. flagging of burrows that were too small or flagging ant nests) occurred multiple times throughout the early survey activities. These issues were largely remedied by having experienced surveyors present and working in large groups, which enhances sampling accuracy (Schmeller et al. 2009; Albergoni et al. 2016). As such, with the addition of a brief training induction to discuss false positives and negatives (Newman et al. 2003), the benefit of substantially increasing coverage, and thus statistical power, outweighed any time taken to correct errors made during the survey period.
Effective conservation of threatened species relies on the ability of conservation practitioners to confidently detect declines and respond accordingly. This investigation has demonstrated the effectiveness of using 50 × 50-m quadrats for monitoring population trends in T. adelaidensis to achieve high statistical power within a feasible survey timeframe. The value of volunteers in the completion of on-ground monitoring cannot be overstated, although management of potential errors must be accounted for in any monitoring plan engaging inexperienced participants. Future monitoring should continue using and refining the approach described here to ensure accurate detection of population trends, enabling timely conservation actions. The processes applied in this investigation can also be applied to similar cryptic and threatened animal species, demonstrating the broad-scale application of such a priori methodology. This research offers significant insights into ecological monitoring methodologies, highlighting the importance of tailored survey designs for the effective conservation of cryptic and threatened species.
Data availability
The code and non-sensitive data associated with this study are available upon request.
Author contributions
J. Bilby and L. F. R. Clive conceived the ideas and designed methodology; L. F. R. Clive, J. Clayton, and J. Bilby collected the preliminary data; J. Bilby and J. S. Martin created the simulations, L. F. R. Clive, K. Arbon, and J. Bilby conducted field surveys and planning, J. Bilby analysed the data; J. Bilby and J. S. Martin led the writing of the paper. All authors contributed critically to the drafts and gave final approval for publication.
Acknowledgements
We thank volunteers and field personnel for their assistance with data collection in the field. We also thank volunteers and Nature Foundation members who attended the Tiliqua Nature Reserve working bee and assisted with setting up the quadrats. We thank Bonnie Derne for the use of the silhouette artwork used in Figure 1. We also acknowledge Shawn Scott for providing valuable feedback on an earlier version of the manuscript and we thank two reviewers for their helpful comments during the review process.
References
Albergoni A, Bride I, Scialfa CT, Jocque M, Green S (2016) How useful are volunteers for visual biodiversity surveys? An evaluation of skill level and group size during a conservation expedition. Biodiversity and Conservation 25, 133-149.
| Crossref | Google Scholar |
Andrew P, Cogger H, Driscoll D, Flakus S, Harlow P, Maple D, Misso M, Pink C, Retallick K, Rose K, Tiernan B, West J, Woinarski JCZ (2018) Somewhat saved: a captive breeding programme for two endemic Christmas Island lizard species, now extinct in the wild. Oryx 52(1), 171-174.
| Crossref | Google Scholar |
BOM (2023) Monthly rainfall. Australian Government Bureau of Meteorology. Available at http://www.bom.gov.au/jsp/ncc/cdio/weatherData/av?p_nccObsCode=139&p_display_type=dataFile&p_startYear=&p_c=&p_stn_num=021077 [accessed 10 July 2024]
Bried JT, Pellet J (2012) Optimal design of butterfly occupancy surveys and testing if occupancy converts to abundance for sparse populations. Journal of Insect Conservation 16(4), 489-499.
| Crossref | Google Scholar |
Bull CM, Godfrey SS, Ebrahimi M, Fenner AL (2015) Long and short term residence in refuge burrows by endangered pygmy bluetongue lizards. Amphibia-Reptilia 36(2), 119-124.
| Crossref | Google Scholar |
Champely S, Ekstrom C, Dalgaard P, Gill J, Weibelzahl S, Anandkumar A, Ford C, Volcic R, De Rosario H, De Rosario MH (2018) Package ‘pwr’. R package version 1(2). Available at https://cran.r-project.org/web/packages/pwr/
Chapple D, Tingley R, Mitchell N, Macdonald S, Keogh JS, Shea G, Bowles P, Cox N, Woinarski J (2019) ‘The action plan for Australian lizards and snakes 2017.’ (CSIRO Publishing) 10.1071/9781486309474
Clayton J, Bull CM (2015) The impact of sheep grazing on burrows for pygmy bluetongue lizards and on burrow digging spiders. Journal of Zoology 297(1), 44-53.
| Crossref | Google Scholar |
Clayton J, Bull M (2016) The impact of sheep grazing on the depth of spider burrows and of burrows selected by the pygmy bluetongue lizard (Tiliqua adelaidensis). Wildlife Research 43(8), 691-703.
| Crossref | Google Scholar |
Cohen J (1988) ‘Statistical power analysis for the behavioral sciences.’ (Lawrence Erlbaum Associates: Hillsdale, NJ, USA) 10.4324/9780203771587
Cox N, Young BE, Bowles P, Fernandez M, Marin J, Rapacciuolo G, Böhm M, Brooks TM, Hedges SB, Hilton-Taylor C, Hoffmann M, Jenkins RKB, Tognelli MF, Alexander GJ, Allison A, Ananjeva NB, Auliya M, Avila LJ, Chapple DG, Cisneros-Heredia DF, Cogger HG, Colli GR, de Silva A, Eisemberg CC, Els J, Fong G. A, Grant TD, Hitchmough RA, Iskandar DT, Kidera N, Martins M, Meiri S, Mitchell NJ, Molur S, Nogueira CdC, Ortiz JC, Penner J, Rhodin AGJ, Rivas GA, Rödel M-O, Roll U, Sanders KL, Santos-Barrera G, Shea GM, Spawls S, Stuart BL, Tolley KA, Trape J-F, Vidal MA, Wagner P, Wallace BP, Xie Y (2022) A global reptile assessment highlights shared conservation needs of tetrapods. Nature 605(7909), 285-290.
| Crossref | Google Scholar | PubMed |
Delean S, Bull CM, Brook BW, Heard LMB, Fordham DA (2013) Using plant distributions to predict the current and future range of a rare lizard. Diversity and Distributions 19(9), 1125-1137.
| Crossref | Google Scholar |
Dennis EB, Brereton TM, Morgan BJT, Fox R, Shortall CR, Prescott T, Foster S (2019) Trends and indicators for quantifying moth abundance and occupancy in Scotland. Journal of Insect Conservation 23, 369-380.
| Crossref | Google Scholar |
QGIS Development Team (2024) QGIS Geographic Information System. Open Source Geospatial Foundation Project. Available at http://qgis.osgeo.org
Einoder LD, Southwell DM, Lahoz-Monfort JJ, Gillespie GR, Fisher A, Wintle BA (2018) Occupancy and detectability modelling of vertebrates in northern Australia using multiple sampling methods. PLoS ONE 13(9), e0203304.
| Crossref | Google Scholar |
Fellows HL, Fenner AL, Bull CM (2009) Spiders provide important resources for an endangered lizard. Journal of Zoology 279(2), 156-163.
| Crossref | Google Scholar |
Fenner AL, Bull CM (2011) Central-place territorial defence in a burrow-dwelling skink: aggressive responses to conspecific models in pygmy bluetongue lizards. Journal of Zoology 283(1), 45-51.
| Crossref | Google Scholar |
Field SA, Tyre AJ, Possingham HP (2005) Optimizing allocation of monitoring effort under economic and observational constraints. Journal of Wildlife Management 69(2), 473-482.
| Crossref | Google Scholar |
Fisher RA (1970) ‘Statistical methods for research workers.’ (Oliver and Boyd: Edinburgh, UK) 10.1007/978-1-4612-4380-9_6
Fitzpatrick MC, Preisser EL, Ellison AM, Elkinton JS (2009) Observer bias and the detection of low-density populations. Ecological Applications 19(7), 1673-1679.
| Crossref | Google Scholar | PubMed |
Fordham DA, Watts MJ, Delean S, Brook BW, Heard LMB, Bull CM (2012) Managed relocation as an adaptation strategy for mitigating climate change threats to the persistence of an endangered lizard. Global Change Biology 18(9), 2743-2755.
| Crossref | Google Scholar | PubMed |
Garel M, Cugnasse J-M, Gaillard J-M, Loison A, Santosa Y, Maublanc M-L (2005) Effect of observer experience on the monitoring of a mouflon population. Acta Theriologica 50, 109-114.
| Crossref | Google Scholar |
Geyle HM, Guillera-Arroita G, Davies HF, Firth RSC, Murphy BP, Nimmo DG, Ritchie EG, Woinarski JCZ, Nicholson E (2019) Towards meaningful monitoring: a case study of a threatened rodent. Austral Ecology 44(2), 223-236.
| Crossref | Google Scholar |
Griffen BD, Drake JM (2008) A review of extinction in experimental populations. Journal of Animal Ecology 77(6), 1274-1287.
| Crossref | Google Scholar | PubMed |
Legg CJ, Nagy L (2006) Why most conservation monitoring is, but need not be, a waste of time. Journal of Environmental Management 78(2), 194-199.
| Crossref | Google Scholar | PubMed |
Legge S, Woinarski JCZ, Burbidge AA, Palmer R, Ringma J, Radford JQ, Mitchell N, Bode M, Wintle B, Baseler M, Bentley J, Copley P, Dexter N, Dickman CR, Gillespie GR, Hill B, Johnson CN, Latch P, Letnic M, Manning A, McCreless EE, Menkhorst P, Morris K, Moseby K, Page M, Pannell D, Tuft K (2018) Havens for threatened Australian mammals: the contributions of fenced areas and offshore islands to the protection of mammal species susceptible to introduced predators. Wildlife Research 45(7), 627-644.
| Crossref | Google Scholar |
Lindenmayer DB, Piggott MP, Wintle BA (2013) Counting the books while the library burns: why conservation monitoring programs need a plan for action. Frontiers in Ecology and the Environment 11(10), 549-555.
| Crossref | Google Scholar |
Magoulick KM, Hull V, Liu J (2024) Mammal recovery inside and outside terrestrial protected areas. Ambio 53, 1296-1306.
| Crossref | Google Scholar | PubMed |
Marsh DM, Trenham PC (2008) Current trends in plant and animal population monitoring. Conservation Biology 22(3), 647-655.
| Crossref | Google Scholar | PubMed |
Martin TG, Nally S, Burbidge AA, Arnall S, Garnett ST, Hayward MW, Lumsden LF, Menkhorst P, McDonald-Madden E, Possingham HP (2012) Acting fast helps avoid extinction. Conservation Letters 5(4), 274-280.
| Crossref | Google Scholar |
Mazerolle MJ, Bailey LL, Kendall WL, Andrew Royle J, Converse SJ, Nichols JD (2007) Making great leaps forward: accounting for detectability in herpetological field studies. Journal of Herpetology 41(4), 672-689.
| Crossref | Google Scholar |
Meiri S, Chapple DG (2016) Biases in the current knowledge of threat status in lizards, and bridging the ‘assessment gap’. Biological Conservation 204, 6-15.
| Crossref | Google Scholar |
Midway S, Robertson M, Flinn S, Kaller M (2020) Comparing multiple comparisons: practical guidance for choosing the best multiple comparisons test. PeerJ 8, e10387.
| Crossref | Google Scholar |
Milne T, Bull CM (2000) Burrow choice by individuals of different sizes in the endangered pygmy blue tongue lizard Tiliqua adelaidensis. Biological Conservation 95(3), 295-301.
| Crossref | Google Scholar |
Milne T, Bull CM, Hutchinson MN (2003) Use of burrows by the endangered pygmy blue-tongue lizard, Tiliqua adelaidensis (Scincidae). Wildlife Research 30(5), 523-528.
| Crossref | Google Scholar |
Moore HA, Dunlop JA, Geyle HM, Greenwood L, Nimmo DG (2023) First you get the money, then you get the power: comparing the cost and power of monitoring programs to detect changes in occupancy of a threatened marsupial predator. Conservation Science and Practice 5(2), e12881.
| Crossref | Google Scholar |
Moyer-Horner L, Smith MM, Belt J (2012) Citizen science and observer variability during American pika surveys. The Journal of Wildlife Management 76(7), 1472-1479.
| Crossref | Google Scholar |
Murtaugh PA (2014) In defense of P values. Ecology 95(3), 611-617.
| Crossref | Google Scholar | PubMed |
Newman C, Buesching CD, Macdonald DW (2003) Validating mammal monitoring methods and assessing the performance of volunteers in wildlife conservation – ‘Sed quis custodiet ipsos custodies?’. Biological Conservation 113(2), 189-197.
| Crossref | Google Scholar |
Nielsen TP, Bull CM (2020) Effects of grazing regime on the relative body mass of the endangered pygmy bluetongue lizard (Tiliqua adelaidensis). Austral Ecology 45(4), 460-467.
| Crossref | Google Scholar |
Owens G, Gracanin A, Potts J, Young CM, Heinsohn R, Gibbons P, Stojanovic D (2024) Detection and density estimation for a cryptic species. Austral Ecology 49(2), e13467.
| Crossref | Google Scholar |
Pimm SL, Jones HL, Diamond J (1988) On the risk of extinction. The American Naturalist 132(6), 757-785.
| Crossref | Google Scholar |
R Core Team (2021) R: A language and environment for statistical computing. R Foundation for Statistical Computing, Vienna, Austria. Available at https://www.R-project.org/
Reynolds JH, Thompson WL, Russell B (2011) Planning for success: identifying effective and efficient survey designs for monitoring. Biological Conservation 144(5), 1278-1284.
| Crossref | Google Scholar |
Robinson NM, Scheele BC, Legge S, Southwell DM, Carter O, Lintermans M, Radford JQ, Skroblin A, Dickman CR, Koleck J, Wayne AF, Kanowski J, Gillespie GR, Lindenmayer DB (2018) How to ensure threatened species monitoring leads to threatened species conservation. Ecological Management & Restoration 19(3), 222-229.
| Crossref | Google Scholar |
RStudio Team (2024) RStudio: integrated development environment for R. RStudio, PBC, Boston, MA, USA. Available at http://www.posit.co/
Scheele BC, Legge S, Blanchard W, Garnett S, Geyle H, Gillespie G, Harrison P, Lindenmayer D, Lintermans M, Robinson N, Woinarski J (2019) Continental-scale assessment reveals inadequate monitoring for threatened vertebrates in a megadiverse country. Biological Conservation 235, 273-278.
| Crossref | Google Scholar |
Schmeller DS, Henry PY, Julliard R, Gruber B, Clobert J, Dziock F, Lengyel S, Nowicki P, Deri E, Budrys E, Kull T, Tali K, Bauch B, Settele J, van swaay C, Kobler A, Babij V, Papastergiadou E, Henle K (2009) Advantages of volunteer-based biodiversity monitoring in Europe. Conservation Biology 23(2), 307-316.
| Crossref | Google Scholar | PubMed |
Souter NJ, Michael Bull C, Hutchinson MN (2004) Adding burrows to enhance a population of the endangered pygmy blue tongue lizard, Tiliqua adelaidensis. Biological Conservation 116(3), 403-408.
| Crossref | Google Scholar |
Walls SC (2018) Coping with constraints: achieving effective conservation with limited resources. Frontiers in Ecology and Evolution 6, 24.
| Crossref | Google Scholar |
Wotherspoon L, de Oliveira Caetano GH, Roll U, Meiri S, Pili A, Tingley R, Chapple DG (2024) Inferring the extinction risk of Data Deficient and Not Evaluated Australian squamates. Austral Ecology 49(2), e13485.
| Crossref | Google Scholar |