

Flight heights in ibis and spoonbills: implications for collision risk
Batbayar Galtbalt A , Heather M. McGinness B * , Shoshana Rapley B , Micha V. Jackson B * , Luke R. Lloyd-Jones C , Freya Robinson D , Louis O’Neill B , Melissa Piper E , Micah Davies B , John Martin F , Richard Kingsford G , Kate Brandis G , Ralph Mac Nally H I , Marcel Klaassen J , Art Langston B , Jessica Hodgson B and Veronica Doerr B
A
B
C
D
E
F
G
H
I
J
Handling Editor: Shannon Dundas
Abstract
Millions of birds worldwide have become victims of airspace collisions with aircraft, wind turbines, power lines and other infrastructure. Mobile bird species using grassland, agricultural and urban habitats are at higher risk, including large wading waterbird species such as ibis, spoonbills, egrets and herons that are priorities for conservation.
This work aimed to improve understanding of ibis and spoonbill flight characteristics as a first step in assessing species vulnerability to collision, and developing risk mitigation.
We used high-accuracy GPS telemetry data to quantify (a) flight heights of three aggregate-nesting waterbird species, i.e. straw-necked ibis (Threskiornis spinicollis), Australian white ibis (T. molucca) and royal spoonbill (Platalea regia), and (b) variations in flight heights and modes in relation to atmospheric conditions for straw-necked ibis as a focal species.
Across all species and movements, flights mostly occurred at heights of between 150 and 550 m above ground level (AGL). Long-distance movements by straw-necked ibis reached a maximum height of 2800 m AGL; however, most flights (75%) occurred below 1000 m. Soaring and gliding were driven by the intensity of thermal uplifts and associated with longer-distance flight legs. Where thermal uplift was absent, birds flapped at relatively low and constant heights compared to when uplift was present. For straw-necked ibis, 29% of all flight fixes were in the rotor swift zone of wind turbines (20–250 m), but this figure increased to 53% if only flapping flights were considered. Flight heights broadly overlapped with general aviation zones, notably during aircraft take-off and landing phases.
There are clearly collision risks associated with wind turbines and aircraft flight zones when considering the flight characteristics and ecology of large aggregate-nesting waterbirds such as ibis and spoonbills.
When assessing spatially and temporally explicit scenarios of risk for such species, we suggest that several factors should be considered, including (a) atmospheric, weather and seasonal conditions, (b) common routes or flyways used during long-distance movements, (c) the locations of important nesting sites and associated foraging sites, (d) the locations of important stopover and overwintering sites, and (e) the timing of flights.
Keywords: aircraft, atmospheric condition, flapping, gliding, soaring, thermal uplift, turbine, waterbird.
Introduction
Human engineering in the airspace interacts with the flight patterns of many bird species. Millions of birds are killed annually in USA alone in collisions with human infrastructure, including powerlines, aircraft, wind turbines, tall buildings and vehicles (Erickson et al. 2005; Loss et al. 2014a, 2014b). These risks have generally increased over time as human populations have grown economically and in size (Sodhi 2002; Pfeiffer et al. 2018). Significant resources have gone into documentation and avoidance of bird strikes with aircraft because of the risk to human life and costs to the aviation industry (DeVault et al. 2018; Pfeiffer et al. 2018), and strike rates have been steadily increasing worldwide (McKee et al. 2016). Impacts from bird strikes with wind turbines and powerlines have also been increasingly recognised as a cause for concern in the context of the huge expansion of renewable energy infrastructure that has occurred over the past decade (Conkling et al. 2022). However, while some studies have demonstrated the sensitivity and vulnerability of avian populations to collisions (Beston et al. 2016; Conkling et al. 2022; Gauld et al. 2022; Weiser et al. 2024), few have examined variations in these collision risks with varying atmospheric conditions (Péron et al. 2017; Arrondo et al. 2021; Morant et al. 2024). Such knowledge would enable more accurate risk calculations and potentially inform strategies for improved mitigation measures, for example, by identifying periods of heightened collision risk that endanger birds, infrastructure or aviation.
Migratory and partially migratory bird species using grassland, agricultural and urban habitats are at high risk of collision, including large wading waterbird species such as ibis, spoonbills, egrets and herons, storks and cranes, in part owing to their social (flocking) behaviours and large body sizes (Thaxter et al. 2017). Such species commonly nest in large aggregations at important wetlands and are priorities for conservation management actions and international agreements such as Ramsar because of declines in populations and their habitats nationally and worldwide (Kirby et al. 2008; Brandis et al. 2018). Waterbirds such as these are often attracted to water sources and grasslands around airports and other infrastructure, and waterbirds as a group are the most likely to cause serious damage to aircraft when strikes occur (Blackwell et al. 2008; Blackwell et al. 2013; DeVault et al. 2016). However, flight characteristics for such species in Australia are poorly understood, particularly during long-distance trips, when a range of potential airspace obstacles are likely to be negotiated during a single flight.
Straw-necked ibis (Threskiornis spinicollis; SNI), Australian white ibis (Threskiornis molucca; AWI) and royal spoonbills (Platalea regia; RSB) are emblematic of Australian inland aggregate-nesting waterbird species. In response to Australia’s extreme variability in environmental conditions, they use both coastal and inland areas and are usually nomadic or partially migratory, except during defined periods such as nesting. Daily movements between roosting and foraging sites generally occur along predictable routes at set times and average <10 km in length (McGinness et al. 2024a). However, when undertaking longer-distance nomadic or partially migratory movements, flight distances, routes and timing are more variable (McGinness et al. 2024b, 2024a; Nicol et al. 2024), making it more difficult to predict collision risks (Watts et al. 2018). Although precise routes may be difficult to predict for such movements, better understanding of flight heights and flight modes used by such species during longer-distance movements would inform collision risk assessments and form a basis for further work predicting risk for other similar species also known to be involved in collisions.
To address these knowledge gaps and improve assessment of collision risk for large wading waterbirds, in this study we aimed to determine the following: (1) flight heights used by three satellite-tracked aggregate-nesting species, SNI, AWI and RSB; (2) flight modes of SNI as a case study species for which more detailed data were available, with the hypothesis that SNI mainly undertake flights dominated by soaring and gliding during long-distance movements; (3) how the flight characteristics of SNI (i.e. flight height, flight mode) are associated with prevailing atmospheric conditions including wind, cloud, thermal uplift and air temperature; and (4) how SNI flight characteristics and their relationship with atmospheric conditions may influence collision risks with human infrastructure in the airspace. We focused on selected SNI individuals for the latter three detailed analyses because of the availability of high-frequency GPS data for some individuals that were not available for the other two species.
Study area
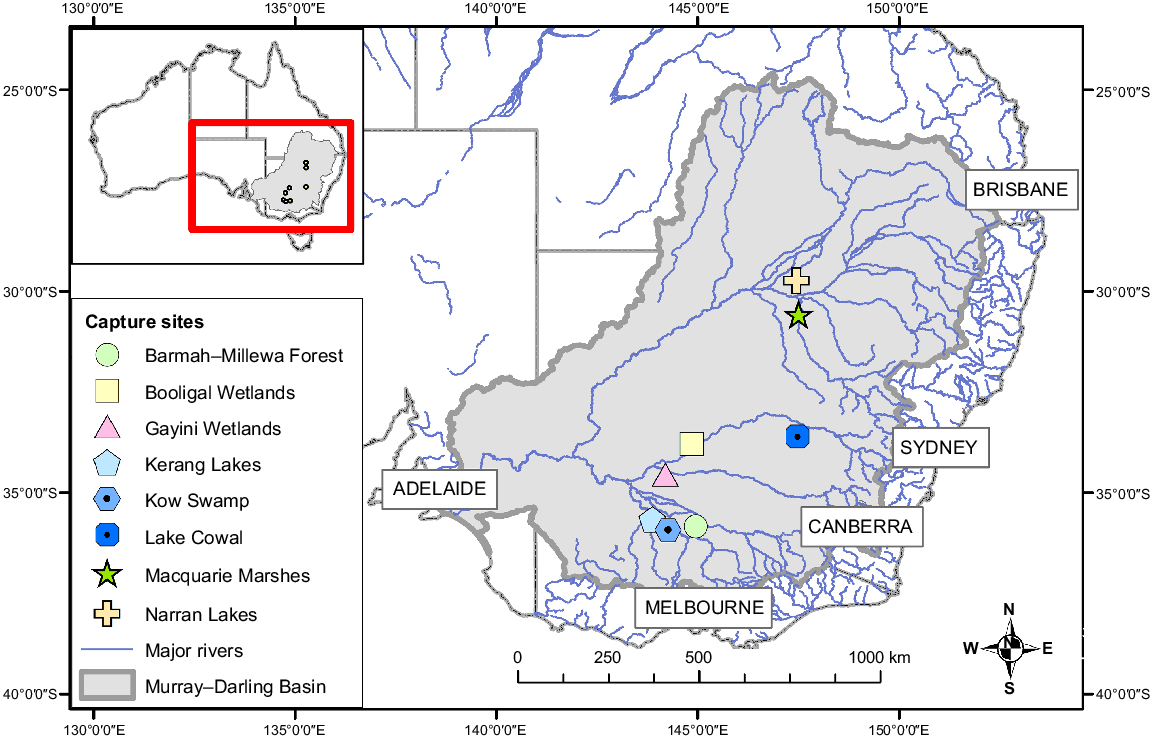
Transmitters were deployed at eight breeding sites within the Murray–Darling Basin in south-eastern Australia (Fig. 1) between 2016 and 2023. The Murray–Darling Basin (‘the Basin’) is ≥106 km2 and is a primary focus for intensive water management and water policy reform in Australia (Murray–Darling Basin Authority 2019, 2020), while facing significant challenges from climate change (Gawne and Thompson 2023; Thompson et al. 2024). It is mostly temperate in the south, semi-arid in the west and subtropical in the north. The hydrology of the Basin is highly variable spatially and temporally, with substantial transmission losses through long lowland rivers and high evapotranspiration rates (Stewardson et al. 2021). Consequently, many of the Basin’s rivers flow intermittently, with natural longitudinal and lateral disconnections. In wet years, floods move slowly and spread out to inundate extensive floodplain and wetland areas (Stewardson et al. 2021). Many of the 16 internationally significant wetlands in the Basin are located in these large floodplains and are dependent on flooding, including Ramsar-listed wetlands (see https://rsis.ramsar.org/, accessed 25 September 2024) and some of the most important aggregate-nesting ibis and spoonbill breeding sites on the continent (Kingsford et al. 2013; Bino et al. 2021).
Materials and methods
Species selection and transmitter deployment
Straw-necked ibis (SNI) was chosen as the primary species for transmitter deployment because it is a focal species for Australian wetland and water managers that nests in large numbers in major inland wetlands managed with environmental water and engages in highly nomadic movements across a wide geographic range (McGinness et al. 2024a). Two other species that frequently nest and forage with straw-necked ibis were also tracked, in smaller numbers, to explore potential differences among species, namely, the royal spoonbill (RSB) and the Australian white ibis (AWI). These species are highly mobile, often moving nomadically and using remote areas (McGinness et al. 2024a) and therefore on-ground observation of flight heights particularly during long-distance flights is not feasible, making GPS tracking an ideal method. Flight modes and potential collision risks during long-distance flights are of particular interest, because collision risks during such movements have not been assessed previously.
We captured birds at breeding sites either by hand, with leg-nooses or with a net launcher, depending on the site and environment. Birds were placed in large clean calico bags for weighing and other measurements, and fitted with solar-powered GPS satellite transmitters from Druid, Geotrak or Ornitela. Transmitters were attached as a ‘backpack’ using Teflon ribbon or Spectra ribbon (Bally Ribbon Mills) harnesses, fitted either as wing-loops with a join at the keel (SNI and AWI and some RSB) or as leg-loops (most RSB). Harness design was based on designs used in other species (Karl and Clout 1987; Roshier and Asmus 2009; Thaxter et al. 2014; Jirinec et al. 2021) modified and improved over time, with different types of weak links being used in different years. Transmitters weighed 20–22 g, ranging from 1.0 to 1.9% of bird bodyweight (Kenward 2014). All work was subject to approval by an Animal Ethics Committee, including assessment and reporting of any welfare impacts, and no adverse effects of satellite tracking were observed. Many of the transmitters used yield data monitoring activity levels, voltage and temperature; analysis of these data in conjunction with transmitter cease dates and data describing other potential factors (e.g. weather extremes, predation) is underway and will form the basis of a separate publication.
Data were used from 74 individual birds tracked for between 90 days and 6 years continuously, including 41 SNI, 30 RSB and 3 AWI. Data intervals ranged from one position fix every 20 s to one fix every 3 h, depending on the transmitter. Only high-frequency data were used for flight mode classification analyses; subsequent sections describe this in more detail. Transmitters recorded height above mean sea level in addition to longitude, latitude and timestamp, with GPS (global positioning system) horizontal accuracy of <26 m or better, based on manufacturer’s stated accuracy values and on-ground testing of stationary devices (Chelak et al. 2025). Height above ground level (AGL) was calculated from height above mean sea level by using a 30-m digital elevation model (Safi et al. 2013). Vertical height errors in GPS transmitters can range from 1 to 33 m and there is greater variation in data with low-frequency fixes (Byrne et al. 2017; Lato, et al. 2022; Schaub et al. 2023; Chelak et al. 2025) For example, Schaub et al. (2023) reported a mean height for low-frequency transmitters of 6.3 m (±4.6 s.d.) m compared with a mean of 2.4 ± 1.0 m for high-frequency data, at least partly because of the greater number of satellites used per fix in high-frequency data. Ornitela transmitters typically use large numbers of satellites to determine each fix, and independent tests have shown mean horizontal errors of only 6.5–8 m (Lato et al. 2022; Ferraz et al. 2024) and vertical errors of only 3.2 m (Lato et al. 2022). We assumed that our Druid transmitter vertical height accuracy was similar to those for Ornitela transmitters, because the Druid transmitters typically recorded high-frequency data in continuous bursts when battery levels and reception were good, which is associated with use of higher numbers of satellites and higher accuracy (Schaub et al. 2023). The use of additional satellite systems such as GNSS or GLONASS in addition to GPS in Ornitela and Druid transmitters is also likely to reduce error (Schaub et al. 2023). Therefore, we considered that horizontal and vertical errors were negligible compared with the scales at which these species move (i.e. the >2000 m range of flight heights recorded for these species, and the long distances and fast rates that they travel). In addition, with modes of flight heights falling within primary collision risk height zones, it is more likely that these data underestimate rather than overestimate collision risk (Schaub et al. 2023). We therefore consider that inferences regarding potential intersection of flights with collision risk zones are reasonable; however, it is difficult to predict the effects of error variation on results and we recommend caution when interpreting data away from the modes (Schaub et al. 2023).
Analysis structure
We conducted a series of stepped complementary analyses by using selected fit-for-purpose datasets, as follows:
Generation of summary statistics describing flight heights by species, using the total dataset of 74 birds, including all fix frequencies and individuals, which comprised 566,756 position fixes and 10,353 days of tracking across 6 years.
Classification of flight modes during flights of >10 km (i.e. movements greater than the average daily movement from roosts to foraging locations, representing long-distance movements such as nomadic site shifts; McGinness et al. 2024a). This classification used data from individuals equipped with transmitters recording extremely high-frequency data (<20-s fixed interval). Data suitable for this purpose were available for two straw-necked ibis: Druid transmitter #5247 ‘Han Solo’, tracked for 792 days, and Druid transmitter #6490, ‘Lilly’, tracked for 192 days. This dataset comprised 97,100 fixes spanning 1362 events (403 flight legs, 959 on-ground periods).
Analysis of flight height in relation to atmospheric conditions during flights of >10 km for 16 straw-neked ibis individuals, selected because (a) their transmitters recorded regular GPS location data (e.g. every 20 min) over at least 90 days that was suitable for flight analysis, (b) their movements included continuous flight legs of >10 km, and (c) sufficient height fixes were logged for quantitative analyses (>50). This dataset comprised 390 days of tracking data, including 755 flight legs, and 73,130 position fixes, which were annotated with atmospheric data.
Analysis of overlaps between flight heights of straw-necked ibis (n = 16, as above) and wind turbine and aircraft zones by calculating the percentage of in-flight fixes within each zone.
Flight mode classification
GPS accuracy is typically lower on stationary devices than on moving devices (Lato et al. 2022; Schaub et al. 2023); therefore, we filtered the data to reduce the frequency of height errors and improve the efficiency of the flight mode classification, initially removing data where ground speeds recorded by transmitters were <1 m s−1. We also removed data associated with short flights of less than 10 km in distance and short on-ground events of less than 4-h duration. We used k-means clustering to allow classification of the tracking data in different movement modes, employing a similar approach to that in Bergen et al. (2022). A priori distinct movement modes that we hoped to identify through the clustering process were (a) on-ground movements, (b) flapping flight, (c) soaring (non-flapping ascending flight) and (d) gliding (non-flapping descending flight). We calculated instantaneous ground speed (m s−1), ground speed calculated from previous location (m s−1), flight height (AGL), vertical rate of change (m s−1), absolute vertical rate of change (m s−1), and absolute turning angle (degrees) as input variables for the classification model. Prior to running the k-means, we square-root transformed variables as the k-means algorithm tends to be more effective at identifying meaningfully distinct clusters if distributions of variables are not highly skewed. Subsequently, we centred and scaled all variables by subtracting the mean and dividing by standard deviation to make variables on a similar scale. Then, we ran the k-means model with two to seven clusters, each with 10 random starting centroids (nstart). This process allowed the dataset to guide the ideal number of modes or clusters, chosen in combination with elbow and bootstrapped average silhouette methods as described in detail by Bergen et al. (2022). We examined the characteristics of each cluster by evaluating the relationship between these clusters and each of the input variables by using a series of boxplots. Identified relationships were used to qualitatively determine the likely flight mode for each cluster.
Atmospheric conditions and flight height
We considered a flight leg to be consecutive fixes with ground speeds recorded by transmitters of greater than 1 m s−1. Then, we retained only those flight legs covering a minimum distance of 10 km (i.e. movements greater than the average daily movement from roosts to foraging locations; McGinness et al. 2024a) to focus on longer-distance migratory or nomadic flights when birds are thought to be at higher risk (Thaxter et al. 2017; Kamata et al. 2023).
To model flight characteristics in relation to atmospheric conditions, we used two different dependent variables, which were calculated for each flight leg. First, we chose the standard deviation of flight heights because this may provide a proxy for flight modes, with more variation indicating soaring and gliding flights (Supplementary Fig. S1). Second, we used upper flight height (i.e. 95 percentile for all recorded flight heights during the flight leg). Explanatory variables included mean cloud cover (%), mean wind support (the length of the wind vector in a bird’s flight direction, m s−1), mean thermal uplift (m s−1) and flight distance (km) for each flight leg. We used generalised linear mixed effect models (lmer) to test the effect of atmospheric conditions on flight mode (Model 1), upper flight height (Model 2), across all flight legs, including individual as random factor (16 individuals). Prior to running the models, we examined the data for multicollinearity of explanatory variables by using scatter plot matrix and Pearson’s correlation coefficient (Fig. S4). We found that all correlation coefficients among the explanatory variables were |r| ≤ 0.26, which is below the cut-off value of 0.7 suggested by Dormann et al. (2013). We scaled all four explanatory variables before running the models and we report scaled effect sizes in corresponding summary tables.
For annotating position fixes with atmospheric information, atmospheric data covering the extent of our study area (−14 to −39°S, 135 to 154°E) were downloaded from the ERA5 dataset available on the Copernicus Data Store (Hersbach et al. 2020). The ERA5 dataset has a spatial resolution of 28 km and temporal resolution of 1 h for 37 atmospheric pressure levels from 1000 to 1 hPa. For each of the 73,130 position fixes, we extracted the corresponding cloud cover and wind speed (zonal-u, meridional-v) data closest to the timestamp of each position fix. To allow consideration of the entire airspace used by a bird during its long-distance flights and not only at the altitude it was flying at the moment the position fix was taken, cloud cover and wind speed data were extracted for six pressure levels corresponding to altitudinal layers spanning from 100 to 2500 m above mean sea level. Wind support (the length of the wind vector in a bird’s flight direction) in each of these layers was calculated from zonal-u and meridional-v wind speed data following Safi et al. (2013). Thermal uplift in all six altitudinal layers at each position fix was calculated from potential temperature, instantaneous surface heat flux, and boundary layer height also downloaded from the ERA5 dataset, following Bohrer et al. (2012).
Flight heights overlap with wind turbine and aircraft heights
We compared the flight heights of SNI during movements with rotor heights of wind farms and flight heights of aircrafts. In the case of wind farms, we identified overlap in flight heights and turbine heights by calculating the percentage of SNI in flight fixes within the danger zone (i.e. 20–250 m AGL, also known as rotor-swift zone) of wind turbines (Department of Transport and Planning 2024; NSW Department of Planning and Environment, see https://www.planningportal.nsw.gov.au/major-projects, accessed 25 September 2024). In the case of aircraft, we calculated the percentage of SNI in flight fixes within the standard flight heights of commercial aviation (3352–12,000 m above sea level, ASL), general charter aviation (1524–4572 m ASL), general airwork aviation (610–3048 m ASL) outside terminal airspace and aviation inside terminal airspace during take-off and landing (≤914 m AGL) (Civil Aviation Safety Authority 2024).
Ethics statement
All research protocols were approved by an authorised Animal Care and Ethics Committee, according to the Australian code of practice for the care and use of animals for scientific purposes. On-ground fieldwork activities were conducted under New South Wales and Victoria Scientific Licences 102180 and 10010534.
Results
Flight height statistics
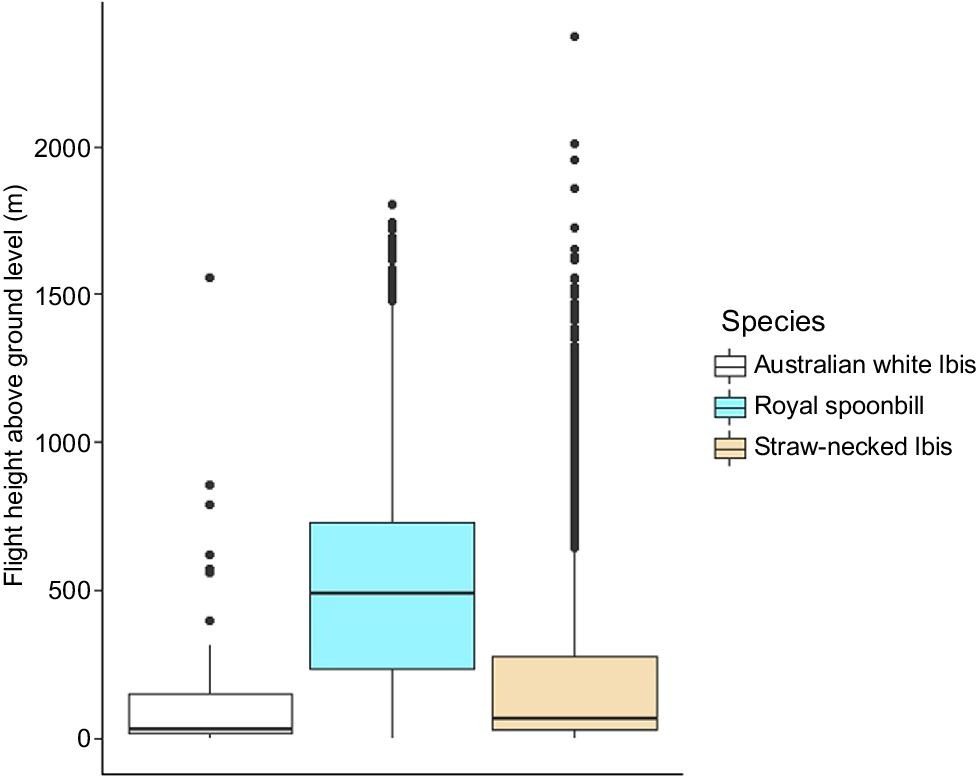
Across all movements for all individuals of all three species (n = 74), flights mostly occurred at heights of between 150 and 550 m AGL, with mean heights varying from 160 m AGL (±286 s.d.) (n = 3 individuals) in AWI, 207 ± 295 m (n = 41 individuals) in SNI and 518 ± 358 m (n = 30 individuals) in RSB (Fig. 2). Long-distance flights by SNI mainly occurred at less than 1000 m AGL (mean = 743 m, 3rd quantile = 993 m, max. = 2809 m). The maximum displacement on a single day as observed in a SNI was 538 km, including 9 h of non-stop flight.
Flight mode classification
Flight modes were classified using detailed data from two SNI individuals with <20-s GPS fix intervals. The elbow method did not indicate an obvious number of clusters in the data (i.e. there was no clear ‘elbow’ in the plot, Fig. S2); however, the bootstrapped silhouette-width method had highest average silhouettes with two (mean = 0.47, s.d. = 0.01) and four clusters (mean = 0.40, s.d. = 0.01; Fig. S2). Since the two-cluster alternatives apparently distinguished only between on-ground movements v. in-flight movements, we proceeded with the four-cluster alternative. Cluster one had a ground speed near zero (mean = 0.35 m s−1, s.d. = 1.23) at low heights above ground (mean = 16 m AGL, s.d. = 25), little vertical change (−0.003 m s−1, s.d. = 0.16), and highly variable turning angles (mean = 110°, s.d. = 54). This pattern is indicative of a bird being ‘on-ground’ (i.e. not flying; Fig. S3). Fixes in cluster two had moderate velocity (mean = 13.3 m s−1, s.d. = 4.24) and less tortuosity (mean = 27.7°, s.d. = 33.7) while tending to be level (mean = 0.01 m s−1, s.d. = 0.85) and close to ground (mean = 292 m AGL, s.d. = 257), characteristic of predominantly ‘flapping’ flight. Fixes in cluster three had moderate velocity (mean = 10.6 m s−1, s.d. = 3.63), positive vertical rates (mean = 2.46 m s−1, s.d. = 1.53), and tortuous flight paths (high values of absolute turning angle; mean = 57.5°, s.d. = 49.2) and occurred at high heights (mean = 627 m AGL, s.d. = 323). We therefore interpreted points in cluster three to be indicative of a bird gaining height, most likely by ‘soaring’. Finally, points in cluster four exhibited fast velocities (mean = 19.8 m s−1, s.d. = 4) and straight (non-tortuous; mean = 11.7°, s.d. = 18.7) flight paths indicated by absolute turning angle values near zero. These fixes also occurred at high heights (mean = 623 m AGL, s.d. = 341) and were in descending flight (negative vertical rates; mean = −2.61 m s−1, s.d. = 1.75). We therefore interpreted fixes in cluster four as indicative of a predominantly ‘gliding’ flight. Fixes in clusters three and four (i.e. mostly ‘soaring’ or ‘gliding’) comprised up to 87% of each flight leg and were positively associated with flight height (median = 50%, range = 0–87%, Fig. S1). Of all 383 flight legs, 196 were dominated (>50% fixes) by clusters three and four, and the remaining 187 flight legs were dominated by cluster two (e.g. Fig. 3).
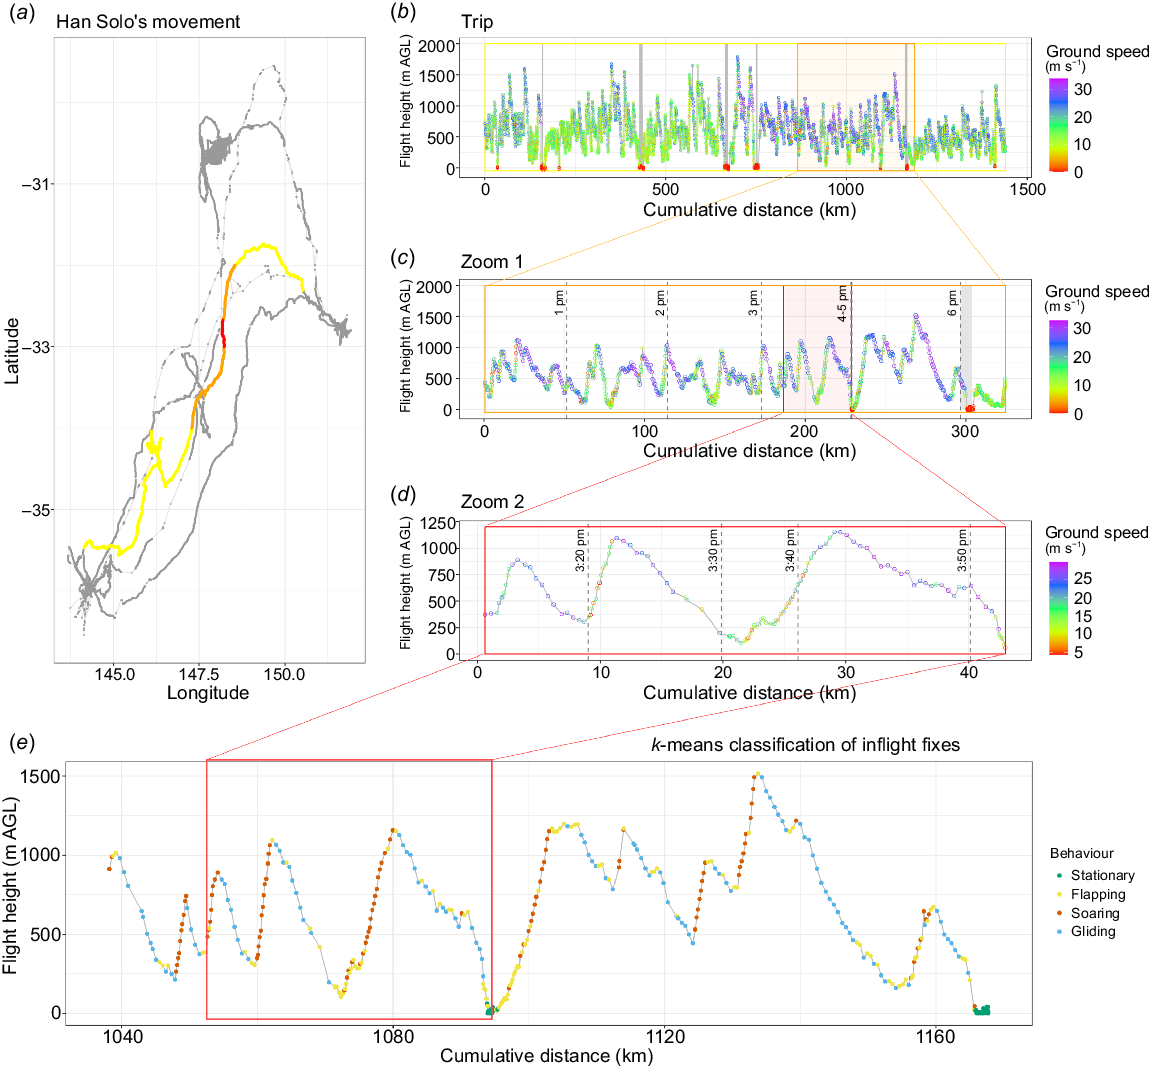
An example of detailed flight characteristics for an individual straw-necked ibis, eastern Australia, 2020–2022. Panel (a) shows 3 years of continuous tracking data. Panel (b) depicts flight height and flight speed during a 5-day, 1440-km, northward trip (15–20 February 2020) from Kow Swamp in Victoria to the Hunter River wetlands in New South Wales. Grey vertical lines indicate night times (from 18:00 to 06:00 hours), when the bird was on-ground. (c) Data for a day (22 h), 325-km-long section of that trip. (d) Data for a 40-min, 43-km section of the trip. (e) The k-means classification of the fixes in flight modes over a section of the trip spanning 9 h and 129 km, including the section depicted in d. Flight modes are shown as on-ground (green), flapping (yellow), soaring (red) and gliding (blue).
Atmospheric conditions and flight height
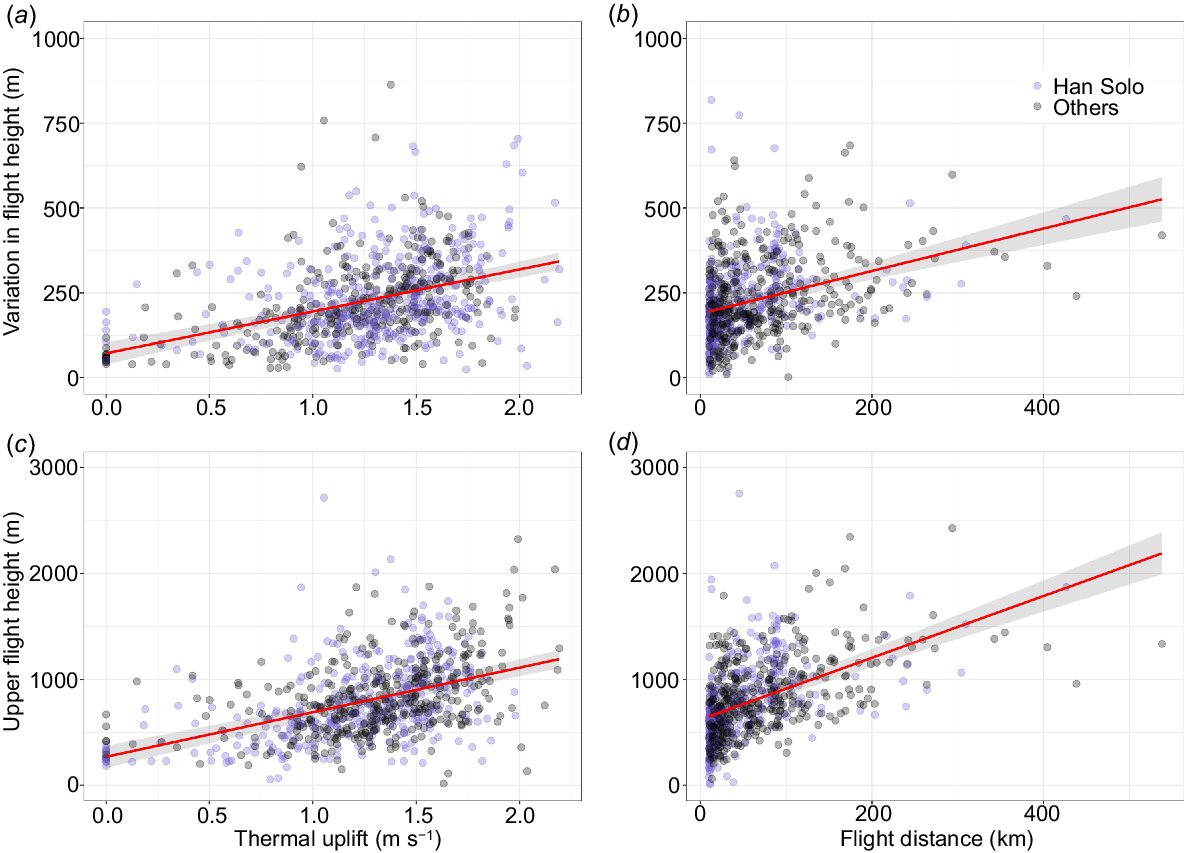
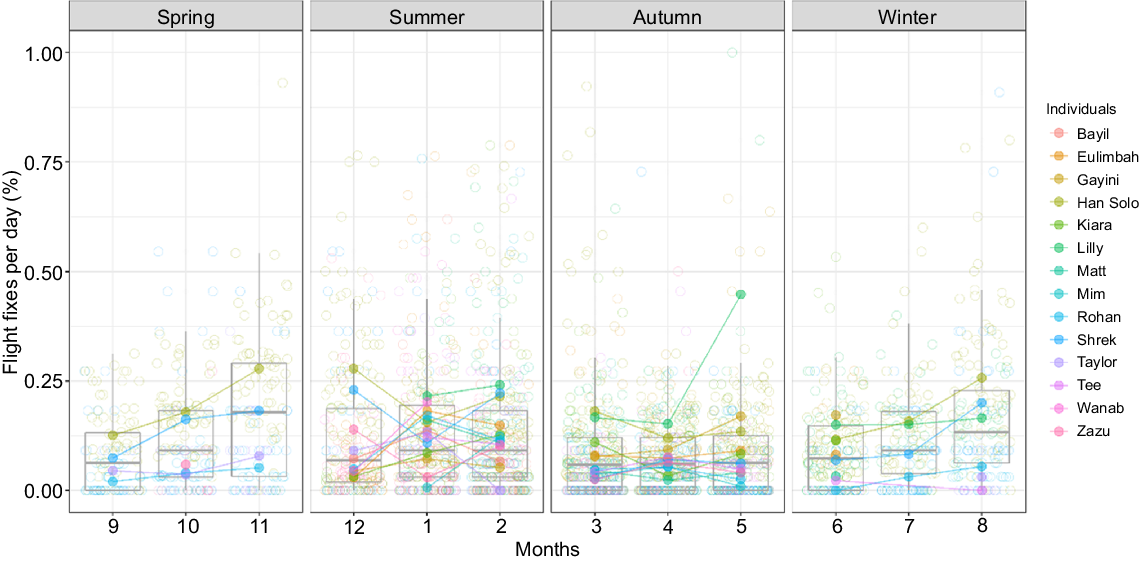
The variation in flight heights was strongly associated with prevailing atmospheric conditions and the distance of the trip (Table 1) and there was collinearity of atmospheric variables for inflight fixes (Fig. S4). Thermal uplifts and flight distances were positively related with upper flight height and the variation in flight height, which we interpret as a proxy for the frequency of soaring and gliding flights (Fig. 4). The time spent in flight each day varied greatly across individuals and seasons (Fig. 5, 6) with daily mean in-flight fix percentages highest (11% ± 4%) in November and lowest during April–June (1–2%; Supplementary Tables S1, S2).
| Response | Covariate | Slope | s.e. | t | P-value | Fixed R2 | Random factor R2 | |
|---|---|---|---|---|---|---|---|---|
| Variation in flight height | Intercept | 226.86 | 9.15 | 24.81 | <0.001 | 0.28 | 0.04 | |
| Flight distance | 39.69 | 4.33 | 9.17 | <0.001 | ||||
| Thermal uplift | 50.58 | 4.43 | 11.41 | <0.001 | ||||
| Wind support | 1.63 | 4.3 | 0.38 | 0.70 | ||||
| Cloud cover | −6.29 | 4.31 | −1.46 | 0.14 | ||||
| Upper flight height | Intercept | 797.84 | 33.71 | 23.67 | <0.001 | 0.39 | 0.06 | |
| Flight distance | 185 | 12.79 | 14.47 | <0.001 | ||||
| Thermal uplift | 172.46 | 13.12 | 13.15 | <0.001 | ||||
| Wind support | 7.37 | 12.74 | 0.58 | 0.56 | ||||
| cloud cover | −23.01 | 12.71 | −1.81 | 0.07 |
Individuals were included in the lmer models as a random factor. Models were run on 744 flight legs across 16 individuals.
Marginal effect plots for significant effects of atmospheric conditions and flight distance on flight characteristics for straw-necked ibis (SNI, n = 16, 2016–2022, eastern Australia). The effect of (a) thermal uplift and (b) flight distance on the variations in flight height. The effect of (c) thermal uplift and (d) flight distance on flight height.
Seasonal pattern in flight frequency of straw-necked ibis (SNI, n = 16) in eastern Australia 2016–2023, represented by the percentage of in-flight fixes per day across season. Night fixes (from 19:00 to 07:00 hours) are excluded because SNI do not fly at night. Daily percentage estimates for each individual are indicated by coloured circles, whereas coloured dots indicate mean daily flight frequency per month per individual. Boxplot indicates the median (horizontal line in the box) and distribution of all percentage values for each month across all individuals.
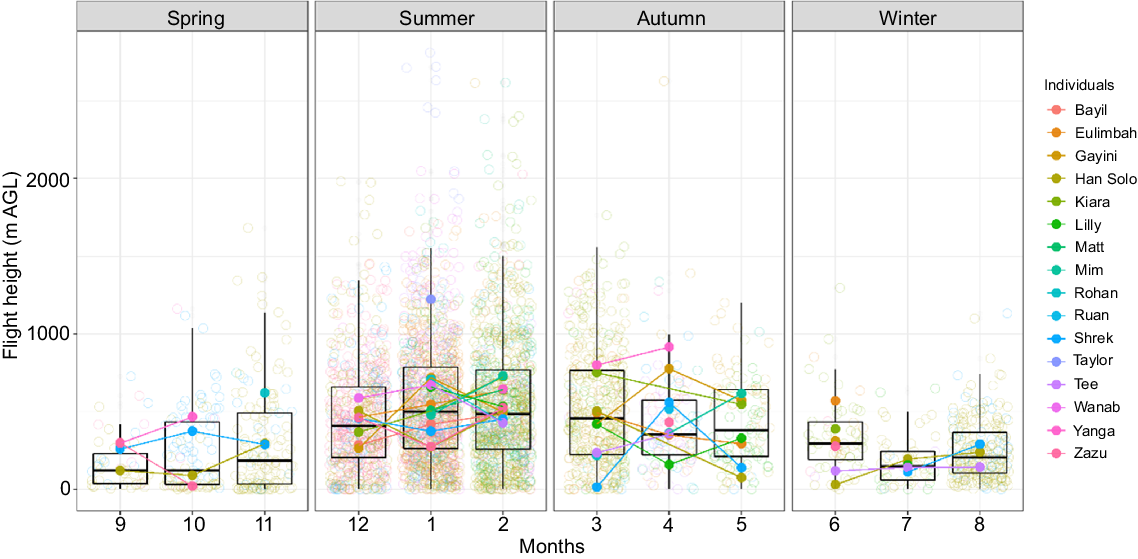
Seasonal pattern in flight height of straw-necked ibis (SNI, n = 16) in eastern Australia 2016–2023. Raw flight heights are represented by jittered circles, whereas coloured dots indicate monthly mean flight height per individual. Boxplots indicate the median (horizontal line in the box), middle 50% quantiles (box), and 95% quantiles (whiskers) of flight height measurements for each month across all individuals.
Flight heights overlap with wind turbine and aircraft heights
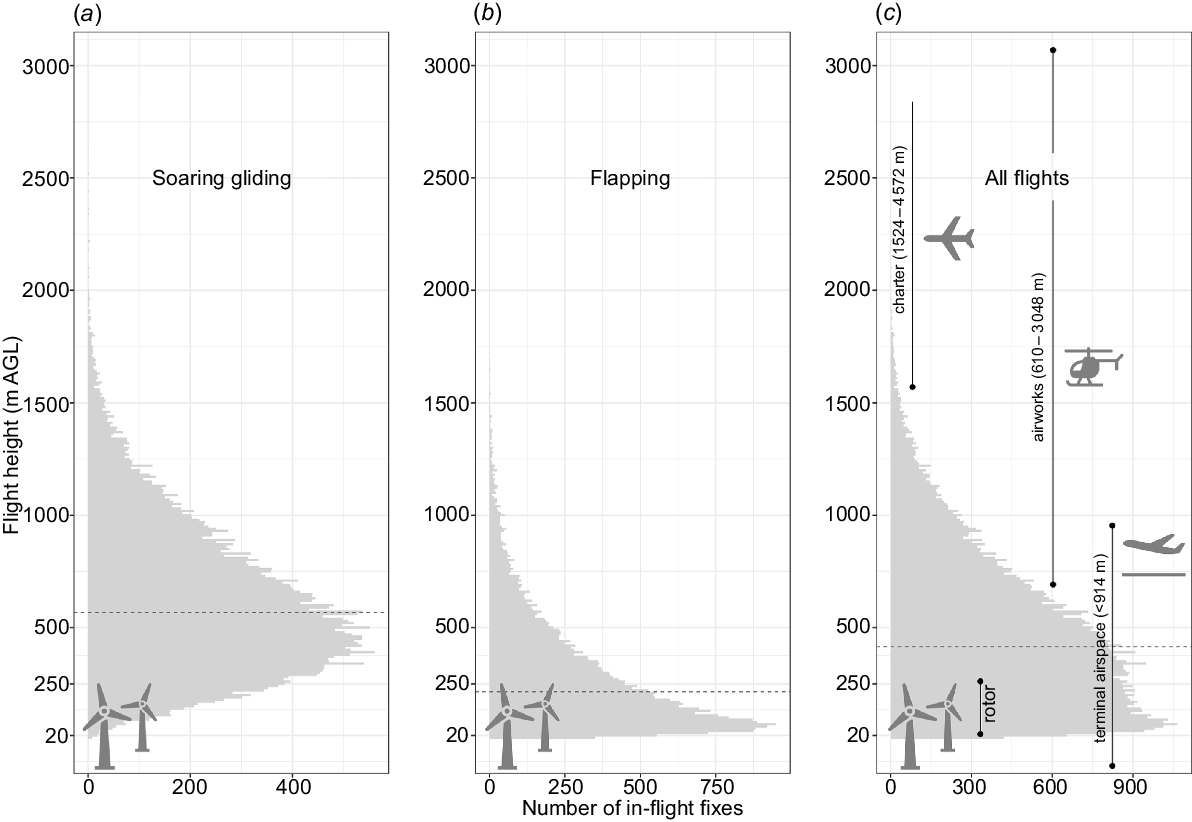
The flight heights of SNI broadly overlapped with both wind turbine rotor heights and aircraft flight heights during take-off and landing phase. On long-distance trips, ~29% of all flight fixes overlapped with the height of the rotor swift zone of wind turbines, but this figure increased to 53% if only flapping flights were considered (Fig. 7). Approximately 79% of all inflight fixes were within the operational height range of take-off and landing phases at the terminal airspace. Among the aviation types, flight height of general aviation for airworks had highest overlap (48%) whereas only 2% of inflight fixes overlapped with charter general aviation outside terminal airspace. By contrast, commercial aviation operates well above the flight heights of these species outside terminal airspace.
Flight height distribution of straw-necked ibis (SNI) when in (a) soaring and (b) flapping flight and (c) for all flights combined; 2016–2022; eastern Australia. Flight height measurements (m AGL) are binned for every 10 m of height. Data in (a) and (b) are from two individuals with particularly high frequency data, for which we were able to classify flight mode for all fixes. Data in (c) are from 16 tracked individuals combined. Black dashed lines indicate median height.
Discussion
Aggregate-nesting ibis and spoonbills are large highly mobile species that are locally common and are known to be involved in collisions with human infrastructure occupying airspace such as powerlines, wind turbines and aircraft (Australian Transport Safety Bureau 2019). However, their flight characteristics and notably flight heights are often poorly understood, making assessments of collision risk difficult. Better understanding of the birds’ flight characteristics is important, notably because of the rapid expansion of human infrastructure into airspace used by these species throughout their lifecycles, including both long-distance and local movements.
In general, most birds use some combination of flapping, soaring and gliding flight, with the energy cost of flapping flights increasing steeply with increasing body size, resulting in large birds achieving larger energy savings by soaring and gliding (Hedenström and Alerstam 1995). On the other hand, there is a time cost to choosing soaring or gliding over flapping flight, especially during long-distance movements, with the result that the optimal strategy for many larger birds may be to use soaring flight when thermals are available but flapping flight otherwise (Hedenström and Alerstam 1995). The flight characteristics of raptors and seabirds, including the implications of soaring flight on energy expenditure and how flight characteristics relate to atmospheric conditions, are increasingly well-understood (Bohrer et al. 2012; Sachs et al. 2012; Duriez et al. 2018). But much less is known about these characteristics for large wading waterbird species; species whose habitat preferences and behaviours may mean they are at increased risk for collisions.
Our study not only describes the typical altitudes at which these species of ibis and spoonbill fly, but the detailed study on SNI also highlighted variation in flight modes during long-distance flights and how flight characteristics may vary with prevailing atmospheric conditions. The data show that these species are capable of using the entire air column during their long-distance movements, soaring up and gliding down repeatedly during a flight leg. This is considerably different from many birds that predominantly engage in flapping flight or cruise at a relatively constant altitude for prolonged periods of time. Thermal uplift had a positive effect on both the upper flight heights and the variation in flight height (interpreted as a higher proportion of soaring and gliding during the leg). Thermal uplift is therefore a key variable in predicting the likelihood of birds being in airspace during particular periods or in particular locations and therefore the potential collision risk.
Longer-distance movements, which can occur any time of year but are more prevalent in spring and autumn (McGinness et al. 2024a), were associated with higher and more variable flight heights and therefore potentially a greater risk of collision with aircraft in particular, than with other infrastructure. These movements are typically conducted in flocks, and this together with the large body masses of these species also increases the effects of collisions with aircraft travelling at speed and at higher altitudes. If common routes or ‘flyways’ used during long-distance movements and their timing are known (e.g. McGinness et al. 2024c) these could then be considered in planning airspace use. For example, common routes or ‘flyways’ could be avoided during peak bird movement times. Higher-altitude strikes (>152 m) are more frequent during months when birds are migrating (September–November and April–May) and also at night (Dolbeer 2006). Where the locations of important stopover and overwintering sites are known, planning of infrastructure and airspace use could also avoid collisions by avoiding those areas, particularly at key times of year.
Shorter-distance movements were typically at lower heights coincident with heights of fixed infrastructure such as wind turbines and powerlines. Given this intersection, there are particular situations in which risk of collision with these obstacles may need to be managed uniquely for aggregate-nesting ibis and spoonbill species. Each spring and summer, nesting aggregations of hundreds to many thousands of individuals of ibis and spoonbills become active in specific important wetland sites. Under certain climatic conditions (e.g. La Niña, wet periods), numbers of breeding birds at any one site may boom to hundreds of thousands. During the breeding season, these birds undertake frequent flights to forage in surrounding areas, usually moving in flocks (McGinness et al. 2024d, 2024b). Consequently, zones between nesting and foraging sites are likely to be at increased risk of collisions. This information together with the flight heights and modes used by these species could be used to ensure that infrastructure does not obstruct flight routes around important nesting sites.
The species studied here are similar in many physical and behavioural characteristics to other species in the Threskiornithidae family (ibis and spoonbills), which has a very broad distribution globally and comprises 36 species (Hancock et al. 2010). However, there are some species-specific differences when habitat and movement preferences are considered that may affect collision risks at a species level. For example, straw-necked ibis is more generalist in its habitat selection than are royal spoonbills, frequently foraging in well-watered grassy areas such as airports and sports grounds (Andrews et al. 2022; McGinness et al. 2023, 2024b) which may put them more at risk of collisions at airports than are royal spoonbills; many species commonly struck by aircraft prefer turf and are habitat generalists (Blackwell et al. 2013). By contrast, outside of airport environments royal spoonbills may be more at risk, because of the heights at which they fly and the fact that they frequently fly at night; analyses of avian collisions with aircraft have found that risks are greatest in the zone 152–1067 m (500–3500 feet) and at night (Dolbeer 2006). Australian white ibis is increasing in abundance in coastal cities in particular, which is causing conflict with major airports, with a range of measures being taken to deter them (Martin et al. 2010; Smith et al. 2013; McKee et al. 2016). These examples demonstrate that understanding species ecology is critical when considering collision risk.
Flight heights of ibis and spoonbills clearly intersect with human airspace use including widespread uses such as aviation and expanding industries such as wind turbines. Management to reduce collision risk for conservation of these species and human safety could clearly be informed by the fine-scale knowledge of bird movements available through satellite telemetry. When assessing spatially and temporally explicit scenarios of collision risk for our study species and similar waterbirds, we suggest that on the basis of data presented here, there are several factors that should be considered, including (1) atmospheric and seasonal conditions, (2) common routes or flyways used during long-distance movements, (3) the locations of important nesting sites and associated foraging sites, (4) the locations of important stopover and overwintering sites, and (5) the timing of flights. Consideration of these factors will enable more accurate risk assessments and potentially inform strategies for improved mitigation measures.
Data availability
The data that support this study will be shared upon reasonable request to the corresponding author.
Declaration of funding
The original research that formed the basis of this article was co-funded by the Commonwealth Environmental Water Holder (CEWH) and the Commonwealth Scientific and Industrial Research Organisation (CSIRO) through the CEWH Monitoring, Evaluation and Research project (2019–2024) and the CEWO Environmental Watering Knowledge and Research project (2015–2018), administered through the Commonwealth Environmental Water Office within the Department of Climate Change, Energy, the Environment and Water and its precursors. The research also benefited from support from the Lake Cowal Conservation Centre, the Royal Botanic Garden Sydney (John Martin), NSW Department of Planning and Environment and its precursors, and the Goulburn–Broken Catchment Management Authority (Keith Ward). Batbayar Galtbalt’s contribution to the research was funded through Deakin University’s career pathway placement program.
Author contributions
Batbayar Galtbalt conducted the advanced analyses and modelling in collaboration with Heather McGinness and Marcel Klaassen. Heather McGinness led the satellite-tracking project, data collection, data processing, guided analyses, interpreted results and led writing the paper. Shoshana Rapley derived the summary statistics for the flight height data across the three species. Marcel Klaassen instigated the collaboration, guided analyses, interpreted results and co-wrote the paper. Micha Jackson co-wrote the paper. Heather McGinness, Freya Robinson, Louis O’Neill, Shoshana Rapley, John Martin, Melissa Piper, Micah Davies, Jessica Hodgson and Micha Jackson conducted the primary fieldwork and data collection. Luke Lloyd-Jones, Freya Robinson, Art Langston, Jessica Hodgson, Micha Jackson and Heather McGinness processed the data. Richard Kingsford, Kate Brandis, Veronica Doerr and Ralph Mac Nally provided research direction and design advice at the commencement of the broader project.
Acknowledgements
The authors express their gratitude for the advice of Inka Veltheim and Jeff McKee and for the assistance of colleagues, collaborators and volunteers with fieldwork.
References
Andrews R, Bevrani B, Colin B, Wynn MT, Ter Hofstede AHM, Ring J (2022) Three novel bird strike likelihood modelling techniques: the case of Brisbane Airport, Australia. PLoS ONE 17(12), e0277794.
| Crossref | Google Scholar | PubMed |
Arrondo E, García Alfonso M, Blas J, Cortés-Avizanda A, De la Riva M, DeVault TL, Fiedler W, Flack A, Jimenez J, Lambertucci SA, Margalida A, Oliva-Vidal P, Phipps L, Sánchez-Zapata JA, Wikelski M, Donázar JA (2021) Use of avian GPS tracking to mitigate human fatalities from bird strikes caused by large soaring birds. Journal of Applied Ecology 58(7), 1411-1420.
| Crossref | Google Scholar |
Australian Transport Safety Bureau (2019) Australian aviation wildlife strike statistics 2008–2017. ATSB Transport Safety Report Research Report AR-2018-035. (Commonwealth of Australia: Canberra, ACT, Australia) Available at https://www.atsb.gov.au/publications/2018/ar-2018-035
Bergen S, Huso MM, Duerr AE, Braham MA, Katzner TE, Schmuecker S, Miller TA (2022) Classifying behavior from short-interval biologging data: an example with GPS tracking of birds. Ecology and Evolution 12(2), e08395.
| Crossref | Google Scholar |
Beston JA, Diffendorfer JE, Loss SR, Johnson DH (2016) Prioritizing avian species for their risk of population-level consequences from wind energy development. PLoS ONE 11(3), e0150813.
| Crossref | Google Scholar | PubMed |
Bino G, Brandis K, Kingsford RT, Porter J (2021) Shifting Goalposts: setting restoration targets for waterbirds in the Murray–Darling basin under climate change. Frontiers in Environmental Science 9, 785903.
| Crossref | Google Scholar |
Blackwell BF, Schafer LM, Helon DA, Linnell MA (2008) Bird use of stormwater-management ponds: decreasing avian attractants on airports. Landscape and Urban Planning 86(2), 162-170.
| Crossref | Google Scholar |
Blackwell BF, Seamans TW, Schmidt PM, De Vault TL, Belant JL, Whittingham MJ, Martin JA, Fernández-Juricic E (2013) A framework for managing airport grasslands and birds amidst conflicting priorities. Ibis 155(1), 199-203.
| Crossref | Google Scholar |
Bohrer G, Brandes D, Mandel JT, Bildstein KL, Miller TA, Lanzone M, Katzner T, Maisonneuve C, Tremblay JA (2012) Estimating updraft velocity components over large spatial scales: contrasting migration strategies of golden eagles and turkey vultures. Ecology Letters 15(2), 96-103.
| Crossref | Google Scholar | PubMed |
Brandis KJ, Bino G, Spencer JA, Ramp D, Kingsford RT (2018) Decline in colonial waterbird breeding highlights loss of Ramsar wetland function. Biological Conservation 225, 22-30.
| Crossref | Google Scholar |
Byrne ME, Holland AE, Bryan AL, Beasley JC (2017) Environmental conditions and animal behavior influence performance of solar-powered GPS-GSM transmitters. The Condor: Ornithological Applications 119(3), 389-404.
| Crossref | Google Scholar |
Chelak MS, Kohl MT, Small JR, Smith KT, Pratt AC, Beck JL, Backen CR, Flack MB, Wayment HP, Wood JA, Howell R, Strange TD, McDonald LR, Manlove KR, Frey SN, Larsen RT, Maxfield BA, Dahlgren DK, Messmer T, Stoner DC (2025) Refurbishing used GPS transmitters improves performance for subsequent deployments on greater sage-grouse. Wildlife Society Bulletin 49(1), e1566.
| Crossref | Google Scholar |
Civil Aviation Safety Authority (2024) Part 91 of CASR general operating and flight rules. (Commonwealth of Australia) Available at https://www.casa.gov.au/rules/regulatory-framework/casr/part-91-casr-general-operating-and-flight-rules#Rulestatus [Verified 25 September 2024]
Conkling TJ, Vander Zanden HB, Allison TD, Diffendorfer JE, Dietsch TV, Duerr AE, Fesnock AL, Hernandez RR, Loss SR, Nelson DM, Sanzenbacher PM, Yee JL, Katzner TE (2022) Vulnerability of avian populations to renewable energy production. Royal Society Open Science 9(3), 211558.
| Crossref | Google Scholar | PubMed |
Department of Transport and Planning (2024) Wind energy facilities: supporting development of renewable energy as an important contributor to Victoria’s future energy needs. (State Government of Victoria) Available at https://www.planning.vic.gov.au/guides-and-resources/guides/all-guides/renewable-energy-facilities/wind-energy-facilities [Verified 25 September 2024]
DeVault TL, Blackwell BF, Seamans TW, Belant JL (2016) Identification of off airport interspecific avian hazards to aircraft. The Journal of Wildlife Management 80(4), 746-752.
| Crossref | Google Scholar |
DeVault TL, Blackwell BF, Seamans TW, Begier MJ, Kougher JD, Washburn JE, Miller PR, Dolbeer RA (2018) Estimating interspecific economic risk of bird strikes with aircraft. Wildlife Society Bulletin 42(1), 94-101.
| Crossref | Google Scholar |
Dolbeer RA (2006) Height Distribution of Birds Recorded by Collisions with Civil Aircraft. Journal of Wildlife Management 70(5), 1345-1350.
| Crossref | Google Scholar |
Dormann CF, Elith J, Bacher S, Buchmann C, Carl G, Carré G, Marquéz JRG, Gruber B, Lafourcade B, Leitão PJ, Münkemüller T, McClean C, Osborne PE, Reineking B, Schröder B, Skidmore AK, Zurell D, Lautenbach S (2013) Collinearity: a review of methods to deal with it and a simulation study evaluating their performance. Ecography 36(1), 27-46.
| Crossref | Google Scholar |
Duriez O, Peron G, Gremillet D, Sforzi A, Monti F (2018) Migrating ospreys use thermal uplift over the open sea. Biology Letters 14, 20180687.
| Crossref | Google Scholar | PubMed |
Erickson WP, Johnson GD, Young DP Jr (2005) A summary and comparison of bird mortality from anthropogenic causes with an emphasis on collisions. In ‘Bird conservation implementation and integration in the americas: proceedings of the third international partners in flight conference’, 20–24 March 2002, Asilomar, CA, USA. (Eds CJ Ralph, TD Rich) Volume 2, General Technical Report PSW-GTR-191, pp. 1029–1042. (USDA Forest Service, Pacific Southwest Research Station)
Ferraz G, Pacheco C, Fernández-Tizón M, Marques AT, Alves PC, Silva JP, Mougeot F (2024) Using GPS and accelerometer data to remotely detect breeding events in two elusive ground-nesting steppe birds. Animal Biotelemetry 12(1), 30.
| Crossref | Google Scholar |
Gauld JG, Silva JP, Atkinson PW, Record P, Acácio M, Arkumarev V, Blas J, Bouten W, Burton N, Catry I, Champagnon J, Clewley GD, Dagys M, Duriez O, Exo K-M, Fiedler W, Flack A, Friedemann G, Fritz J, Garcia-Ripolles C, Garthe S, Giunchi D, Grozdanov A, Harel R, Humphreys EM, Janssen R, Kölzsch A, Kulikova O, Lameris TK, López-López P, Masden EA, Monti F, Nathan R, Nikolov S, Oppel S, Peshev H, Phipps L, Pokrovsky I, Ross-Smith VH, Saravia V, Scragg ES, Sforzi A, Stoynov E, Thaxter C, Van Steelant W, Van Toor M, Vorneweg B, Waldenström J, Wikelski M, Žydelis R, Franco AMA (2022) Hotspots in the grid: avian sensitivity and vulnerability to collision risk from energy infrastructure interactions in Europe and North Africa. Journal of Applied Ecology 59(6), 1496-1512.
| Crossref | Google Scholar |
Gawne B, Thompson R (2023) Adaptive water management in response to climate change: the case of the southern Murray–Darling Basin. Australasian Journal of Water Resources 27(2), 271-288.
| Crossref | Google Scholar |
Hedenström A, Alerstam T (1995) Optimal flight speed of birds. Philosophical Transactions of the Royal Society of London – B. Biological Sciences 348, 471-487.
| Crossref | Google Scholar |
Hersbach H, Bell B, Berrisford P, Hirahara S, Horányi A, Muñoz-Sabater J, Nicolas J, Peubey C, Radu R, Schepers D, Simmons A, Soci C, Abdalla S, Abellan X, Balsamo G, Bechtold P, Biavati G, Bidlot J, Bonavita M, De Chiara G, Dahlgren P, Dee D, Diamantakis M, Dragani R, Flemming J, Forbes R, Fuentes M, Geer A, Haimberger L, Healy S, Hogan RJ, Hólm E, Janisková M, Keeley S, Laloyaux P, Lopez P, Lupu C, Radnoti G, De Rosnay P, Rozum I, Vamborg F, Villaume S, Thépaut J-N (2020) The ERA5 global reanalysis. Quarterly Journal of the Royal Meteorological Society 146(730), 1999-2049.
| Crossref | Google Scholar |
Jirinec V, Rodrigues PF, Amaral B (2021) Adjustable leg harness for attaching tags to small and medium-sized birds. Journal of Field Ornithology 92(1), 77-87.
| Crossref | Google Scholar |
Kamata T, Sato H, Mukai H, Sato T, Yamada S, Sekijima T (2023) Sensitivity analysis of collision risk at wind turbines based on flight altitude of migratory waterbirds. Ecological Solutions and Evidence 4(2), e12222.
| Crossref | Google Scholar |
Karl BJ, Clout MN (1987) An improved radio transmitter harness with a weak link to prevent snagging. Journal of Field Ornithology 58(1), 73-77.
| Google Scholar |
Kirby JS, Stattersfield AJ, Butchart SHM, Evans MI, Grimmett RFA, Jones VR, O’Sullivan J, Tucker GM, Newton I (2008) Key conservation issues for migratory land- and waterbird species on the world’s major flyways. Bird Conservation International 18(S1), S49-S73.
| Crossref | Google Scholar |
Lato KA, Stepanuk JEF, Heywood EI, Conners MG, Thorne LH (2022) Assessing the accuracy of altitude estimates in avian biologging devices. PLoS ONE 17(10), e0276098.
| Crossref | Google Scholar | PubMed |
Loss SR, Will T, Marra PP (2014a) Estimation of bird–vehicle collision mortality on US roads. The Journal of Wildlife Management 78(5), 763-771.
| Crossref | Google Scholar |
Loss SR, Will T, Marra PP (2014b) Refining estimates of bird collision and electrocution mortality at power lines in the United States. PLoS ONE 9(7), e101565.
| Crossref | Google Scholar |
Martin J, French K, Major R (2010) Population and breeding trends of an urban coloniser: the Australian white ibis. Wildlife Research 37(3), 230-239.
| Crossref | Google Scholar |
McGinness HM, Lloyd-Jones LR, Robinson F, Langston A, O’Neill LG, Rapley S, Jackson MV, Hodgson J, Piper M, Davies M, Martin J, Kingsford R, Brandis K, Doerr V, Mac Nally RM (2024a) Satellite telemetry reveals complex mixed movement strategies in ibis and spoonbills of Australia: implications for water and wetland management. Movement Ecology 12, 74.
| Google Scholar |
McGinness HM, Lloyd-Jones LR, Robinson F, Langston A, O’Neill LG, Rapley S, Jackson MV, Hodgson J, Piper M, Davies M, Martin J, Kingsford R, Brandis K, Doerr V, Mac Nally RM (2024b) Habitat use by nomadic ibis and spoonbills post-dispersal from breeding sites. Landscape Ecology 39, 189.
| Crossref | Google Scholar |
McGinness HM, Jackson MV, Lloyd-Jones L, Robinson F, Langston A, O’Neill LG, Rapley S, Piper M, Davies M, Hodgson J, Martin JM, Kingsford R, Brandis K, Doerr V, Mac Nally R (2024c) Extensive tracking of nomadic waterbird movements reveals an inland flyway. Ecology and Evolution 14(12), e70668.
| Crossref | Google Scholar |
McGinness HM, Lloyd-Jones L, Robinson F, Jackson M, Rapley S, O’Neill L (2024d) Satellite tracking waterbird movements in the Murray–Darling basin. A report to the Commonwealth Environmental Water Holder (CEWH) monitoring, evaluation and research program, department of agriculture, water and the environment. CSIRO, Canberra, ACT, Australia.
Morant J, Arrondo E, Sánchez-Zapata JA, Donázar JA, Margalida A, Carrete M, Blanco G, Guil F, Serrano D, Pérez-García JM (2024) Fine-scale collision risk mapping and validation with long-term mortality data reveal current and future wind energy development impact on sensitive species. Environmental Impact Assessment Review 104, 107339.
| Crossref | Google Scholar |
Murray–Darling Basin Authority (2019) Basin-wide environmental watering strategy. (MDBA: Canberra, ACT, Australia) Available at https://www.mdba.gov.au/water-use/water-environment/water-environment-your-region/deciding-where-water-goes/basin-wide-environmental
Murray–Darling Basin Authority (2020) 2020 Basin Plan evaluation. (MDBA: Canberra, ACT, Australia) Available at https://www.mdba.gov.au/water-management/basin-plan/basin-plan-evaluations/2020-basin-plan-evaluation
Nicol S, Lloyd-Jones L, McGinness HM (2024) A method to predict connectivity for nomadic waterbird species from tracking data. Landscape Ecology 39, 13.
| Crossref | Google Scholar |
Péron G, Fleming CH, Duriez O, Fluhr J, Itty C, Lambertucci S, Safi K, Shepard EL, Calabrese JM (2017) The energy landscape predicts flight height and wind turbine collision hazard in three species of large soaring raptor. Journal of Applied Ecology 54(6), 1895-1906.
| Crossref | Google Scholar |
Pfeiffer MB, Kougher JD, DeVault TL (2018) Civil airports from a landscape perspective: a multi-scale approach with implications for reducing bird strikes. Landscape and Urban Planning 179, 38-45.
| Crossref | Google Scholar |
Roshier DA, Asmus MW (2009) Use of satellite telemetry on small-bodied waterfowl in Australia. Marine and Freshwater Research 60(4), 299-305.
| Crossref | Google Scholar |
Sachs G, Traugott J, Nesterova AP, Dell’Omo G, Kümmeth F, Heidrich W, Vyssotski AL, Bonadonna F (2012) Flying at no mechanical energy cost: disclosing the secret of wandering albatrosses. PLoS ONE 7, e41449.
| Crossref | Google Scholar | PubMed |
Safi K, Kranstauber B, Weinzierl R, Griffin L, Rees EC, Cabot D, Cruz S, Proaño C, Takekawa JY, Newman SH, Waldenström J, Bengtsson D, Kays R, Wikelski M, Bohrer G (2013) Flying with the wind: scale dependency of speed and direction measurements in modelling wind support in avian flight. Movement Ecology 1, 4.
| Crossref | Google Scholar |
Schaub T, Millon A, De Zutter C, Buij R, Chadoeuf J, Lee S, Mionnet A, Klaassen RHG (2023) How to improve the accuracy of height data from bird tracking devices? An assessment of high-frequency GPS tracking and barometric altimetry in field conditions. Animal Biotelemetry 11(1), 31.
| Crossref | Google Scholar |
Smith ACM, Munro U, Figueira WF (2013) Modelling urban populations of the Australian white ibis (Threskiornis molucca) to inform management. Population Ecology 55(4), 567-574.
| Crossref | Google Scholar |
Sodhi NS (2002) Competition in the air: birds versus aircraft. The Auk 119(3), 587-595.
| Crossref | Google Scholar |
Thaxter CB, Ross-Smith VH, Clark JA, Clark NA, Conway GJ, Marsh M, Leat EHK, Burton NHK (2014) A trial of three harness attachment methods and their suitability for long-term use on Lesser Black-backed Gulls and Great Skuas. Ringing & Migration 29(2), 65-76.
| Crossref | Google Scholar |
Thaxter CB, Buchanan GM, Carr J, Butchart SHM, Newbold T, Green RE, Tobias JA, Foden WB, O’Brien S, Pearce-Higgins JW (2017) Bird and bat species’ global vulnerability to collision mortality at wind farms revealed through a trait-based assessment. Proceedings of the Royal Society of London – B. Biological Sciences 284(1862), 20170829.
| Crossref | Google Scholar |
Watts HE, Cornelius JM, Fudickar AM, Perez J, Ramenofsky M (2018) Understanding variation in migratory movements: a mechanistic approach. General and Comparative Endocrinology 256, 112-122.
| Crossref | Google Scholar | PubMed |
Weiser EL, Overton CT, Douglas DC, Casazza ML, Flint PL (2024) Geese migrating over the Pacific Ocean select altitudes coinciding with offshore wind turbine blades. Journal of Applied Ecology 61(5), 951-962.
| Crossref | Google Scholar |