

Differences in juvenile white sharks’ (Carcharodon carcharias) resource use in southern California waters
Yamilla N. Samara Chacon A * , Christine R. Whitcraft A , James M. Anderson A , Emily Spurgeon A , Patrick Rex A , Elizabeth E. Jahn A , Zachariah S. Merson A and Christopher G. Lowe A
A
Abstract
The white shark (Carcharodon carcharias) is a marine predator with a global distribution, ranging from neritic to oceanic waters. In the Southern California Bight (SCB), juvenile white sharks (JWS) form loose aggregations at nearshore habitats (<500 m from shoreline), but may also be encountered offshore (>5 km from shore) where they are vulnerable to interactions with recreational and commercial fisheries.
This study aimed to identify dietary differences, habitat preferences, and potential behavioral ecotypes among JWS encountered nearshore versus offshore, contributing to an understanding of their habitat use and associated vulnerabilities.
Tissue samples from sharks encountered nearshore and offshore (>5 km from shore) were taken for stable isotope analysis (SIA). Nearshore and offshore prey baselines were constructed using samples from potential prey species found at known nearshore JWS nursery habitats, and isotope values of offshore prey from the published literature. Sharks were also tagged with acoustic transmitters to track coastal movements
Both 13C and 15N values were significantly different between sharks encountered at different habitat types (nearshore vs offshore). Bayesian mixing models showed high dietary contribution from nearshore–coastal prey in sharks sampled nearshore, whereas those caught offshore exhibited higher contributions from pelagic–offshore food sources. A coastal residency index calculated for both shark groups during sampling years (2020–2022) showed that sharks caught offshore are detected less frequently in nearshore waters than are those tagged nearshore.
Juvenile white sharks in the SCB appear to form two distinct ecotypes.
These two groups of JWS may be exposed to different fisheries exposure depending on habitat use. A better understanding on JWS habitat and resource usage may help improve fisheries managements.
Keywords: behavioral ecotype, Carcharodon carcharias, isotopic niche, mixing model, residency index, resource use, Southern California Bight, stable isotopes, white shark.
Introduction
Understanding the diet of large predators is crucial for insights into their foraging behaviors, trophic interactions, niche diversification, and habitat use. Traditionally, researchers have relied on stomach content analysis (SCA) to investigate the diets and resource utilization of predators. This method has been foundational in trophic ecology studies (e.g. Cortés 1999); however, using SCA to study animals’ diets has some limitations. For instance, the application of SCA on highly threatened and endangered species is not feasible because of its invasive nature. Another common limitation is that SCA often requires either the killing of individuals or stomach lavage to obtain only recently consumed stomach contents (da Silveira et al. 2020). Although often more species specific in prey identification, SCA lacks any temporal integration of prey consumed by the predator over time. So, less invasive sampling methods of assessing diet of protected species may be necessary.
Stable isotopes have become increasingly popular among trophic ecologists because of their non-lethal and less invasive approach. When consumers ingest food, they incorporate stable isotopes into their tissues, thus isotope values may provide chemical information that reflects the natural resources utilized by the consumers, enabling quantitative estimates of dietary contributions over time (Layman et al. 2012). This method allows for a more detailed investigation of the ecology of top predators, which are often less abundant, more challenging to capture or have lesser-known diets. Additionally, compared with SCA, stable isotope analysis (SIA) provides information on dietary resources of an individual over a longer period of time depending on the turnover rates of different tissues. Hence, SIA has been used to better describe trophic position, habitat used, and dietary changes over time by using different tissue types. This integrated time perspective is important because some predators such as sharks may provide extensive maternal resources during gestation, and stable isotope values have been a critical tool to demonstrate the influence of maternal offloading on neonates (Ducatez et al. 2008; Olin et al. 2011; Niella et al. 2021). Furthermore, SIA of various tissue types can enable the identification of ontogenetic dietary changes owing to the faster turnover rate in different tissue types in growing metabolic active juveniles (e.g. blood vs muscle) (Kim et al. 2012a; Malpica-Cruz et al. 2012).
The white shark (C. carcharias) is a highly mobile marine predator with a global distribution (Cliff et al. 1989; Curtis et al. 2014). Because of its perceived ecological value, the Northeast Pacific white shark population has been protected from recreational and commercial take in California since 1994 and in all US waters since 2005 (Lowe et al. 2012; Burgess et al. 2014). Telemetry tracking studies have shown that adult white sharks off California typically inhabit neritic and oceanic waters, where they feed on squids, large pelagic fishes, and marine mammals, as evidenced by SCA and SIA (Carlisle et al. 2012; Le Croizier et al. 2020). Similarly, telemetry studies have indicated that juveniles are most often found in neritic waters (Curtis et al. 2018; Anderson et al. 2021a), with SCA and SIA showing that their diet primarily consists of benthic nearshore teleosts and elasmobranchs (Bruce 1992; Santana-Morales et al. 2012; Hussey et al. 2012a; Tamburin et al. 2020; García-Rodríguez et al. 2021). Dietary patterns of juveniles vary by region, likely owing to differences in prey diversity and habitat use during ontogeny, presumably placing this prohibited species in close proximity to commercial and recreational fisheries.
In the Northeast Pacific Ocean (NEP), juvenile white sharks (JWS) are commonly found throughout the Southern California Bight (SCB) (Lowe et al. 2012) where they have been observed forming loose aggregations in shallow nearshore areas (Anderson et al. 2021a) or being incidentally captured further offshore in neritic waters, more than 5 km from the shoreline (Lyons et al. 2013). Given that JWS have been observed foraging in a variety of habitats (e.g. outside surf-zone areas, nearshore rock reefs, neritic sand flats), it is assumed that individuals are likely to be exploiting different food resources, associated with the habitats where they are encountered.
This study describes the diet of JWS sampled within the SCB by tissue-specific isotopic compositions (δ13C and δ15N). Tissues sampled were from JWS sighted at nearshore aggregation habitats (muscle) and individuals incidentally caught offshore in commercial fisheries (muscle and plasma). JWS were grouped as nearshore (<500 m from shore) and offshore (>5 km from the shore) sharks, depending on the habitat where they were encountered, to compare differences in isotopic compositions. Because white sharks are highly mobile, individuals within the population may exhibit different behaviors that allow for occupation of different habitats and prey. Therefore, investigating the dietary contribution from nearshore and offshore food sources to JWS encountered at these different habitat types can provide insights into the habitat use of white sharks during ontogeny and may contribute to improved management and protections.
Materials and methods
Nearshore sharks sampling
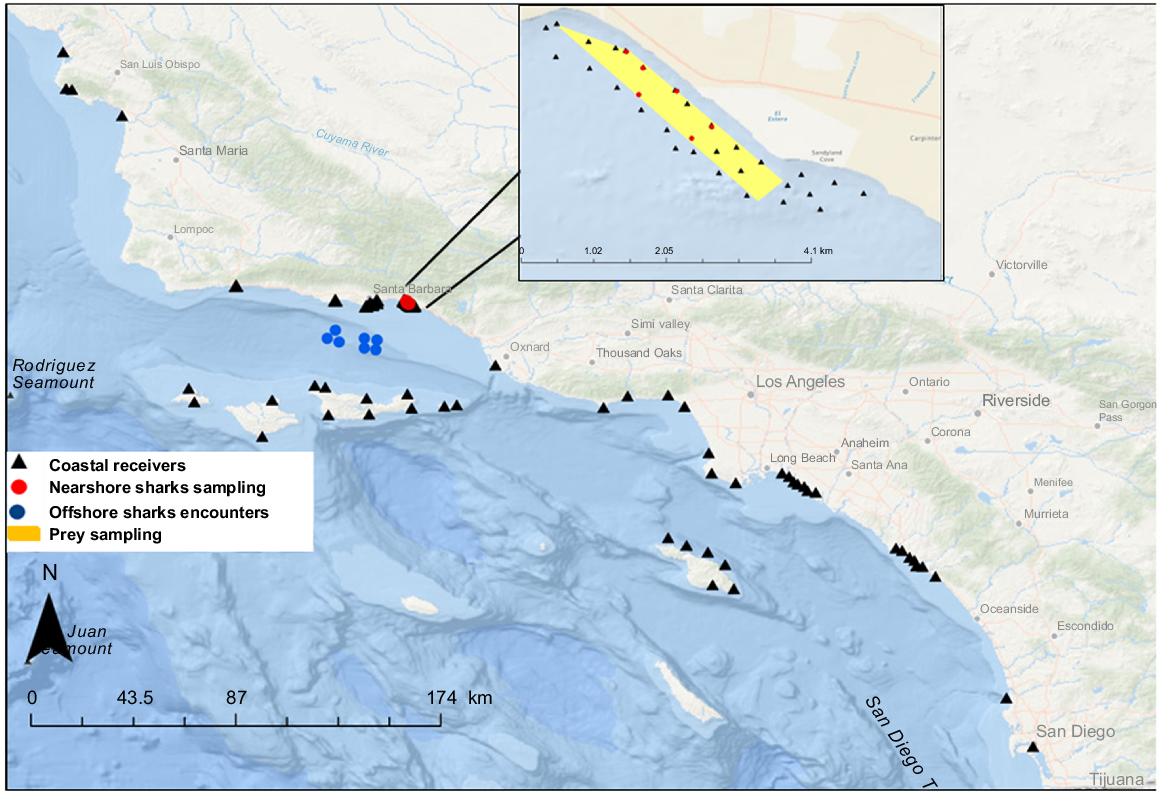
Juvenile white sharks (JWS) were sampled at nearshore aggregation sites in southern California from 2020 to 2022 (Fig. 1), where free-swimming sharks at depths of ≤10 m were spotted with a drone. Once a shark was found swimming near the surface, a GoPro camera attached to a dip-cam pole was used to identify the sex. Individuals were identified as male or female by the presence or absence of claspers respectively, unless dip-cam videos were of low quality, in which case, the sex assigned was unknown. Sharks were then dart-tagged with an external V16 coded acoustic transmitter (Vemco|Innovasea, NS, Canada; V16-4x-069k, V16-5x-069k, and V16-6x-069k), inserted into the muscle near the dorsal fin by using a modified 3-m-long pole-spear with a tag applicator (Anderson et al. 2021a). If the same animal was still approachable after tagging, another modified pole spear fitted with a 1-cm-diameter biopsy punch was used to take a muscle sample for stable isotope analysis (Meyer et al. 2018). Muscle samples were taken at the base of the dorsal fin, biopsy samples were then stored in a 1.5-mL Eppendorf vial and placed in ice prior to freeze storage at −80°C in the lab. Shark sizes (total length, TL, cm) were estimated using calibrated images extracted from orthogonal drone video (May et al. 2019; Anderson et al. 2021a). During continuous field-day operations, biopsy wounds were seen to be visible from the drone for several days after sampling (Patrick Rex, pers. obs.). In these cases, to confirm identification of previously tagged and potentially biopsied sharks, a directional hydrophone and VR-100 were used to identify the transmitter ID, so as to reduce likelihood of resampling the same individual.
Map shows shark sampling locations (nearshore, red dots; offshore, blue dots; and the location of acoustic receivers, black triangles). Yellow area represents the area where nearshore sharks and potential prey were sampled. Map inset shows the area where potential prey were sampled and black dots represent acoustic receivers.
Offshore sharks sampling
The prohibition of commercial gillnet fisheries in California State waters (<3 nautical miles, <5.6 km, off mainland and <1 nautical mile, <1.852 km, off offshore islands) has led to an overall reduction of gillnet fishing efforts coastally; however, JWS are still incidentally caught in gillnet fisheries fishing outside State waters (Lowe et al. 2012; Lyons et al. 2013). From 2020 to 2022, commercial gillnet fishers targeting white seabass (Atractoscion nobilis) and California halibut (Paralichthys californicus) worked in collaboration with CSULB researchers and brought incidentally captured JWS to the nearest port in large live wells (1.2 × 1.2 × 1.2 m) with flowing seawater. Sharks were caught in nets with 8.5-m mesh size that were set at depths ranging from 30 to 60 m and soaked for 20–24 h. Incidentally captured sharks were tagged with a V16 acoustic transmitter (Vemco|Innovasea, NS, Canada, V16-6x-069k-1, 200-s nominal pulse rate, 10-year battery life) surgically implanted into the abdominal cavity of the shark through a small incision (5 cm), which was then closed with two to three interrupted sutures. For stable isotope analysis, muscle samples were taken at the base dorsal fin with a sterile disposable biopsy punch (4 mm in diameter, Robbins Instruments) and placed in 1.5-mL Eppendorf vials. An external spaghetti tag, with a unique ID number and contact information, was inserted at the incision previously made to collect muscle, for identification if re-captured. Whole blood (~5 mL) was taken from the caudal vein using a 21-gauge needle and stored in EDTA tubes. To collect plasma, whole blood was centrifuged for 5 min at 1400 RCF to separate plasma from blood cells. Plasma fraction samples were stored in labeled Eppendorf vials and placed in ice prior to arrival to laboratory. Sharks were released ~1 km offshore and visually monitored during release to record behavior. Lyons et al. (2013) demonstrated post-release survival rates of juvenile white sharks retrieved live from gillnets to be over 90%, thus there was high confidence in post-release survival.
Prey sampling
To build a comprehensive isotopic baseline that might represent the food sources available for JWS at nursery nearshore habitats, muscle samples were collected from fishes and invertebrates captured by beach seines and otter trawls at a known JWS aggregation site (Fig. 1). Because JWS have been observed just outside the surf zone (Rex et al. 2023), beach seines were conducted within and just outside the surf zone using a small 23- × 2-m seine net with 1-cm mesh size and a large 30- × 3-m net with 7-cm mesh size respectively. Beach seine sampling took place at low tide (≤0.6 m) during daylight hours. Otter trawls were conducted to sample potential JWS prey species in deeper waters ~50 m from the shoreline, by using a 5-m-wide otter trawl (2-cm mesh size), towed from a skiff at 2–3 knots (~3.7–5.6 km h−1) for periods of 5 min over sandy substrata. For both sampling methods, axial or pectoral fin muscle samples from prey were taken by using sterile disposable biopsy punches (4 mm in diameter, Robbins Instruments), and tissues were placed inside 1.5-mL Eppendorf vials and stored in ice to then be stored in −80°C freezers in the laboratory. All sampled individuals were released after being processed, except for small specimens (<15 cm in total length), which were euthanased in the field and sampled in the laboratory.
Sample preparation
All tissue samples were oven dried (50°C) for ~24–48 h (De Lecea et al. 2011; Kim and Koch 2012). Muscle samples were dried inside Eppendorf vials with open caps to allow water content evaporation, whereas blood samples were transferred to sterile Petri dishes. After drying, samples were pulverized using ethanol-washed mortar and pestle and crushing tools and Petri dishes were cleaned between samples to avoid cross-contamination.
Elasmobranchs retain urea and lipids for osmoregulation and buoyancy purposes (Hussey et al. 2012b). Urea is a waste product depleted in 15N, whereas lipids are depleted in 13C; thus, tissues high in urea and lipid contents may exhibit inaccurate carbon to nitrogen ratios (C:N) (DeNiro and Epstein 1977). To account for potential biases, lipids and urea from the prey muscle of all elasmobanchs, JWS’ muscle and plasma samples were chemically extracted by 2:1 chloroform:methanol solution and deionized (DI) water extractions respectively (Bligh and Dyer 1959; Hussey et al. 2012b). No chemical extractions were performed on teleost or invertebrate samples, because aquatic organisms with C:N of <3.5 have lower lipid contents and, therefore, do not require lipid extractions prior toanalysis (Post 2002; Post et al. 2007; Supplementary Tables S1, S2). Finally, all samples were weighed (0.5–1.0 mg) in 8- × 5-mm tin capsules and sent to the Stable Isotope Facility at University of California—Davis to be analyzed. Isotope values were expressed in delta notation, as follows:
where X is 13C or 15N, Rsample and Rstandard are the isotopic ratios (13C:12C or 15N:14N) of the sample and the standard respectively, and units are measured in parts per thousand (‰).
At the analytical laboratory, samples were combusted at 950°C in a reactor containing chromium oxide and silvered copper oxide, with oxygen ensuring complete combustion on sample introduction. Residual oxygen and nitrogen oxides were then eliminated by passing the combustion products over reduced copper at 650°C. Water was trapped using magnesium perchlorate and phosphorus pentoxide. CO2 and N2 were separated either by a gas chromatograph (GC) column in the Sercon Elemental Analyzers (EAs) or by an adsorption trap in the Elementar EAs. Finally, a portion of the analyte gasses was transferred to the isotope-ratio mass spectrometer (IRMS) for measurement. The reported isotope-delta values were evaluated as the standard deviation of the mean of reference material replicates. Reference materials for all runs included alfalfa flour, amaranth flour, bovine liver, caffeine, chitin, enriched alanine, glutamic acid (GLAC), keratin, and nylon powder (NYPOW). The mean measurement error (σ) was below ±0.2‰ for 13C and ±0.3‰ for 15N for all runs (see https://stableisotopefacility.ucdavis.edu/carbon-and-nitrogen-solids).
Data analysis
δ13C and δ15N comparisons (JWS and prey)
Permutational multivariate ANOVA (PERMANOVA) with 999 permutations, using the R package vegan (ver. 4.21, J. Oksanen et al., see https://cran.r-project.org/package=vegan/), were run to test for differences in location, size, and sex in JWS muscle δ13C and δ15N. Euclidean distances were applied to create a matrix of similarity for δ13C and δ15N. The PERMANOVA model had δ13C and δ15N as dependent variables and included shark group (nearshore and offshore), size class (neonates, <150 cm TL; young-of-the-year, YOY, 151–175 cm TL; and juveniles, 176–300 cm TL), and sex (female, male, unknown) as independent variables. Finally, regression models were conducted to examine the relationships between tissue types (muscle and plasma) and total length (TL) for offshore-captured sharks, as well as between muscle and TL for nearshore-captured sharks.
This study is the first to describe the diet of JWS from nearshore aggregations in southern California by using SIA. Therefore, to establish an isotopic baseline of prey for this area, we determined a comprehensive nearshore prey baseline by sampling 20 species, including elasmobranchs, teleost fishes, and invertebrates, from a known JWS aggregation habitat from which some of the nearshore sharks were sampled. Additionally, for food sources located further offshore (>5 km from shore), we developed an offshore baseline by using published values (means and standard deviations, s.d., for δ13C and δ15N values of each species) from peer-reviewed literature (Table S4). Although offshore SIA data were acquired from literature across different studies and years, and not likely to be as accurate as direct potential prey sampling from the locations where sharks were captured, this approach is often used as proxies in stable isotope mixing models (e.g. Carlisle et al. 2012; García-Rodríguez et al. 2021).
Following Phillips et al. (2014) to determine the appropriate groupings among prey species sampled and to reduce variability in prey isotopic composition data and improve the accuracy of mixing model results, nearshore prey species were grouped into six categories based on their taxonomic groups, trophic guilds, and habitat association. PERMANOVAs with 999 permutations, using the R package vegan (ver. 4.21), were run to test for differences in multivariate isospace of preys grouping δ13C and δ15N on the basis of literature (Parnell et al. 2013) (Table 1). This grouping method significantly reduced variability compared with broader categories based on sampling location (inshore vs offshore), while allowing for separation on the basis of general taxonomic groups (teleosts, invertebrates, elasmobranchs) in ways that reflect observed isotopic differences (Tables 1, 2). Whereas detailed grouping was used for nearshore prey, this was omitted for the offshore prey baseline because the isotope data originated from a literature review and were likely to be not as specific to the areas where sharks were encountered.
| Pair | R2 | F Model | P-value | |
|---|---|---|---|---|
| Benthic fishes vs elasmobranchs | 0.15 | 51.01 | 0.015 | |
| Benthic fishes vs inverts | 0.50 | 140.01 | 0.015 | |
| Benthic fishes vs corbinas | 0.15 | 20.81 | 0.015 | |
| Benthic fishes vs mature spot-fin croakers | 0.20 | 31.86 | 0.015 | |
| Benthic fishes vs offshore prey | 0.48 | 118.5 | 0.015 | |
| Elasmobranchs vs inverts | 0.32 | 105.07 | 0.015 | |
| Elasmobranchs vs corbinas | 0.05 | 11.01 | 0.015 | |
| Elasmobranchs vs mature spot-fin croakers | 0.19 | 51.64 | 0.015 | |
| Elasmobranchs vs offshore prey | 0.38 | 131.21 | 0.015 | |
| Inverts vs corbinas | 0.53 | 49.19 | 0.015 | |
| Inverts vs mature spot-fin croakers | 0.58 | 68.99 | 0.015 | |
| Inverts vs offshore prey | 0.32 | 19.05 | 0.015 | |
| Corbina vs mature spot-fin croaker | 0.33 | 17.63 | 0.015 | |
| Corbina vs offshore prey | 0.61 | 45.44 | 0.015 | |
| Mature spot-fin croaker vs offshore prey | 0.46 | 27.80 | 0.015 |
Results from PERMANOVA comparisons of prey groupings. This was undertaken to confirm the existence of significant differences in isotopic signatures among all groupings and avoid having groupings that are statistically similar to each other.
| Grouping name | Trophic guild | Associated habitat | Species included | |
|---|---|---|---|---|
| Benthic elasmobranchs | Carnivores | Sandy and rocky bottoms | Myliobatis californica, Urobatis halleri, Platyrhinoidis triseriata, Pseudobatos productus, Triakis semifasciata Gymnura marmorata. | |
| Benthic fishes | Carnivores | Sandy bottoms | Roncador stearnsii, Genyonemus lineatus, Umbrina roncador, Seriphus politus, Pleuronichthys guttulatus, Symphurus atricaudus, Paralichthys californicus, Hyperprosopon ellipticum, Amphistichus argenteus, H. argenteum | |
| Corbinas | Carnivores | Sandy bottoms | Menticirrhus undulatus | |
| Mature Spot-fin croaker | Carnivores | Sandy bottoms | Roncador stearnsii | |
| Invertebrates | Omnivores | Sandy bottoms | Penaeus californiensis, Panulirus interruptus, Callinectes arcuatus |
Guild and trophic level categorizations of the prey species sampled at the nearshore habitats collected by beach seine and otter trawls at the JWS aggregation site.
Isotopic niche
Isotope data plotted in bi-plots can be a representation of δ-space (i.e. habitat use); thus, the space among individuals’ signatures and total area (TA) occupied can be used as proxies to describe niche widths and overlaps in resource utilization (Newsome et al. 2007). The niche area is typically represented in parts per thousand squared (‰2), which corresponds to the bi-plot space area occupied. TA values can be biased when sample sizes are small or large because area will increase as more data points are added; thus, the isotopic niche area should be estimated by calculating standard ellipses corrected areas (SEAc). Isotopic niche areas and potential niche overlap between nearshore and offshore sharks were estimated using the SIBER package (ver. 2.1.9, A. L. Jackson and A. C. Parnell, see https://cran.r-project.org/package=SIBER). SEAc and TA were used to evaluate niche width differences between the two shark groups, and isotopic overlap was used to evaluate potential share of resources (Jackson et al. 2011). Because offshore sharks had a lower sample size than did nearshore sharks, a bootstrap analysis was conducted on their standard ellipse area (SEAc). For each community, 1000 resamples were generated using the smaller sample size to ensure consistency when comparing offshore and nearshore sharks. SEAc values for each resample were then calculated. The results were summarized by computing the median, mean, quartiles, and 95% confidence intervals. This approach provided a robust comparison of the niche widths between the two shark communities.
Bayesian mixing model
Bayesian mixing models generate multiple statistical distributions of δ13C and δ15N values and were used to estimate inherent isotopic differences in food and consumer groups considering trophic fractionation corrections, with contributions of different prey sources being dependent on the isotopic proximity of the food sources relative to the consumer and statistical differences among food sources (Parnell et al. 2013). To estimate the contribution of multiple prey sources into the diet of each shark group in this study, we ran Bayesian mixing models with Markov-chain Monte Carlo (MCMC) simulation approaches, no informative priors, and a total of 7200 iterations to maintain model convergence in the R package SIMMR (ver. 0.5.1.217, see https://github.com/andrewcparnell/simmr).
Although trophic fractionation values for white sharks remain unknown, previous isotopic studies describing the diet of large mobile sharks sampled in the field have used correction values calculated for other shark species kept in captivity for controlled feeding experiments (Carlisle et al. 2012; Malpica-Cruz et al. 2013; Tamburin et al. 2020). In addition, García-Rodríguez et al. (2021) assessed the diet and niche overlap of JWS in Baja California, Mexico, by using a mean from TFs reported in controlled experiments (Δδ13C = 1.3 ± 0.5‰; Δδ15N = 3.0 ± 0.9‰). Therefore, to make our results comparable with other studies in the region, we used the same correction values as did García-Rodríguez et al. (2021) for our mixing model. Only muscle isotope data were incorporated into the mixing model because it was the common tissue type collected for all prey items and JWS.
Using a posteriori approach, mixing models were run with various numbers of source groups (four to six a priori groupings), and we evaluated distribution of proportions for each individual solution. These models did not show significant differences. Therefore, we selected the model with a total of six food sources to balance the need to reduce variability within grouping, while also avoiding overfitting the model by including too many sources (following the recommendation of not exceeding seven sources; Phillips et al. 2014). Convergence Gelman diagnostics were run for the six food sources mode, with values of 1 obtained indicating high convergence of the trophic groupings. The Geweke statistics resulted in P > 0.05, indicating that the distribution is consistent across different parts of the MCMC (Table S6). Finally, to account for potential differences in prey contributions across shark sampling years, we ran mixing models separately for each year. These yearly models showed similar prey contributions in each year, further supporting the robustness of our approach.
JWS detection data
To understand how often nearshore and offshore tagged sharks used nearshore areas, acoustic detection data were gathered from a large acoustic receiver array along the coast and offshore islands of southern California (Fig. 1). A residence index (RI) was calculated for all individuals sampled for stable isotope analysis (SIA) that were tagged with an acoustic transmitter. This RI was used to estimate likelihood of nearshore and offshore sharks being detected at nearshore receivers. The residency index for each individual shark was calculated by dividing the number of detected days by the number of days of potential detection (i.e. tag deployment period, as acoustic receiver coverage was continuous across the study period). Only data from sharks that were detected more than twice per day at a specific region were used to calculate RI (Anderson et al. 2021a). Individual shark detections were then grouped per their encounter classification (nearshore, offshore) and sampling year (2020–2022) to get an average RI per group each year (Tables S12 and S13 for more details).
Results
Differences in JWS isotopic signatures
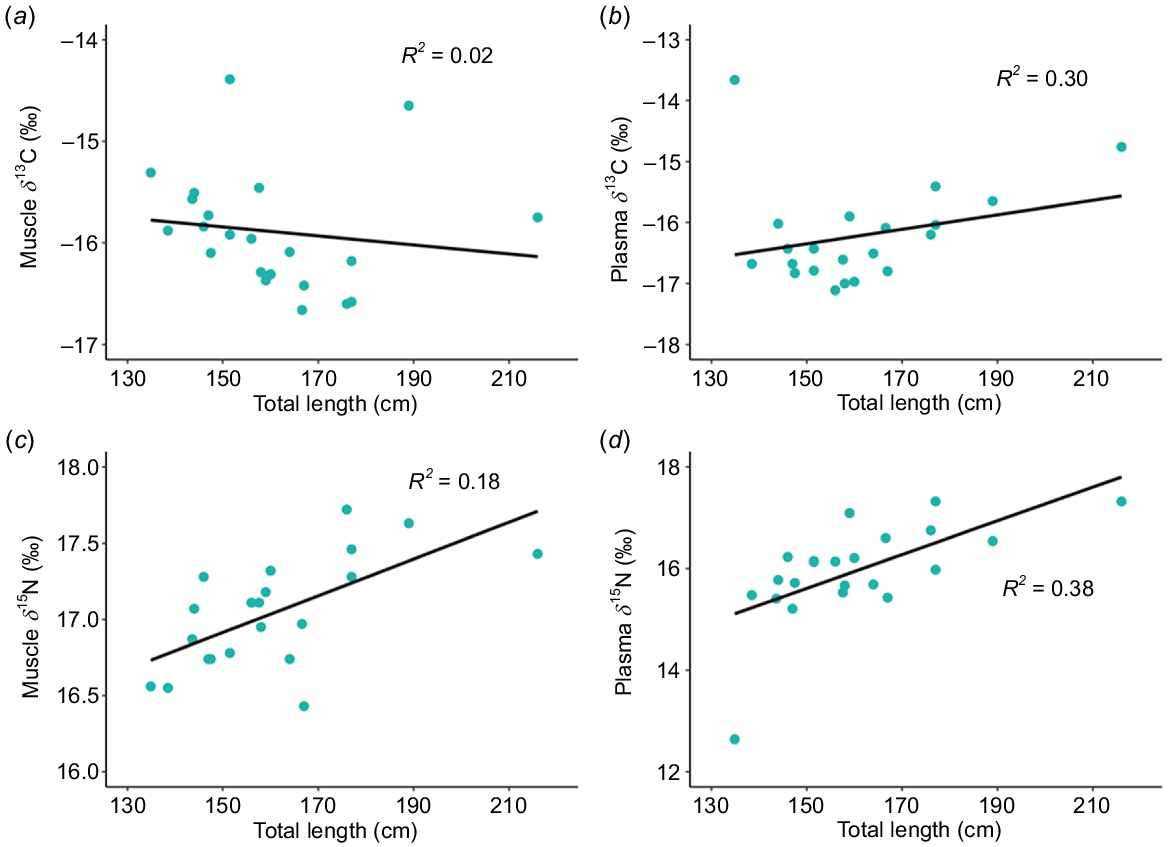
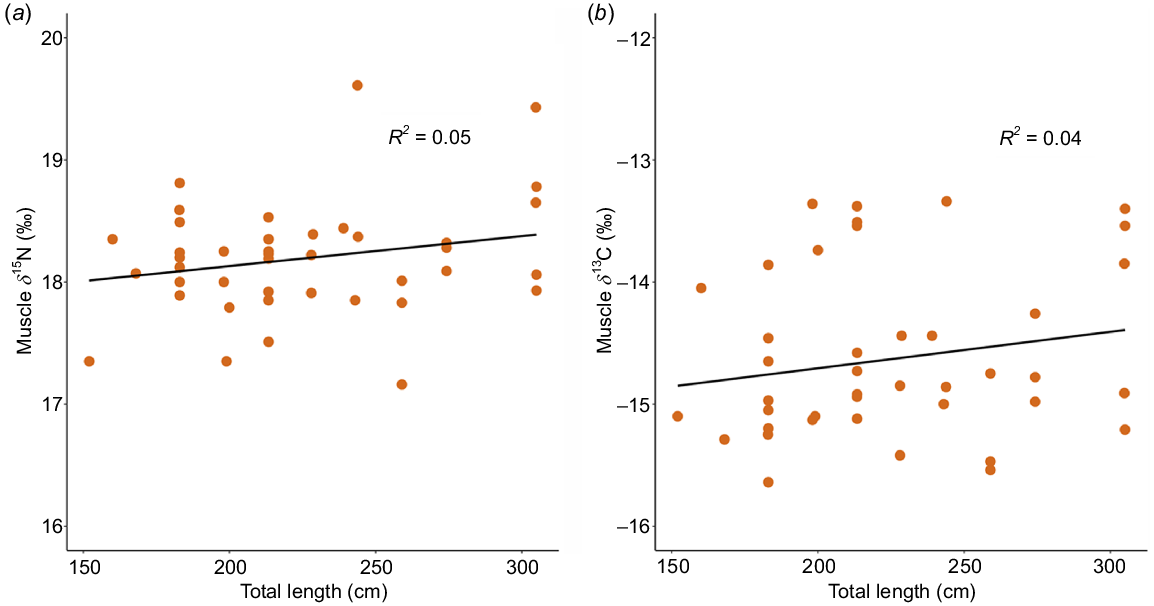
To understand the isotopic composition of juvenile white sharks (JWS) across southern California, we looked at δ13C and δ15N values in muscle tissues from 50 nearshore sharks (length range: 168–305 cm TL) and 22 offshore sharks (135–211 cm TL) sampled from 2020 to 2022 (Table 3). The sex distribution of nearshore sharks was predominantly female (n = 23), with 7 males and 20 sharks being classified as unknown sex. Offshore sharks consisted of 15 females and 7 males. Although there were no significant differences in muscle isotope compositions on the basis of sex or size within each group, isotope values were significantly different between nearshore and offshore shark groupings (pseudo-F = 54.3, P(perm) = 0.001, Table 4). Young-of-the-year, the only size class present in both groups, showed significant differences in both nitrogen (Wilcoxon signed-rank test, W = 2, P = 0.02) and carbon (W = 32, P = 0.008) isotopes. Muscle tissue of offshore sharks exhibited a pattern of increasing enrichment in 15N with total length, observed in both muscle and plasma samples. Additionally, plasma from offshore sharks showed greater 13C enrichment than did muscle with increasing total length of sharks (Fig. 2). By contrast, there appeared to be no significant change in 15N and 13C values with an increasing total length among nearshore sharks (Fig. 3) (Table S7). Carbon values of plasma and muscle from offshore sharks were not significantly different from each other (pseudo-F = 1.302, P(perm) = 0.241), whereas nitrogen values of plasma and muscle were significantly different (pseudo-F = 4.517, P(perm) = 0.001) (Fig. S4).
| Shark group | Isotope | Tissue | Mean ± s.d. | |
|---|---|---|---|---|
| Nearshore | ẟ13C | Muscle | −14.7 ± 0.7 | |
| ẟ15N | Muscle | 18.1 ± 0.5 | ||
| Offshore | ẟ13C | Muscle | −15.9 ± 0.6 | |
| ẟ15N | Muscle | 17.0 ± 0.7 | ||
| ẟ13C | Plasma | −16.5 ± 0.7 | ||
| ẟ15N | Plasma | 15.9 ± 0.9 |
Summary of mean and standard deviation of nitrogen and carbon isotope values from all tissues collected from both shark groups.
| Factor | R2 | PERMANOVA pseudo-F | Results P(perm) | |
|---|---|---|---|---|
| Shark group | 0.42 | 49.51 | 0.001* | |
| Size class | 0.02 | 1.2 | 0.3 | |
| Sex | 0.01 | 0.61 | 0.6 | |
| Shark group × Size class | 0.006 | 0.55 | 0.5 | |
| Shark group × Sex | 0.009 | 1.06 | 0.3 | |
| Size class × Sex | 0.006 | 0.38 | 0.8 |
PERMANOVA results from carbon and nitrogen signatures from both shark groups (nearshore and offshore) to test which factor explains better the isotopic differences among sharks. Probabilities are significant at: *, P < 0.05.
Regression models from offshore shark samples of muscle and plasma. (a, c) Muscle versus total length, (b, d) plasma versus total length. These lines signify statistically significant relationships, suggesting a robust correlation between the tissue and total length, with the strength and direction of these relationships being defined by the slope of the regression lines.
Differences in JWS isotopic niche, dietary isotopic contribution, and coastal movement
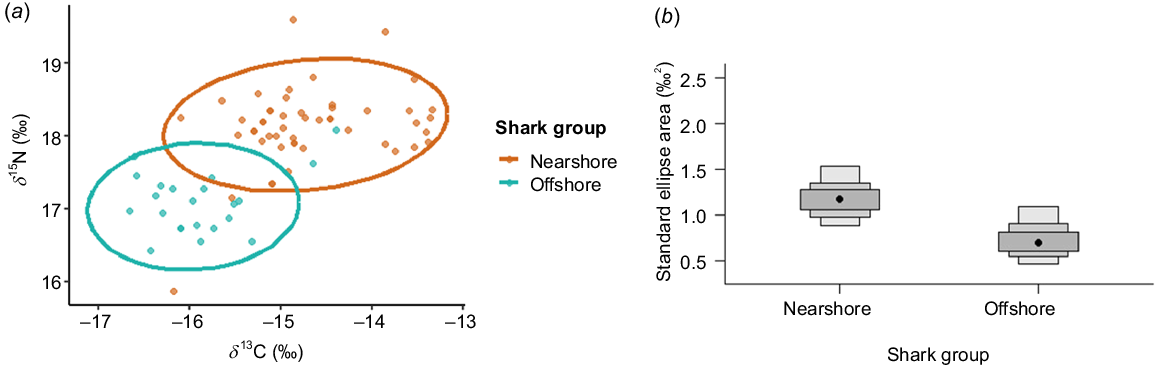
The isotopic niche calculation with muscle samples showed clear isotopic separation between nearshore and offshore sharks. The SEAc was 1.2‰2 for nearshore sharks and 0.76‰2 for offshore sharks respectively. The isotopic niche overlap relative to the total area occupied by both shark groups was 10% (Table 5, Fig. 4a, b). The bootstrap analysis showed that the nearshore sharks exhibited a broader isotopic niche, with SEAc values ranging from 0.3459 to 2.6167‰2, whereas the offshore sharks showed a narrower niche range of 0.2291–1.2451‰2. Median SEAc values were notably higher for nearshore (1.0756‰2) than for offshore (0.7024‰2) sharks (Table S3).
| Shark group | N | TA | SEA | SEAC | Proportion overlap | Bayesian 95% credible intervals | Modes | |
|---|---|---|---|---|---|---|---|---|
| Nearshore | 50 | 6.15 | 1.18 | 1.2 | 0.1 | {0.87–1.53} | 1.16 | |
| Offshore | 22 | 2.35 | 0.72 | 0.74 | 0.1 | {0.45–1.09} | 0.69 |
Summary of the statistics from the isotopic niche analysis run to compare isotopic niche size and overlap between sharks sampled nearshore and offshore.
(a) Isotopic niche overlap of nearshore and offshore sharks. Each point represents a unique shark, and ellipses represent the standard corrected ellipse areas. (b) Bayesian standard corrected ellipse areas (SEAc) for nearshore and offshore sharks. The black dots indicate the mode of the data, whereas the true population values are shown as crosses. The shaded boxes illustrate the credible intervals, with the darkest grey representing the 50% interval, the medium grey showing the 75% interval, and the lightest grey depicting the 95% interval.
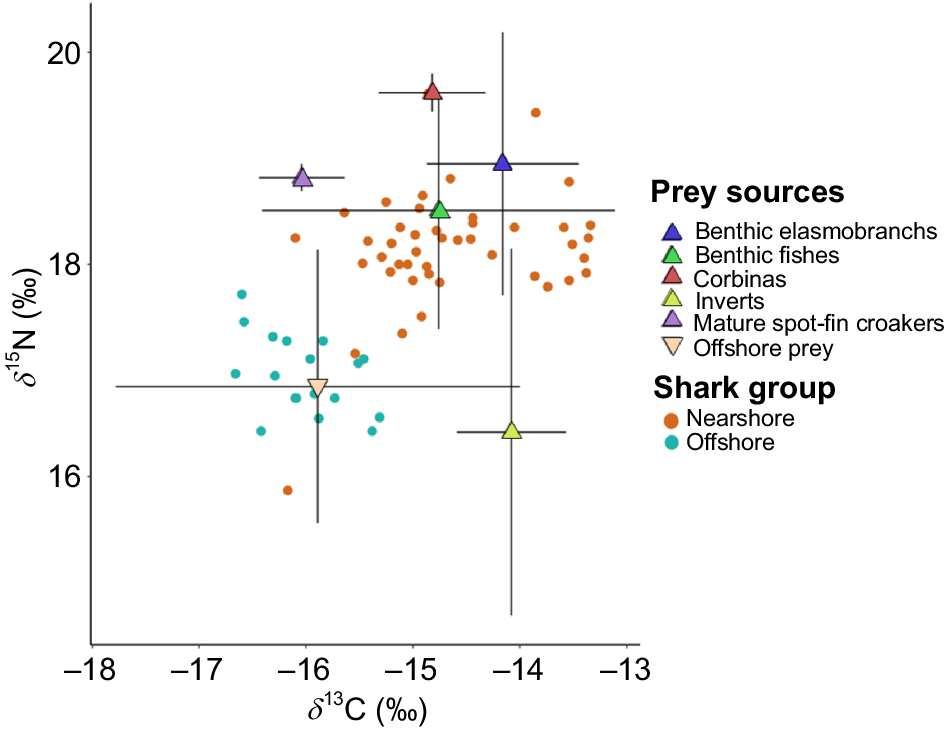
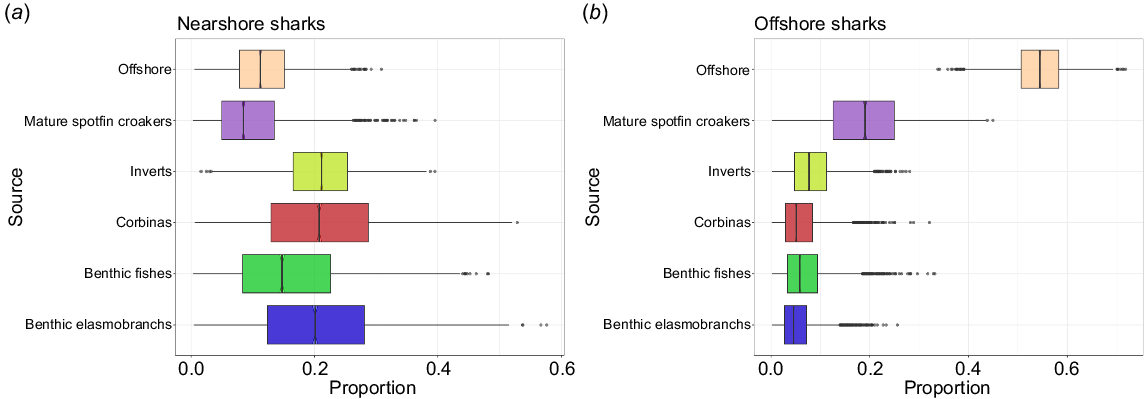
The nearshore prey baseline was composed of five prey categories, whereas the offshore baseline comprises a more generalized grouping of various species that can be found offshore in southern California, including the fishery targeted species (Table 6, Fig. 5). The Bayesian mixing model showed differences in isotopic contributions between the nearshore and offshore shark groups. Nearshore sharks’ isotopic contribution was dominated by benthic elasmobranchs (20%) and teleosts (16%) and the lowest contributions came from mature spot-fin croakers (Roncador stearnsii) (10%), and offshore prey (10%) (Table 7, Fig. 6b). Offshore sharks’ isotopic contribution was mainly derived from offshore prey (Table 7, Fig. 6a) (prior and posterior distribution in Fig. S2).
| Prey category | Mean ± s.d. δ15N | Mean ± s.d. δ13C | Baseline type | Source | |
|---|---|---|---|---|---|
| Benthic elasmobranchs (Myliobatis californica, Urobatis halleri, Platyrhinoidis triseriata, Pseudobatos productus, Gymnura marmorata, Triakis semifasciata) | 15.95 ± 1.24 | −15.5 ± 0.7 | Nearshore | This study | |
| Mature spot-fin croakers (Roncador stearnsii) | 15.8 ± 0.13 | −17.34 ± 0.4 | Nearshore | This study | |
| Benthic fishes (Paralichthys californicus,Hypsopsetta guttulate, Symphurus atricaudus, Hyperprosopon ellipticum, Amphistichus argenteu, Hyperprosopon argenteum, Genyonemus lineatus, Umbrina roncador, Seriphus politus) | 15.5 ± 1.12 | −16.06 ± 1.65 | Nearshore | This study | |
| Corbinas (Menticirrhus undulatus) | 16.62 ± 0.18 | −16.12 ± 0.5 | Nearshore | This study | |
| Invertebrates (Callinectes arcuatus, Panulirus interruptus, Penaeus californiensisis) | 13.4 ± 1.7 | −15.4 ± 0.5 | Nearshore | This study | |
| Offshore prey | 13.31 ± 1.23 | −17.55 ± 1.5 | Offshore | Miller et al. (2008, 2010); Carlisle et al. (2012) |
Summary of mean values and standard deviations from each prey source group used in the mixing model to describe JWS resource use.
Isotope plot of ẟ15N and ẟ13C values from offshore and nearshore sharks and categorized prey sources (corrected with fractionation factors). The colored triangles represent the means for each category and the cross bars are standard deviations. The cross bars represent the standard deviations for each grouping.
| Shark group | Prey source | Proportion (Bayesian 95% credible interval) | Proportion (mean ± s.d.) | |
|---|---|---|---|---|
| Nearshore | Benthic elasmobranchs | {0.030–0.39} | 0.20 ± 0.10 | |
| Benthic Fishes | {0.024–0.36} | 0.16 ± 0.09 | ||
| Corbinas | {0.039–0.37} | 0.21 ± 0.10 | ||
| Mature spot-fin croakers | {0.015–0.25} | 0.10 ± 0.063 | ||
| Invertebrates | {0.10–0.32} | 0.22 ± 0.057 | ||
| Offshore prey | {0.025–0.20} | 0.10 ± 0.05 | ||
| Offshore | Benthic elasmobranchs | {0.009–0.15} | {0.009–0.15} | |
| Benthic fishes | {0.009–0.16} | 0.08 ± 0.05 | ||
| Corbinas | {0.011–0.21} | 0.06 ± 0.04 | ||
| Mature spot-fin croakers | {0.04–0.37} | 0.20 ± 0.08 | ||
| Invertebrates | {0.023–0.24} | 0.12 ± 0.06 | ||
| Offshore prey | {0.35–0.59} | 0.47 ± 0.06 |
Summary of the statistics from the mixing model (SIMMR) for nearshore and offshore sharks.
Proportions of dietary contributions by prey category for sharks encountered in (a) offshore and (b) nearshore habitats. Boxes and lines represent posterior model estimates (median, interquartile range, and minimum and maximum values) of prey categories’ contribution to sharks’ muscle.
Average RI calculated for both shark groups in nearshore habitats during the years the study took place was higher for nearshore sharks than offshore sharks (Table 8). In addition, nearshore sharks were detected most frequently at Santa Barbara, an established nursery aggregation hot spot, where some of the individuals were sampled and tagged. Tagged sharks from either group (nearshore vs offshore) were rarely detected at offshore islands (Tables S8, S9).
| Year | Shark group | Average RI | Total sharks detected | Total sharks sampled and tagged | |
|---|---|---|---|---|---|
| 2020 | Nearshore | 0.27 ± 0.2 | 10 | 15 | |
| 2020 | Offshore | 0.007 ± 0.003 | 4 | 7 | |
| 2021 | Nearshore | 0.39 ± 0.3 | 14 | 15 | |
| 2021 | Offshore | 0.015 ± 0.002 | 2 | 2 | |
| 2022 | Nearshore | 0.13 ± 0.1 | 18 | 17 | |
| 2022 | Offshore | 0.02 ± 0.007 | 10 | 13 |
Summary of the residency index (RI) on the basis of acoustic receiver detections at coastal or nearshore areas where receivers were present from all the JWS sampled nearshore and offshore.
Discussion
Findings from this study showed differences in δ15N and δ13C values among juvenile white sharks that were associated with encounter location, not associated with size or sex. Specifically, there were notable variations in isotope values on the basis of whether a JWS was encountered in the nearshore (<0.5 km from shoreline) versus offshore (>5 km from shoreline) habitat. Although there was no difference in isotope values between sexes sampled from either encounter location, female-biased sex ratio observed may have reduced the ability to quantify sex-related differences in diet. This skew in sex ratio might stem from unintentional oversampling of females or that males could be distributing themselves in different areas. Conversely, the lack of size-based differences in isotopic values may be due to variations in sample composition across size classes. Larger juveniles were easier to sample in nearshore habitats, whereas smaller, younger sharks (neonates and YOY) may exhibit higher catchability in offshore gillnets. Although fishers do report occasionally capturing larger juveniles in their nets, these sharks are often released as fishers lack the means to handle or transport them back to shore for sampling (C. Winkler, pers. comm.).
Nearshore sharks had a larger SEAc than did offshore sharks, potentially indicating access and capture of more diverse food sources. This is likely because nearshore sharks spend considerable amounts of time in highly productive benthic-coastal areas near the shoreline, exposing them to more productive habitats (e.g. subtidal sand surf, low relief rock reefs, estuary inlets), whereas sharks caught offshore (>5 km from the shoreline) may be more reliant on less productive or more dispersed prey. These results differ from previous findings in SIA and SCA studies in the NEP, where sharks caught in nearshore waters (i.e. Laguna Manuela and Sebastián Vizcaíno Bay in Baja California) exhibited a less broad isotope niche than those caught outside nearshore habitats (García-Rodríguez et al. 2021). However, that study included only eight samples from outside the nearshore habitats, whereas our study sampled 22 individuals outside the nearshore habitat. Differences in sample sizes can influence SEAc calculations (Jackson et al. 2011), and in our study, nearshore sharks (n = 50) had a larger sample size than did offshore sharks (n = 22). Nonetheless, bootstrap analysis that normalized for sample sizes corroborated the significant differences in SEAc between the groups, with nearshore sharks exhibiting a broader isotopic niche which supports differences in habitat and resource use.
On the basis of the measured and approximated prey isotopic composition, mixing models showed that nearshore sharks were, as expected, relying on resources predominantly from nearshore habitats from which those sharks were sampled. These resources include benthic elasmobranchs, benthic fishes, corbinas, mature spot-fin croakers, offshore prey, and invertebrates in order of importance. Some of these demersal preys, specifically fishes and rays are highly abundant at nearshore surf-zone areas (Hoisington and Lowe 2005; Nosal et al. 2014; Merson et al. 2025; E. Jahn, unpubl. data). Benthic elasmobranchs and teleosts constitute the most important prey category for nearshore sharks. Even though the analysis does not allow for the identification of species-specific dietary contributions, opportunistic drone observations indicate JWS feeding specifically on round stingrays and bat rays (P. Rex, pers. obs.), further supporting this isotopic pattern. On the basis of these patterns, we speculate that JWS are predominantly feeding on benthic fishes that are most abundant, easy to catch, and of greater individual size (e.g. >1 kg). Conversely, mixing models showed that JWS caught offshore are not likely to be relying on these same nearshore resources and are feeding on prey with a more offshore isotopic composition or prey encountered in more nearshore areas with isotopic compositions more similar to those of offshore prey. Although, some species found nearshore may also be found in offshore areas, individuals in offshore habitats may exhibit isotopic signatures that reflect those environments (i.e. more depleted carbon values), distinguishing them from their nearshore counterparts. Our study could not account for prey mobility or determine whether the prey sampled in nearshore habitats are also available offshore. Whereas some prey species may move between habitats, our results suggest that sharks encountered in nearshore waters primarily forage there, as indicated by their isotopic signatures and residency levels obtained from acoustic tracking data. Additionally, the majority of species sampled for the nearshore habitat baseline are more abundant in nearshore habitats than in offshore habitats. Future studies incorporating prey movement data or a broader spatial sampling of prey could help clarify the extent to which resource availability influences these patterns.
High contribution of offshore prey to neonates and YOY JWS diets has been previously observed in individuals sampled in Mexican waters (Tamburin et al. 2020; García-Rodríguez et al. 2021), where offshore prey contribution from muscle samples was also attributed to maternal contributions. In this study, offshore shark plasma samples exhibited less 15N enrichment than did muscle; similarly, δ13C values from plasma were more enriched in 13C than were those from muscle tissues. This suggests that neonate (<150 cm TL) muscle tissue may still reflect some maternally contributed isotopes. The lack of trend of δ15N and δ13C in relationship to total length in nearshore sharks suggests isotopic equilibrium between diet and tissue. In addition, the lack of a statistically significant difference between carbon values from plasma and muscle supports the hypothesis of offshore feeding. The differences in nitrogen values between plasma and muscle may be due to variations in prey items consumed.
White shark sizes at birth range from 120 to 150 cm TL (Bruce 2008) and previous SIA on JWS have shown that immature white sharks reflect indications of exogenous feeding in muscle tissues between 150 and 170 cm TL (Malpica-Cruz et al. 2013). Additionally, JWS captured within the SCB have been reported to show more rapid growth (i.e. higher mass per unit length) than do JWS measured at other locations across the NEP (Logan et al. 2018), which can lead to faster dilution of the maternally derived isotopic composition. Therefore, YOY and juvenile muscle tissues in this study may have limited maternal isotopic contribution, particularly as sharks approach 150–170 cm TL (Malpica-Cruz et al. 2013). However, because plasma was not collected for all sharks, this cannot be fully assessed, and future studies should include a fast and slow turnover rate tissue from all individuals to verify this assumption.
The only size class that both shark groups had in common (YOY: 151–175 cm TL) showed isotopic differences between the nearshore and offshore locations. If YOY isotopic patterns were largely dictated by maternal offloading, it might be expected that δ15N and δ13C of all YOY should show similar variability, regardless of their sampling location. Hence, differences in YOY δ15N and δ13C values may be an indication of differences in resource usage. Another possible explanation is that the differences observed in δ15N and δ13C values may suggest that mothers of offshore-sampled YOY have a different dietary specialization than do mothers of nearshore YOY. Nonetheless, despite the higher likelihood of a maternal isotopic contribution in muscle of neonates and YOY captured offshore, significantly higher residency indices of JWS tagged in nearshore aggregation sites and very low RI of JWS caught offshore to nearshore areas, support the likelihood of these two groups of sharks feeding on different resources.
Offshore prey signatures were gathered from isotopic values from the literature and not actually sampled at the same locations where offshore sharks were caught. On the basis of comparison of muscle isotopic patterns derived from the offshore baseline with that of JWS sampled from those offshore waters, data derived from the literature may not accurately represent the food sources used by sharks caught offshore. Nonetheless, some studies have reported presence of pelagic prey such as mackerels and tuna in stomach contents of JWS (Tricas and McCosker 1984; Bruce 1992; Santana-Morales et al. 2012). Offshore sharks were incidentally caught in gillnet fisheries outside state waters (>5 km from the shoreline); consequently, it is possible they occasionally feed on offshore prey. Offshore pelagic schooling fishes are highly abundant across southern California and could be an important food source for sharks venturing into waters farther from the shoreline. Interestingly, isotopic composition of fisheries targeted species (i.e. white seabass and California halibut) did not appear to constitute much of the offshore shark diet, which may suggest that the sharks are not caught in the nets as the result of depredation.
Despite differences in prey baseline collection methods and potential maternal contributions, all analyses indicated that JWS sampled at different habitats exhibited differences in isotopic composition, which, to a degree, can be attributed to likely differences in resources use. Differences in JWS diets and resource usage have been previously proposed in other studies. For instance, SIA on tooth samples showed that JWS in eastern Australia exhibit specialized diets, with some individuals feeding on either pelagic or benthic food sources (Grainger et al. 2020, 2023). Another SIA study conducted on adult white sharks’ vertebrae from the NEP found differences among individuals across ontogeny, with some sharks showing low changes in isotope values across the year, indicating potential dietary specializations, and prevalence of narrow dietary niches throughout adulthood. By contrast, some individuals showed more changes in isotopic composition with the years, suggesting more changes in diet across life stages, hence exhibiting a more generalist or opportunistic diet (Kim et al. 2012b). These differences in individual dietary selectivities, even at early ages, may indicate differences in habitat use, prey hunting skill or may be resulting from density dependent competition.
Previous tracking data for JWS caught, tagged and released from the commercial gillnet fishery show limited nearshore affinity, whereas sharks tagged at nearshore aggregation sites have shown high residency to nearshore areas (Anderson et al. 2021a, 2021b). However, because there is minimal acoustic receiver coverage across much of the neritic habitat in the SCB, it was unclear whether offshore JWS were staying offshore following release and therefore not being detected along the large nearshore array. Additionally, individuals tagged nearshore often return to an aggregation site in consecutive years, after having left the area (Spurgeon et al. 2022), and may form non-random associations with similar-sized sharks, unlike evidence for those caught offshore (Anderson et al. 2021b). Hence, differences in isotopic signature between JWS from the SCB may be linked to differences in behaviors such as movement and sociality. Although it is unclear whether JWS caught offshore are moving in groups, gillnet catch data suggest that they may not be, because only single individuals are typically reported caught in a net set (Lyons et al. 2013). This implies that these individuals may be more solitary and exploit more patchy resources.
Sharks sampled offshore were caught >5 km from shore in depths of 30–60 m. Despite lacking high spatially resolved offshore movement data, recaptures of tagged offshore sharks have been reported by gillnet fishermen (C. Winkler, pers. comm.). Previous satellite telemetry studies on JWS caught in SCB gillnet fisheries showed movements between mainland coast and Channel Islands habitats (~5 km from shore) at depths between 20 and 30 m (Lyons et al. 2013) and seasonal migrations to nearshore waters in Mexico (White et al. 2019). Although it is possible for offshore sharks to feed nearshore and vice versa, low isotopic overlap suggests this is unlikely or not yet captured in muscle samples because of maternally offloaded isotopic contribution.
The isotope data presented complement movement and site fidelity behaviors previously documented for JWS in the SCB. These results suggest the possible existence of two separate behavioral ecotypes of JWS, whereby one group displays high levels of residency in nearshore coastal environments, and the other appears to exhibit more exploratory and transient movements, perhaps exploiting ephemeral food-resource patches. These insights into the foraging ecology of JWS are important for conservation, management and fisheries regulations, as data from this study provide evidence of JWS making use of resources outside California State waters during ontogeny. Resident JWS may benefit from enhanced nearshore protections, such as marine protected areas, gillnet exclusion areas, and bycatch mitigation strategies, whereas more mobile individuals may require broader-scale conservation measures.
Multiple drivers could be responsible for these explicit differences in feeding habits, such as genetically inherited behaviors, personality traits (shy vs bold, loner vs social), or even the increasing number of JWS in southern California (Burgess et al. 2014), causing some individuals to select offshore habitats over inshore nurseries, potentially to avoid competition. Another possible explanation is that offshore JWS may be selecting these habitats primarily for feeding, because it is possible that they also occupy nearshore areas beyond the detection range of the receivers. However, because of the lack of comparable high-resolution offshore movement data, we do not fully understand movement patterns of sharks caught in the gillnet fisheries. There is a need for a more robust analysis of the movement patterns of both shark groups, and future studies applying multiple dietary biomarkers with satellite tags and acoustic tags to better understand the mechanisms driving these behaviors.
Data availability
The data that support this study will be shared upon reasonable request to the corresponding author.
Conflicts of interest
Chris Lowe is a Guest Editor of the ‘White Sharks Global proceedings and recent advances in white shark ecology and conservation’ collection of Wildlife Research. To mitigate this potential conflict of interest they were blinded from the review process.
Declaration of funding
This study was funded through the State of California Shark Beach Safety Program. Yamilla Samara also received partial funding from the California State University Council on Ocean Affairs, Science and Technology (COAST), Donald J. Reish Research Grant, and the Southern California Tuna Club Marine Biology Educational Scholarship Foundation Graduate Research Grant. The funders played no part in data collection and analysis or preparation of the paper.
Acknowledgements
CSULB undergraduates Bailey Bonham and Becca Prezgay assisted with prey species sample collection and sample processing. Fieldwork support for beach seines was provided by California State Lifeguard Agencies. This paper forms part of the Master’s thesis of Yamilla N. Samara Chacon (2023).
References
Anderson JM, Burns ES, Meese EN, Farrugia TJ, Stirling BS, White CF, Logan RK, O’Sullivan J, Winkler C, Lowe CG (2021a) Interannual nearshore habitat use of young of the year white sharks off southern California. Frontiers in Marine Science 8, 645142.
| Crossref | Google Scholar |
Anderson JM, Clevenstine AJ, Stirling BS, Burns ES, Meese EN, White CF, Logan RK, O’Sullivan J, Rex PT, May J, Lyons K, Winkler C, García-Rodríguez E, Sosa-Nishizaki O, Lowe CG (2021b) Non-random co-occurrence of juvenile white sharks (Carcharodon carcharias) at seasonal aggregation sites in southern California. Frontiers in Marine Science 8, 688505.
| Crossref | Google Scholar |
Bligh EG, Dyer WJ (1959) A rapid method of total lipid extraction and purification. Canadian Journal of Biochemistry and Physiology 37(1), 911-917.
| Crossref | Google Scholar |
Bruce BD (1992) Preliminary observations on the biology of the White Shark, Carcharodon carcharias, in South Australian waters. Marine and Freshwater Research 43(1), 1-11.
| Crossref | Google Scholar |
Burgess GH, Bruce BD, Cailliet GM, Goldman KJ, Grubbs RD, Lowe CG, MacNeil MA, Mollet HF, Weng KC, O’Sullivan JB (2014) A re-evaluation of the size of the white shark (Carcharodon carcharias) population off California, USA. PLoS ONE 9(6), e98078.
| Crossref | Google Scholar |
Carlisle AB, Kim SL, Semmens BX, Madigan DJ, Jorgensen SJ, Perle CR, Anderson SD, Chapple TK, Kanive PE, Block BA (2012) Using stable isotope analysis to understand the migration and trophic ecology of Northeastern Pacific white sharks (Carcharodon carcharias). PLoS ONE 7(2), e30492.
| Crossref | Google Scholar |
Cliff G, Dudley SFJ, Davis B (1989) Sharks caught in the protective gill nets off Natal, South Africa. 2. The great white shark Carcharodon carcharias (Linnaeus). South African Journal of Marine Science 8(1), 131-144.
| Crossref | Google Scholar |
Cortés E (1999) Standardized diet compositions and trophic levels of sharks. ICES Journal of Marine Science 56(5), 707-717.
| Crossref | Google Scholar |
Curtis TH, McCandless CT, Carlson JK, Skomal GB, Kohler NE, Natanson LJ, Burgess GH, Hoey JJ, Pratt HL (2014) Seasonal distribution and historic trends in abundance of white sharks, Carcharodon carcharias, in the Western North Atlantic Ocean. PLoS ONE 9(6), e99240.
| Crossref | Google Scholar |
Curtis TH, Metzger G, Fischer C, McBride B, McCallister M, Winn LJ, Quinlan J, Ajemian MJ (2018) First insights into the movements of young-of-the-year white sharks (Carcharodon carcharias) in the western North Atlantic Ocean. Scientific Reports 8(1), 10794.
| Crossref | Google Scholar |
da Silveira EL, Semmar N, Cartes JE, Tuset VM, Lombarte A, Ballester ELC, Vaz-dos-Santos AM (2020) Methods for trophic ecology assessment in fishes: a critical review of stomach analyses. Reviews in Fisheries Science & Aquaculture 28(1), 71-106.
| Crossref | Google Scholar |
De Lecea AM, Smit AJ, Fennessy ST (2011) The effects of freeze/thaw periods and drying methods on isotopic and elemental carbon and nitrogen in marine organisms, raising questions on sample preparation. Rapid Communications in Mass Spectrometry 25, 3640-3649.
| Crossref | Google Scholar |
DeNiro MJ, Epstein S (1977) Mechanism of carbon isotope fractionation associated with lipid synthesis. Science 197(4300), 261-263.
| Crossref | Google Scholar |
Ducatez S, Dalloyau S, Richard P, Guinet C, Cherel Y (2008) Stable isotopes document winter trophic ecology and maternal investment of adult female southern elephant seals (Mirounga leonina) breeding at the Kerguelen Islands. Marine Biology 155(4), 413-420.
| Crossref | Google Scholar |
García-Rodríguez E, Herzka SZ, Sosa-Nishizaki O, Lowe CG, O’Sullivan JB (2021) Stable isotope analysis of juvenile white sharks inside a nursery area reveals foraging in demersal–inshore habitats and trophic overlap with sympatric sharks. Frontiers in Marine Science 8, 687738.
| Crossref | Google Scholar |
Grainger R, Peddemors VM, Raubenheimer D, Machovsky-Capuska GE (2020) Diet composition and nutritional niche breadth variability in juvenile white sharks (Carcharodon carcharias). Frontiers in Marine Science 7, 422.
| Crossref | Google Scholar |
Grainger R, Raoult V, Peddemors VM, Machovsky-Capuska GE, Gaston TF, Raubenheimer D (2023) Integrating isotopic and nutritional niches reveals multiple dimensions of individual diet specialisation in a marine apex predator. Journal of Animal Ecology 92(2), 514-534.
| Crossref | Google Scholar |
Hoisington G, IV, Lowe CG (2005) Abundance and distribution of the round stingray, Urobatis halleri, near a heated effluent outfall. Marine Environmental Research 60(4), 437-453.
| Crossref | Google Scholar | PubMed |
Hussey N, McCann H, Cliff G, Dudley S, Wintner S, Fisk A (2012a) Size-based analysis of diet and trophic position of the white shark, Carcharodon carcharias, in South African Waters. In ‘Global perspectives on the biology and life history of the white shark’. (Ed. ML Domeier) pp. 27–50. (CRC Press) 10.1201/b11532-5
Hussey NE, MacNeil MA, Olin JA, McMeans BC, Kinney MJ, Chapman DD, Fisk AT (2012b) Stable isotopes and elasmobranchs: tissue types, methods, applications and assumptions. Journal of Fish Biology 80(5), 1449-1484.
| Crossref | Google Scholar |
Jackson AL, Inger R, Parnell AC, Bearhop S (2011) Comparing isotopic niche widths among and within communities: SIBER – stable isotope Bayesian ellipses in R. Journal of Animal Ecology 80(3), 595-602.
| Crossref | Google Scholar |
Kim SL, Koch PL (2012) Methods to collect, preserve, and prepare elasmobranch tissues for stable isotope analysis. Environmental Biology of Fishes 95(1), 53-63.
| Crossref | Google Scholar |
Kim SL, del Rio CM, Casper D, Koch PL (2012a) Isotopic incorporation rates for shark tissues from a long-term captive feeding study. Journal of Experimental Biology 215(14), 2495-2500.
| Crossref | Google Scholar |
Kim SL, Tinker MT, Estes JA, Koch PL (2012b) Ontogenetic and among-individual variation in foraging strategies of Northeast Pacific white sharks based on stable isotope analysis. PLoS ONE 7(9), e45068.
| Crossref | Google Scholar |
Layman CA, Araujo MS, Boucek R, Hammerschlag-Peyer CM, Harrison E, Jud ZR, Matich P, Rosenblatt AE, Vaudo JJ, Yeager LA, Post DM, Bearhop S (2012) Applying stable isotopes to examine food-web structure: an overview of analytical tools. In Biological Reviews 87(3), 545-562.
| Crossref | Google Scholar |
Le Croizier G, Lorrain A, Sonke JE, Hoyos-Padilla EM, Galván-Magaña F, Santana-Morales O, Aquino-Baleytó M, Becerril-García EE, Muntaner-López G, Ketchum J, Block B, Carlisle A, Jorgensen SJ, Besnard L, Jung A, Schaal G, Point D (2020) The twilight zone as a major foraging habitat and mercury source for the great white shark. Environmental Science & Technology 54(24), 15872-15882.
| Crossref | Google Scholar |
Logan RK, White CF, Winkler C, Jorgensen SJ, O’Sullivan JB, Lowe CG, et al. (2018) An evaluation of body condition and morphometric relationships within southern California juvenile white sharks Carcharodon carcharias. Journal of Fish Biology 93, 842-849.
| Crossref | Google Scholar |
Lyons K, Jarvis ET, Jorgensen SJ, Weng K, O’Sullivan J, Winkler C, Lowe CG (2013) The degree and result of gillnet fishery interactions with juvenile white sharks in southern California assessed by fishery-independent and -dependent methods. Fisheries Research 147, 370-380.
| Crossref | Google Scholar |
Malpica-Cruz L, Herzka SZ, Sosa-Nishizaki O, Lazo JP (2012) Tissue-specific isotope trophic discrimination factors and turnover rates in a marine elasmobranch: empirical and modeling results. Canadian Journal of Fisheries and Aquatic Sciences 69(3), 551-564.
| Crossref | Google Scholar |
Malpica-Cruz L, Herzka SZ, Sosa-Nishizaki O, Escobedo-Olvera MA (2013) Tissue-specific stable isotope ratios of shortfin mako (Isurus oxyrinchus) and white (Carcharodon carcharias) sharks as indicators of size-based differences in foraging habitat and trophic level. Fisheries Oceanography 22(6), 429-445.
| Crossref | Google Scholar |
May C, Meyer L, Whitmarsh S, Huveneers C (2019) Eyes on the size: accuracy of visual length estimates of white sharks, Carcharodon carcharias. Royal Society Open Science 6, 190456.
| Crossref | Google Scholar |
Merson ZS, Jahn EE, Barnes MA, Spurgeon EA, Rex PT, Elstner JT, et al. (2025) eDNA metabarcoding detection of nearshore juvenile white sharks (Carcharodon carcharias) and prey fish communities. Journal of Experimental Marine Biology and Ecology 583, 152084.
| Crossref | Google Scholar |
Meyer L, Fox A, Huveneers C (2018) Simple biopsy modification to collect muscle samples from free-swimming sharks. Biological Conservation 228, 142-147.
| Crossref | Google Scholar |
Miller TW, Brodeur RD, Rau GH (2008) Carbon stable isotopes reveal relative contribution of shelf-slope production to the Northern California Current pelagic community. Limnology and Oceanography 53(4), 1493-1503.
| Crossref | Google Scholar |
Miller TW, Brodeur RD, Rau G, Omori K (2010) Prey dominance shapes trophic structure of the northern California Current pelagic food web: evidence from stable isotopes and diet analysis. Marine Ecology Progress Series 420, 15-26.
| Crossref | Google Scholar |
Newsome SD, Martinez del Rio C, Bearhop S, Phillips DL (2007) A niche for isotopic ecology. Frontiers in Ecology and the Environment 5(8), 429.
| Crossref | Google Scholar |
Niella Y, Raoult V, Gaston T, Peddemors VM, Harcourt R, Smoothey AF (2021) Overcoming multi-year impacts of maternal isotope signatures using multi-tracers and fast turnover tissues in juvenile sharks. Chemosphere 269, 129393.
| Crossref | Google Scholar |
Nosal AP, Caillat A, Kisfaludy EK, Royer MA, Wegner NC (2014) Aggregation behavior and seasonal philopatry in male and female leopard sharks Triakis semifasciata along the open coast of southern California, USA. Marine Ecology Progress Series 499, 157-175.
| Crossref | Google Scholar |
Olin JA, Hussey NE, Fritts M, Heupel MR, Simpfendorfer CA, Poulakis GR, Fisk AT (2011) Maternal meddling in neonatal sharks: implications for interpreting stable isotopes in young animals. Rapid Communications in Mass Spectrometry 25(8), 1008-1016.
| Crossref | Google Scholar |
Parnell AC, Phillips DL, Bearhop S, Semmens BX, Ward EJ, Moore JW, Jackson AL, Grey J, Kelly DJ, Inger R (2013) Bayesian stable isotope mixing models. Environmetrics 24, 387-399.
| Crossref | Google Scholar |
Phillips DL, Inger R, Bearhop S, Jackson AL, Moore JW, Parnell AC, Semmens BX, Ward EJ (2014) Best practices for use of stable isotope mixing models in food-web studies. Canadian Journal of Zoology 92(10), 823-835.
| Crossref | Google Scholar |
Post DM (2002) Using stable isotopes to estimate trophic position: models, methods, and assumptions. Ecology 83(3), 703-718.
| Crossref | Google Scholar |
Post DM, Layman CA, Arrington DA, Takimoto G, Quattrochi J, Montaña CG (2007) Getting to the fat of the matter: models, methods and assumptions for dealing with lipids in stable isotope analyses. Oecologia 152(1), 179-189.
| Crossref | Google Scholar |
Rex PT, May JH, III, Pierce EK, Lowe CG (2023) Patterns of overlapping habitat use of juvenile white shark and human recreational water users along southern California beaches. PLoS ONE 18(6), e0286575.
| Crossref | Google Scholar |
Santana-Morales O, Sosa-Nishizaki O, Escobedo-Olvera MA, Oñate-González EC, O’Sullivan JB, Cartamil D (2012) Incidental catch and ecological observations of juvenile white sharks, Carcharodon carcharias, in western Baja California, Mexico: conservation implications. In ‘Global perspectives on the biology and life history of the white shark’. (Ed. L Domeier) pp. 187–198. (CRC Press)
Spurgeon E, Anderson JM, Liu Y, Barajas VL, Lowe CG (2022) Quantifying thermal cues that initiate mass emigrations in juvenile white sharks. Scientific Reports 12(1), 19874.
| Crossref | Google Scholar |
Tamburin E, Elorriaga-Verplancken FR, Estupiñan-Montaño C, Madigan DJ, Sánchez-González A, Padilla MH, Wcisel M, Galván-Magaña F (2020) New insights into the trophic ecology of young white sharks (Carcharodon carcharias) in waters off the Baja California Peninsula, Mexico. Marine Biology 167(5), 55.
| Crossref | Google Scholar |
White CF, Lyons K, Jorgensen SJ, O’Sullivan J, Winkler C, Weng KC, Lowe CG (2019) Quantifying habitat selection and variability in habitat suitability for juvenile white sharks. PLoS ONE 14(5), e0214642.
| Crossref | Google Scholar |