

Using a state vegetation type map to predict legal koala habitat at large scale: a case study in the Mid North Coast region of NSW
Cristian Gabriel Orlando A # * , Rebecca Montague-Drake B # , John Turbill B , Allen McIlwee C and Mathew S. Crowther A
A
B
C
# Authors contributed equally to this work and share first authorship
Handling Editor: Adam Stow
Abstract
Habitat loss is a primary contributor to the decline in koala populations. While existing legislation aims to preserve koala habitats, on-ground surveys for habitat classification are time-consuming, potentially biased, and limited in scale. Leveraging plant community type (PCT) mapping for large-scale classification of koala habitat is promising but requires testing and clear methodological steps.
We describe and test a method (the ‘PCT/SEPP’ method) to use PCT mapping to predict legal koala habitat as defined under NSW State Environmental Planning Policy (Biodiversity and Conservation) 2021 (SEPP) in the Mid North Coast region of New South Wales (NSW).
We surveyed 195 sites (49 PCTs) and measured the frequency of koala use tree species (KTS) as outlined in the SEPP. Next, using the FIDEL tables for the NSW PCTs, we assigned the expected average frequency and median combined cover of KTS to each site, on the basis of its associated PCT (the ‘PCT/SEPP’ method). We assessed sites for legal (‘potential’) koala habitat by using field vegetation survey data and ‘PCT/SEPP’ data, comparing congruence. Finally, we evaluated the effectiveness of both methods in identifying contemporary occupied (‘core’) koala habitat by using records from dog and acoustic surveys, and BioNet Atlas (as per the SEPP).
Legal koala habitat, verified from on-ground field surveys, was best predicted by the ‘PCT/SEPP’ method which used a ‘15% frequency/15% cover’ rule for KTS. This rule was also the best matching for occupied koala habitat, outperforming the field method by a small margin.
Our study supports the effectiveness of the ‘PCT/SEPP’ method in predicting legal koala habitat in the Hastings–Macleay region. Further testing would be required before the approach can be extended to other regions.
The proposed method introduces a possible means for conducting large-scale assessment of land for legal koala habitat classification. In the future, the use of a standardized and reliable method, such as the one described here, should be considered in biodiversity conservation and land-use planning.
Keywords: acoustic survey, detection dog, FIDEL tables, Koala Habitat Suitability Model (KHSM), legal koala habitat, NSW State Vegetation Type Map (SVTM), Phascolarctos cinereus, plant community type mapping, State Environmental Planning Policy (Biodiversity and Conservation) 2021 (SEPP 2021).
Introduction
Wild koala (Phascolarctos cinereus) populations have suffered historical and ongoing declines throughout much of their range, particularly in New South Wales (NSW), the Australian Capital Territory (ACT) and Queensland (McAlpine et al. 2015; Williams et al. 2023). The principal threats to koala conservation include habitat loss and fragmentation (Melzer et al. 2000; Dargan et al. 2019), which are exacerbated by intense heatwaves, droughts and bushfires as a product of climate change (Reckless et al. 2017; New South Wales. Parliament. Legislative Council 2020). In this scenario, understanding and identifying what constitutes koala habitat is essential for the future conservation of the species. Despite numerous efforts (Lunney et al. 2009; Predavec et al. 2015), achieving a comprehensive and accurate prediction of both the locations of koalas and their habitat remains a challenging task.
As a starting point for defining koala habitat, legislation has traditionally described it in simple terms of standing tree species composition, owing to the highly specialised folivorous diet of koalas, consisting of a range of leaves from Eucalyptus, Angophora and Corymbia species (Lyons et al. 1997; Office of Environment and Heritage 2018). Building on this concept, the NSW Government introduced the State Environmental Planning Policy (Biodiversity and Conservation) 2021 (SEPP 2021) (NSW Government 2021) with the objective of managing and conserving natural vegetation areas for koalas. Chapter 3 and Chapter 4 of this Policy consider (potential) koala habitat to be any area of native vegetation in which 15% or more of the total number of trees are known to be important koala habitat (Schedule 1, Feed tree species; or Schedule 3, Koala Use tree species (KTS)). Although this method may appear straightforward, its practical application on a large scale for identifying potential koala habitat presents considerable challenges, because it is simply not possible to ground-truth all potential habitats.
In recent years, it has been proposed that the SEPP 2021 15% threshold rule can be applied on a large scale by using the NSW state vegetation type map (SVTM) (State Government of New South Wales and Department of Planning and Environment 2022). The SVTM is a regional-scale map that encompasses the three levels of the NSW vegetation classification hierarchy, which includes plant community types (PCTs) at the finest scale (5 m resolution), followed by vegetation classes and vegetation formations (see Keith (2004)). PCTs are mapped based on patterns of co-occurring native plants and their relation to various abiotic factors (e.g. soil, topography, temperature profiles). Each PCT has a comprehensive profile that outlines the likelihood of various floristic species being present (and their median foliage cover). Such information, coupled with a spatially explicit map, could be used to easily identify and delineate areas of potential koala habitat that likely support at least 15% median foliage cover of koala habitat trees on a large scale, referred from now on as the ‘PCT/SEPP’ method.
Attempts to map koala habitat at large scale are not new. For instance, species distribution models (e.g. Law et al. (2017), State Government of NSW and Department of Planning and Environment (2019)) have been applied to identify areas with a higher likelihood of koala occupancy. However, these approaches come with their own set of challenges, including the following:
Species distribution models relying on historical koala records may be susceptible to geographical biases or biases towards specific habitats because of the cryptic nature of koalas and their varying detection probabilities within different habitat types. For this reason, it is important that distribution models attempt to account for this bias (as in (Law et al. 2017)).
Species distribution models, as opposed to vegetation models such as the proposed ‘PCT/SEPP’ method, may, in effect, map the currently realised, rather than fundamental niche (i.e. potential koala habitat). To support population recovery, it is critical to map the fundamental niche rather than just the realised distribution.
Species distribution models do not speak to the legal definition of potential koala habitat:
A previous pilot study in the Mid and Far North Coast NSW (State of NSW and Environment Protection Authority 2016) also sought to compare vegetation types, legal definitions of koala habitat and koala occupancy. Whereas it was proposed that PCTs could be used to determine suitable or unsuitable koala habitat, the study was conducted at a relatively small scale, encompassing only four state forests. Additionally, the study considered a small set of trees known to be important for koalas, whereas Schedule 3 of the SEPP 2021 now contains a significantly wider list of habitat trees (123 tree species divided into nine koala management area). Validating the ‘PCT/SEPP’ methodology at a regional scale, while considering the full spectrum of tree species that koalas rely on for their habitat, is still required.
This study investigated the use of the PCT maps to predict legal koala habitat in the Mid North Coast Region of NSW, an area of regional koala significance. We aimed to
Assess whether the NSW state vegetation type map can be used to accurately predict (potential) koala habitat in the region as defined within Chapter 4 of SEPP 2021, by comparing performance of established methods with on-ground field survey results.
Determine which of the two methods (the ‘PCT/SEPP’ and the ‘field’ method) best predicts contemporary occupied (‘core’) koala habitat (as per SEPP 2021).
Determining effective methods to identify koala habitat at a regional scale is crucial for ensuring that conservation efforts align with the current legal definitions and help guide future conservation to help increase, and protect, populations of wild koalas in NSW.
Materials and methods
Study area
The study area encompassed two local government areas in the Mid North Coast region of New South Wales, namely, the Port Macquarie–Hastings and Kempsey Council local government areas (hereafter referred to as the Hastings–Macleay region). The area, covering approximately 704,502.00 ha, represents a favourable environment for koalas with fertile soil, large areas of connected habitat and a subtropical climate that is likely to be a climate refuge for koalas (Adams-Hosking et al. 2011). The Hastings–Macleay region supports four of the State’s 19 populations for immediate investment as outlined under the NSW Koala Strategy (NSW Government 2022), making it an important region for koala conservation.
To select our study sites, we first explored the PCTs present in the Hastings–Macleay region by using the SVTM (ver. ‘C1.1.M1.1’, see https://datasets.seed.nsw.gov.au/dataset/nsw-state-vegetation-type-map; accessed 6 June 2023). In total, 165 PCTs were identified across the region. However, we focused only on those PCTs that were present in lands where the SEPP 2021 legislation applies (i.e. lands other than National Parks or State Forests). This left us with 151 PCTs to be included in the assessment of their potential as koala habitat.
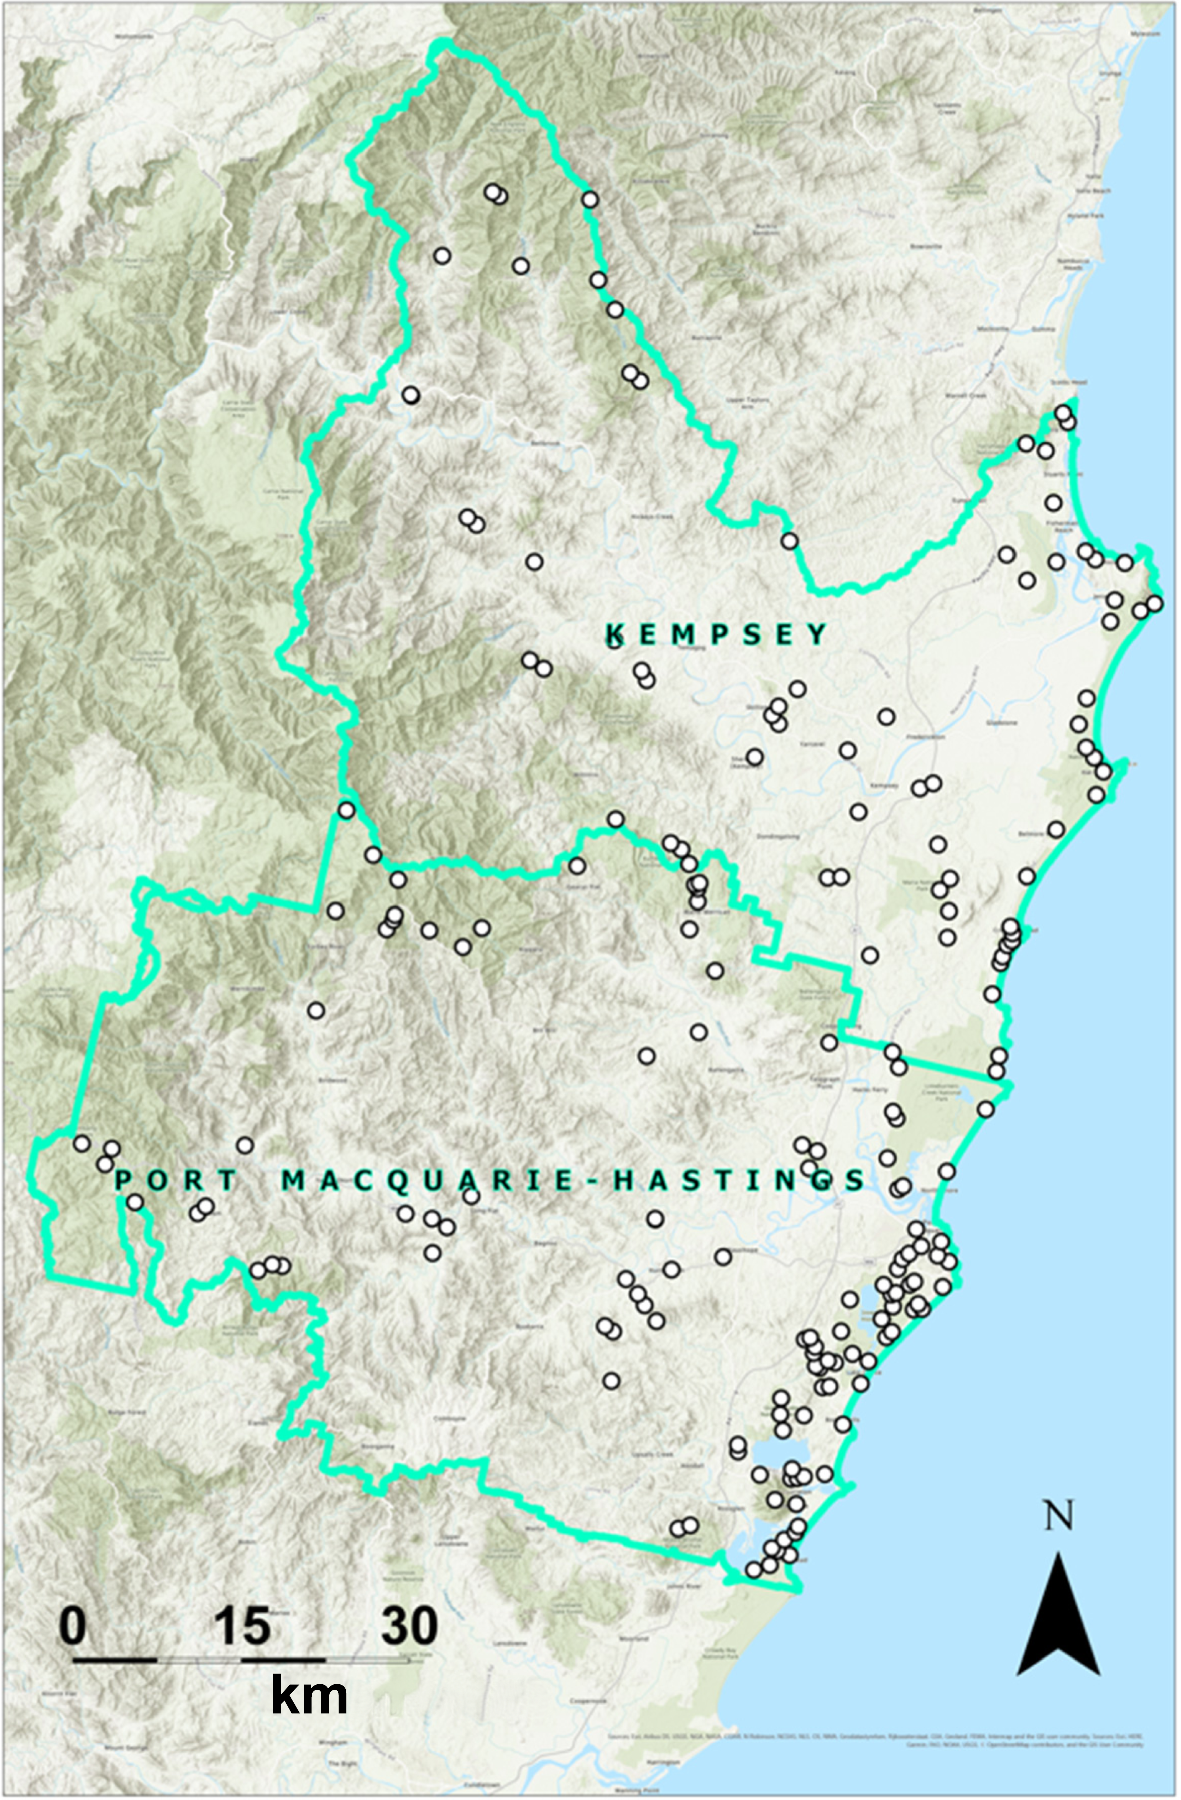
Next, we allocated 195 survey sites across the region (Fig. 1), all on public land, to facilitate access. To obtain a representative sample, we included both the most and least common PCTs in the study area, with replicate numbers ranging from 12 for the most common to one for the rarest PCTs. This approach helped avoid biasing our results towards those PCTs that covered larger areas, because small areas of relevant koala trees can be important for the species. Owing to access constraints, representation of PCTs in public land and limited sampling capacity, not all PCTs were surveyed; the 195 sites ultimately covered 49 of the 151 targeted PCTs. Site placement combined random selection with practical considerations of accessibility. The 195 sites spanned the coastal environment through the coastal midlands, hinterland, and escarpment country of the Hastings–Macleay region.
Assess whether the NSW state vegetation type map can be used to accurately predict (potential) koala habitat in the region as defined within Chapter 4 of SEPP 2021
To produce the ‘PCT/SEPP’ methodology, we considered the 15% threshold rule from Chapter 3, with the list of KTS described in Chapter 4 of the SEPP 2021. Then, we followed two steps.
We first accessed the FIDEL tables available in the BioNet vegetation classification website (https://www.environment.nsw.gov.au/NSWVCA20PRapp/default.aspx). These tables contain a list of the associated flora for each PCT, their frequency, i.e. the proportion of replicates in which the species was present for a particular PCT, and median foliage cover, i.e. median 1–6 Braun Blanquet cover-abundance scale (Poore 1955). Using the frequency, we determined the individual KTS (Schedule 3, SEPP 2021) that were ‘consistently’ present in each PCT with a frequency of ≥80%, ≥70%, ≥50% or ≥15%. While these rules are not part of the SEPP 2021, they allow us to understand how frequently different koala habitat trees occur among locations, considering the inherent natural variation in PCT compositions. Thus, even if the median cover of KTS in a PCT is high, it is not relevant unless those trees occur in many of the plots within the PCT. Next, after adding the median foliage cover for those individual KTS consistently present, we determined whether the combined cover was of 15% or more (as per Chapter 3 of the SEPP 2021). To calculate percentages from the cover score, we transformed the Braun–Blanquet scores to cover levels as follows: 1 = 3%, 2 = 5%, 3 = 15%, 4 = 37.5%, 5 = 62.5%, and 6 = 87.5%. The SEPP 2021 uses count of trees, but this information is not available within the FIDEL tables. However, using cover rather than counts of trees is more ecologically meaningful in interpreting the occurrence, extent, and density of likely koala habitat. For example, at the plot scale, one or two koala feed trees with large spreading canopies may provide sufficient resources to sustain koalas, but from a relative count perspective within a plot, this might be below the 15% threshold required to trigger the definition of koala habitat.
A botanist visited all 195 sites and used a 20 × 20 m plot (located in an area that was most representative of the surrounding vegetation) to perform a vegetation assessment. The botanist validated the PCT and recorded the presence and frequency of KTS. Using the data collected, we classified sites as koala habitat by using the 15% SEPP 2021 rule (from now on referred as the ‘field’ method). Next, we compared the performance of the ‘PCT/SEPP’ and ‘field’ methods by considering the number of true positives (TP, i.e. sites classified as koala habitat by both the ‘PCT/SEPP’ and the ‘field’ method), false positives (FP, i.e. sites classified as koala habitat by the ‘PCT/SEPP’ method but not the ‘field’ method), true negatives (TN, i.e. sites not classified as koala habitat by either method), and false negatives (FN, i.e. sites not classified as koala habitat by the ‘PCT/SEPP’ method, but which, in fact, were found to be koala habitat according to the ‘field’ method). For each rule, we also calculated accuracy (the overall proportion of correct predictions), sensitivity (the proportion of actual positives correctly identified), and the F1 score (a metric suited for imbalanced classes that balances FP and FN to estimate overall model performance). Sensitivity is particularly important in this context, because failing to identify koala habitat can have significant ecological and regulatory consequences. The F1 score helps account for potential imbalance in our data, given the larger number of koala habitat sites than non-habitat sites.
Determine which of the two methods (the ‘PCT/SEPP’ and the ‘field’ method) best predicts contemporary occupied (‘core’) koala habitat (as per SEPP 2021)
‘Core koala habitat’ is defined in Chapter 4 of the SEPP as being land that has highly suitable koala habitat and koalas having been recorded as present within the past 18 years. When considering methods that identify koala habitat, it is therefore important to also consider koala occurrence. To enable this, we followed two steps.
Contemporary koala occurrence was assessed using koala detection dogs in 56 sites, passive acoustic recorders in 31 sites, and both methods in another 90 sites. Detection dogs are trained to find koala scats by using their strong sense of smell (Cristescu et al. 2020), whereas acoustic recorders are analysed for the presence of male koala calls (Law et al. 2022a). At each site, the detection dog surveyed a 200 × 50 m fixed transect (1 ha search area), keeping a consistent pace across sites, between September and December 2020. Survey at each site finished after finding the first koala scat or after completing the transect if no scats were found (~40 min). Detection dog survey was constrained by site accessibility for both the dog and the handler. Acoustic recorders (Audio Moths) were set at ~1 m from the ground in a tree in the centre of the site and recorded for seven nights, from dusk till dawn (12 h daily), between October and December 2020. The acoustic survey was constrained by the number of units, which were distributed to include different vegetation types across the region. The initial analysis of acoustic data was conducted by the NSW Department of Primary Industries by using a convolutional neural network recogniser, Koala_CNN_LG_010822, integrated into the AVIANZ platform (ver. 3.1, http://www.avianz.net). This recogniser, developed and described in Law et al. (2018) and Law et al. (2022a), was trained on over 2700 male koala bellows and evaluated for accuracy across varied acoustic conditions (Department of Primary Industries (DPI) 2022)). Calls identified by the algorithm were then validated by an expert. Naïve occupancy was exclusively derived from the acoustic data to be consistent with the data collected by the detection dogs; calculation of the probability of detection for detection dog survey was not feasible because the survey was conducted only in 1 day.
For the 18 sites that were not surveyed, and those sites where koalas were not detected by dogs or acoustic recorders, we collated information on koala records in BioNet Atlas (https://www.environment.nsw.gov.au/atlaspublicapp/UI_Modules/ATLAS_/AtlasSearch.aspx). We looked for any record in the previous 18 years within a radius of 2.5 km from the centre of the site, as indicated in Chapter 4 of the SEPP 2021.
Using the koala occurrence calculated in the previous step, we considered the number of TP (i.e. sites classified as koala habitat in which a koala occurrence is recorded), FP (i.e. sites classified as koala habitat in which a koala occurrence is not recorded), TN (i.e. sites not classified as koala habitat in which a koala occurrence was not recorded) and FN (i.e. sites not classified as koala habitat in which a koala occurrence is recorded), for both the ‘PCT/SEPP’ and ‘field’ methods to determine which had the best performance in identifying core koala habitat. We also calculated accuracy, sensitivity, and the F1 score for each rule/method. Finally, we examined koala occurrence at a site by simply using the one-off survey effort (i.e. excluding BioNet records).
Animal ethics
All work was undertaken with appropriate licences and approvals. Long-term monitoring of koalas in the Hastings-Macleay area of regional koala significance scientific licence number: SL102403 (valid 23 April 2020–06 June 2023). This class of biodiversity conservation licence granted under Part 2 of the Biodiversity Conservation Act 2016 authorises the following activities: Conduct research on NPWS estate (including survey koalas and use detector dogs). Monitoring agreement with DPIE for animal ethics.
Results
Assess whether the NSW state vegetation type map can be used to accurately predict (potential) koala habitat in the region as defined within Chapter 4 of SEPP 2021
By using the frequency of KTS from the FIDEL tables for each PCT, we found different results depending on the rule applied for the ‘PCT/SEPP’ method (Table 1). The ≥15% frequency/15% cover rule showed the largest percentage of sites classified as koala habitat, equalling the value of the ‘field’ method.
| Method | Sites classified as koala habitat (%) | ||
|---|---|---|---|
| ‘PCT/SEPP’ method | ≥80% frequency/≥15% cover | 55 (i.e. 107 of 195 sites) | |
| ≥70% frequency/≥15% cover | 74 | ||
| ≥50% frequency/≥15% cover | 87 | ||
| ≥15% frequency/≥15% cover | 94 | ||
| ‘Field’ method | 94 | ||
When comparing in detail the ‘PCT/SEPP’ results to the ‘field’ method results for each site, we found that the ≥15% frequency/≥15% cover rule was the most similar to the ‘field’ results, with only a 9% mismatch (i.e. combined FP and FN results), compared with the 15% mismatch of the second-most similar rule (Table 2). The predictive performance metrics also support the ≥15% frequency/≥15% cover rule as the most accurate for predicting PCT/SEPP classifications.
| ‘PCT/SEPP’ method | Potential koala habitat, TP (%) | Non-koala habitat, TN (%) | FP (%) | FN (%) | Accuracy | Sensitivity | F1 score | |
|---|---|---|---|---|---|---|---|---|
| ≥80% frequency/15% cover | 52 | 3 | 3 | 42 | 0.55 | 0.55 | 0.70 | |
| ≥70% frequency/≥15% cover | 71 | 3 | 3 | 23 | 0.74 | 0.75 | 0.84 | |
| ≥50% frequency/≥15% cover | 83 | 2 | 4 | 11 | 0.85 | 0.89 | 0.92 | |
| ≥15% frequency/≥15% cover | 90 | 1 | 5 | 4 | 0.91 | 0.96 | 0.95 |
Determine which of the two methods (the ‘PCT/SEPP’ and the ‘field’ method) best predicts contemporary occupied (‘core’) koala habitat (as per SEPP 2021)
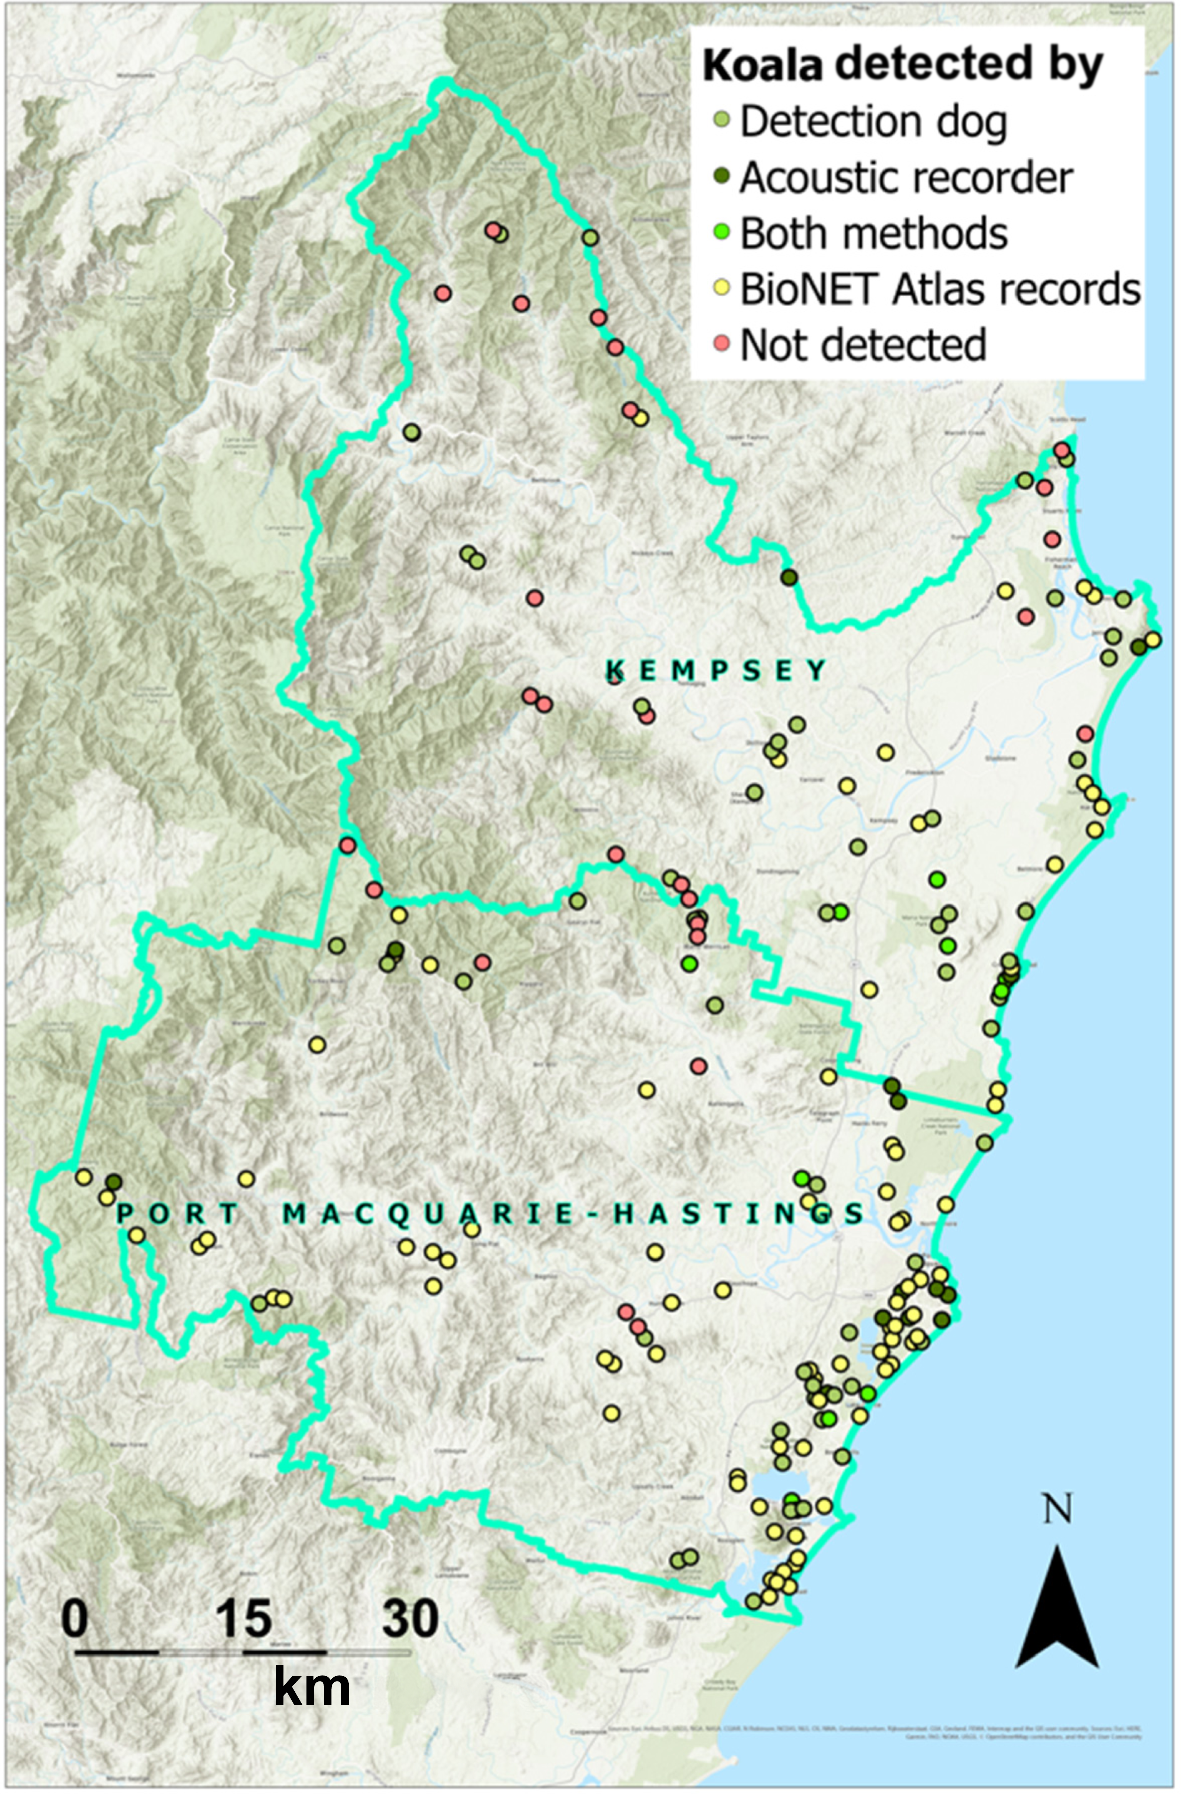
Koala occurrence was high (detected in 168 of 195 sites), with koalas being found by detection dogs in 59 sites, by acoustic recorders in 14 sites and by both in 10 sites. BioNet koala records were found in 85 sites where no koalas were detected by our surveys (interestingly, koalas were detected in our surveys on 18 sites with no previous koala records in BioNet). Koalas were broadly distributed across the Hastings–Macleay region (Fig. 2). All but three PCTs (of 49) showed some level of koala occupancy.
When comparing the ‘PCT/SEPP’ and ‘field’ results to the koala occurrence for each site, we found that the ≥15% frequency/≥15% cover rule was the best, being even slightly more accurate than the ‘field’ method (Table 3). Differences in sensitivity between these two are particularly important, with the ≥15% frequency/≥15% cover rule achieving a higher sensitivity (0.95) than the ‘field’ method (0.93). This suggests that our method is less likely to miss koala habitats.
| Method | Core koala habitat, TP (%) | Non-koala habitat, TN (%) | FP (%) | FN (%) | Accuracy | Sensitivity | F1 score | ||
|---|---|---|---|---|---|---|---|---|---|
| PCT/SEPP Method | ≥80% frequency/≥15% cover | 48 | 7 | 7 | 38 | 0.55 | 0.56 | 0.68 | |
| ≥70% frequency/≥15% cover | 64 | 4 | 10 | 22 | 0.68 | 0.74 | 0.80 | ||
| ≥50% frequency/≥15% cover | 75 | 2 | 12 | 11 | 0.77 | 0.87 | 0.87 | ||
| ≥15% frequency/≥15% cover | 82 | 2 | 12 | 4 | 0.84 | 0.95 | 0.91 | ||
| ‘Field’ method | 80 | 0 | 14 | 6 | 0.80 | 0.93 | 0.89 | ||
When examining the koala occurrence by simply using the one-off survey effort (i.e. excluding BioNet records), results from the ≥15% frequency/≥15% cover rule and the ‘field’ method were the same (Table 4). Furthermore, both methods showed a large decrease in true positive, and the respective increase in false positive cases.
| Method | Core koala habitat, TP (%) | Non-koala habitat, TN (%) | FP (%) | FN (%) | ||
|---|---|---|---|---|---|---|
| PCT/SEPP zmethod | ≥15% frequency/≥15% cover | 44 | 3 | 50 | 3 | |
| ‘Field’ method | 44 | 3 | 50 | 3 | ||
Discussion
We found a broad distribution of koalas in the Hastings–Macleay region, with koalas occurring in 86.15% of the 195 sites (on the basis of surveys and Bionet koala records). These results are consistent with previous studies using acoustic surveys over a larger area in north-eastern New South Wales (Law et al. 2022a; 2018). Our findings highlight the relevance of the Hastings–Macleay region as an area of regional koala significance and makes the correct identification of koala habitat an essential requirement for future koala conservation in the region.
Assess whether the NSW state vegetation type map can be used to accurately predict (potential) koala habitat in the region, as defined within Chapter 4 of SEPP 2021
We found that results from the ‘PCT/SEPP’ method varied depending on the frequency rule used. The 15% frequency/15% cover rule was the one that best matched the ‘field’ method results. Furthermore, this rule was also the one showing the lowest values for false negative classifications (highest sensitivity). Identifying an area as non-koala habitat when it indeed supports koalas is concerning (much more than misclassifying a non-koala habitat), because it risks leaving important areas unprotected. Therefore, an approach that minimises this error is especially important.
Determine which of the two methods (the ‘PCT/SEPP’ and the ‘field’ method) best predicts contemporary occupied (‘core’) koala habitat (as per SEPP 2021)
The 15% frequency/15% cover rule again yielded the best performance in identifying contemporary occupied (‘core’) koala habitat, performing even slightly better than did the ‘field’ method. This may reflect variability inherent in on-ground surveys; even when the botanists selected representative patches, there are limitations to what they can consider. For that reason, the chosen plot may under-represent the broader habitat capacity of the area, which does not happen when using averages from PCTs. Conversely, it is important to highlight that the survey methods used have imperfect detection and were conducted only over a short period of time (Callaghan et al. 2011; Phillips and Callaghan 2011; Woosnam-Merchez et al. 2012; Law et al. 2022b). So, it is possible that the sites classified as ‘false positive’ (i.e. identified as koala habitat, but with no koalas detected) are occupied, even if transiently as part of a larger home range over the course of a year. This would also be the case for ‘true negative’ (non-koala habitat). Indeed, the real need for the inclusion of recent historical records about koala presence when assessing koala habitat (as opposed to one-off surveys) is shown empirically in the contrast of false positive rates between Tables 3 and 4 (the latter of which did not include BioNet recent historical records).
Overall, these findings would support the use of the 15% frequency/15% cover ‘PCT/SEPP’ method as a tool to predict legal koala habitat, suggesting that landscape-scale decisions based on mapping products can be as accurate as (or even more accurate than) site surveys at correctly identifying koala habitat. Site-scale assessments could be subject to local scale biases, such as plot placement, which PCT mapping is free of. Furthermore, PCTs incorporate both floristic composition and abiotic factors (Keith 2004), such as soil and moisture availability, meaning that the same tree species may occur in different PCTs under different environmental contexts. This environmental context can influence the quality of the trees (Wu et al. 2012), suggesting that PCTs may capture differences in tree quality within the same species, further strengthening their value for koala habitat assessment.
One potential limitation of the method is the accuracy and completeness of the KTS listed in the SEPP. Even though the list is extensive, it is based largely on areas where koalas have been well studied (Predavec et al. 2015). In regions with less research, important tree species, and their relative importance, may be under-represented or missing entirely, affecting habitat assessments (Crowther et al. 2014; Gallahar et al. 2021; Taggart et al. 2024). In this context, it would be particularly valuable to further investigate sites where our method produced FN (i.e. where koalas were detected in areas not classified as koala habitat), because this may show whether there are species missing from the SEPP list or suggest that koalas can use some habitat where key species of high quality occur at less than 15% frequency or cover.
Conclusions
The results and data obtained from this study support the use of ‘PCT/SEPP’ methodology to identify koala habitat in the Hastings–Macleay region. The method benefits from both the fine spatial resolution of the vegetation mapping used, an important consideration when intending to capture koala ecological processes (Mitchell et al. 2021), and the reduction in ‘error’ achieved through the use of average values in PCTs, with both factors having significant implications for meeting legislative requirements. Furthermore, in the current context of climate change, particularly given the negative effects of severe fire on koala occurrence in the region (Orlando et al. 2024), the ability to identify and protect potential koala habitat is essential to aid population persistence.
Whereas the approach outlined here can be applied to other regions, it would be sensible to test and select different rules depending on koala density. The NSW Department of Climate Change, Energy, the Environment and Water (DCCEEW) continuously refine PCT mappings, aiming to improve the quality and alignment of the vegetation classification (Department of Climate Change, Energy, the Environment and Water (DCCEEW) 2024). However, one of the challenges associated with the use of PCTs in other regions might be the variability in its spatial accuracy, with some areas showing a high number of misclassifications (Hunter 2016; Department of Climate Change, Energy, the Environment and Water (DCCEEW) 2024). Nevertheless, for the purposes of mapping legal koala habitat, only the canopy trees need to be accurately measured. Given that these are often more reliably identified than are understorey species, our methodology should hold even in regions where PCT mapping might not be as accurate. This may require further validation, such as ground-truthing by a botanist to confirm PCT accuracy, as was undertaken in this study, and recommended by Mitchell et al. (2021), before applying our methods.
Our method is directly applicable to scenarios involving land development or use, where koala habitat needs to be assessed. Since completion of this initial study, this method has been advanced to be successfully used for local council koala habitat mapping as part of funding provided to councils under the NSW Koala Strategy.
Data availability
The data that support this study will be shared upon reasonable request to the corresponding author.
Declaration of funding
Funding supplied by Kempsey Shire Council, Port Macquarie–Hastings Council, Koala Conservation Australia, and the NSW Koala Strategy (ver. 1).
Acknowledgements
We acknowledge the Dunghutti and Birpai Peoples as the Traditional Custodians of the land on which this study took place. Thanks go to the NSW Department of Climate Change, Energy, the Environment and Water for providing the latest maps on plant community types. We also thank NSW National Parks and Wildlife Service, Forestry Corporation, Local Land Services, Port Macquarie–Hastings Council and Kempsey Shire Councils for assisting us in getting access to the study sites and to the Mid North Coast Joint Organisation for hosting the Hastings–Macleay Koala Recovery Partnership while the field component of this study was being conducted. Mark Fisher, Craig Harare, Tate Animals and Canines for Wildlife were instrumental in undertaking the field work. The Department of Primary Industries (NSW) for helping us analyse the acoustic data.
References
Adams-Hosking C, Grantham HS, Rhodes JR, McAlpine C, Moss PT (2011) Modelling climate-change-induced shifts in the distribution of the koala. Wildlife Research 38(2), 122-130.
| Crossref | Google Scholar |
Callaghan J, McAlpine C, Mitchell D, Thompson J, Bowen M, Rhodes J, De Jong C, Domalewski R, Scott A (2011) Ranking and mapping koala habitat quality for conservation planning on the basis of indirect evidence of tree-species use: a case study of Noosa Shire, south-eastern Queensland. Wildlife Research 38(2), 89-102.
| Crossref | Google Scholar |
Cristescu RH, Miller RL, Frère CH (2020) Sniffing out solutions to enhance conservation: how detection dogs can maximise research and management outcomes, through the example of koalas. Australian Zoologist 40(3), 416-432.
| Crossref | Google Scholar |
Crowther MS, Lunney D, Lemon J, Stalenberg E, Wheeler R, Madani G, Ross KA, Ellis M (2014) Climate-mediated habitat selection in an arboreal folivore. Ecography 37, 336-343.
| Crossref | Google Scholar |
Dargan JR, Moriyama M, Mella VSA, Lunney D, Crowther MS (2019) The challenge for koala conservation on private land: koala habitat use varies with season on a fragmented rural landscape. Animal Conservation 22(6), 543-555.
| Crossref | Google Scholar |
Department of Primary Industries (DPI) (2022) Metadata for Koala Recogniser Koala_CNN_LG_010822. Available at https://www.dpi.nsw.gov.au/forestry/science/forest-ecology/fauna-identification-service/metadata-information-for-koala
Gallahar N, Leigh K, Phalen D (2021) Koala tree selection in a mixed-tenure landscape and post-fire implications. Wildlife Research 48(8), 737-755.
| Crossref | Google Scholar |
Hunter JT (2016) Validation of the Greater Hunter native vegetation mapping as it pertains to the Upper Hunter region of New South Wales. Ecological Management & Restoration 17(1), 40-46.
| Crossref | Google Scholar |
Law B, Caccamo G, Roe P, Truskinger A, Brassil T, Gonsalves L, McConville A, Stanton M (2017) Development and field validation of a regional, management-scale habitat model: a koala Phascolarctos cinereus case study. Ecology and Evolution 7(18), 7475-7489.
| Crossref | Google Scholar | PubMed |
Law BS, Brassil T, Gonsalves L, Roe P, Truskinger A, McConville A (2018) Passive acoustics and sound recognition provide new insights on status and resilience of an iconic endangered marsupial (koala Phascolarctos cinereus) to timber harvesting. PLoS ONE 13(10), e0205075.
| Crossref | Google Scholar | PubMed |
Law B, Kerr I, Gonsalves L, Brassil T, Eichinski P, Truskinger A, Roe P (2022a) Mini-acoustic sensors reveal occupancy and threats to koalas Phascolarctos cinereus in private native forests. Journal of Applied Ecology 59(3), 835-846.
| Crossref | Google Scholar |
Law B, Gonsalves L, Burgar J, Brassil T, Kerr I, Wilmott L, Madden K, Smith M, Mella V, Crowther M, Krockenberger M, Rus A, Pietsch R, Truskinger A, Eichinski P, Roe P (2022b) Estimating and validating koala Phascolarctos cinereus density estimates from acoustic arrays using spatial count modelling. Wildlife Research 49(5), 438-448.
| Crossref | Google Scholar |
Lunney D, Crowther MS, Shannon I, Bryant JV (2009) Combining a map-based public survey with an estimation of site occupancy to determine the recent and changing distribution of the koala in New South Wales. Wildlife Research 36(3), 262-273.
| Crossref | Google Scholar |
McAlpine C, Lunney D, Melzer A, Menkhorst P, Phillips S, Phalen D, Ellis W, Foley W, Baxter G, De Villiers D, Kavanagh R, Adams-Hosking C, Todd C, Whisson D, Molsher R, Walter M, Lawler I, Close R (2015) Conserving koalas: a review of the contrasting regional trends, outlooks and policy challenges. Biological Conservation 192, 226-236.
| Crossref | Google Scholar |
Melzer A, Carrick F, Menkhorst P, Lunney D, John BS (2000) Overview, critical assessment, and conservation implications of koala distribution and abundance. Conservation Biology 14(3), 619-628.
| Crossref | Google Scholar |
Mitchell DL, Soto-Berelov M, Langford WT, Jones SD (2021) Factors confounding koala habitat mapping at multiple decision-making scales. Ecological Management & Restoration 22(2), 171-182.
| Crossref | Google Scholar |
Orlando CG, Montague-Drake R, Turbill J, Crowther MS (2024) Megafires and koala occurrence: a comparative analysis of field data and satellite imagery. Australian Mammalogy 46, AM23054.
| Crossref | Google Scholar |
Phillips S, Callaghan J (2011) The spot assessment technique: a tool for determining localised levels of habitat use by koalas Phascolarctos cinereus. Australian Zoologist 35(3), 774-780.
| Crossref | Google Scholar |
Poore MED (1955) The use of phytosociological methods in ecological investigations: I. The Braun-Blanquet system. The Journal of Ecology 43(1), 226-244.
| Crossref | Google Scholar |
Predavec M, Lunney D, Shannon I, Scotts D, Turbill J, Faulkner B (2015) Mapping the likelihood of koalas across New South Wales for use in private native forestry: developing a simple, species distribution model that deals with opportunistic data. Australian Mammalogy 37(2), 182-193.
| Crossref | Google Scholar |
Reckless HJ, Murray M, Crowther MS (2017) A review of climatic change as a determinant of the viability of koala populations. Wildlife Research 44(7), 458-470.
| Crossref | Google Scholar |
Taggart PL, Sloggett BK, Madani G, Phalen D, Cullen D, Madden K, Wilmott L (2024) Diurnal and nocturnal tree species selection by koalas demonstrates individual preferences in a peri-urban landscape. Australian Mammalogy 46, AM23022.
| Crossref | Google Scholar |
Williams BA, Morgans C, Rhodes JR (2023) Beyond protected areas for koala conservation. Science 379(6638), 1197.
| Crossref | Google Scholar | PubMed |
Woosnam-Merchez O, Cristescu R, Dique D, Ellis B, Beeton RJS, Simmonds J, Carrick F (2012) What faecal pellet surveys can and can’t reveal about the ecology of koalas Phascolarctos cinereus. Australian Zoologist 36(2), 192-200.
| Crossref | Google Scholar |
Wu H, McAlpine C, Seabrook L (2012) The dietary preferences of koalas, Phascolarctos cinereus, in southwest Queensland. Australian Zoologist 36(1), 93-102.
| Crossref | Google Scholar |